62
| Date post: | 13-Apr-2017 |
| Category: |
Documents |
| Upload: | richard-froeschle |
| View: | 247 times |
| Download: | 3 times |

Where the Jobs Are: How they’re Changing and Why Skills Matter!
Economics:

Where the Jobs Are: How they’re Changing and Why Skills Matter!
Why Should I Care About Labor Market Data?
Labor market data
General Macroeconomic Conditions: U.S. & Foreign
Growing & Declining Industries & Sectors
Industry Staffing and Occupational Demand
Real time Job Postings by Occupation & Geography
Technology Changes and New Business Practices
Education & Training Labor Supply Data: Grads/Earnings
Is there overall economic, job and income growth?
Growing industries most likely to hire, or pay more
Growth industries need skills related to their business
What’s HOT now? Where is the job demand? Wages?
Technology affects hiring requirements & skills needs
Which education programs offer best job & earnings prospects?
Why should I care?

Where the Jobs Are: How they’re Changing and Why Skills Matter!
Where the Jobs Are: How they’re Changing and Why Skills Matter!
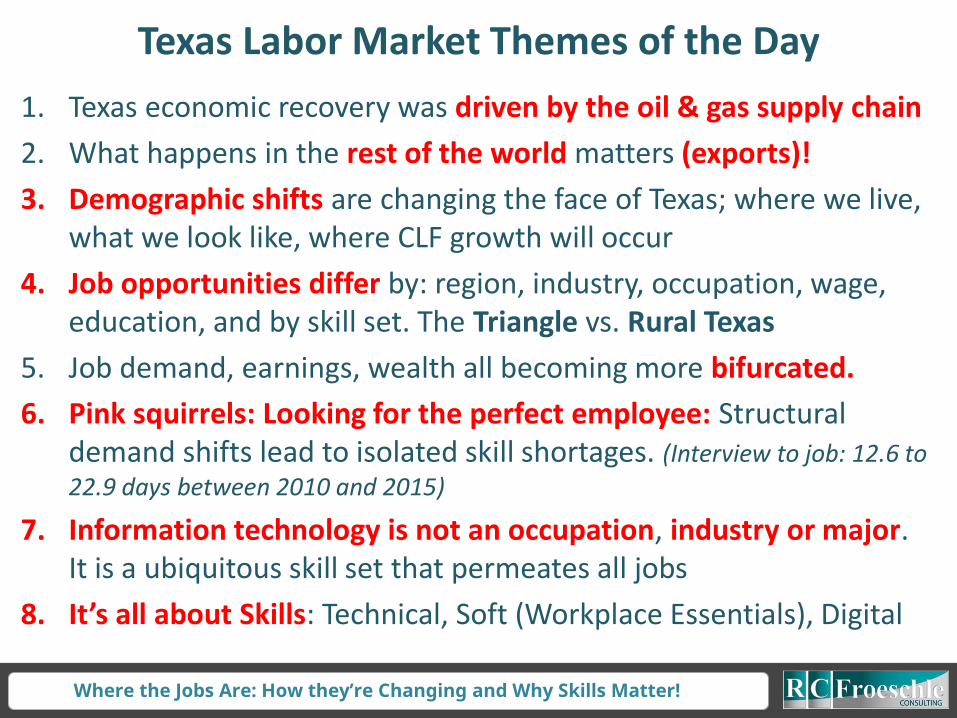
1. Texas economic recovery was driven by the oil & gas supply chain
2. What happens in the rest of the world matters (exports)!
3. Demographic shifts are changing the face of Texas; where we live, what we look like, where CLF growth will occur
4. Job opportunities differ by: region, industry, occupation, wage, education, and by skill set. The Triangle vs. Rural Texas
5. Job demand, earnings, wealth all becoming more bifurcated.
6. Pink squirrels: Looking for the perfect employee: Structural demand shifts lead to isolated skill shortages. (Interview to job: 12.6 to
22.9 days between 2010 and 2015)
7. Information technology is not an occupation, industry or major. It is a ubiquitous skill set that permeates all jobs
8. It’s all about Skills: Technical, Soft (Workplace Essentials), Digital
Texas Labor Market Themes of the Day

Where the Jobs Are: How they’re Changing and Why Skills Matter!
Texas Job Growth Supported by 4 Major Economic Tent Poles
Texas post recession job growth has been largely fueled by:
1. Exports & Globalization2. Population Growth3. Oil & Gas Cluster 4. Professional & Business Services

Where the Jobs Are: How they’re Changing and Why Skills Matter!
Monitoring the Growth of China (billions $$$)
2000 2008 2014U.S. $10,285 U.S. $14,719 U.S. $17,419
Japan $4,731 Japan $4,849 China $10,360
Germany $1,947 China $4,558 Japan $4,601UK $1,549 Germany $3,747 Germany $3,853France $1,368 France $2,923 UK $2,942
China $1,205 UK $2,792 France $2,829Italy $1,142 Italy $2,392 Brazil $2,346Canada $739 Brazil $1,695 Italy $2,144Mexico $684 Russian Fed. $1,661 India $2,067Brazil $657 Spain $1,635 Russian Fed. $1,861Spain $595 Canada $1,543 Canada $1,787Korea, Rep. $562 India $1,224 Australia $1,454India $477 Mexico $1,101 Korea, Rep. $1,410Australia $415 Australia $1,055 Spain $1,4047

Where the Jobs Are: How they’re Changing and Why Skills Matter!
(billions $$$) 2000 2014 ABS CHG PER CHG
China $1,205 $10,360 $9,155 759.6%
United States $10,285 $17,419 $7,134 69.4%
Germany $1,947 $3,853 $1,905 97.9%
Brazil $657 $2,346 $1,689 257.0%
Russian Federation $260 $1,861 $1,601 616.4%
India $477 $2,067 $1,590 333.7%
France $1,368 $2,829 $1,461 106.7%United Kingdom $1,549 $2,942 $1,393 90.0%
Canada $739 $1,787 $1,047 141.6%
Australia $415 $1,454 $1,039 250.3%
Italy $1,142 $2,144 $1,002 87.7%
Korea, Rep. $562 $1,410 $849 151.1%
Spain $595 $1,404 $809 135.9%
Why Do We Care About China?

Where the Jobs Are: How they’re Changing and Why Skills Matter!
National Job Recovery: At Pre-recession Hiring Levels
New Hires
Separations

Where the Jobs Are: How they’re Changing and Why Skills Matter!
Emerging Uncertainty: Quits vs. Layoffs
Quits
Layoffs
Where the Jobs Are: How they’re Changing and Why Skills Matter!
Dallas
Howard
FoardFloyd
Brewster
FranklinHunt
Newton
Starr
Kinney
Collingsworth
Tom
Green
Coleman
Brazoria
Leon
Duval
Lamb
Morris
Smith
Jackson
Medina
Wheeler
Dallam
Callahan
Lamar
Coryell
Gaines
Kendall
Nacogdoches
Milam
Hays
Willacy
Johnson
Reagan
Webb
Shackelford
Bowie
Scurry
Kenedy
Somervell
Oldham
Taylor
King
Borden
Walker
Stephens
Deaf
Smith
Roberts
Tyler
Val
Verde
Brown
Parker
Harris
Zapata
Red
River
Karnes
Palo
Pinto
GlasscockShelby
Wood
Crosby
Refugio
Burnet
Sterling
Montgomery
San
Augustine
Rains
Nueces
Jack
Swisher
Camp
Brazos
Orange
Colorado
Pecos
Cochran
Parmer
FreestoneWinkler
Wichita
Gray
Schleicher
Hardeman
TravisGillespie
Yoakum
Fayette
Uvalde
Grimes
Van
Zandt
Throckmorton
Falls
Grayson
Ellis
Hall
Dickens
Trinity
Reeves
Marion
Terrell
Lynn
La Salle
Jasper
Jones
Castro
Victoria
Kleberg
Briscoe
Clay
Matagorda
Brooks
Runnels
Carson
Liberty
Lee
Hale
Bexar
Garza
Montague
Upton
Hamilton
FisherDawson
Dimmit
Limestone
Hutchinson
Llano
Presidio
Eastland
Sabine
Wharton
Rusk
Tarrant
Lavaca
Childress
Hidalgo
Kaufman
Moore
Menard
Edwards
San
Patricio
Terry
Crockett
Houston
Waller
Coke
Ward
Titus
Lampasas
Haskell
Martin
Atascosa
Hemphill
Hartley
Young
BurlesonHardin
Gonzales
McMullen
Erath
Galveston
McLennan
Madison
McCulloch
Donley
Kent
Real
Sutton
Midland
Hudspeth
Zavala
Harrison
Comanche
MitchellNavarro
Crane
Lubbock
Wise
Washington
Jeff
Davis
El Paso
Gregg
Williamson
Lipscomb
Mason
Henderson
Hansford
Chambers
Hill
Potter
Jim
Wells
DeltaStonewall
Ector
Cameron
Maverick
Collin
Baylor
Panola
Guadalupe
Bastrop
Austin
Andrews
Anderson
Blanco
DeWitt
Bandera
Bell
Aransas
Archer
Armstrong
Bee
Bailey
Jefferson
Frio
Fannin
Goliad
Loving
Cass
Fort
Bend
Bosque
Hockley
San
Saba
Kerr
Mills
Cooke
Wilbarger
Irion
Caldwell
Jim
Hogg
Culberson
Upshur
Cherokee
Denton
Concho
Randall
Kimble
Knox
Polk
Hood
San
Jacinto
Robertson
Wilson
Nolan
Cottle
Calhoun
Rockwall
Live
Oak
Motley
Sherman Ochiltree
Comal
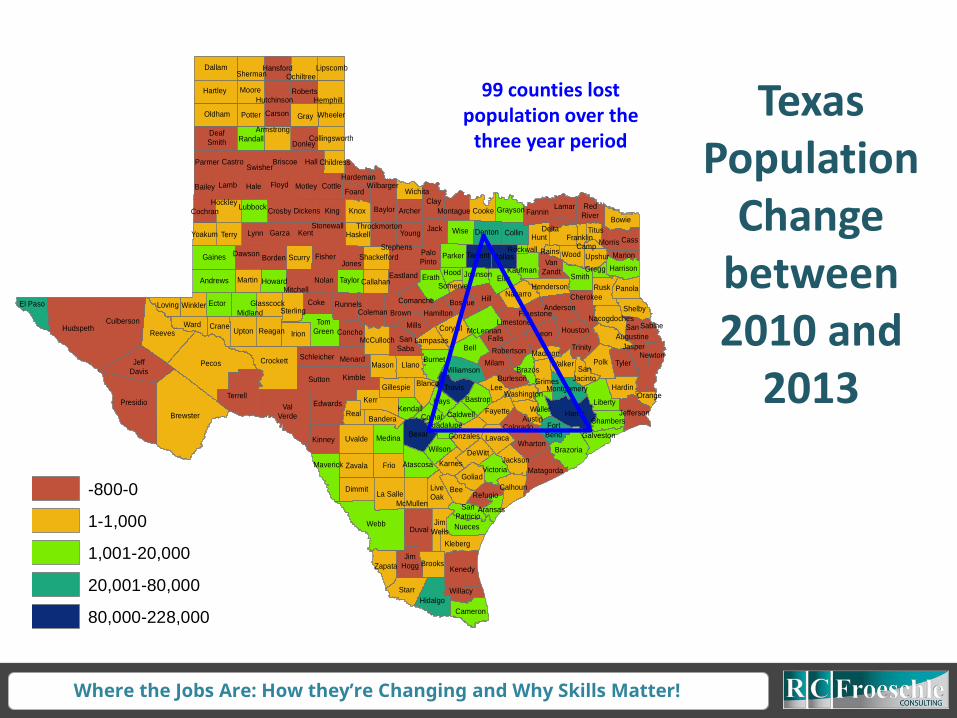
99 counties lost population over the
three year period
Texas Population
Change between 2010 and
2013Legend
tl_2010_48_county10_dpsf
Nch1013
-800-0
1-1,000
1,001-20,000
20,001-80,000
80,000-228,000
tl_2010_48_county10_dpsf
Pctch1013
-0.106707 - 0.000000
0.000001 - 0.025000
0.025001 - 0.050000
0.050001 - 0.100000
0.100001 - 0.146341
tl_2010_48_county10_dpsf
POPESTIMATE2013
95-,10,000
10,001-50,000
50,001-100,000
100,000-500,000
500,001-1,000,000
1,000,001-4,400,000

Where the Jobs Are: How they’re Changing and Why Skills Matter!
County (Big City) Change
1. Harris (Houston) 332,461
2. Dallas (Dallas) 145,278
3. Bexar (San Antonio) 132,831
4. Tarrant (Ft. Worth) 128,576
5. Travis (Austin) 120,702
6. Collin (Plano) 96,673
7. Fort Bend (Sugarland) 94,726
8. Denton (Denton) 86,425
9. Williamson (Round Rock) 62,709
10. Montgomery(Woodlands) 59,526
11. Hidalgo (McAllen) 51,879
Texas Counties Population Absolute Growth 2010-14
County (Big City) Change
12. El Paso (El Paso) 29,860
13. Hays (San Marcos) 26,718
14. Brazoria (Pearland) 23,672
15. Galveston (Galveston) 21,624
16. Midland (Midland) 18,849
17. Ector (Odessa) 16,806
18. Bell (Killeen) 16,266
19. Nueces (Corpus) 15,901
20. Webb (Laredo) 15,365
21. Guadalupe (Seguin) 14,698
22. Lubbock (Lubbock) 13,767

Where the Jobs Are: How they’re Changing and Why Skills Matter!
County (Big City) Change
1. Andrews (Permian Basin) 17.8%
2. Sterling (Concho Valley) 17.8%
3. Hays (Rural Capital) 16.9%
4. Fort Bend (Gulf Coast) 16.0%
5. Kendall County (Alamo) 15.5%
6. Williamson (Rural Capital) 14.7%
7. Midland (Permian Basin) 13.8%
8. Martin (Permian Basin) 13.3%
9. Comal (Alamo) 13.2%
10. Crane (Permian Basin) 13.1%
11. McMullen (Coastal Bend) 13.1%
County (Big City) Change
12. Denton (North Central) 13.0%
13. Montgomery (Gulf Coast) 13.0%
14. Collin (North Central) 12.3%
15. Ector (Permian Basin) 12.3%
16. Reagan (Concho Valley) 12.1%
17. Travis (Austin) 11.7%
18. Rockwall (No. Central) 11.2%
19. Guadalupe (Alamo) 11.1%
20. Gaines (Permian Basin) 10.5%
21. Dimmit (Middle Rio) 10.5%
22. Winkler (Permian Basin) 10.4%
Texas Counties Population Percent Growth 2010-14

Where the Jobs Are: How they’re Changing and Why Skills Matter!
MSA 2015 MSA 2015Amarillo 3.1 Texas 4.4Austin-Round Rock 3.2 Tyler 4.5Midland 3.2 Houston-Sugar Land 4.6Lubbock 3.4 Killeen-Temple 4.6College Station-Bryan 3.6 Laredo 4.7San Antonio 3.7 Longview 4.9Abilene 3.8 Texarkana 4.9D/FW-Arlington CSA 3.9 Corpus Christi 5.0San Angelo 4.0 United States 5.2Sherman-Denison 4.1 El Paso 5.2Victoria 4.1 Beaumont-Pt Arthur 6.5Waco 4.1 Brville-Harlingen 6.8Wichita Falls 4.2 McAllen-Edinburg 7.9Odessa 4.3
Low Unemployment: Texas MSA August 2015 Urates (actual)

Where the Jobs Are: How they’re Changing and Why Skills Matter!
0
500
1,000
1,500
2,000
2,500
3,000
3,500
4,000
4,500
5,000
Tho
usa
nd
s
Baby Boomers Generation X Millenials
Texas Employment by Generation 2000-2013
Where the Jobs Are: How they’re Changing and Why Skills Matter!
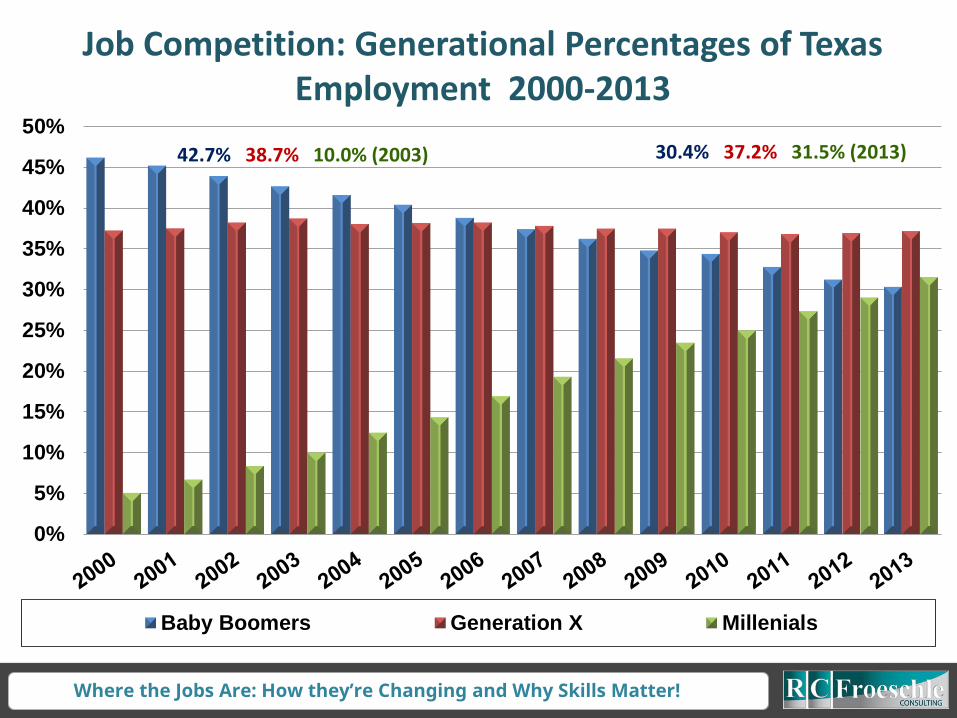
Job Competition: Generational Percentages of Texas Employment 2000-2013
0%
5%
10%
15%
20%
25%
30%
35%
40%
45%
50%
Baby Boomers Generation X Millenials
30.4% 37.2% 31.5% (2013)42.7% 38.7% 10.0% (2003)
Where the Jobs Are: How they’re Changing and Why Skills Matter!
How many Millennials does it take to screw in a light bulb?
1. One to the instructions
2. One to post the instructions on the wall of their page
3. One to post the video of their work showing collaboration
One Baby Boomer to tell them what a terrific, wonderful, spectacular job they did with the
light bulb
Where the Jobs Are: How they’re Changing and Why Skills Matter!
0
50,000
100,000
150,000
200,000
250,000
300,000
350,000
400,000
Emp
loym
ent
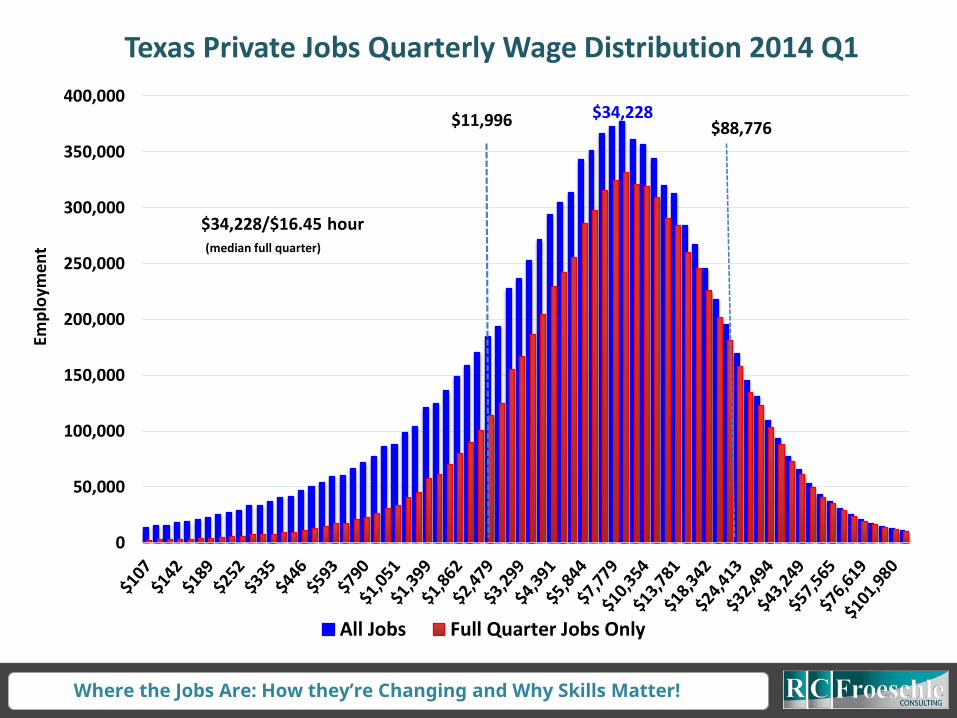
Texas Private Jobs Quarterly Wage Distribution 2014 Q1
All Jobs Full Quarter Jobs Only
$34,228/$16.45 hour(median full quarter)
$88,776$11,996 $34,228

Where the Jobs Are: How they’re Changing and Why Skills Matter!
Hourly Wages by Quintile (2014 OES)
Base year Employment
ProjectedEmployment
Net Job Growth
PCT of Total
Lowest – Under $11.42 per hour 2,289,230 2,855,480 566,250 23.3%
Low Middle – Between $11.42 and $16.87 per
hour ($35,089 yr)3,608,504 4,286,700 678,160 27.9%
Middle – Between $16.87 and $25.93 per
hour ($53,934 yr)2,504,670 3,028,390 523,720 21.5%
Upper Middle –Between $26.03 and
$36.05 per hour ($74,984)
1,625,350 1,972,810 347,460 14.3%
Elite – At or above $36.05 per hour
($75,000)1,393,170 1,708,580 315,410 13.0%
More than a Low Wage Economy: Texas Projected Job Growth by Wage Group 2012-2022

Where the Jobs Are: How they’re Changing and Why Skills Matter!
The Real Issue is Slow Growing Income Growing: Median vs. Average
Texas Median Household Income
Texas Per capita Personal income

Where the Jobs Are: How they’re Changing and Why Skills Matter!
Long term trend: Fewer employed adults
E/P Ratio 53.8%: Women
E/P Ratio 65.3%: Men

Where the Jobs Are: How they’re Changing and Why Skills Matter!
80
100
120
140
160
180
200
220
Emp
loym
ent
Ind
exTexas Industry Job Growth Trends 1995-2015
Construction
Manufacturing
Mining
Total Nonagricultural
Prof. & Business Services
Education/Healthcare

Where the Jobs Are: How they’re Changing and Why Skills Matter!
NAICS Industry Aug 2015ABS CHG July-Aug
ABS CHG Aug-Aug
Y-O-Y PER CHG
Total Nonagricultural 11,809,000 -13,700 217,700 1.9%
Goods-Producing 1,810,800 -7,700 -43,000 -2.3%
Service-Providing 9,998,200 -6,000 260,700 2.7%
Leisure and Hospitality 1,260,800 5,900 69,400 5.8%
Education and Health Services 1,593,100 -1,200 65,500 4.3%
Trade, Transportation, Utilities 2,372,800 -6,200 53,600 2.3%
Professional/Business Services 1,589,600 4,000 36,600 2.4%
Government 1,851,200 -6,200 21,000 1.1%
Construction 666,600 3,200 11,400 1.7%
Other Services 419,100 600 8,700 2.1%
Information 206,600 -700 3,400 1.7%
Financial Activities 705,000 -2,200 2,500 0.4%
Mining and Logging 289,100 -5,300 -22,500 -7.2%
Manufacturing 855,100 -5,600 -31,900 -3.6%
Texas Industry Growth August 2014-15 YOY (SA)
29,775 monthly
average (2014)357,300 jobs
Where the Jobs Are: How they’re Changing and Why Skills Matter!
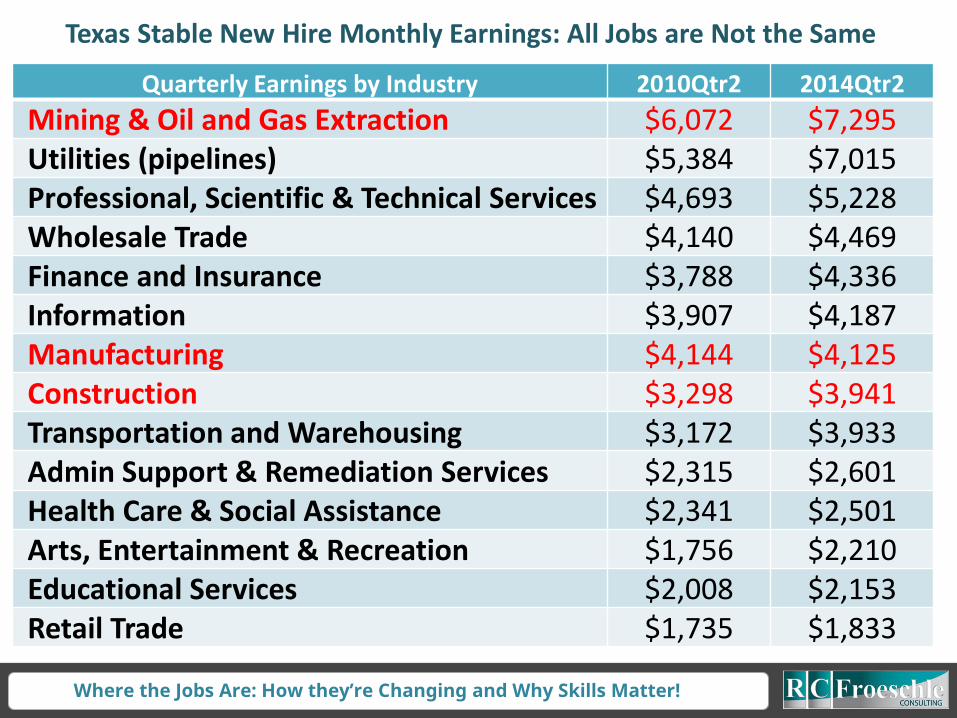
Quarterly Earnings by Industry 2010Qtr2 2014Qtr2
Mining & Oil and Gas Extraction $6,072 $7,295Utilities (pipelines) $5,384 $7,015Professional, Scientific & Technical Services $4,693 $5,228Wholesale Trade $4,140 $4,469Finance and Insurance $3,788 $4,336Information $3,907 $4,187Manufacturing $4,144 $4,125Construction $3,298 $3,941Transportation and Warehousing $3,172 $3,933Admin Support & Remediation Services $2,315 $2,601Health Care & Social Assistance $2,341 $2,501Arts, Entertainment & Recreation $1,756 $2,210Educational Services $2,008 $2,153Retail Trade $1,735 $1,833
Texas Stable New Hire Monthly Earnings: All Jobs are Not the Same
Where the Jobs Are: How they’re Changing and Why Skills Matter!
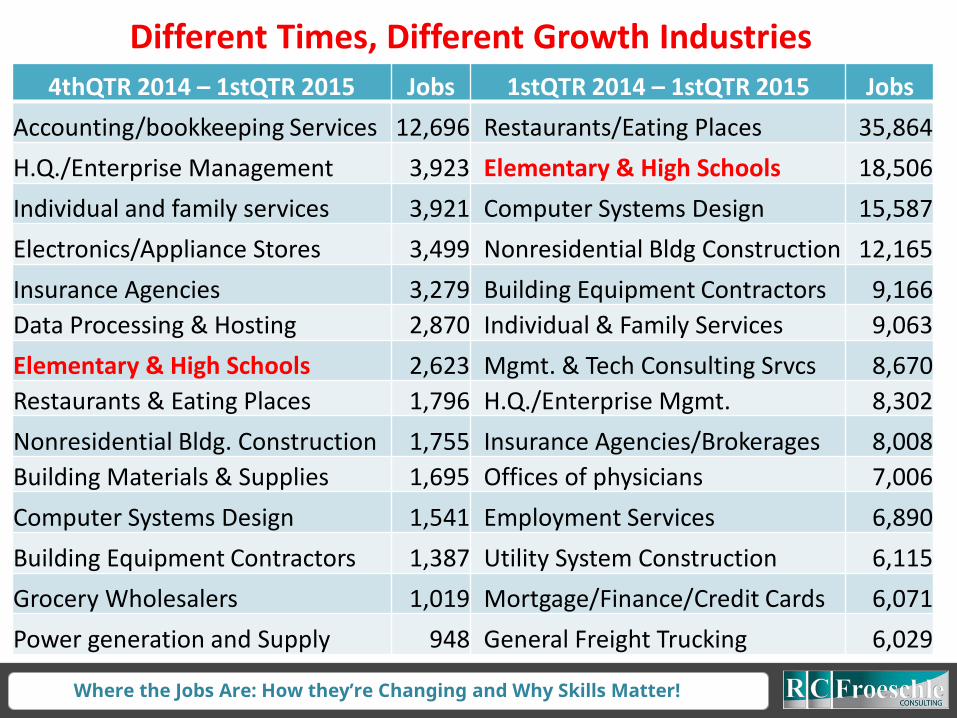
4thQTR 2014 – 1stQTR 2015 Jobs 1stQTR 2014 – 1stQTR 2015 Jobs
Accounting/bookkeeping Services 12,696 Restaurants/Eating Places 35,864
H.Q./Enterprise Management 3,923 Elementary & High Schools 18,506
Individual and family services 3,921 Computer Systems Design 15,587
Electronics/Appliance Stores 3,499 Nonresidential Bldg Construction 12,165
Insurance Agencies 3,279 Building Equipment Contractors 9,166
Data Processing & Hosting 2,870 Individual & Family Services 9,063
Elementary & High Schools 2,623 Mgmt. & Tech Consulting Srvcs 8,670
Restaurants & Eating Places 1,796 H.Q./Enterprise Mgmt. 8,302
Nonresidential Bldg. Construction 1,755 Insurance Agencies/Brokerages 8,008
Building Materials & Supplies 1,695 Offices of physicians 7,006
Computer Systems Design 1,541 Employment Services 6,890
Building Equipment Contractors 1,387 Utility System Construction 6,115
Grocery Wholesalers 1,019 Mortgage/Finance/Credit Cards 6,071
Power generation and Supply 948 General Freight Trucking 6,029
Different Times, Different Growth Industries

Where the Jobs Are: How they’re Changing and Why Skills Matter!
Occupational Staffing Pattern PCT EMP PCT Female 2014 Wage
Elementary School Teachers, Ex. Special Ed 18.9% 81.0% $48,919
Secondary School Teachers, Ex. Special Ed 12.4% 60.0% $50,000
Middle School Teachers, Ex. Special Ed 9.5% 81.0% $49,416Teacher Assistants 8.9% 90.2% $20,171Substitute Teachers 6.2% 58.3% $20,230Janitors & Cleaners 4.5% 37.5% $20,076
Combined Food Prep & Serving Workers 4.0% 60.0% $18,002
Bus Drivers, School or Special Client 2.9% 47.5% $23,240
Education Administrators 2.7% 67.1% $73,418
Secretaries & Admin Assistants 2.7% 95.5% $29,343
Kindergarten Teachers, Ex. Special Ed 1.8% 97.2% $48,121
Guidance & Vocational Counselors 1.6% 74.2% $51,557
Special Ed Teachers, K-Elementary 1.5% 80.8% $49,934
Office Clerks, General 1.5% 82.8% $27,873
High School CTE Teachers 1.2% 58.3% $51,063
Elementary & Secondary Education: Occupational Staffing Needs

Where the Jobs Are: How they’re Changing and Why Skills Matter!
Occupational Staffing Pattern PCT EMP PCT Female 2014 Wage
Roustabouts, Oil & Gas 13.8% 0.8% $32,188
Service Unit Operators, Oil, Gas, & Mining 13.7% 0.0% $44,066
Heavy & Tractor-Trailer Truck Drivers 6.1% 13.1% $35,024
Supervisors, Construction & Extraction 5.3% 3.4% $55,834
Rotary Drill Operators, Oil & Gas 4.5% 0.0% $62,382
Derrick Operators, Oil & Gas 4.5% 0.8% $45,985
Helpers--Extraction Workers 3.4% 1.5% $32,125Construction Laborers 2.6% 2.9% $25,708
Industrial Machinery Mechanics 2.3% 4.0% $46,167General & Operations Managers 2.2% 27.2% $103,909
Office Clerks, General 1.7% 82.8% $27,873Geological & Petroleum Technicians 1.6% 35.5% $54,480
Operating Engineers & Equipment Operators 1.4% 1.6% $35,835
Helpers--Production Workers 1.3% 13.4% $27,887
Laborers & Material Movers, Hand 1.2% 14.8% $28,796
Support Activities for Mining: Occupational Staffing Needs
Where the Jobs Are: How they’re Changing and Why Skills Matter!
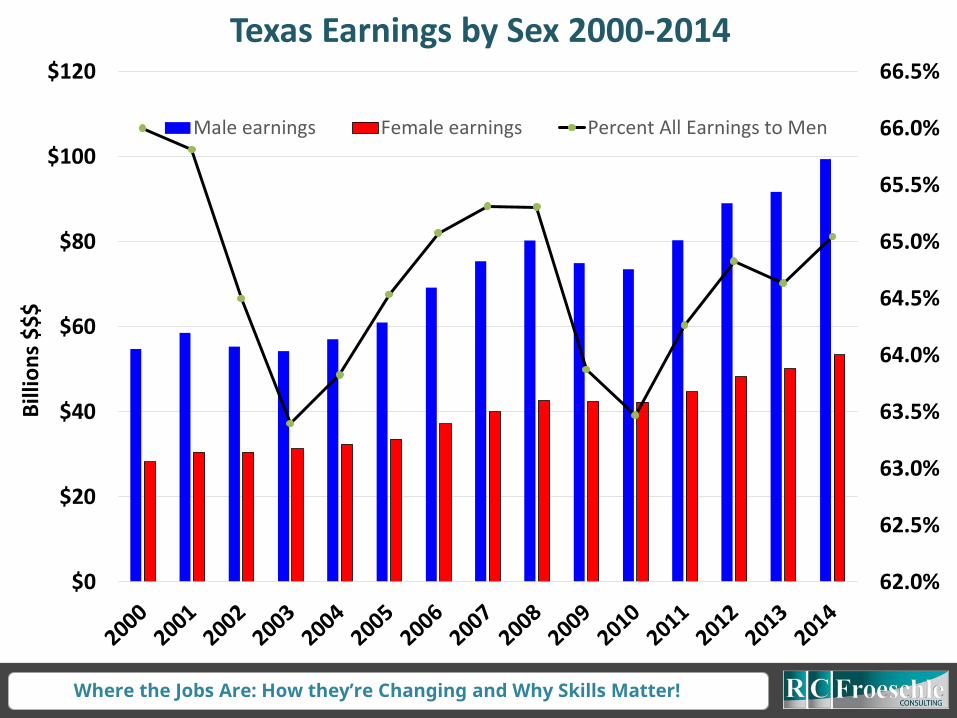
Texas Earnings by Sex 2000-2014
62.0%
62.5%
63.0%
63.5%
64.0%
64.5%
65.0%
65.5%
66.0%
66.5%
$0
$20
$40
$60
$80
$100
$120
Bill
ion
s $
$$
Male earnings Female earnings Percent All Earnings to Men
Where the Jobs Are: How they’re Changing and Why Skills Matter!
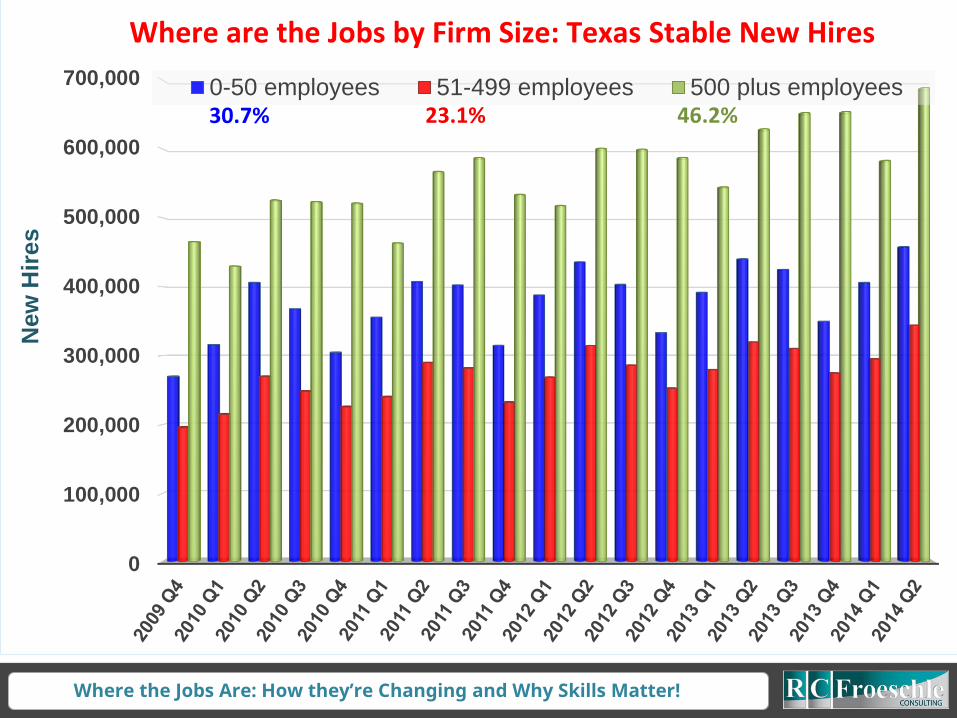
0
100,000
200,000
300,000
400,000
500,000
600,000
700,000
New
Hir
es
0-50 employees 51-499 employees 500 plus employees
Where are the Jobs by Firm Size: Texas Stable New Hires
23.1% 46.2%30.7%

Where the Jobs Are: How they’re Changing and Why Skills Matter!
As Oil Prices Fall, Rig Counts Decline
$0
$20
$40
$60
$80
$100
$120
0
100
200
300
400
500
600
700
800
900
1000
Texas Weekly Rig Count vs. WTI $$$ Prices
Texas Rig Count WTI Price
6/20/14 $107.23

Where the Jobs Are: How they’re Changing and Why Skills Matter!
Not All Areas Have Equal Exposure to the Oil & Gas Sector

Where the Jobs Are: How they’re Changing and Why Skills Matter!
Oil & Gas Market Opinions Trending Negative/Mixed
1. Brent will fall to $38 in March and climb to $58 in 4thQTR2015. “When history is written on this oil price crash, it will not fit easily alongside any other of the past 45 years if judged by its context or financial market repercussions.” (J.P. Morgan)
2. “The Barnett Shale used to be the place, but that’s simply not the case anymore.” (Tudor, Pickering Holt energy investments)
3. "No segment of the oilfield services and drilling industry will be immune to E&P companies' spending reductions, but the strain will vary by subsector and geography." (Moodys Analyst, SajjadAlam)
4. "We need to see oil prices above $60 and more toward $65 to spur a recovery in the rig count. The longer it stays below $60, the harder it’s going to be for U.S. production to ramp back up.” (Andrew Cosgrove, Global Drilling & Oilfield Analysis, Bloomberg)

Where the Jobs Are: How they’re Changing and Why Skills Matter!
Upstream $$$ Flow – From Whom Do they Buy?
Rights to Intangible Assets (royalties) 14.0% Basic Chemicals 1.2%
Taxes on Production and Imports 8.9% Computer Systems Design 1.2%
Management of Companies (HQ) 7.0% Wholesale Trade 0.9%
Compensation of Direct Employees 6.7% Natural Gas Distribution 0.7%
Maintenance & Repair Construction 6.3% Banks & Credit Intermediation 0.7%
Other Fabricated Metal Products 2.1% Plastics and Rubber Products 0.7%
Oil and Gas Extraction 1.9% Legal Services 0.6%
Mining Support Services 1.5% Motor Vehicle Parts & Trailers 0.6%
Electric Power Generation & Distribution
1.5% Real Estate 0.5%
Architectural & Engineering services 1.2% Petroleum and Coal Products 0.5%
Machinery & Equipment Rental 1.2%Scientific Research and
Development Services0.4%
Follow the Money – Oil & Gas Extraction Supply Chain

Where the Jobs Are: How they’re Changing and Why Skills Matter!
Occupation Aug 2015 Aug 2014 Education
Registered Nurses 89,724 99,336 Bach/Assoc. degree
Retail Salespersons 43,791 50,882 Short term OJT
Supervisor, Retail Sales 30,925 57,493 Related Work EXP
Heavy Truck Drivers 30,205 34,050 Short term/CDL
Customer Service Reps 26,040 23,650 Moderate OJT
Software Developers, Apps 22,447 21,600 Bachelors degree
Computer Systems Analysts 18,320 17,740 Bachelors degree
Supervisor, Office/Admin 18,087 18,453 Related Work EXP
Computer User Support Specialist 16,859 15,934 Associates degree
Network Systems Administrators 16,466 16,442 Bachelors degree
Insurance Sales Agents 16,428 16,933 Postsecondary Voc.
Supervisor, Food Prep/Serving 16,419 13,641 Related Work EXP
Maintenance Repair Workers 16,017 13,898 Moderate OJT
Texas Help Wanted Job Listings: August 2014-15

Where the Jobs Are: How they’re Changing and Why Skills Matter!
Occupation Growth Openings Education 2014 Wage
Diagnostic Medical Sonographers 57.5% 310 Associate's $65,490
Interpreters & Translators 49.0% 280 Bachelor’s $44,290
Skincare Specialists 48.5% 290 Certificate $34,210
Petroleum Engineers 45.3% 1,365 Bachelor's $159,340
Information Security Analysts 45.0% 405 Bachelor's $88,090
Cardiovascular Technicians 44.3% 230 Associate's $52,540
Physician Assistants 44.1% 340 Master's $102,260
Occupational Therapy Assistants 44.1% 190 Associate's $68,340
Welding & Brazing Machine Operators 43.3% 260 HS diploma $35,550
Personal Care Aides 42.5% 9,900 HS diploma $17,390
College Nursing Instructors 41.6% 230 Master's $63,480
Industrial Machinery Mechanics 41.4% 2,145 HS diploma $48,840
Market Research Analysts 41.0% 1,315 Bachelor's $70,000
College Health Specialties Teachers 41.0% 1,045 Doctorate $126,360
Home Health Aides 40.7% 2,900 HS diploma $20,530
Texas Fastest Growing Occupations 2012-2022

Where the Jobs Are: How they’re Changing and Why Skills Matter!
Occupational Title PCT CHGAAO
OpeningsTypical Education
Diagnostic Medical Sonographers 57.5% 310 Associate's degree
Interpreters & Translators 49.0% 280 Bachelor's degree
Petroleum Engineers 45.3% 1,365 Bachelor's degree
Information Security Analysts 45.0% 405 Bachelor's degree
Cardiovascular Technologists 44.3% 230 Associate's degree
Occupational Therapy Assistants 44.1% 190 Associate's degree
Physician Assistants 44.1% 340 Master's degree
Food Scientists & Technologists 43.3% 120 Bachelor's degree
Nursing Instructors, Postsecondary 41.6% 230 Master's degree
Health Specialties Teachers, College 41.0% 1,045 Doctoral
Market Research Analysts 41.0% 1,315 Bachelor's degree
Meeting & Event Planners 40.9% 415 Bachelor's degree
Nurse Practitioners 40.5% 395 Master's degree
Logisticians 39.8% 585 Bachelor's degree
Texas Projected Fastest Growing Jobs through 2022 Requiring Higher Education
Where the Jobs Are: How they’re Changing and Why Skills Matter!
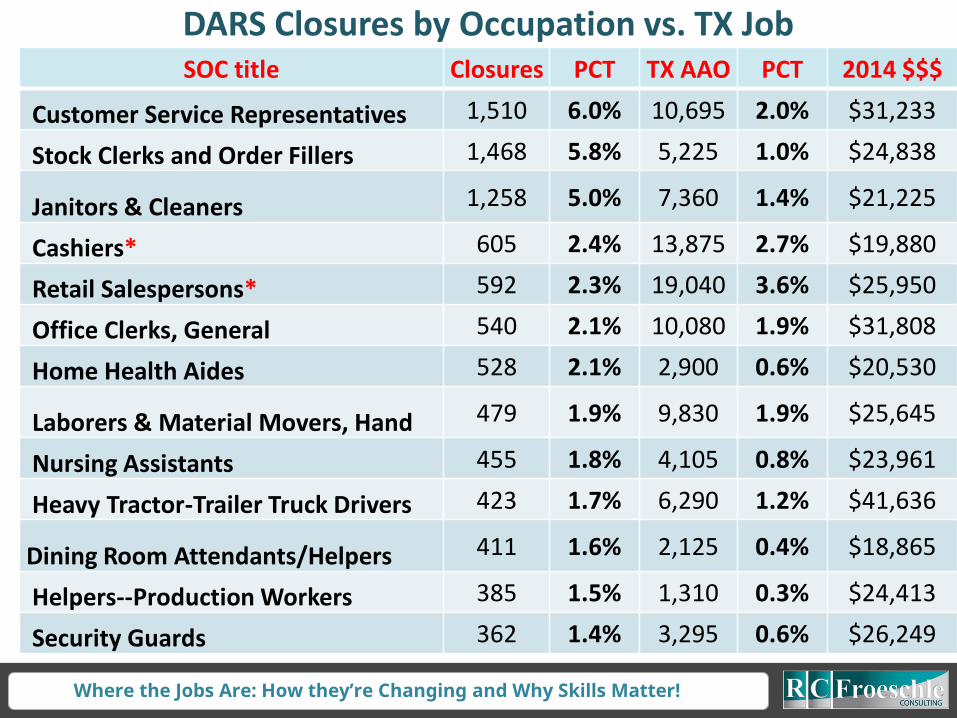
SOC title Closures PCT TX AAO PCT 2014 $$$
Customer Service Representatives 1,510 6.0% 10,695 2.0% $31,233
Stock Clerks and Order Fillers 1,468 5.8% 5,225 1.0% $24,838
Janitors & Cleaners 1,258 5.0% 7,360 1.4% $21,225
Cashiers* 605 2.4% 13,875 2.7% $19,880
Retail Salespersons* 592 2.3% 19,040 3.6% $25,950
Office Clerks, General 540 2.1% 10,080 1.9% $31,808
Home Health Aides 528 2.1% 2,900 0.6% $20,530
Laborers & Material Movers, Hand 479 1.9% 9,830 1.9% $25,645
Nursing Assistants 455 1.8% 4,105 0.8% $23,961
Heavy Tractor-Trailer Truck Drivers 423 1.7% 6,290 1.2% $41,636
Dining Room Attendants/Helpers 411 1.6% 2,125 0.4% $18,865
Helpers--Production Workers 385 1.5% 1,310 0.3% $24,413
Security Guards 362 1.4% 3,295 0.6% $26,249
DARS Closures by Occupation vs. TX Job
Where the Jobs Are: How they’re Changing and Why Skills Matter!
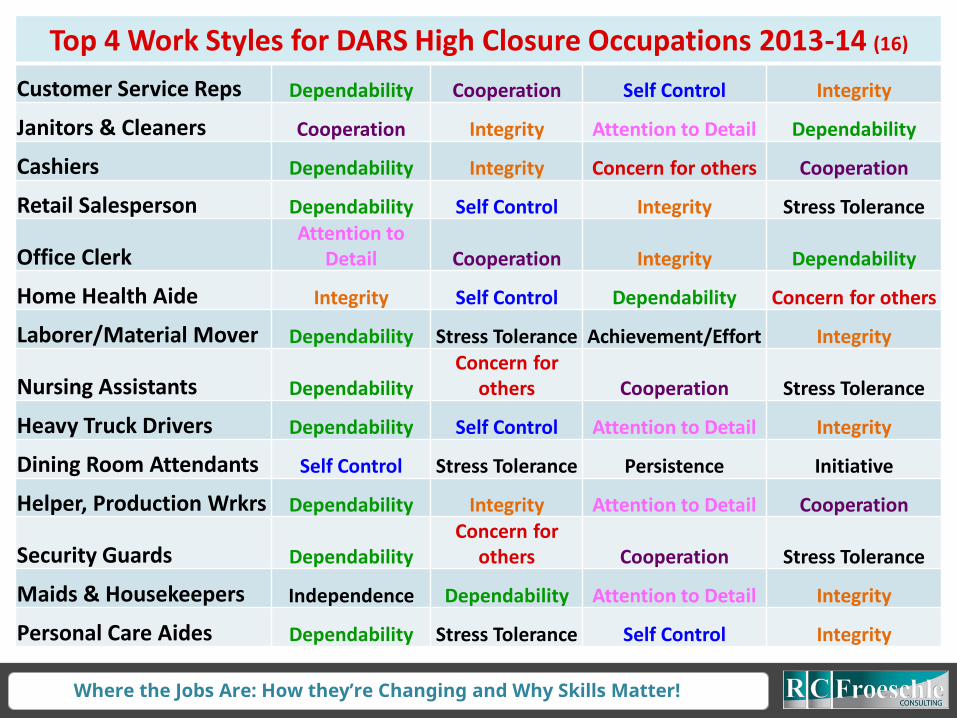
Top 4 Work Styles for DARS High Closure Occupations 2013-14 (16)
Customer Service Reps Dependability Cooperation Self Control Integrity
Janitors & Cleaners Cooperation Integrity Attention to Detail Dependability
Cashiers Dependability Integrity Concern for others Cooperation
Retail Salesperson Dependability Self Control Integrity Stress Tolerance
Office ClerkAttention to
Detail Cooperation Integrity Dependability
Home Health Aide Integrity Self Control Dependability Concern for others
Laborer/Material Mover Dependability Stress Tolerance Achievement/Effort Integrity
Nursing Assistants DependabilityConcern for
others Cooperation Stress Tolerance
Heavy Truck Drivers Dependability Self Control Attention to Detail Integrity
Dining Room Attendants Self Control Stress Tolerance Persistence Initiative
Helper, Production Wrkrs Dependability Integrity Attention to Detail Cooperation
Security Guards DependabilityConcern for
others Cooperation Stress Tolerance
Maids & Housekeepers Independence Dependability Attention to Detail Integrity
Personal Care Aides Dependability Stress Tolerance Self Control Integrity

Wh
ere
the
Job
s Are
: Ho
w T
he
y’re
Ch
an
gin
g a
nd
Wh
y S
kills M
atte
r!

Where the Jobs Are: How they’re Changing and Why Skills Matter!
Productivity: Decoupling Output from Job Creation
Output
Jobs

Where the Jobs Are: How they’re Changing and Why Skills Matter!
“New technologies are encroaching into human skills in a way that is completely unprecedented.” Andrew
McAfee, MIT Center for Digital Business
“Technology should be deployed wherever possible to free humans from drudgery and
repetitive tasks”
“Unfortunately, there are a lot of people who earn honest livings from drudgery and
repetitive tasks.”
Larry Page, Google

Where the Jobs Are: How they’re Changing and Why Skills Matter!
Labor Saving Work Transformations through Technology
FarmersCotton GinsDiesel MechanicsEquipment Maintenance Mechanics
Where the Jobs Are: How they’re Changing and Why Skills Matter!
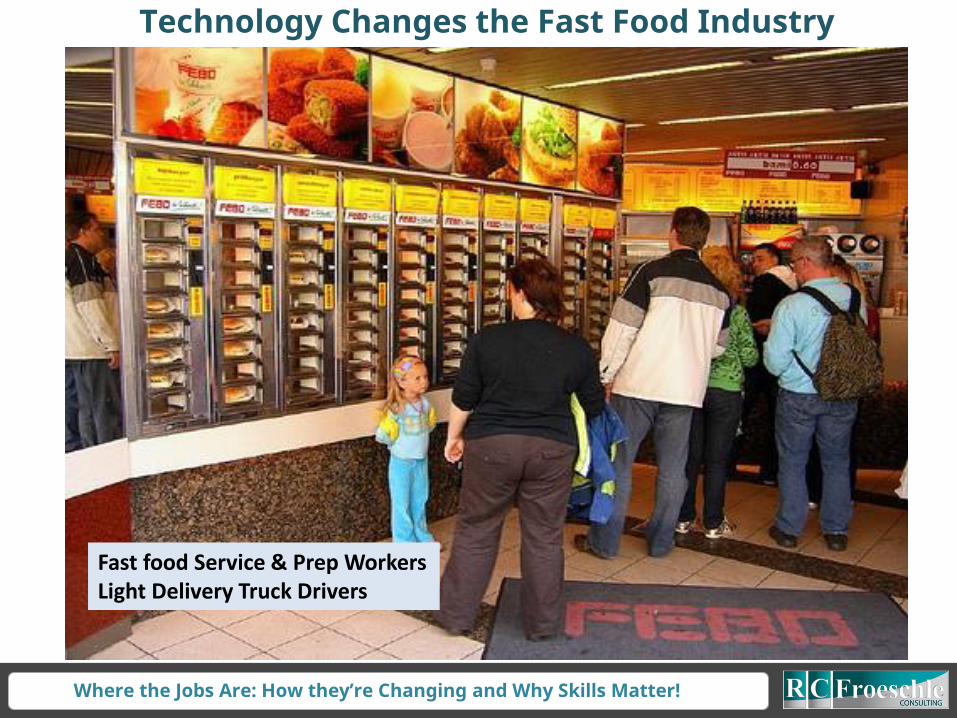
Technology Changes the Fast Food Industry
Fast food Service & Prep WorkersLight Delivery Truck Drivers

Where the Jobs Are: How they’re Changing and Why Skills Matter!
Automated Warehouse and Shipping
Industrial Engineering TechnicianPackaging ClerksShipping & Receiving ClerksMillwrightsMaintenance Mechanics

Where the Jobs Are: How they’re Changing and Why Skills Matter!
3-D Printing Applications
Construction ArchitectureDesignManufacturing

Where the Jobs Are: How they’re Changing and Why Skills Matter!
Drone technology, Instant product delivery, “Dash” buttons

Where the Jobs Are: How they’re Changing and Why Skills Matter!
The Argument for Skills over Occupational Titles: Job Titles That Didn’t Exist Just 5 Years Ago
Job Title Job Title
1. Videogame Tester 11. Cyber Security Specialist
2. Market Researcher Data Miner 12. Product Blogger
3. Bioinformatics Specialist 13. Social Media Manager
4. Healthcare Applications Analyst 14. Cyborg Anthropologist
5. Big Data Integration Engineer 15. Usability Engineer
6. Chief Listening Officer 16. Chief Sustainability Officer
7. Cloud Computing Operations Manager 17. User Experience Designer
8. E-commerce specialist 18. Mobile App Developer
9. Search Engine Optimization Manager 19. Customer Onboard Specialist
10. Behavioral Analytics Specialist 20. Energy Manager
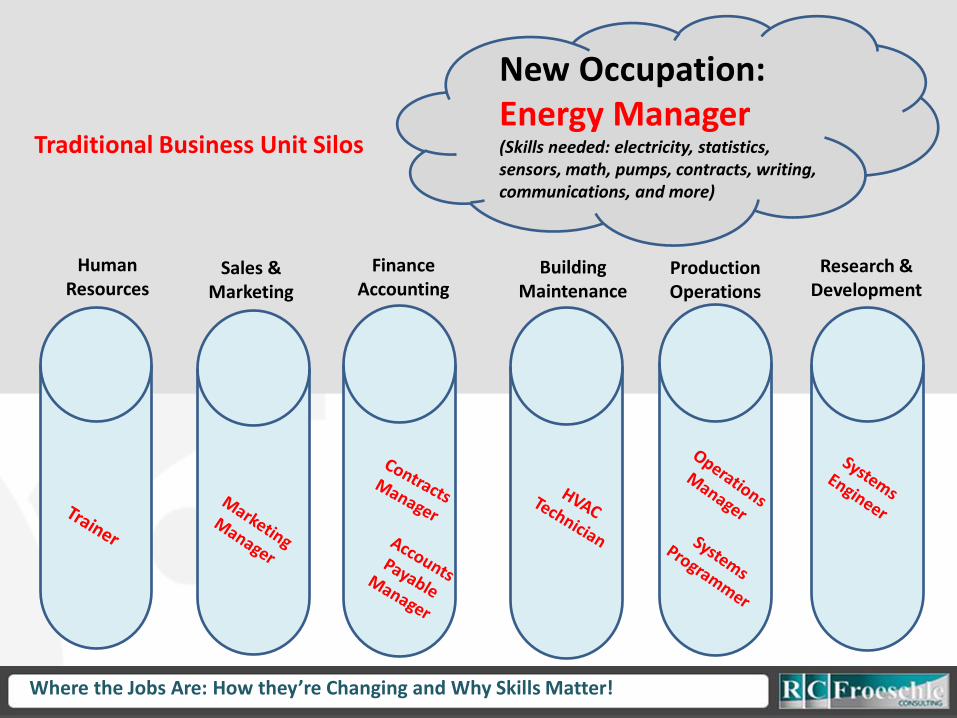
Human Resources
FinanceAccounting
BuildingMaintenance
ProductionOperations
Research & Development
Sales &Marketing
New Occupation:Energy Manager(Skills needed: electricity, statistics, sensors, math, pumps, contracts, writing, communications, and more)
Traditional Business Unit Silos
Where the Jobs Are: How they’re Changing and Why Skills Matter!
Where the Jobs Are: How they’re Changing and Why Skills Matter!
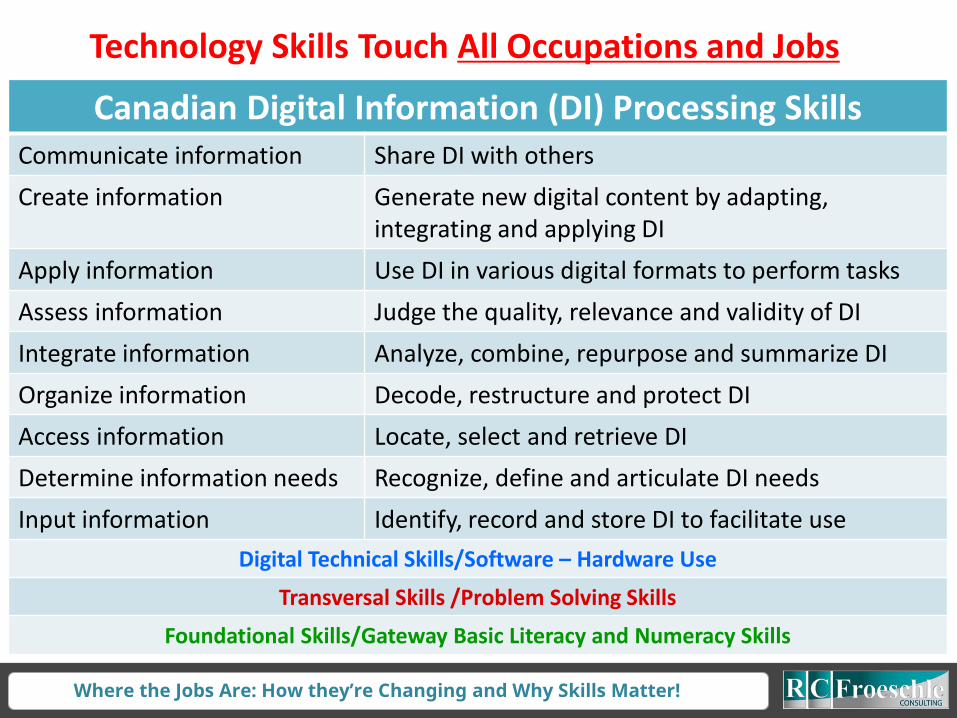
Canadian Digital Information (DI) Processing SkillsCommunicate information Share DI with others
Create information Generate new digital content by adapting, integrating and applying DI
Apply information Use DI in various digital formats to perform tasks
Assess information Judge the quality, relevance and validity of DI
Integrate information Analyze, combine, repurpose and summarize DI
Organize information Decode, restructure and protect DI
Access information Locate, select and retrieve DI
Determine information needs Recognize, define and articulate DI needs
Input information Identify, record and store DI to facilitate use
Digital Technical Skills/Software – Hardware Use
Transversal Skills /Problem Solving Skills
Foundational Skills/Gateway Basic Literacy and Numeracy Skills
Technology Skills Touch All Occupations and Jobs

Where the Jobs Are: How they’re Changing and Why Skills Matter!
Occupation Group H.S./GED Bachelor's Premium
Managerial & Professional (NH White) $84,504 $120,792 $36,288Technical, Sales, & Admin. $64,179 $112,843 $48,664Precision Prod., Craft, & Repairers $68,247 $94,875 $26,628Operatives and Laborers $61,211 $77,581 $16,370
Total $64,975 $114,698 $49,723Managerial & Professional (NH Black) $52,186 $84,758 $32,572Technical, Sales, & Admin. $43,933 $75,416 $31,483
Precision Prod., Craft, & Repairers $53,192 $82,885 $29,693Operatives and Laborers $46,296 $66,181 $19,885Total $42,465 $78,933 $36,468
Managerial & Professional (Hispanic) $61,992 $88,036 $26,044Technical, Sales, & Admin. $50,127 $81,005 $30,878Precision Prod., Craft, & Repairers $51,527 $63,695 $12,168Operatives and Laborers $47,455 $54,282 $6,827Total $47,760 $81,548 $33,788
More Education Matters: Mean Household Income by Race/Ethnicity, Educational Attainment and Occupation

Where the Jobs Are: How they’re Changing and Why Skills Matter!
Bachelor’s degree: What you study matters!
4 digit CIP major (100+ grads) $$$
Petroleum Engineering $89,098Chemical Engineering $74,181
Mechanical Engineering $63,534
Registered Nursing/Administration $62,276
Construction Engineering Techs $61,474 Industrial Production Techs $61,188
Rehab & Therapeutic Professions $22,154 International Relations and National Security Studies $21,606 Neurobiology & Neurosciences $21,590 Religious Education $21,339
Ecology, Evolution & Pop Biology $21,112
Health/Medical Prep Programs $19,577
4 digit CIP major (100+ grads) $$$
Petroleum Engineering $89,579
Chemical Engineering $67,830
Registered Nursing/Administration $58,387
Mechanical Engineering $57,918
Mechanical Engineering Tech $56,427
Construction Engineering Tech $53,593Radio, Television, and Digital Communication $23,423
Religion/Religious Studies $23,085 Dance $23,042
Dramatic/Theatre Arts/Stagecraft $20,798 Anthropology $20,661 Zoology/Animal Biology $20,247
Highest and lowest post exit program majors 2014 (+$69,521)
Highest and lowest post exit program majors 2009 (+$66,156)
Where the Jobs Are: How they’re Changing and Why Skills Matter!
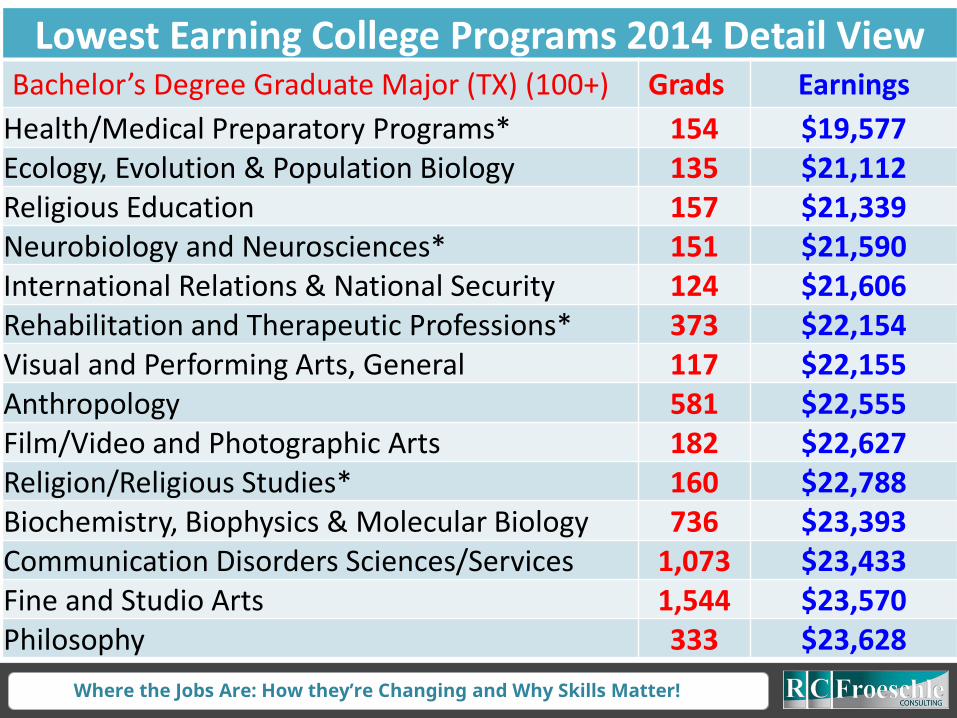
Lowest Earning College Programs 2014 Detail ViewBachelor’s Degree Graduate Major (TX) (100+) Grads Earnings
Health/Medical Preparatory Programs* 154 $19,577Ecology, Evolution & Population Biology 135 $21,112Religious Education 157 $21,339Neurobiology and Neurosciences* 151 $21,590International Relations & National Security 124 $21,606Rehabilitation and Therapeutic Professions* 373 $22,154Visual and Performing Arts, General 117 $22,155Anthropology 581 $22,555Film/Video and Photographic Arts 182 $22,627Religion/Religious Studies* 160 $22,788Biochemistry, Biophysics & Molecular Biology 736 $23,393Communication Disorders Sciences/Services 1,073 $23,433Fine and Studio Arts 1,544 $23,570Philosophy 333 $23,628

Where the Jobs Are: How they’re Changing and Why Skills Matter!
Highest Earning College Programs 2014 Detail ViewBachelor’s Graduates by Major (TX) (100+) Grads Earnings
Petroleum Engineering 460 $89,098Chemical Engineering 505 $74,181 Mechanical Engineering 1,783 $63,534 Registered Nursing/Nursing Administration 9,495 $62,276 Construction Engineering Technologies/Techs 377 $61,474 Industrial Production Technologies/Techs 252 $61,188 Mechanical Engineering Technicians 137 $59,941 Electrical/Electronics & Comm. Engineering 1,136 $59,757 Civil Engineering 801 $58,090 Industrial Engineering 360 $57,118 General Sales/Merchandising/Marketing 331 $55,523 Computer Science 333 $55,073 Electrical Engineering Technologies/Techs 176 $54,542 Computer Engineering 314 $54,413
Where the Jobs Are: How they’re Changing and Why Skills Matter!
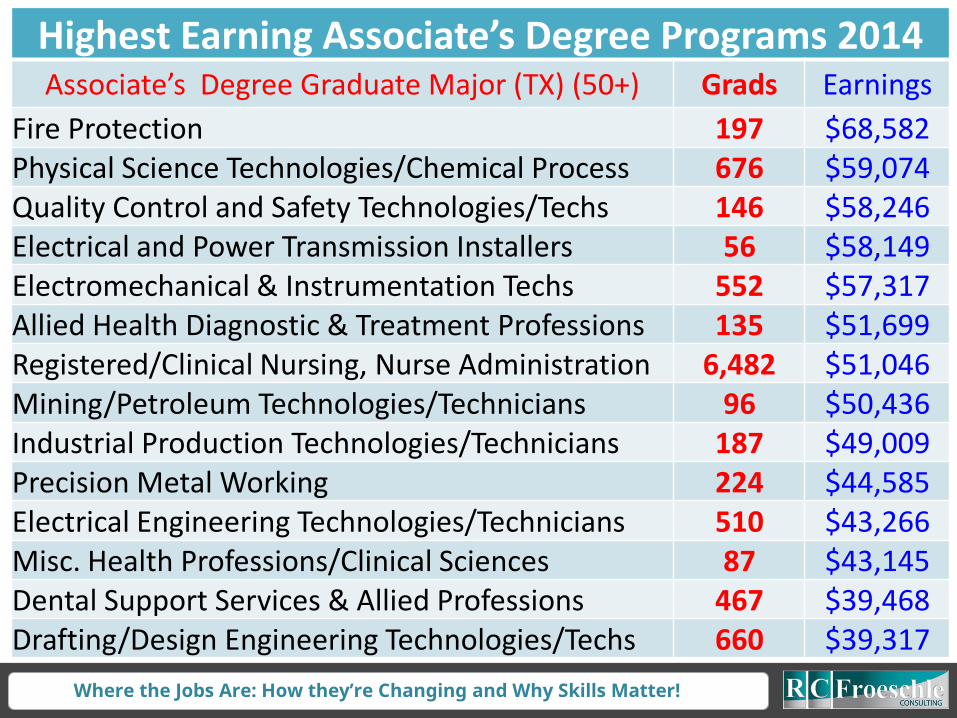
Highest Earning Associate’s Degree Programs 2014Associate’s Degree Graduate Major (TX) (50+) Grads Earnings
Fire Protection 197 $68,582Physical Science Technologies/Chemical Process 676 $59,074Quality Control and Safety Technologies/Techs 146 $58,246Electrical and Power Transmission Installers 56 $58,149Electromechanical & Instrumentation Techs 552 $57,317Allied Health Diagnostic & Treatment Professions 135 $51,699Registered/Clinical Nursing, Nurse Administration 6,482 $51,046Mining/Petroleum Technologies/Technicians 96 $50,436Industrial Production Technologies/Technicians 187 $49,009Precision Metal Working 224 $44,585Electrical Engineering Technologies/Technicians 510 $43,266Misc. Health Professions/Clinical Sciences 87 $43,145Dental Support Services & Allied Professions 467 $39,468Drafting/Design Engineering Technologies/Techs 660 $39,317

Where the Jobs Are: How they’re Changing and Why Skills Matter!
Most Popular Bachelor’s Degrees 2014Bachelor’s Degree Graduate Major (TX) (100+) Grads Earnings
Multi-/Interdisciplinary Studies, Other 9,683 $40,634Registered Nursing, Nursing Administration 9,495 $62,276Business Administration, Management 7,533 $47,226Psychology, General 5,953 $24,852Biology, General 5,042 $24,411Health and Physical Education/Fitness 4,566 $27,915Criminal Justice and Corrections 4,205 $30,694Accounting and Related Services 3,593 $38,956Finance and Financial Management Services 2,859 $44,238
Marketing 2,788 $37,449Liberal Arts and Sciences/Humanities 2,632 $34,755Communication and Media Studies 2,211 $29,430
English Language and Literature, General 2,160 $28,676History 1,927 $30,506

Where the Jobs Are: How they’re Changing and Why Skills Matter!
Math = Money
The more accomplished you are at applied mathematics the more money
you can make.

Where the Jobs Are: How they’re Changing and Why Skills Matter!
1. Good communications skills: Can you…..
Explain what you’re doing (to co-worker or customer)?
Explain what you need (from a co-worker or customer)?
Ability to listen to and follow instructions?
2. Appropriate Technical knowledge (degrees needed for half of all job openings)
3. Can you work with people who are of a different age, race, gender and education level than you?
4. Can-do attitude / pleasant attitude (workers who are “engaged” in their work)
5. Critical thinking skills (if given a sequence of events, can you determine what will probably happen next)
Texas employers say they want…

Where the Jobs Are: How they’re Changing and Why Skills Matter!
Worker Preparation is a Balance of Will & Skill
SkillsStrong academics
High School diplomaPost secondary schooling
Appropriate technical skills
DistillStackable Credentials
On the Job LearningLifelong Learning
Workplace EssentialsConsciousness
Communication skillsGetting along with others
WillWilling to take a job:
At lower level, lesser wage In a different localeShow flexibility & initiative

Where the Jobs Are: How they’re Changing and Why Skills Matter!
“There’s not one specific thing or skill
people have to have to work for us.
But I can tell you why we fire people:
soft skills. We hire for hard skills. We
fire for soft skills. The ability to
interact and communicate with others
or behave ethically and take
responsibility for things tends to be
where people tend to break down.”
Rick Stephens, senior vice president of HR, The Boeing Corporation

Where the Jobs Are: How they’re Changing and Why Skills Matter!

Where the Jobs Are: How they’re Changing and Why Skills Matter!
1. Demonstrates ability to articulate all of the above,
including examples of concrete skills and abilities.
2. Anticipation of future skill needs. The person seems to
have other skills that might someday be useful to the
company.
3. Experience in the industry; especially in directly
related job titles and work activities.
4. Demeanor indicates good Workplace Essentials;
especially the ability to get along with others,
demonstrated by experience or general attitude.
5. More education is better. Degrees indicate broader
knowledge of the field of study … just smarter.
Confessions of a hiring authority:What we’re really thinking!

Where the Jobs Are: How they’re Changing and Why Skills Matter!
There is much more Texas labor market story to tell, but this version is over!
Thank you!


