29
RD 51 Test beam Large GEM testing
| Date post: | 01-Jan-2016 |
| Category: |
Documents |
| Upload: | kenneth-rice |
| View: | 35 times |
| Download: | 0 times |

RD 51 Test beam
Large GEM testing

List of scansDate Runs Purpose Chamber14/08/2010 0-15 Preliminary threshold scan Tracker
14/08/2010 16-20 Preliminary latency scan Tracker
15/08/2010 21-108 HV scan (latencies 13-14-15clk; thresholds -40, -60, -80, -100; MSPL 4clk) Large GEM
16/08/2010 109-268 Monostable pulse lenght scan (latencies 10 to 19clk; thresholds -40, -60, -80, -100; HV -5.15kV)
Large GEM
17/08/2010 269-336 Threshold scan (latency 14clk; HV -5.15, -5.10, -5.05, -5.00kV; MSPL 4clk) Large GEM
18/08/2010 337-554 [Changed Large GEM alignment] HV scan (latencies 13-14-15-16clk; thresholds -40, -60, -80, -10; MSPL 3-4clk)
Large GEM
19/08/2010 555-621 Threshold scan (latency 14clk; HV -5.15, -5.10, -5.05, -5.00kV; MSPL 4clk) Large GEM
20/08/2010 622-641 Fine threshold scan (latency 14clk; HV -5.00kV; MSPL 4clk) Large GEM
20/08/2010 648-650 [Pions beam] preliminary latency scan (threshold -30; HV -4.50kV; MSPL 4clk) Tracker
20/08/2010 651-662 Efficiency scan on high intensity hadrons Large GEM
20/08/2010 663-673 Efficiency scan on lower intensity hadrons Large GEM

Date Runs Purpose Chamber20/08/2010 674-693 HV scan on high intensity hadrons Large GEM
21/08/2010 694-773 Detector efficiency scan: beam centered on 13 different pads Large GEM
21/08/2010 774-776 [Changed gas mixture] Preliminary efficiency scan Large GEM
22/08/2010 777-794 Efficiency scan (Ed = 2kV/cm; Et1, Et2, Ei = 3kV/cm; threshold -20, MSPL 4clk, latencies 15-16-17clk)
CMS Timing
22/08/2010 795-807 Drift field scan (Et1, Et2, Ei = 3kV/cm; threshold -20, latency 16clk) CMS Timing
22/08/2010 808-816 Induction field scan CMS Timing
22/08/2010 817-856 MSPL scan CMS Timing
22/08/2010 857-869 [Changed gas mixture] HV scan (th -60; lat 14-15-16clk; MSPL 4clk) Large GEM
22/08/2010 867-902 MSPL scan (threshold -60; latencies 11 to 19clk; HV -5.30kV) Large GEM
22/08/2010 903-920 MSPL scan (threshold -60; latencies 11 to 19clk; HV -5.35kV) Large GEM
A
B C
D
E
F
G
H
I
L
M
N
O
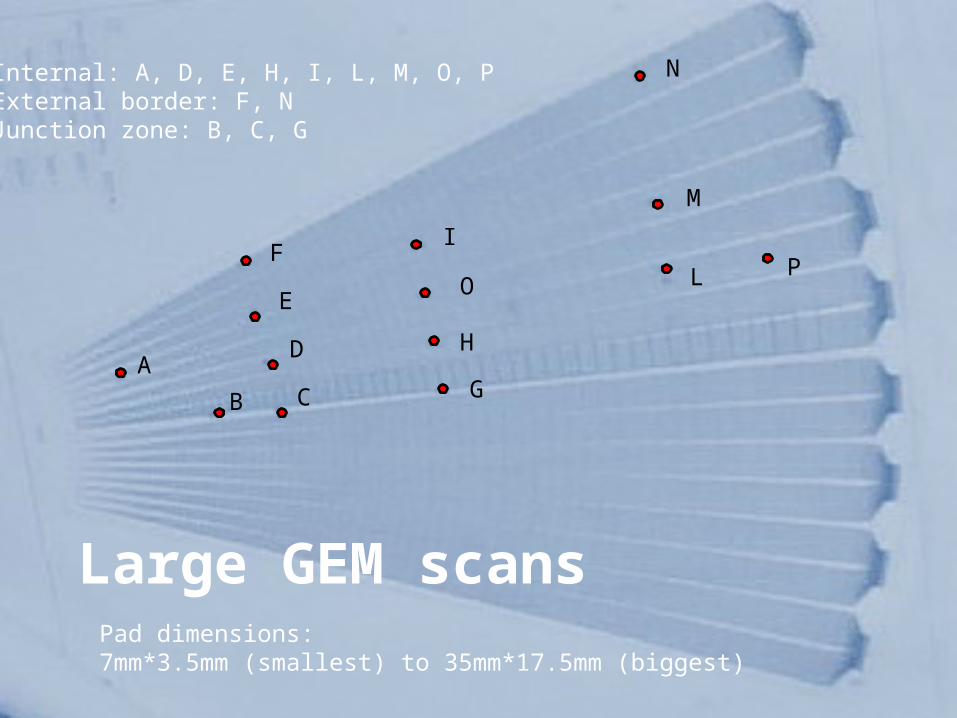
Internal: A, D, E, H, I, L, M, O, PExternal border: F, NJunction zone: B, C, G
Large GEM scans
P
Pad dimensions:7mm*3.5mm (smallest) to 35mm*17.5mm (biggest)

Large GEM gain curve
3500 3600 3700 3800 3900 4000 4100 4200 4300 4400 4500100
1000
10000
f(x) = 5.82568343237068E-06 exp( 0.0048309652711364 x )
right
left
Exp fit (left)
Negative HV [V]
Larg
e G
EM g
ain
N.B.: The low-gain part of the "right" curve is offset by incorrect zeroing of the nA-meter, at higher gain this becomes insignificant.

Large GEM working pointsRpUP 5V/s RpDOWN 10V/s EXPECTED GAIN
Gain=2E-06e0.027xI
V Expected I Vmon1 Vmon2 I1 I2 IU-LIMIT ID-LIMIT Impedance EXPECTED GAIN
-50 56 50 8,3 8 100 100
-100 103 97 15,9 15,9 100 100 6,289308 3,07E-06
-200 -31,8 202 197 32,5 32,4 100 100 6,147816 4,81E-06
-500 -81,3297 502 498 82,4 82,3 100 100 6,071633 1,85E-05
-1000 -164,7 1002 998 166 165,6 200 200 6,031357 0,000177
-1500 -248,7 1501 1498 249,2 248,7 300 300 6,023298 0,001672
-2000 -332,044 2003 1999 332,6 331,8 400 400 6,023481 0,015888
-2500 -415,042 2502 2499 416 415,1 420 419,1 6,01733 0,151017
-2750 -457,013 2754 2750 457,8 456,6 461,8 460,6 6,019252 0,466842
-3000 -498,401 3003 3000 499,5 498,2 503,5 502,2 6,016845 1,439271
-3200 -531,84 3204 3201 532,9 531,5 536,9 535,5 6,017481 3,546413
-3400 -565,02 3404 3400 566,2 564,8 570,2 568,8 6,01592 8,714921
-3500 -581,79 3503 3501 582,9 581,4 586,9 585,4 6,015639 13,68002
-3600 -598,44 3603 3601 599,5 598 603,5 602 6,015874 21,41596
-3700 -615,04 3704 3700 612,2 614,7 616,2 618,7 6,034753 32,28287
-3800 -629,686 3803 3800 632,9 631,3 636,9 635,3 6,014087 52,76967
-3900 -648,478 3903 3900 649,5 647,9 653,5 651,9 6,014343 82,61049
-4000 -665,077 4004 4000 666,2 664,6 670,2 668,6 6,014432 129,6757
-4100 -681,694 4103 4100 682,9 681,1 686,9 685,1 6,013937 203,5551
-4200 -698,378 4203 4200 699,5 697,7 703,5 701,7 6,014178 318,6638
-4300 -714,977 4303 4300 716,2 714,4 720,2 718,4 6,013568 500,2143
-4400 -731,679 4404 4401 732,7 731 736,7 735 6,015583 780,9699
-4500 -748,057 4504 4501 749,5 747,6 753,5 751,6 6,014969 1229,222
-4600 -764,759 4604 4601 766,2 764,3 770,2 768,3 6,014381 1929,539
-4700 -781,46 4702 4701 782,8 780,9 786,8 784,9 6,01331 3020,678
-4800 -798,229 4803 4801 799,7 797,9 803,7 801,9 6,011523 4767,306
-4900 -815,101 4903 4902 816 814,1 820 818,1 6,014976 7402,971
-5000 -831,259 5003 5001 832,9 831,2 836,9 835,2 6,011663 11683,54
-5050 -840,053 5049 5052 842,4 838,1 846,4 842,1 6,010755 15099,8
-5100 -847,884 5103 5102 849,8 847,9 853,8 851,9 6,011081 18439,25
-5150 -856,668 5153 5152 857,9 855,9 861,9 859,9 6,012961 22946,87
-5200 -865,116 5199 5202 867,5 863,2 871,5 867,2 6,009748 29736,68
-5250 -873,387 5248 5252 875,8 871,6 879,8 875,6 6,008968 37206,42

HV scan – point Pruns 21-108 – best efficiency over latencies = 13, 14, 15 clk; MSPL=4clk
-5.25-5.20-5.15-5.10-5.05-5.00-4.95-4.90-4.85-4.80-4.75-4.70-4.65-4.60
766 776 786 796 806 816 826 836 846 856 866 876
0.0
0.1
0.2
0.3
0.4
0.5
0.6
0.7
0.8
0.9
1.0
Th -80Th -60Th -40Th -100
I [uA]
Larg
e G
EM e
ffici
ency
HV [kV]

HV scan – point Aruns 337-554 – best efficiency over latencies = 13, 14, 15, 16clk
-5.25-5.20-5.15-5.10-5.05-5.00-4.95-4.90-4.85-4.80-4.75-4.70-4.65-4.60
766 776 786 796 806 816 826 836 846 856 866 876
0.0
0.1
0.2
0.3
0.4
0.5
0.6
0.7
0.8
0.9
1.0
MSPL = 4clk; Th = -100 DACstepsMSPL = 3clk; Th = -100 DACstepsMSPL = 4clk; Th = -80 DACstepsMSPL = 3clk; Th = -80 DACstepsMSPL = 4clk; Th = -60 DACstepsMSPL = 3clk; Th = -60 DACstepsMSPL = 4clk; Th = -40 DACstepsMSPL = 3clk; Th = -40 DACsteps
HV [kV]
Larg
e G
EM e
ffici
ency
I [uA]
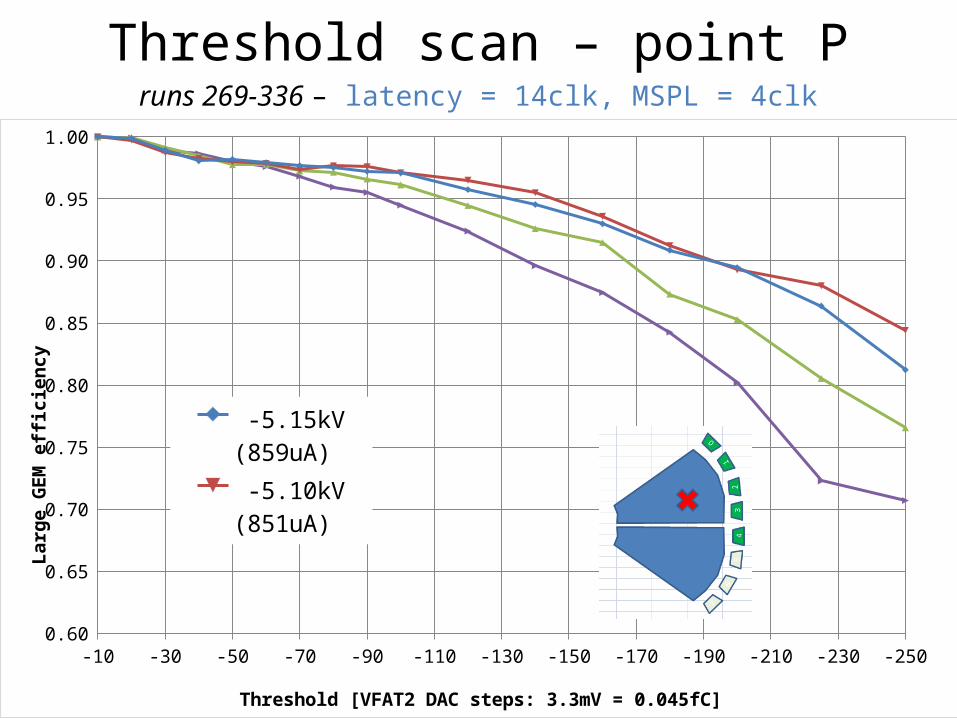
Threshold scan – point Pruns 269-336 – latency = 14clk, MSPL = 4clk
-250-230-210-190-170-150-130-110-90-70-50-30-100.60
0.65
0.70
0.75
0.80
0.85
0.90
0.95
1.00
-5.15kV (859uA) -5.10kV (851uA) -5.05kV (841uA) -5.00kV (834uA)
Threshold [VFAT2 DAC steps: 3.3mV = 0.045fC]
Larg
e G
EM e
ffici
ency

Threshold scan – point Aruns 555-621 – latency = 14clk; MSPL = 4clk
-250-230-210-190-170-150-130-110-90-70-50-30-100.60
0.65
0.70
0.75
0.80
0.85
0.90
0.95
1.00
-5.15kV (859uA) -5.10kV (851uA) -5.05kV (841uA) -5.00kV (834uA)
Threshold [VFAT2 DAC steps: 3.3mV = 0.045fC]
Larg
e G
EM e
ffici
ency

Comparison: big pad VS small pad
The smaller pad seems more efficient. This might be due to our efficiency-computing algorithm: we use to set a maximum residual of the hit on the large GEM with respect to the projecton of the track. We will investigate further on this effect.
Big pad Small pad

Fine treshold scan – point Aruns 622-641 – I = 834uA (-5.00kV); lat = 14clk; MSPL = 4clk
-60-58-56-54-52-50-48-46-44-42-40-38-36-34-32-30-28-26-24-22-200.950
0.955
0.960
0.965
0.970
0.975
0.980
0.985
0.990
0.995
1.000
Threshold [VFAT2 DAC steps: 3.3mV = 0.045fC]
Larg
e G
EM e
ffici
ency
At low thresholds, the effect of the noise invalidates our efficiency measurements. To avoit this, the majority of our data takings were run at Th <= -40 DAC steps.

MSPL scan – point Pruns 109-268 – I = 859 uA (HV = -5.15kV)
10 11 12 13 14 15 16 17 18 190.00
0.10
0.20
0.30
0.40
0.50
0.60
0.70
0.80
0.90
1.00 MSPL=1 Th=100MSPL=1 Th=80MSPL=1 Th=60MSPL=1 Th=40MSPL=2 Th=100MSPL=2 Th=80MSPL=2 Th=60MSPL=2 Th=40MSPL=3 Th=100MSPL=3 Th=80MSPL=3 Th=60MSPL=3 Th=40
Latency [CLK cycles = 25ns steps]
Larg
e G
EM e
ffici
ency
At Th=40 we have noise in the measurements, which intensity rises as we lenghten the monostable pulse. Thresholds are negative

Variable intensity hadrons – HV scanruns 653-693 – best efficiency over latencies = 14, 15clk; MSPL = 4clk
-5-4.95-4.9-4.85-4.8-4.75-4.7-4.65-4.6-4.55-4.5
750 760 770 780 790 800 810 820 830
0.0
0.1
0.2
0.3
0.4
0.5
0.6
0.7
0.8
0.9
1.0
380000c/spill; Th = -60 DACsteps380000c/spill; Th = -40 DACsteps12460c/spill; Th = -60 DACsteps12460c/spill; Th = -40 DACsteps3600c/spill; Th = -60 DACsteps3600c/spill; Th = -40 DACsteps
HV [kV]
Larg
e G
EM e
ffici
ency
I [uA]
We could not take more points, but it’s visible that the chamber reaches the plateau at lower HV than it does with leptons. We will investigate further on this behaviour.

Pad position scanruns 694-773
(mid
dle)
(junc
tion)
(junc
tion)
(mid
dle)
(mid
dle)
(bor
der)
(junc
tion)
(mid
dle)
(bor
der)
(mid
dle)
(mid
dle)
(bor
der)
(mid
dle)
Point A Point B Point C Point D Point E Point F Point G Point H Point I Point L Point M
Point N Point O
0.0
0.1
0.2
0.3
0.4
0.5
0.6
0.7
0.8
0.9
1.0Efficiency VS pad centered on the beam [th -60, MSPL 4, lat 14]
HV -5,15HV -4,80
Larg
e G
EM e
ffici
ency
we had some dead pad near pt M
We will compare these data with the positions of the spacers on the chamber.
Gas mixture changed fromAr-CO2 70/30
to Ar-CF4 60/40
Testing the new gain / speed values

Minor latency scanruns 774-776 – I = 876uA (-5.25kV); th = -60steps; MSPL = 4clk
13 14 150.0
0.1
0.2
0.3
0.4
0.5
0.6
0.7
0.8
0.9
1.0
Latency [Clock cycles = 25ns steps]
Larg
e G
EM e
ffici
ency
We probably made some mistake in selecting the right working point and could not take more runs, so we miss the HV response of the large GEM with this Ar/CF4 60/40 gas mixture.

Gas mixture changed from Ar-CF4 60/40
to Ar-CF4-CO2 60/20/20
Testing the new gain / speed values

-5.30-5.25-5.20-5.15-5.10-5.05-5.00-4.95-4.90-4.85-4.80-4.75-4.70-4.65-4.60
766 776 786 796 806 816 826 836 846 856 866 876
0.0
0.1
0.2
0.3
0.4
0.5
0.6
0.7
0.8
0.9
1.0
Ar/CO2/CF4 60/20/20Ar/CO2 70/30
HV [kV]
Larg
e G
EM e
ffici
ency
I [uA]
HV scanruns 857-869 – best efficiency over lat = 14, 15, 16clk; th = -60steps; MSPL=4clk
We did not reach the plateau, but we did not want to go too high with the HV. The large GEM’s efficiency becomes high at higher HV than it does with the Ar/CO2 70/30 gas mixture. Here is a comparison of the two HV curves.

MSPL scan at HV = -5.30, -5.35kVruns 867-920 – I = 883, 892uA (-5.30, -5.35kV); th = -60steps
11 12 13 14 15 16 17 18 190.0
0.1
0.2
0.3
0.4
0.5
0.6
0.7
0.8
0.9
1.0 MSPL = 4clk
MSPL = 3clk
MSPL = 2clk
MSPL = 1clk
Latency [CLK cycles = 25ns steps]
Larg
e G
EM E
ffici
ency
11 12 13 14 15 16 17 18 190.0
0.1
0.2
0.3
0.4
0.5
0.6
0.7
0.8
0.9
1.0
MSPL = 3clkMSPL = 2clk
With this mixture we have a better response, using MSPL = 1clk and MSPL = 2clk, than we have with Ar/CO2 70/30.
883uA scan
892uA scan

Gas mixture comparisonMSPL = 2clk; Ar/CO2 70/30 vs Ar/CO2/CF4 60/20/20
10 11 12 13 14 15 16 17 18 190.0
0.1
0.2
0.3
0.4
0.5
0.6
0.7
0.8
0.9
1.0
Ar/CO2 70/30 - I = 859uAAr/CO2/CF4 60/20/20 - I = 883uA
Latency [clock cycles = 25ns steps]
Larg
e G
EM e
ffici
ency
The signal is faster with Ar/CO2/CF4 60/20/20 gas mixture: it starts at latency = 18clk, and the peak reached is higher. Then, the chamber responce seems faster. We will investigate further on this point: these two scans were run at different gain values.

CMS Timing GEM scansGas mixture used: Ar/CF4 60/40
Working points:
Point VG1 VG2 VG3
1 390 V 350 V 300 V
2 400 V 360 V 310 V
3 410 V 370 V 320 V
4 415 V 375 V 325 V
5 420 V 380 V 330 V
6 425 V 385 V 335 V
7 430 V 390 V 340 V

Working point scan (Eff. VS Gain)runs 777-794 – Ed = 2kV/cm; Et1, Et2, Ei = 3kV/cm; th -20, lat 15-16-17, MSPL 4
1 2 3 4 5 60.0
0.1
0.2
0.3
0.4
0.5
0.6
0.7
0.8
0.9
1.0
Working point
CMS
Tim
ing
GEM
effi
cien
cy
Working point 7 was reached later and was not included in this HV scan.

Drift field scanruns 795-807 – E t1, Et2, Ei = 3kV/cm; th -20, lat 16, wrk points 4-6
0.5 1.0 1.5 2.0 2.5 3.0 3.50.6
0.7
0.8
0.9
1.0
WorkPoint 6WorkPoint 4
Drift field [kV/cm]
CMS
Tim
ing
GEM
effi
cien
cy
At working point 6 the gain was too high to notice the variations.

Induction field scanruns 808-816 – Ed = 2kV/cm; Et1, Et2 = 3kV/cm; th -20, lat 16, MSPL 4, wrk pt4
1.0 1.5 2.0 2.5 3.0 3.5 4.0 4.5 5.00.0
0.1
0.2
0.3
0.4
0.5
0.6
0.7
0.8
0.9
1.0
Induction field [kV/cm]
CMS
Tim
ing
GEM
effi
cien
cy

MSPL scanruns 817-856 – Ed = 2kV/cm; Et1, Et2 = 3kV/cm; Ei = 4.5kV/cm; th -20steps, wrk pt 7
12 13 14 15 16 17 18 19 20 210.0
0.1
0.2
0.3
0.4
0.5
0.6
0.7
0.8
0.9
1.0
MSPL = 1clkMSPL = 2clkMSPL = 3clkMSPL = 4clk
Latency [clock cycles = 25ns steps]
CMS
Tim
ing
GEM
effi
cien
cy
With this gas mixture the signal is faster than it is with Ar/CO2 70/30 mixture. At MSPL=1clk and MSPL=2clk the efficiency is already high.


Trackers – Preliminary threshold scanruns 0-15 – latencies = 14, 15clk; MSPL = 4clk
• Efficiency was roughly computed as the number of times we had zero clusters on the chamber, in correspondance with a trigger signal, among the total number of events triggered by the scintillators.
30 40 50 60 70 80 90 1000.0
0.1
0.2
0.3
0.4
0.5
0.6
0.7
0.8
0.9
1.0
g1 (X) -4.4kVg1 (Y) -4.4kVg2 (X) -4.4kVg2 (Y) -4.4kVg3 (X) -4.4kVg3 (Y) -4.4kVg1 (X) -4.5kVg1 (Y) -4.5kVg2 (X) -4.5kVg2 (Y) -4.5kVg3 (X) -4.5kVg3 (Y) -4.5kV
Threshold DAC steps [3.3mV (0.045fC)]
Trac
ker e
ffici
ency
We still have to analyse the tracker’s response in HV, latency, and threshold.
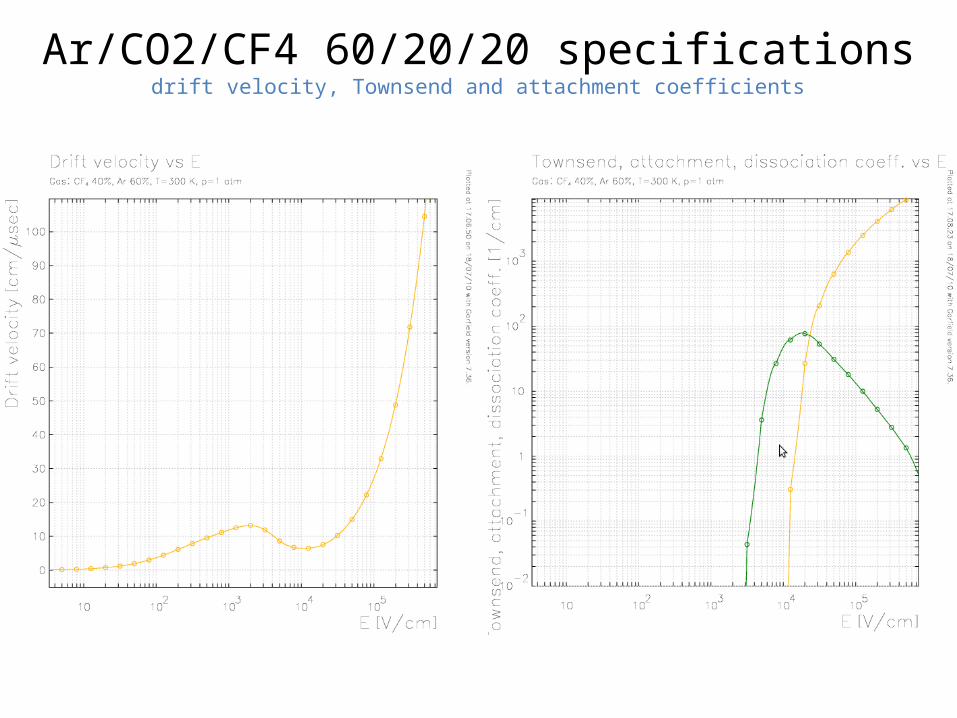
Ar/CO2/CF4 60/20/20 specificationsdrift velocity, Townsend and attachment coefficients


