38
R&D AND INNOVATION IN SERVICES : KEY FINDINGS FROM THE QUANTITATIVE ANALYSIS STRAND KNOWINNO-INNOSERV Project Final Conference Paris, 11 December 2012

R&D AND INNOVATION IN SERVICES : KEY FINDINGS FROM THE QUANTITATIVE ANALYSIS STRAND KNOWINNO-INNOSERV Project Final Conference Paris, 11 December 2012

BACKGROUND AND PROJECT DESCRIPTION

Services contribute significantly to GDP growth
Contribution of different sectors to real GDP growth (annualised), 2000-2011*
Source: OECD, STAN database, November 2012. Note: * or most recent available year. Latest available year displayed in parenthesis when different from 2011.
-1
0
1
2
3
4
5
6
SV
K (0
9)
KO
R (1
0)
PO
L (0
8)
ES
T (0
9)
ISR
(08)
C
ZE (0
9)
AU
S (0
6)
GR
C (0
9)
LUX
(09)
IS
L (0
9)
SV
N (1
0)
NZL
(08)
G
BR
(08)
E
SP
(09)
C
AN
(08)
H
UN
(10)
C
HE
(08)
A
UT
ME
X (0
9)
FIN
S
WE
(09)
U
SA
(09)
N
LD (1
0)
NO
R (0
9)
BE
L (0
9)
FRA
D
EU
(10)
P
RT
(06)
D
NK
(10)
IT
A (1
0)
JPN
(09)
Other Manufacturing Community, social, personal svcs Business sector services %
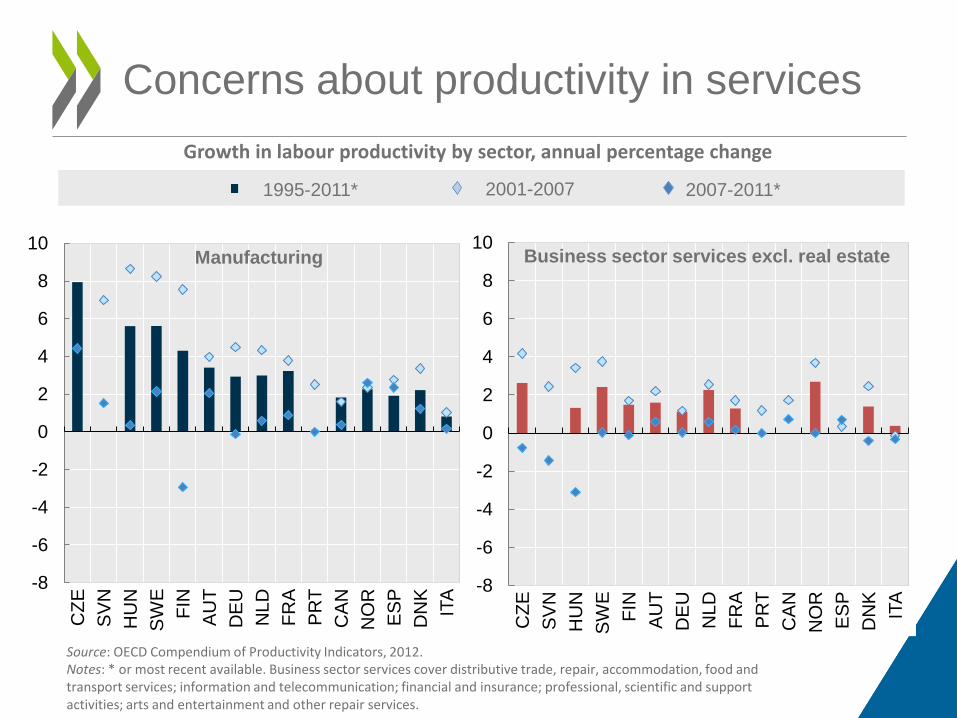
Concerns about productivity in services Growth in labour productivity by sector, annual percentage change
-8
-6
-4
-2
0
2
4
6
8
10
CZE
S
VN
H
UN
S
WE
FI
N
AU
T D
EU
N
LD
FRA
P
RT
CA
N
NO
R
ES
P
DN
K
ITA
-8
-6
-4
-2
0
2
4
6
8
10
CZE
S
VN
H
UN
S
WE
FI
N
AU
T D
EU
N
LD
FRA
P
RT
CA
N
NO
R
ES
P
DN
K
ITA
Manufacturing Business sector services excl. real estate
1995-2011* 2001-2007 2007-2011*
Source: OECD Compendium of Productivity Indicators, 2012. Notes: * or most recent available. Business sector services cover distributive trade, repair, accommodation, food and transport services; information and telecommunication; financial and insurance; professional, scientific and support activities; arts and entertainment and other repair services.

• Review existing data sources and indicators for R&D and innovation in services: assess strengths and weaknesses
• Provide new policy-relevant evidence on the nature of R&D and innovation in services
• Draw lessons for improving the R&D and innovation measurement framework
Project objectives
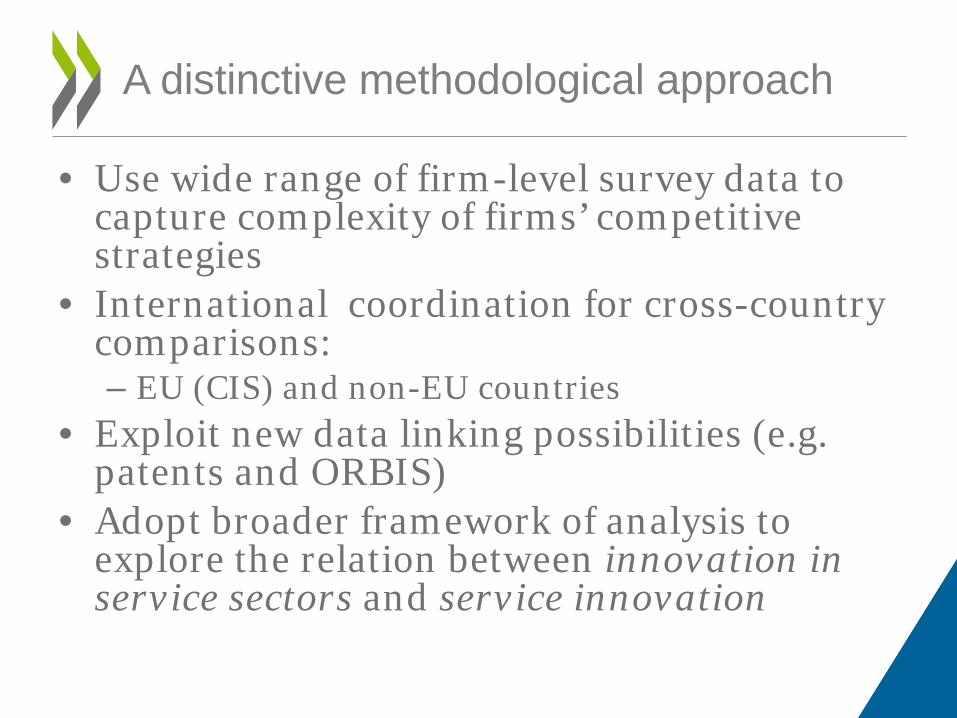
• Use wide range of firm-level survey data to capture complexity of firms’ competitive strategies
• International coordination for cross-country comparisons: – EU (CIS) and non-EU countries
• Exploit new data linking possibilities (e.g. patents and ORBIS)
• Adopt broader framework of analysis to explore the relation between innovation in service sectors and service innovation
A distinctive methodological approach
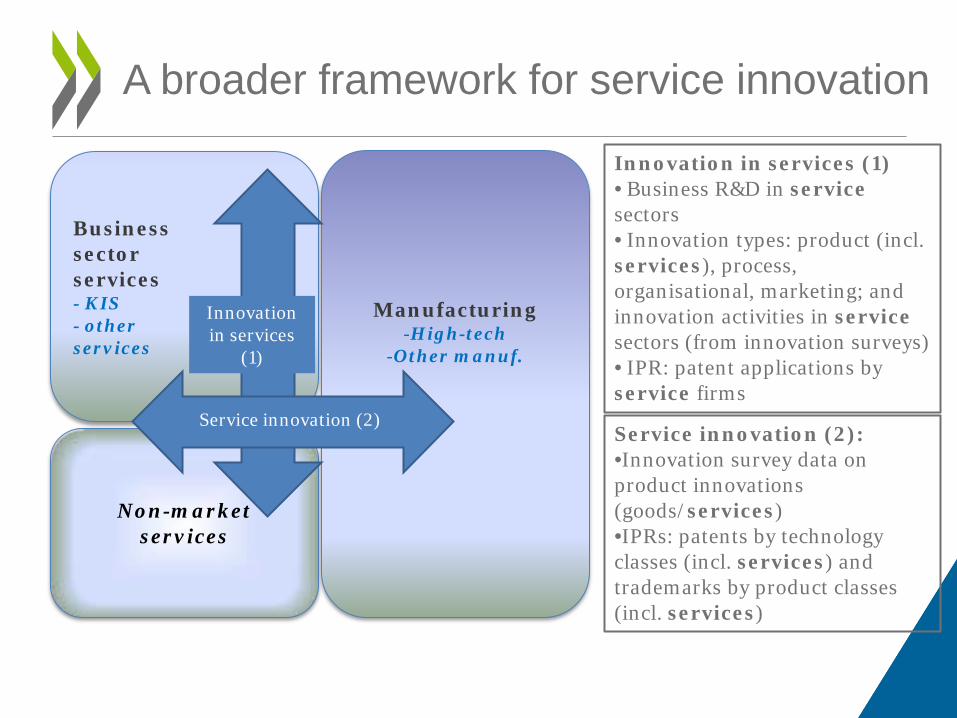
A broader framework for service innovation
Business sector services - KIS - other services
Non-market services
Manufacturing -High-tech
-Other manuf.
Innovation in services
(1)
Service innovation (2)
Innovation in services (1) • Business R&D in service sectors • Innovation types: product (incl. services), process, organisational, marketing; and innovation activities in service sectors (from innovation surveys) • IPR: patent applications by service firms
Service innovation (2): •Innovation survey data on product innovations (goods/services) •IPRs: patents by technology classes (incl. services) and trademarks by product classes (incl. services)

R&D IN SERVICES
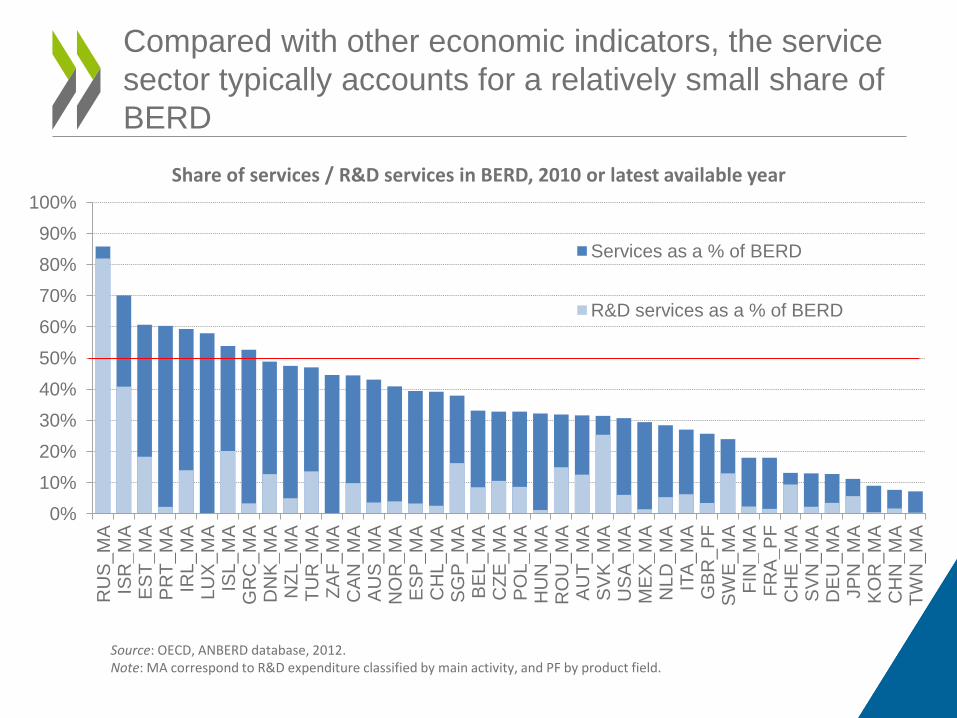
Compared with other economic indicators, the service sector typically accounts for a relatively small share of BERD
Share of services / R&D services in BERD, 2010 or latest available year
Source: OECD, ANBERD database, 2012. Note: MA correspond to R&D expenditure classified by main activity, and PF by product field.
0%
10%
20%
30%
40%
50%
60%
70%
80%
90%
100%
RU
S_M
A
ISR
_MA
E
ST_
MA
P
RT_
MA
IR
L_M
A
LUX
_MA
IS
L_M
A
GR
C_M
A
DN
K_M
A
NZL
_MA
TU
R_M
A
ZAF_
MA
C
AN
_MA
A
US
_MA
N
OR
_MA
E
SP
_MA
CH
L_M
A
SG
P_M
A B
EL_
MA
CZE
_MA
P
OL_
MA
H
UN
_MA
R
OU
_MA
A
UT_
MA
S
VK
_MA
US
A_M
A
ME
X_M
A
NLD
_MA
IT
A_M
A
GB
R_P
F S
WE
_MA
FI
N_M
A
FRA
_PF
CH
E_M
A
SV
N_M
A
DE
U_M
A
JPN
_MA
K
OR
_MA
C
HN
_MA
TW
N_M
A
Services as a % of BERD
R&D services as a % of BERD

-4 -2 0 2 4 6 8
10 12 14 16
FIN
K
OR
A
UT
ES
T JP
N
SV
N
PR
T D
EU
H
UN
C
ZE
AU
S
ES
P
BE
L C
AN
IT
A
ME
X
GR
C
NLD
IR
L P
OL
FRA
S
WE
N
OR
G
BR
Between-sector changes Within changes in non-service sectors Within changes in services Total changes
While the structural shift to less R&D-intensive sectors reduces headline R&D intensity, R&D intensity within services is increasing
Decomposition of R&D intensity changes Basis points, 1995-2009 (or closest year available) yearly average
Source: OECD calculations based on STAN and ANBERD, 2012.

Innovation is broader than R&D, particularly in services…
Share of firms with internal R&D activities among product innovating firms, by broad sector, 2006-2008
0
10
20
30
40
50
60
70
80
90
100
FIN SVN DEU FRA SWE NLD BEL CZE NOR HUN EST AUT ESP PRT SVK IRL ITA AUS
Manufacturing Services %
Source: OECD calculations based on European Commission, Eurostat, 2008 Community Innovation Survey, microdata, 2012 and national innovation surveys from Australia, Austria and Belgium Note: Weighted.

INNOVATION IN THE SERVICE SECTOR… AND SERVICE INNOVATION ACROSS THE ECONOMY

Innovation rates in KIS are close to those in high-tech manufacturing
Share of firms introducing product, process, organisational or marketing innovation by sector category, 2006-2008
0
10
20
30
40
50
60
70
80
90
High-tech manufacturing Other manufacturing
Knowledge-intensive services Other services %
Source: OECD calculations based on CIS 2008 microdata (Eurostat), 2012 and national innovation surveys from Australia, Austria and Belgium. Note: Weighted
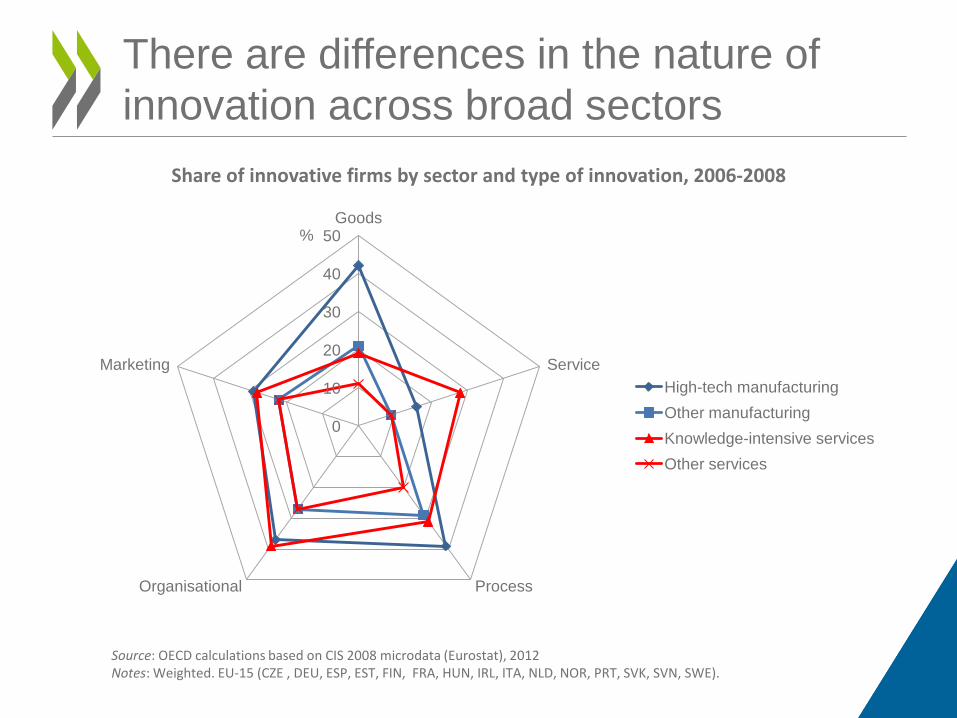
0
10
20
30
40
50 Goods
Service
Process Organisational
Marketing High-tech manufacturing Other manufacturing Knowledge-intensive services Other services
%
There are differences in the nature of innovation across broad sectors
Share of innovative firms by sector and type of innovation, 2006-2008
Source: OECD calculations based on CIS 2008 microdata (Eurostat), 2012 Notes: Weighted. EU-15 (CZE , DEU, ESP, EST, FIN, FRA, HUN, IRL, ITA, NLD, NOR, PRT, SVK, SVN, SWE).

Service innovation also takes place in manufacturing and tends to co-occur with goods innovation
Share of product innovating firms that innovate in goods only, in service only or both in goods and in service, by broad sector and country, 2006-2008
0
20
40
60
80
100
Man
ufac
turin
g S
ervi
ces
Man
ufac
turin
g S
ervi
ces
Man
ufac
turin
g S
ervi
ces
Man
ufac
turin
g S
ervi
ces
Man
ufac
turin
g S
ervi
ces
Man
ufac
turin
g S
ervi
ces
Man
ufac
turin
g S
ervi
ces
Man
ufac
turin
g S
ervi
ces
Man
ufac
turin
g S
ervi
ces
Man
ufac
turin
g S
ervi
ces
Man
ufac
turin
g S
ervi
ces
Man
ufac
turin
g S
ervi
ces
Man
ufac
turin
g S
ervi
ces
Man
ufac
turin
g S
ervi
ces
Man
ufac
turin
g S
ervi
ces
Man
ufac
turin
g S
ervi
ces
Man
ufac
turin
g S
ervi
ces
Man
ufac
turin
g S
ervi
ces
AUS AUT BEL CZE DEU ESP EST FIN FRA HUN IRL ITA NLD NOR PRT SVK SVN SWE
Goods only Goods and service Service only %
Source: OECD calculations based on CIS 2008 microdata (Eurostat), 2012 and national innovation surveys from Australia, Austria and Belgium. Note: Weighted.

Some manufacturing sectors are among the most likely to introduce new services
Sector relative likelihood of innovating by type of innovation, 2006-2008
-1.5 -1
-0.5 0
0.5 1
1.5 ICT services
Scientific and technical services
Finance and insurances
Computer and electrical equipment
Machinery and equipment
Coke, petroleum, chemicals
Manufacturing n.e.c.
Wood, pulp, paper, publishing, printing
Rubber and plastics Wholesale, retail trade Transportation
Pharmaceuticals
Basic metals, metal production
Motor vehicles
Other transport equipment
Textiles, apparel, leather
Food, beverages, tobacco
Goods Service Product or process Organisational Marketing
Source: OECD calculations based on CIS 2008 microdata (Eurostat), 2012 Notes: Weighted. EU-16 (CZE , DEU, ESP, EST, FIN, FRA, HUN, IRL, ITA, LUX, NLD, NOR, PRT, SVK, SVN, SWE). Marginal effect of sector on the probability of innovating, controlling for size, belonging to a group/to a multinational and country - baseline=Food, beverage and tobacco. Sectors are ordered according to their relative likelihood of introducing service innovation.

SERVICE INNOVATION ROLE IN FIRMS’ INNOVATION STRATEGIES

Service innovation plays a central role in the innovation strategies of firms
Multi-dimensional scaling of innovation types and activities, 2006-2008
Source: OECD calculations based on CIS 2008 microdata (Eurostat), 2012 Notes : Unweighted. EU-16 (CZE , DEU, ESP, EST, FIN, FRA, HUN, IRL, ITA, LUX, NLD, NOR, PRT, SVK, SVN, SWE).
good service
methods
logistic
supporting activities
abandoned
ongoing
business practices work responsibilities
external relations
design/packaging promotion
placement pricing
internal R&D
external R&D
capital
external knowledge
training
market introduction
other activities
-0.2
-0.15
-0.1
-0.05
0
0.05
0.1
-0.15 -0.1 -0.05 0 0.05 0.1 0.15 0.2 technological
product/marketing
process/organisation
non-technological
product innovations process innovations ongoing or abandoned organisational innovations marketing innovations innovation expenditure
Service innovation uniformly co-occurs with multiple types of innovation

0 0.5
1 1.5
2 2.5
3
Pdt- goods
Pdt- service Mkt-
design Mkt-
placement Mkt-
promotion Pcs- methods
Mkt- pricing
Org- work respons…
Org- external …
Org- busines…
Pcs- logistics
Pcs- supporti…
Increase range of goods or services
0 0.5
1 1.5
2 Pdt- goods
Pcs- methods
Mkt- design
Org- busines…
Pcs- supporti…
Org- work responsi…
Mkt- pricing
Pdt- service
Org- external …
Pcs- logistics
Mkt- promotion
Mkt- placement
Replace outdated products or processes
0 0.5
1 1.5
2 2.5 Pdt- goods
Pdt- service
Mkt- placement
Org- external … Mkt-
design Pcs-
methods Mkt-
promotion
Mkt- pricing
Org- work responsi…
Org- busines…
Pcs- logistics
Pcs- supporti…
Enter new markets
0 0.5
1 1.5
2 2.5 Pdt- goods
Mkt- design
Pdt- service
Mkt- placement
Mkt- promotion
Mkt- pricing
Pcs- methods
Org- work responsi…
Org- busines…
Org- external …
Pcs- logistics
Pcs- supporti…
Increase market share
0
0.5
1
1.5
Pcs- methods
Pdt- goods Org-
busines… Pdt-
service Mkt-
design Org- work responsi…
Mkt- promotion
Pcs- logistics
Mkt- pricing
Pcs- supporti…
Mkt- placement
Org- external …
Improve quality of goods or services
0 0.5
1 1.5
2
Pcs- methods
Org- busines…
Pcs- supporti…
Pcs- logistics
Org- work responsi…
Pdt- service
Mkt- pricing
Mkt- design
Org- external …
Mkt- promotion
Mkt- placement
Pdt- goods
Improve flexibility for producing goods or services
Service innovation is related to a wide range of objectives
Relationship between innovation types and various innovation objectives, 2006-2008
Source: OECD calculations based on CIS 2008 microdata (Eurostat), 2012 Notes: Unweighted. EU-16 (CZE , DEU, ESP, EST, FIN, FRA, HUN, IRL, ITA, LUX, NLD, NOR, PRT, SVK, SVN, SWE). Proportional odds ratios obtained from ordered logistic regressions performed on the level of importance (high, medium, low, not relevant) given by firms to different innovation objectives for product (goods or service) or process innovations activities, on the sample of innoactive firms (firms with product or process innovation, or ongoing/abandoned activities for product or process innovation).

THE OPENNESS OF INNOVATION IN SERVICES

When introducing new products or processes, firms in services are more likely to rely on external inputs for development
Share of product and process innovating firms whose innovation was developed by or with others, by sector category, 2006-2008
Source: OECD calculations based on CIS 2008 microdata (Eurostat), 2012 Note: Weighted. EU-14 (CZE , DEU, ESP, EST, FIN, FRA, HUN, ITA, NLD, NOR, PRT, SVK, SVN, SWE).
0 5
10 15 20 25 30 35 40 45 50
High-tech manufacturing
Other manufacturing Knowledge-intensive services
Other services
Product innovation Process innovation %
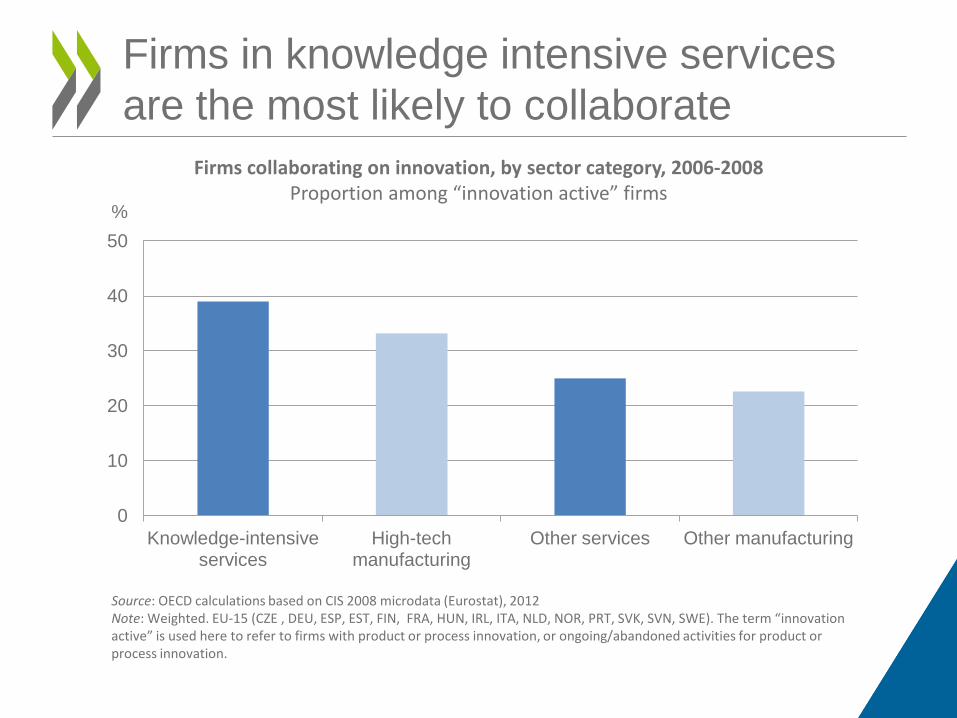
Firms in knowledge intensive services are the most likely to collaborate
Firms collaborating on innovation, by sector category, 2006-2008 Proportion among “innovation active” firms
0
10
20
30
40
50
Knowledge-intensive services
High-tech manufacturing
Other services Other manufacturing
%
Source: OECD calculations based on CIS 2008 microdata (Eurostat), 2012 Note: Weighted. EU-15 (CZE , DEU, ESP, EST, FIN, FRA, HUN, IRL, ITA, NLD, NOR, PRT, SVK, SVN, SWE). The term “innovation active” is used here to refer to firms with product or process innovation, or ongoing/abandoned activities for product or process innovation.
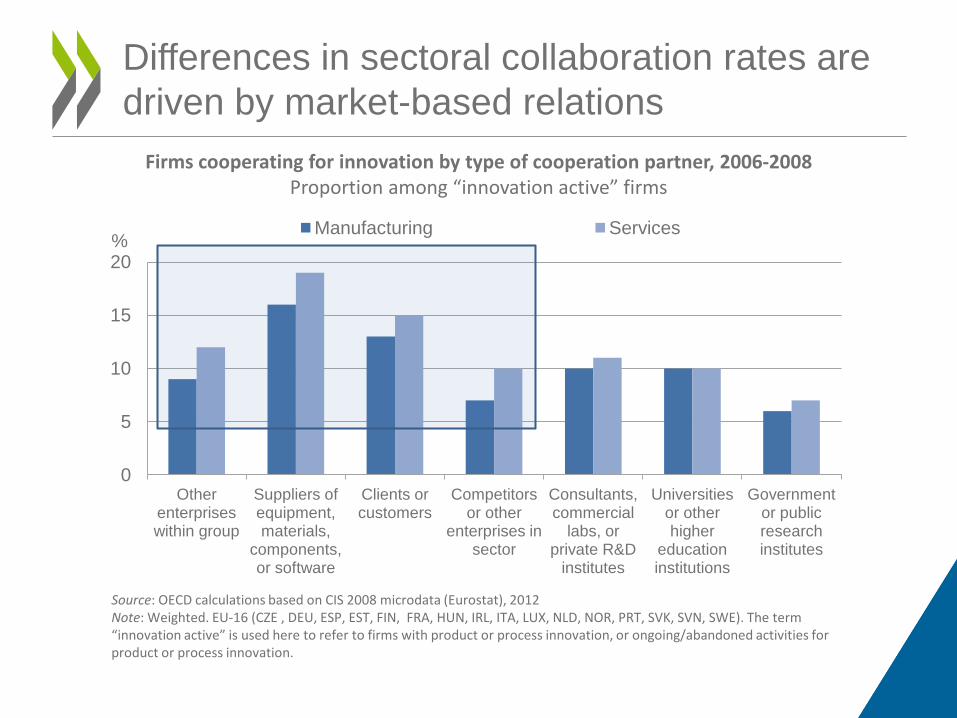
Differences in sectoral collaboration rates are driven by market-based relations
Firms cooperating for innovation by type of cooperation partner, 2006-2008 Proportion among “innovation active” firms
0
5
10
15
20
Other enterprises within group
Suppliers of equipment, materials,
components, or software
Clients or customers
Competitors or other
enterprises in sector
Consultants, commercial
labs, or private R&D
institutes
Universities or other higher
education institutions
Government or public research institutes
Manufacturing Services %
Source: OECD calculations based on CIS 2008 microdata (Eurostat), 2012 Note: Weighted. EU-16 (CZE , DEU, ESP, EST, FIN, FRA, HUN, IRL, ITA, LUX, NLD, NOR, PRT, SVK, SVN, SWE). The term “innovation active” is used here to refer to firms with product or process innovation, or ongoing/abandoned activities for product or process innovation.

IMPACTS OF SERVICE INNOVATION ON PERFORMANCE

Service innovation is positively related to firms’ performance
Effect of different types of innovation on employment growth, 2006-2008
Source: OECD calculations based on CIS 2008 microdata (Eurostat), 2012 Note: Weighted. EU-16 (CZE , DEU, ESP, EST, FIN, FRA, HUN, IRL, ITA, LUX, NLD, NOR, PRT, SVK, SVN, SWE). Marginal effects obtained from OLS regressions performed on firms' employment growth rates between 2006 and 2008 controlling for size, country, and belonging to a domestic/multinational group. All innovation types are introduced jointly in the regression. White bars correspond to non-significant coefficients (at 5 % level).
-0.04
-0.02
0
0.02
0.04
0.06
0.08
Goods Process Service Organisational Marketing
All sample High-tech manufacturing Other manufacturing Knowledge-intensive services Other services

Do service innovation activities also benefit competitors?
Implied “impacts” of various types of innovation by other firms within same sector, 2006-2008
-0.3
-0.2
-0.1
0
0.1
0.2
0.3
0.4
Goods innovation spillovers
Service innovation spillovers
Product-process innovation spillovers
Marketing innovation spillovers
Organisational innovation spillovers
Internal R&D activity
spillovers
All sample High-tech manufacturing Other manufacturing
Knowledge-intensive services Other services
Source: OECD calculations based on CIS 2008 microdata (Eurostat), 2012 Notes: Weighted. EU-16 (CZE , DEU, ESP, EST, FIN, FRA, HUN, IRL, ITA, LUX, NLD, NOR, PRT, SVK, SVN, SWE). The bars correspond to the marginal effects of “spillovers” on firms' likelihood to introduce the corresponding innovation type or to engage in the corresponding activity. “Spillovers” were calculated as the weighted average share of firms introducing the corresponding innovation type or engaging in the corresponding innovation activity among other firms in the same sector (NACE rev. 2 at 2 digit level). White bars correspond to non-significant coefficients (at 5 % level).

FORMS OF PROTECTION OF SERVICE-BASED INNOVATION

How do service firms protect their innovations?
Share of firms using various intellectual property rights by sector category
Source: OECD calculations based on CIS 2006 microdata (Eurostat), 2012 Note: Weighted. EU-10 (CZE, ESP, EST, GRC, HUN, IRL, LUX, NOR, PRT, SVK). The shares correspond respectively to firms that have applied for a patent, registered an industrial design, registered a trademark or claimed copyright during the three years 2004 to 2006.
0%
2%
4%
6%
8%
10%
12%
14%
16%
High-tech manufacturing
Other manufacturing KIS Other services
Patents Designs Trademarks Copyright
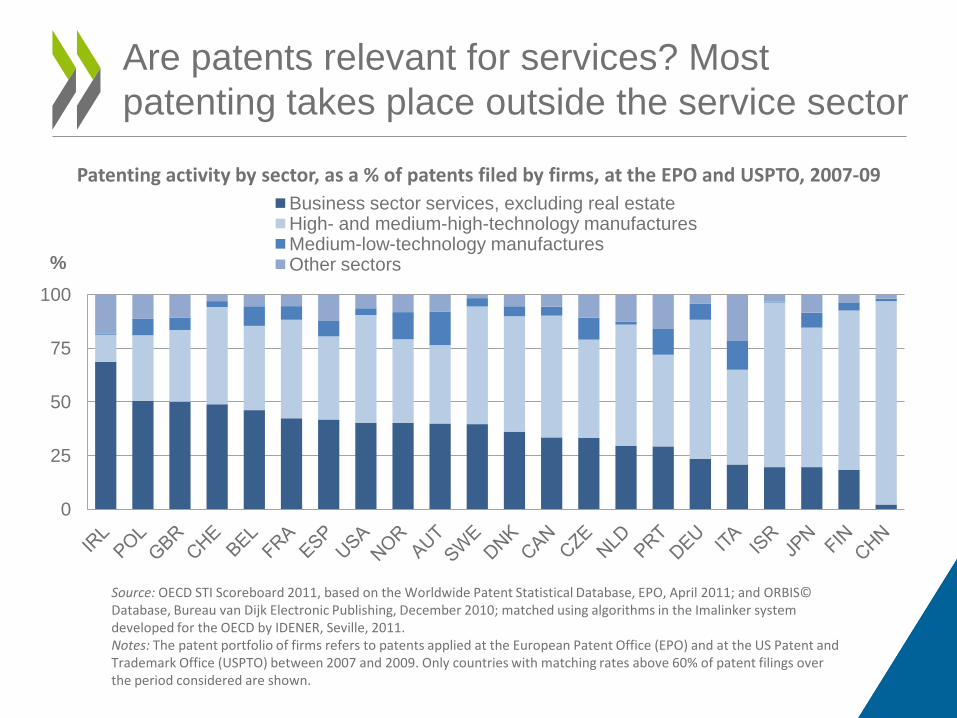
Are patents relevant for services? Most patenting takes place outside the service sector
Patenting activity by sector, as a % of patents filed by firms, at the EPO and USPTO, 2007-09
0
25
50
75
100
%
Business sector services, excluding real estate High- and medium-high-technology manufactures Medium-low-technology manufactures Other sectors
Source: OECD STI Scoreboard 2011, based on the Worldwide Patent Statistical Database, EPO, April 2011; and ORBIS© Database, Bureau van Dijk Electronic Publishing, December 2010; matched using algorithms in the Imalinker system developed for the OECD by IDENER, Seville, 2011. Notes: The patent portfolio of firms refers to patents applied at the European Patent Office (EPO) and at the US Patent and Trademark Office (USPTO) between 2007 and 2009. Only countries with matching rates above 60% of patent filings over the period considered are shown.

Service trademarks are widely used, often in combination with goods
Trademark applications designating goods and/or service classes by country, 2006-2008 As a percentage of trade mark applications at the OHIM and USPTO
0 10 20 30 40 50 60 70 80 90
100
SV
N
ES
P
SV
K
CZE
LU
X E
ST
FIN
A
UT
GB
R
PO
L N
OR
E
U27
N
LD
IRL
HU
N
DE
U
US
A
BE
L G
RC
O
EC
D
DN
K
RU
S
PR
T SW
E
FRA
IN
D
CA
N
ISL
BR
A
CH
E
ITA
A
US
N
ZL
ME
X TU
R
ZAF
ISR
K
OR
B
RIIC
S
CH
L JP
N
CH
N
IDN
Goods only Goods and services Service only %
Source: OECD calculations based on United States Patent and Trademark Office Bulk Downloads: Trademark Application Text hosted by Google cloud (http://www.google.com/googlebooks/uspto-trademarks.html), and OHIM Community Trademark Database; CTM Download, 2011.

BARRIERS TO SERVICE INNOVATION AND PUBLIC SUPPORT

Relative to high tech manufacturing, firms in service sector tend to report fewer or similar obstacles to innovation
Relative likelihood of reporting hampering factors as important by sector, 2004-2006
-0.5 -0.4 -0.3 -0.2 -0.1
0 0.1 0.2 0.3
Lack of funds within enterprise
Lack of finance from outside
Innovation costs too high
Lack of qualified personnel
Lack of information on technology
Lack of information on markets
Difficulty in finding cooperation partners
Market dominated by established enterprises
Uncertain demand for innovation
No need due to prior innovation
No need because of no demand for innovation
High-tech manufacturing Other manufacturing KIS Other services
Source:: OECD calculations based on CIS 2006 microdata (Eurostat), 2012 Note: Weighted. EU-11 (CZE, ESP, EST, GRC, HUN, IRL, LUX, NOR, PRT, SVK, SWE). Marginal effect of belonging to each sector category on the probability to consider each hampering factor as of medium or high importance, obtained from probit model regressions run on each hampering factor. Baseline=High-tech manufacturing.
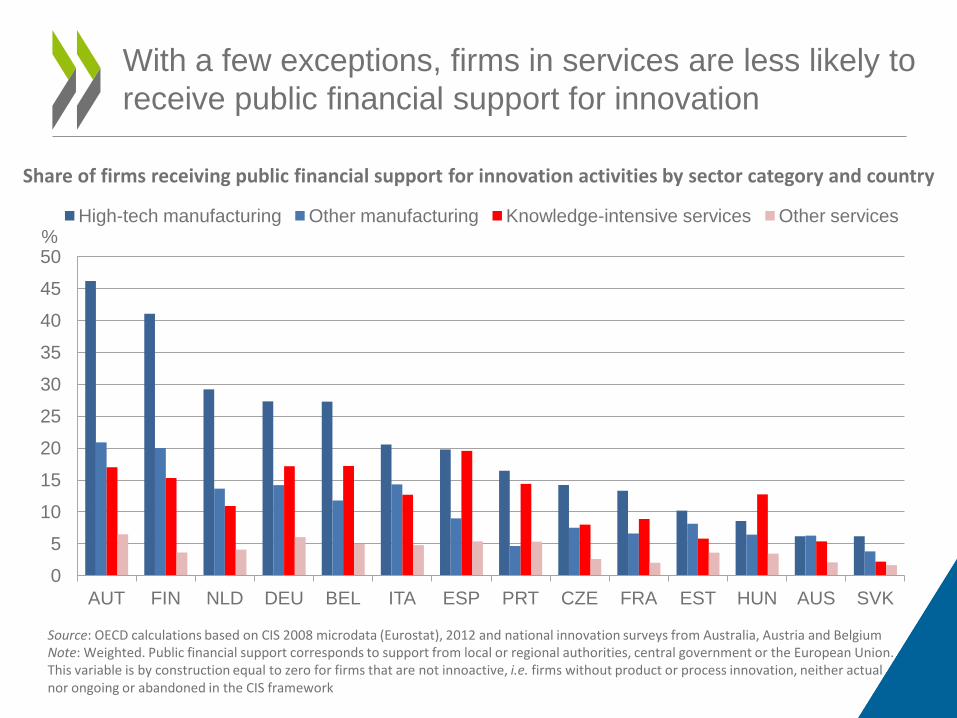
With a few exceptions, firms in services are less likely to receive public financial support for innovation
Share of firms receiving public financial support for innovation activities by sector category and country
0
5
10
15
20
25
30
35
40
45
50
AUT FIN NLD DEU BEL ITA ESP PRT CZE FRA EST HUN AUS SVK
High-tech manufacturing Other manufacturing Knowledge-intensive services Other services %
Source: OECD calculations based on CIS 2008 microdata (Eurostat), 2012 and national innovation surveys from Australia, Austria and Belgium Note: Weighted. Public financial support corresponds to support from local or regional authorities, central government or the European Union. This variable is by construction equal to zero for firms that are not innoactive, i.e. firms without product or process innovation, neither actual nor ongoing or abandoned in the CIS framework

The sectoral public funding for innovation gap has narrowed slightly over time in most countries
Relative likelihood of manufacturing firms to receive public financial support compared to services in 2004-2006 and 2008-2010
Source: OECD calculations based on Eurobase CIS 2010 and CIS 2006 microdata (Eurostat), 2012 Notes: Unweighted. The points represent the ratio of the share of innoactive firms receiving public financial support in manufacturing to those in services in the corresponding countries and years. Innoactive firms are those with product or process innovation, or ongoing/abandoned activities for product or process innovation.
BEL CZE
DEU EST
ESP
LUX
HUN
NLD
POL PRT
SVK
0
1
2
3
4
5
0 1 2 3 4 5
2008
-201
0
2004-2006

The sectoral distribution of R&D tax incentives resembles that of business R&D spending
Proportion of services in BERD and R&D tax incentives, 2008 (or nearest year)
0
10
20
30
40
50
60
70
GBR CAN FRA USA CZE NDL JPN
Share of services in business R&D, main activity Share of R&D tax incentives to service sector
Source: OECD/NESTI R&D tax incentives questionnaire, MSTI, RDS.

Public support is associated with higher rates of service innovation…
Effect of public support on the propensity of firms to introduce different types of innovations
-0.05
0
0.05
0.1
0.15
0.2
0.25
Product new to market
Product Goods Service Marketing Organisational Product or process
Source: OECD calculations based on CIS 2008 microdata (Eurostat), 2012 Note: Weighted. EU-13 (CZE , DEU, ESP, EST, FIN, FRA, HUN, ITA, LUX, NLD, PRT, SVK, SVN). Marginal effect of support on firms' likelihood to introduce different types of innovation, obtained from probit model regressions controlling for size, country and belonging to a domestic/multinational group. The regressions were run on the sample of innoactive firms, that is firms with product or process innovation, or ongoing/abandoned activities for product or process innovation. White bars correspond to coefficients that are not significant at the 5 % level.

KEY MESSAGES

1. The distinction between R&D and innovation is far more important in services. These two terms are too often confused in the debate.
2. Service innovation is widespread and takes place across all sectors. It has specific features of relevance to policy makers:
– It plays a pivotal role in business innovation strategies. – It is more reliant on external inputs and more collaborative than other types – Innovation relationships are primarily market-based, with suppliers,
customers and firms in same group and market. – Service sector companies use rather different mechanisms to appropriate the
benefits of their innovations
3. Service innovation is positively related to employment and turnover growth, and the evidence appears to be consistent with positive spillovers
4. Service firms do not report higher incidence of barriers to innovation, but the data suggest limited awareness among less knowledge intensive services
5. Service firms less likely to receive public support for innovation, which is mainly oriented towards R&D.
Preliminary conclusions from the analysis


