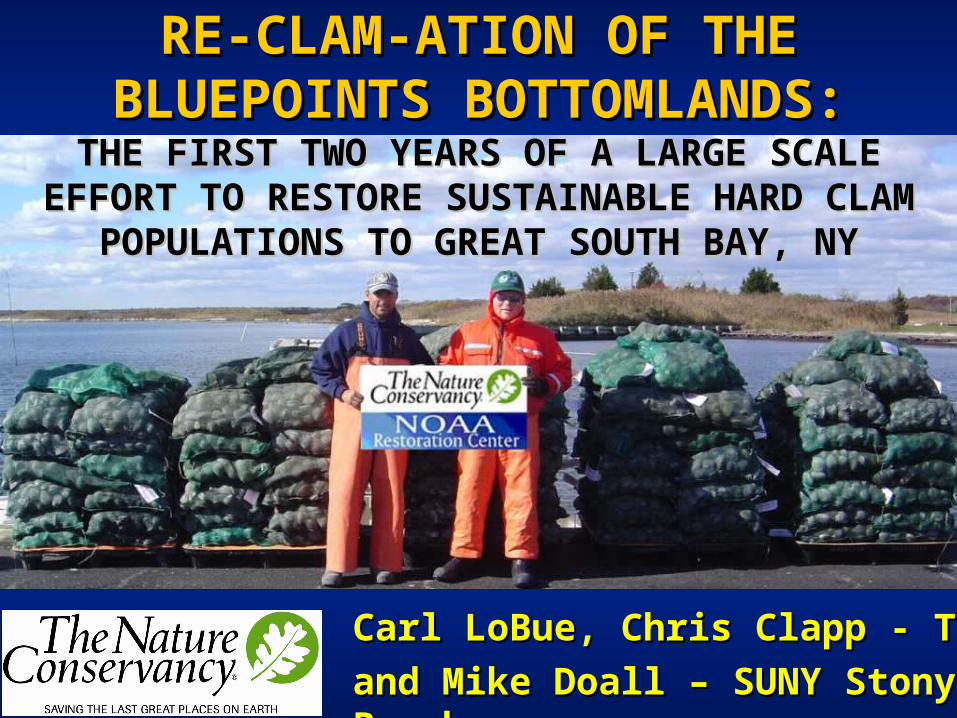
RE-CLAM-ATION OF THE RE-CLAM-ATION OF THE BLUEPOINTS BOTTOMLANDS: BLUEPOINTS BOTTOMLANDS: THE FIRST TWO YEARS OF A LARGE SCALE THE FIRST TWO YEARS OF A LARGE SCALE EFFORT TO RESTORE SUSTAINABLE HARD CLAM EFFORT TO RESTORE SUSTAINABLE HARD CLAM POPULATIONS TO GREAT SOUTH BAY, NY POPULATIONS TO GREAT SOUTH BAY, NY Carl LoBue, Chris Clapp - T Carl LoBue, Chris Clapp - TN and Mike Doall – SUNY Stony and Mike Doall – SUNY Stony Brook Brook
Transcript
RE-CLAM-ATION OF THE RE-CLAM-ATION OF THE BLUEPOINTS BOTTOMLANDS:BLUEPOINTS BOTTOMLANDS:THE FIRST TWO YEARS OF A LARGE SCALE THE FIRST TWO YEARS OF A LARGE SCALE
EFFORT TO RESTORE SUSTAINABLE HARD CLAM EFFORT TO RESTORE SUSTAINABLE HARD CLAM POPULATIONS TO GREAT SOUTH BAY, NYPOPULATIONS TO GREAT SOUTH BAY, NY
Carl LoBue, Chris Clapp - TNCCarl LoBue, Chris Clapp - TNC
and Mike Doall – SUNY Stony Brookand Mike Doall – SUNY Stony Brook
TNC’s interests in shellfish are based on TNC’s interests in shellfish are based on ecosystem services and their historic ecosystem services and their historic
dominance at our sitesdominance at our sitesNo clams 2 clams
4 clams
8 clams 16 clams
No clams 2 clams
4 clams
8 clams 16 clams
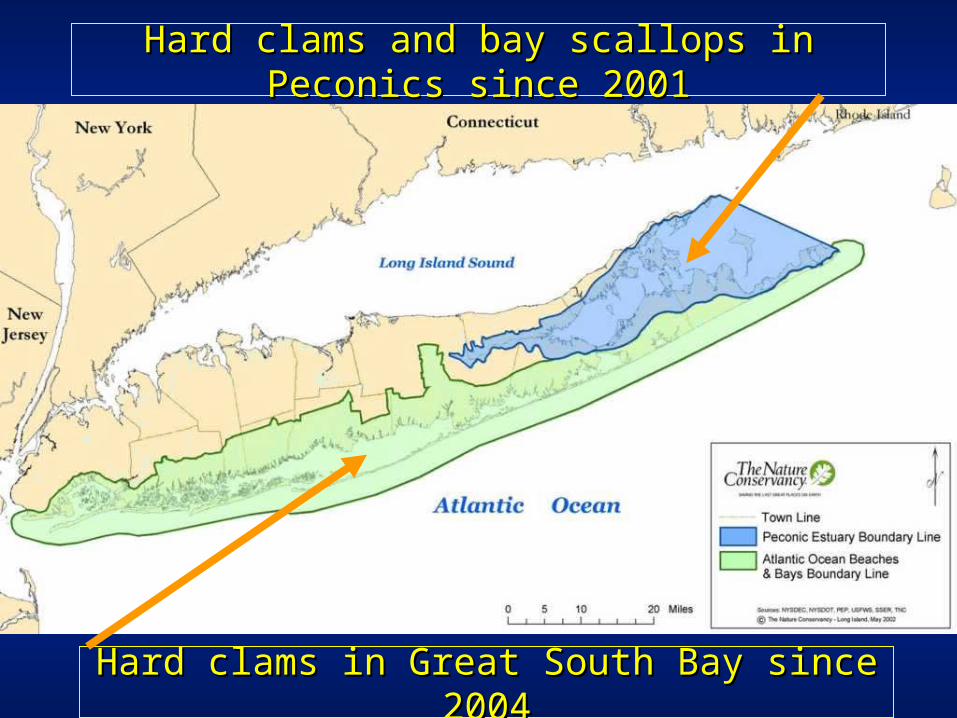
Hard clams and bay scallops in Peconics since 2001Hard clams and bay scallops in Peconics since 2001
Hard clams in Great South Bay since 2004Hard clams in Great South Bay since 2004
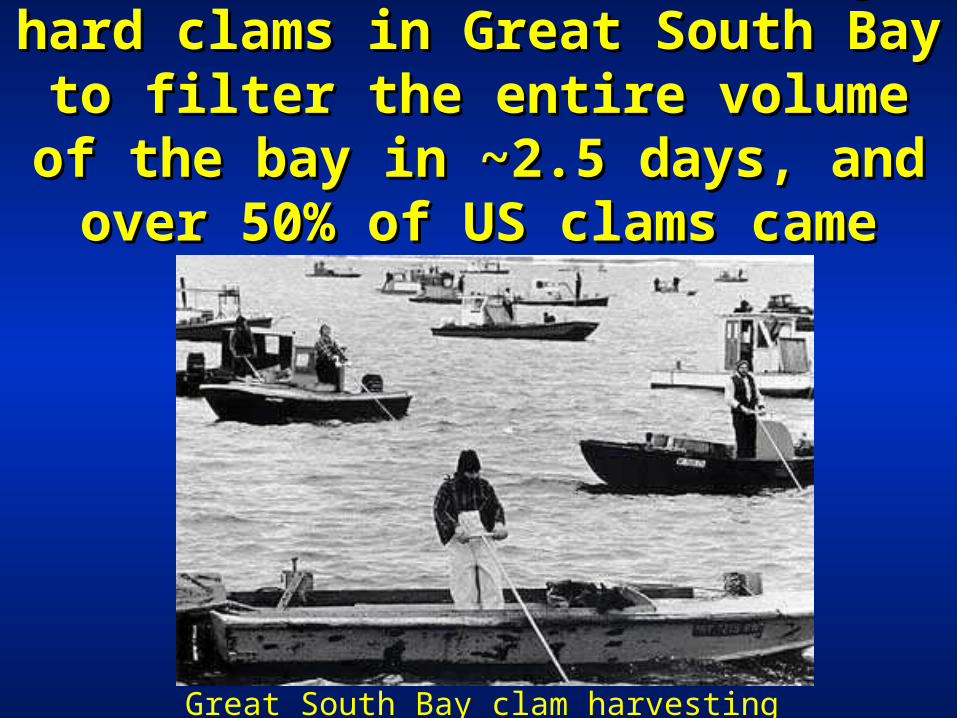
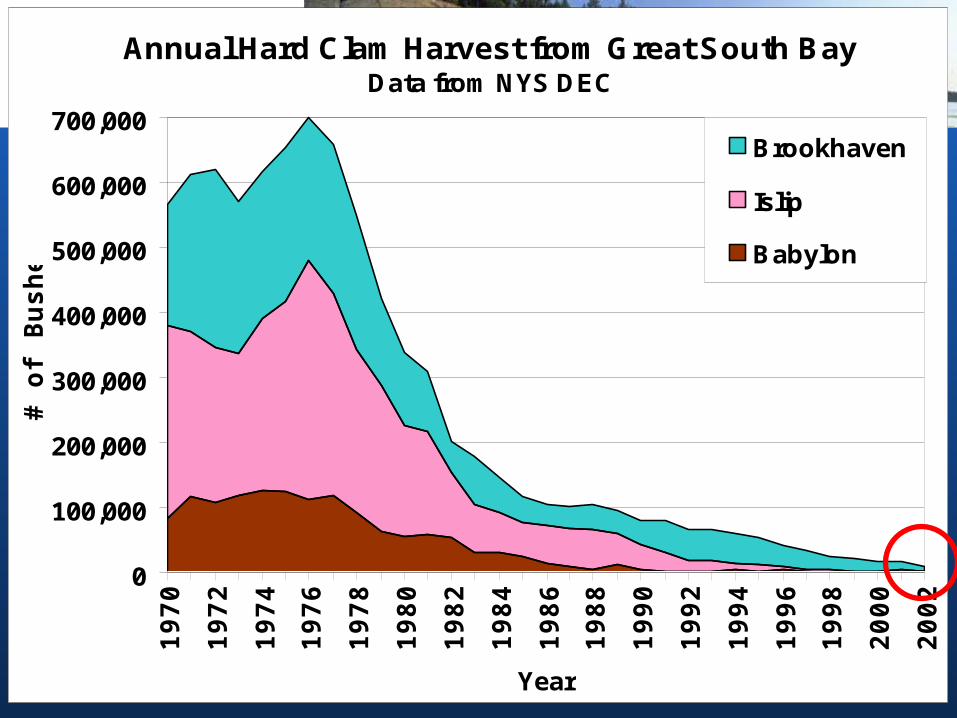
In 1970s, there were enough hard clams In 1970s, there were enough hard clams in Great South Bay to filter the entire in Great South Bay to filter the entire
volume of the bay in volume of the bay in ~~2.5 days, and over 2.5 days, and over 50% of US clams came from GSB50% of US clams came from GSB
Great South Bay clam harvesting circa 1970
Today harvest is down by over 98% and it takes clams ~36 days to filter the bay ~36 days to filter the bay
Annual Hard Clam Harvest from Great South BayData from NYS DEC
0
100,000
200,000
300,000
400,000
500,000
600,000
700,000
19
70
19
72
19
74
19
76
19
78
19
80
19
82
19
84
19
86
19
88
19
90
19
92
19
94
19
96
19
98
20
00
20
02
Year
# o
f B
us
he
ls
Brookhaven
Islip
Babylon
Brown tide 1985Brown tide 1985
Other shellfish Other shellfish have not have not replaced clamsreplaced clams
Apparent shift in Apparent shift in the composition the composition of dominant of dominant algal speciesalgal species
These 13,000 acres in central GSB, have been in private These 13,000 acres in central GSB, have been in private ownership for over 300 yearsownership for over 300 years
Much of New York’s bay bottom was Much of New York’s bay bottom was deeded prior to statehooddeeded prior to statehood
•The lands were used for The lands were used for private shellfishing and private shellfishing and aquaculture, including aquaculture, including mechanical harvest (since mechanical harvest (since 1912 by the Bluepoints Co.) 1912 by the Bluepoints Co.)
•Bluepoints Co. divested Bluepoints Co. divested from GSB in 2003from GSB in 2003
•In 2004 TNC completed In 2004 TNC completed purchase of all Bluepoints purchase of all Bluepoints Co. submerged land in NYCo. submerged land in NY
Large Scale Large Scale Shellfish SurveysShellfish Surveys
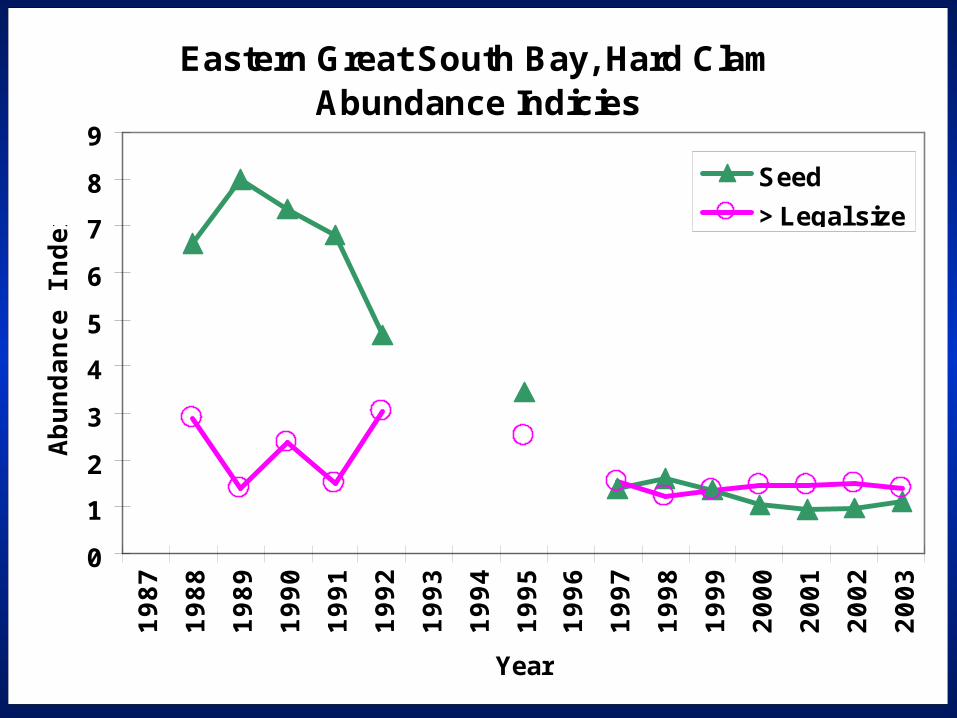
Eastern Great South Bay, Hard Clam Abundance Indicies
0
1
2
3
4
5
6
7
8
91
98
7
19
88
19
89
19
90
19
91
19
92
19
93
19
94
19
95
19
96
19
97
19
98
19
99
20
00
20
01
20
02
20
03
Year
Ab
un
da
nc
e In
de
x .
Seed
> Legal size
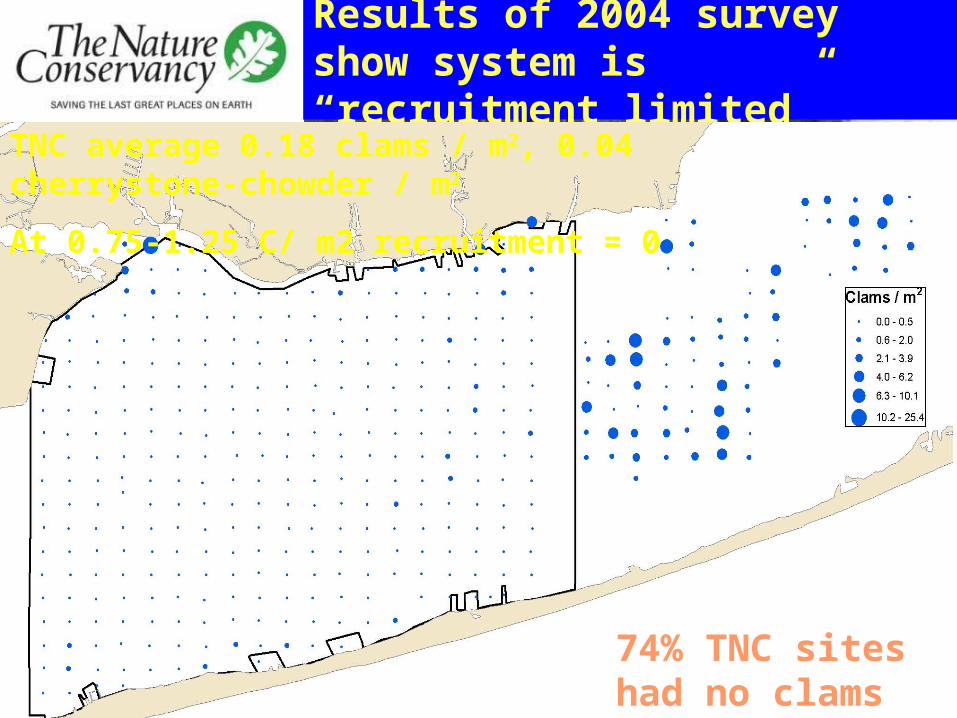
Results of 2004 survey show system is “recruitment limited”
74% TNC sites had no clams
TNC average 0.18 clams / m2, 0.04 cherrystone-chowder / m2
At 0.75-1.25 C/ m2 recruitment = 0
Annual Hard Clam Harvest from Great South BayData from NYS DEC
0
100,000
200,000
300,000
400,000
500,000
600,000
700,000
19
70
19
72
19
74
19
76
19
78
19
80
19
82
19
84
19
86
19
88
19
90
19
92
19
94
19
96
19
98
20
00
20
02
Year
# o
f B
us
he
ls
Brookhaven
Islip
Babylon
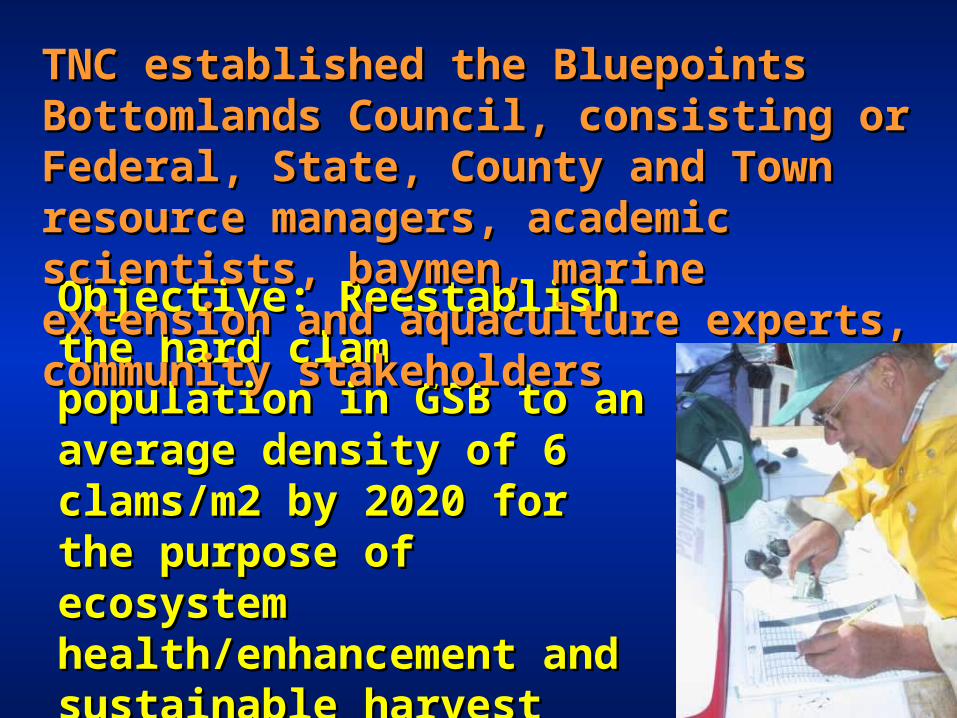
Objective: Reestablish the hard Objective: Reestablish the hard clam population in GSB to an clam population in GSB to an average density of 6 clams/m2 average density of 6 clams/m2 by 2020 for the purpose of by 2020 for the purpose of ecosystem health/enhancement ecosystem health/enhancement and sustainable harvestand sustainable harvest
TNC established the Bluepoints Bottomlands TNC established the Bluepoints Bottomlands Council, consisting or Federal, State, County Council, consisting or Federal, State, County and Town resource managers, academic and Town resource managers, academic scientists, baymen, marine extension and scientists, baymen, marine extension and aquaculture experts, community stakeholdersaquaculture experts, community stakeholders
1.1. Manually rebuild spawning potentialManually rebuild spawning potential2.2. Passively rebuild population by protecting natural Passively rebuild population by protecting natural
clam sets clam sets 3.3. Improve post-release survival of hatchery reared Improve post-release survival of hatchery reared
clamsclams4.4. Maximize survival through ecosystem-based Maximize survival through ecosystem-based
approaches to managing predationapproaches to managing predation5.5. Increase understanding of temporal changes in the Increase understanding of temporal changes in the
composition and concentration of nutrients in the composition and concentration of nutrients in the GSB, local and system-wide ecological effects from GSB, local and system-wide ecological effects from changes, and rank major nutrient sourceschanges, and rank major nutrient sources
6.6. If deemed necessary, mitigate thru SSERIf deemed necessary, mitigate thru SSER7.7. Assure that harvest management and enforcement Assure that harvest management and enforcement
are consistent with rebuilding and sustainabilityare consistent with rebuilding and sustainability8.8. Foster better community stewardshipFoster better community stewardship
Eight Broad StrategiesEight Broad Strategies
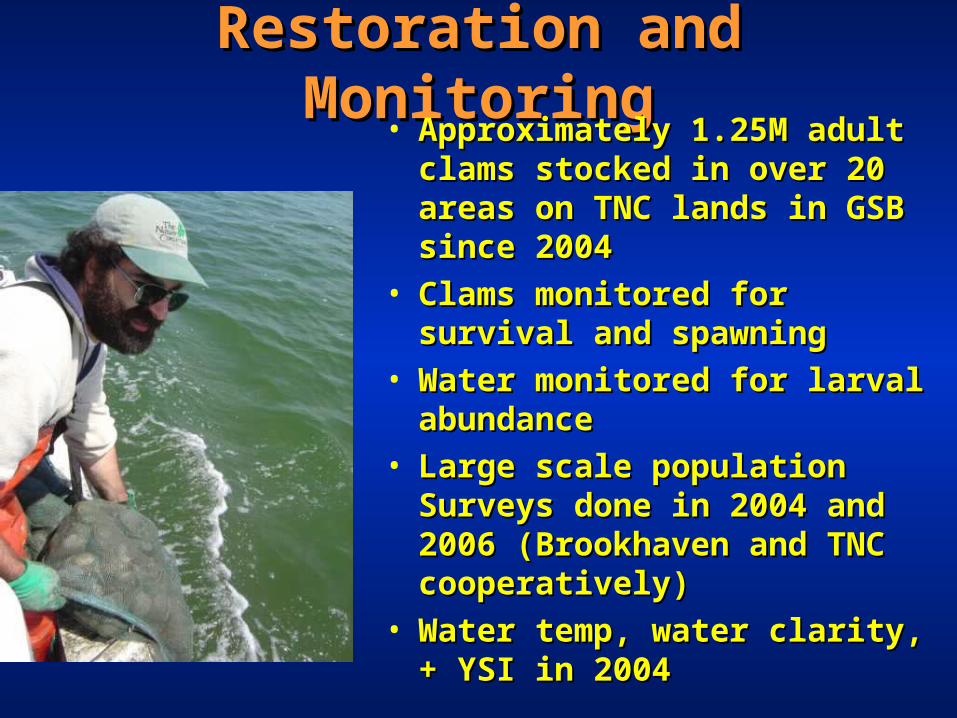
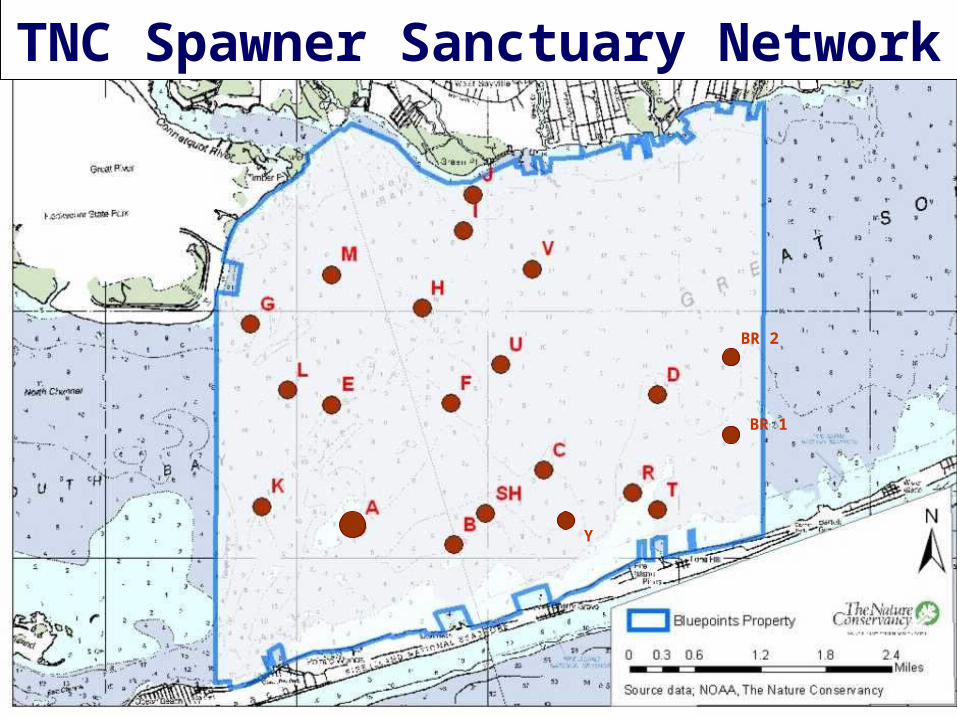
Restoration and MonitoringRestoration and Monitoring• Approximately 1.25M adult clams Approximately 1.25M adult clams
stocked in over 20 areas on TNC stocked in over 20 areas on TNC lands in GSB since 2004lands in GSB since 2004
• Clams monitored for survival and Clams monitored for survival and spawningspawning
• Water monitored for larval Water monitored for larval abundanceabundance
• Large scale population Surveys Large scale population Surveys done in 2004 and 2006 done in 2004 and 2006 (Brookhaven and TNC (Brookhaven and TNC cooperatively)cooperatively)
• Water temp, water clarity, + YSI in Water temp, water clarity, + YSI in 20042004
BR 1
Y
BR 2
TNC Spawner Sanctuary Network
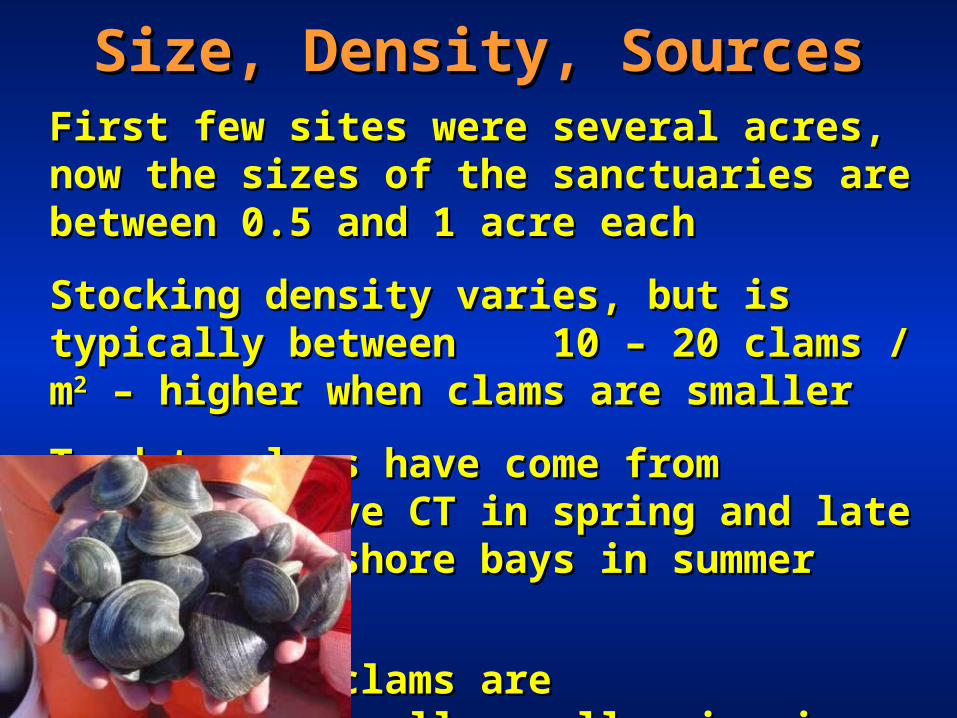
Size, Density, SourcesSize, Density, SourcesFirst few sites were several acres, now the sizes of First few sites were several acres, now the sizes of the sanctuaries are between 0.5 and 1 acre eachthe sanctuaries are between 0.5 and 1 acre each
Stocking density varies, but is typically between Stocking density varies, but is typically between 10 – 20 clams / m10 – 20 clams / m22 – higher when clams are smaller – higher when clams are smaller
To date clams have come from Greenwich Cove CT To date clams have come from Greenwich Cove CT in spring and late fall, north shore bays in summerin spring and late fall, north shore bays in summer
North shore clams are North shore clams are generally smaller in size generally smaller in size
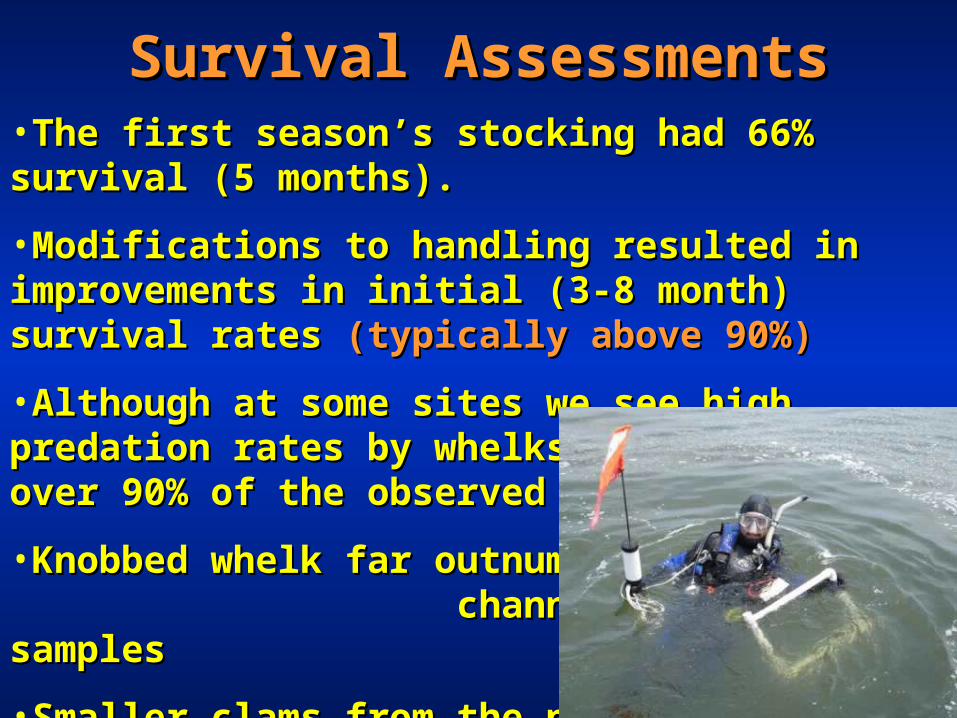
Survival AssessmentsSurvival Assessments•The first season’s stocking had 66% survival (5 months).The first season’s stocking had 66% survival (5 months).
•Modifications to handling resulted in improvements in Modifications to handling resulted in improvements in initial (3-8 month) survival rates initial (3-8 month) survival rates (typically above 90%)(typically above 90%)
•Although at some sites we see high predation rates by Although at some sites we see high predation rates by whelks, accounting for over 90% of the observed mortality whelks, accounting for over 90% of the observed mortality
•Knobbed whelk far outnumber Knobbed whelk far outnumber channel whelk in SCUBA sampleschannel whelk in SCUBA samples
•Smaller clams from the north Smaller clams from the north shore have higher mortality rates shore have higher mortality rates than large clams from than large clams from Greenwich CoveGreenwich Cove
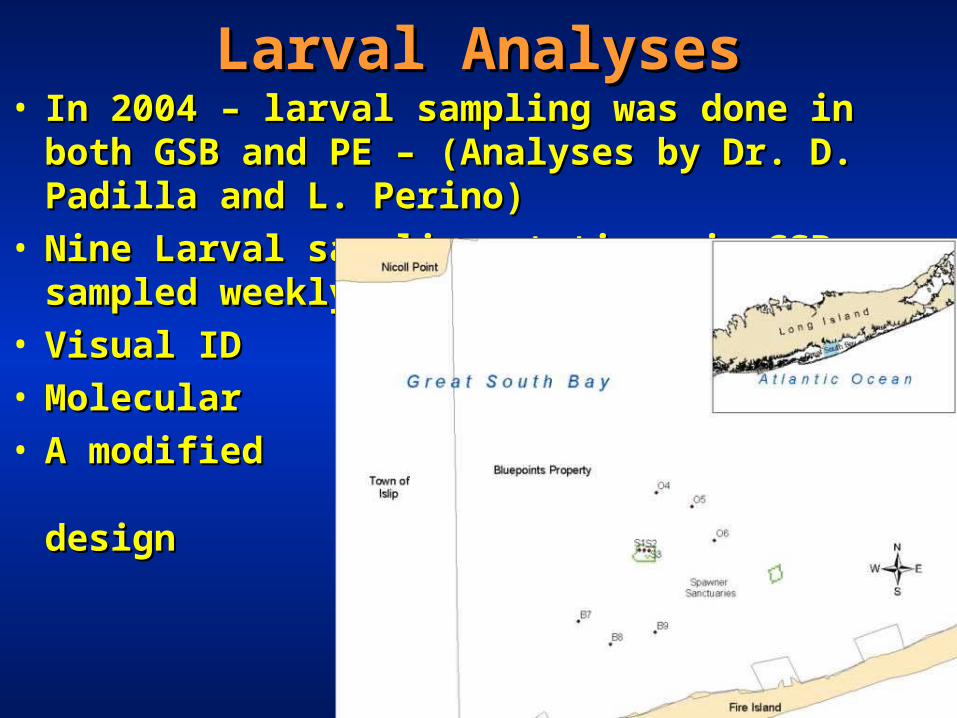
Larval AnalysesLarval Analyses• In 2004 – larval sampling was done in both GSB and PE In 2004 – larval sampling was done in both GSB and PE
– (Analyses by Dr. D. Padilla and L. Perino)– (Analyses by Dr. D. Padilla and L. Perino)• Nine Larval sampling stations in GSB, sampled weekly Nine Larval sampling stations in GSB, sampled weekly
May-OctoberMay-October• Visual ID Visual ID live, live,
preservedpreserved• MolecularMolecular• A modified A modified
sampling design sampling design continued in 2005continued in 2005
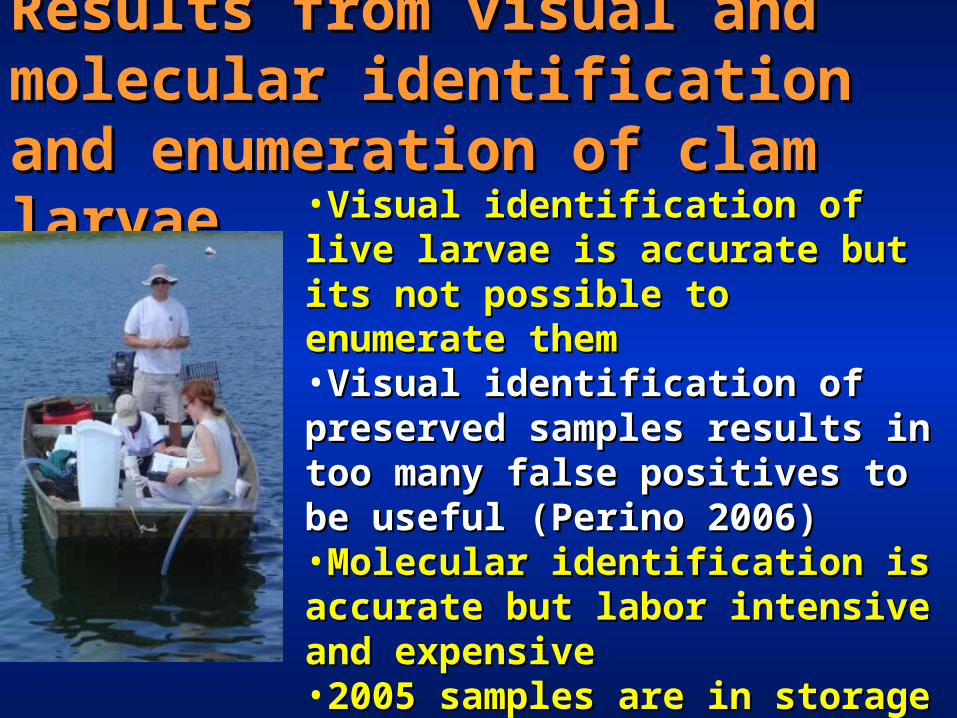
Results from visual and molecular Results from visual and molecular identification and enumeration of identification and enumeration of clam larvaeclam larvae •Visual identification of live larvae is Visual identification of live larvae is
accurate but its not possible to accurate but its not possible to enumerate themenumerate them•Visual identification of preserved Visual identification of preserved samples results in too many false samples results in too many false positives to be useful (Perino 2006)positives to be useful (Perino 2006)•Molecular identification is accurate but Molecular identification is accurate but labor intensive and expensivelabor intensive and expensive•2005 samples are in storage2005 samples are in storage•First appearance and duration of live First appearance and duration of live larvae in samples is consistent with CI larvae in samples is consistent with CI & Gonad ripeness indices& Gonad ripeness indices
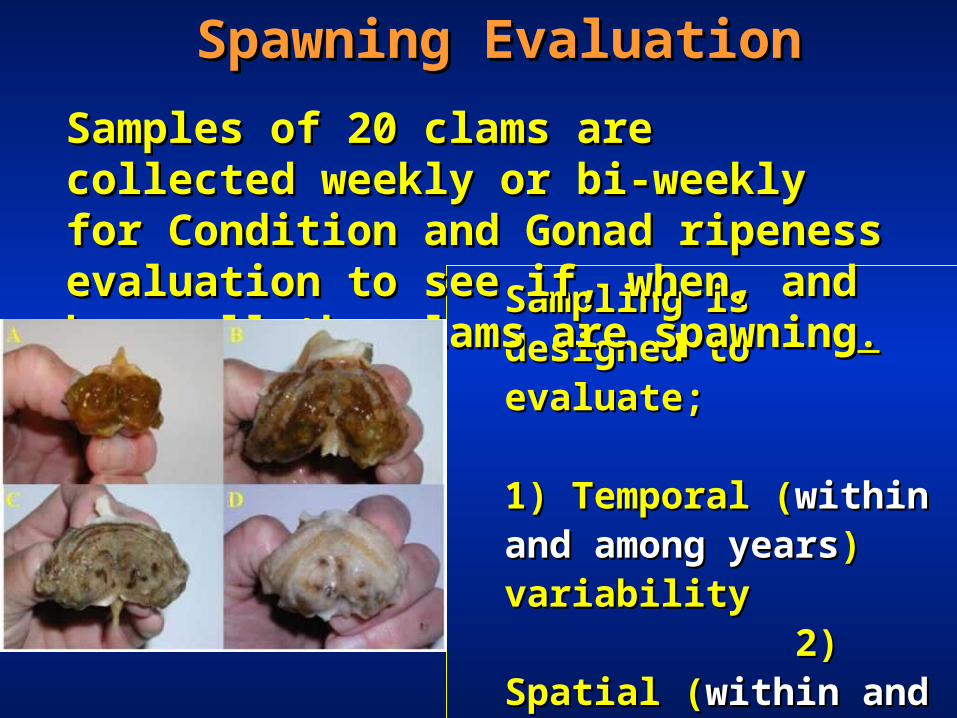
Sampling is designed to Sampling is designed to evaluate; evaluate; 1) Temporal (1) Temporal (within and within and among yearsamong years) variability ) variability 2) Spatial ( 2) Spatial (within within and among baysand among bays) ) variability, 3) Differences variability, 3) Differences among two source locations among two source locations (GC, CT and OB, NY)(GC, CT and OB, NY)
Samples of 20 clams are collected weekly or Samples of 20 clams are collected weekly or bi-weekly for Condition and Gonad ripeness bi-weekly for Condition and Gonad ripeness evaluation to see if, when, and how well the evaluation to see if, when, and how well the clams are spawningclams are spawning..
Spawning EvaluationSpawning Evaluation
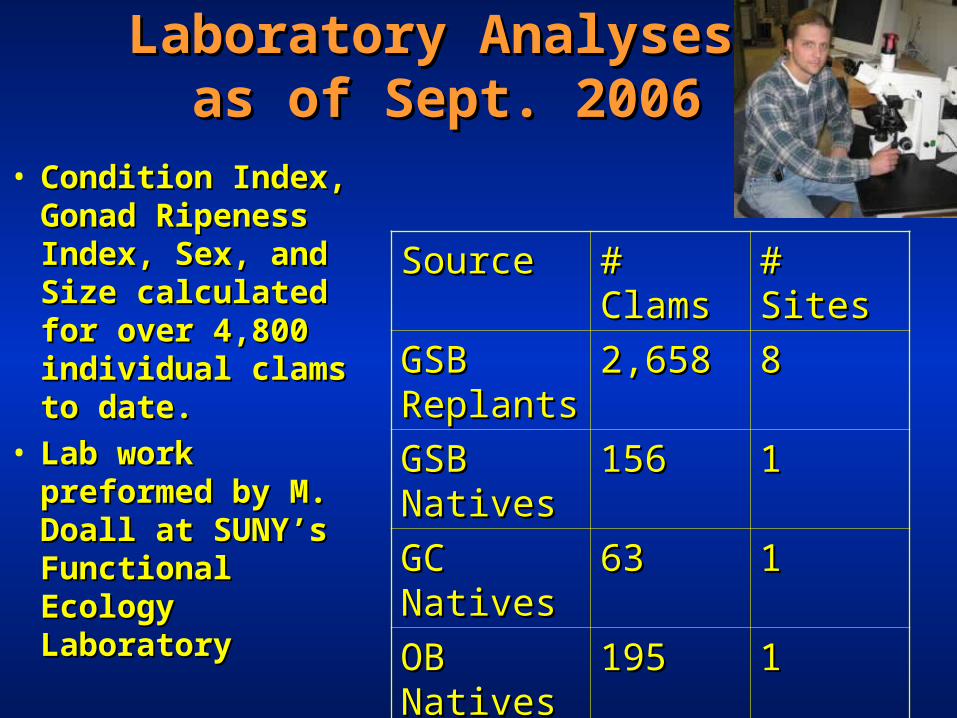
Laboratory Analyses Laboratory Analyses as of Sept. 2006as of Sept. 2006
• Condition Index, Condition Index, Gonad Ripeness Gonad Ripeness Index, Sex, and Size Index, Sex, and Size calculated for over calculated for over 4,800 individual 4,800 individual clams to date.clams to date.
• Lab work Lab work preformed by M. preformed by M. Doall at SUNY’s Doall at SUNY’s Functional Ecology Functional Ecology LaboratoryLaboratory
SourceSource # Clams# Clams # Sites# Sites
GSB GSB ReplantsReplants
2,6582,658 88
GSB GSB NativesNatives
156156 11
GC NativesGC Natives 6363 11
OB NativesOB Natives 195195 11
Peconic Peconic ReplantsReplants
16751675 22
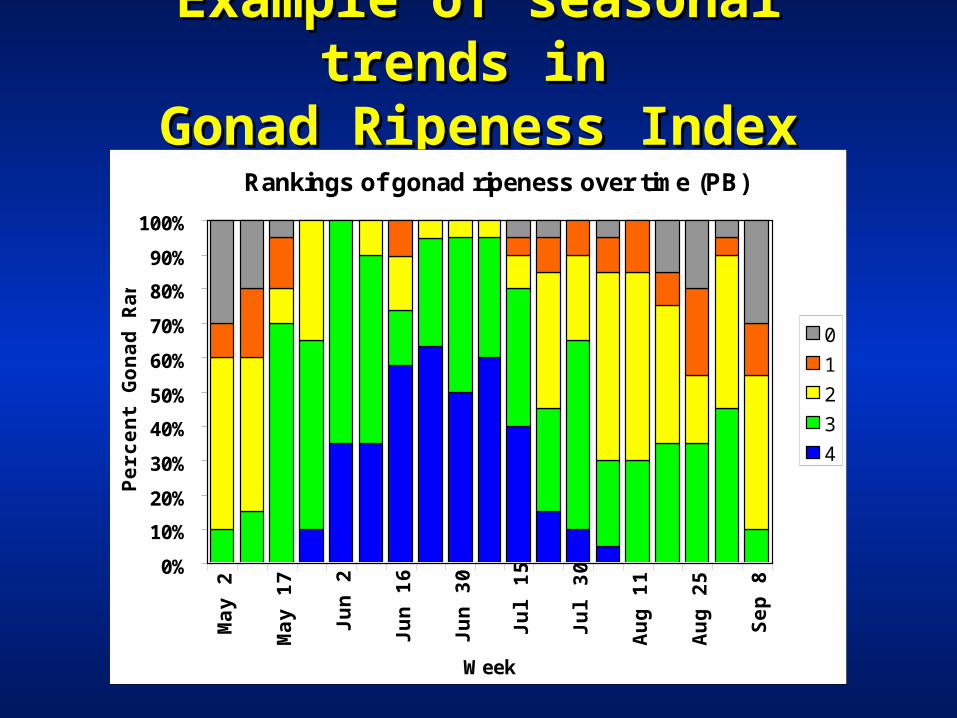
Example of seasonal trends in Example of seasonal trends in Gonad Ripeness IndexGonad Ripeness Index
Rankings of gonad ripeness over time (PB)
0%
10%
20%
30%
40%
50%
60%
70%
80%
90%
100%M
ay
2
Ma
y 1
7
Ju
n 2
Ju
n 1
6
Ju
n 3
0
Ju
l 15
Ju
l 30
Au
g 1
1
Au
g 2
5
Se
p 8
Week
Pe
rce
nt
Go
na
d R
an
k .
0
1
2
3
4
Ap
r-0
4
Ju
n-0
4
Au
g-0
4
Oc
t-0
4
De
c-0
4
Fe
b-0
5
Ap
r-0
5
Ju
n-0
5
Au
g-0
5
Oc
t-0
5
De
c-0
5
Fe
b-0
6
Ap
r-0
6
Ju
n-0
6
Au
g-0
6
Oc
t-0
6
Date
6
6.5
7
7.5
8
8.5
9
9.5
10
Co
nd
itio
n I
nd
ex
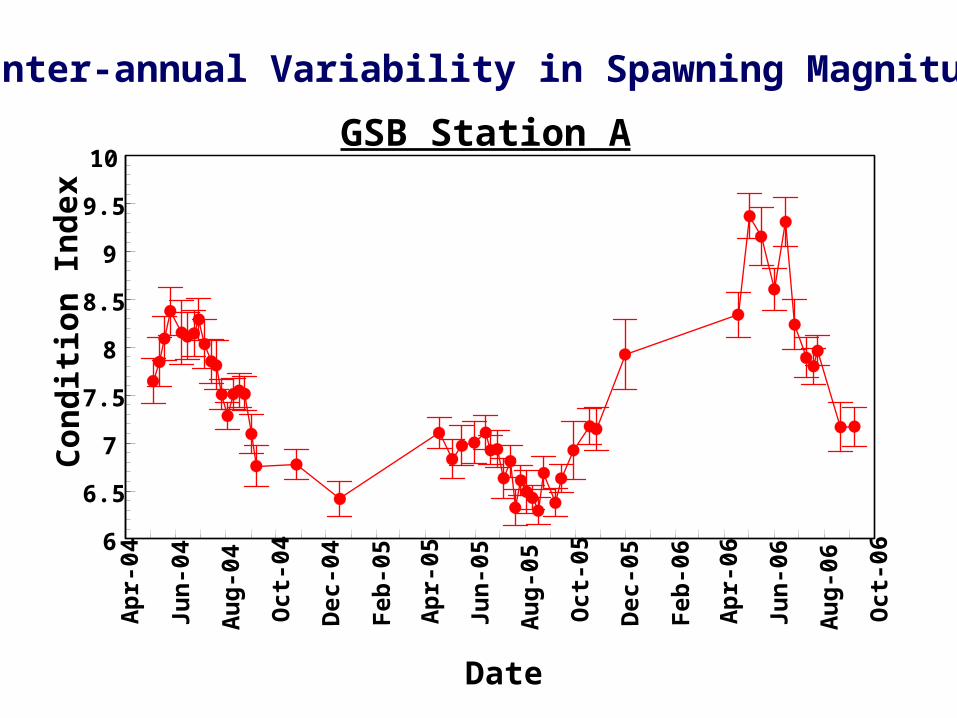
GSB Station A
Inter-annual Variability in Spawning Magnitude
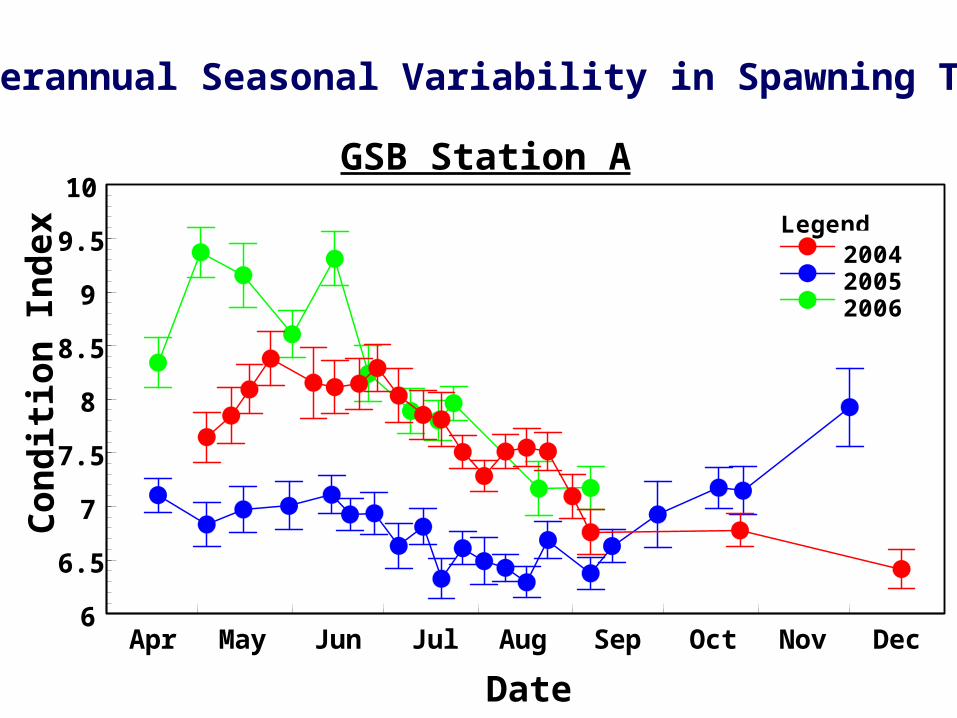
Interannual Seasonal Variability in Spawning Times
Apr May Jun Jul Aug Sep Oct Nov Dec
Date
6
6.5
7
7.5
8
8.5
9
9.5
10
Co
nd
itio
n I
nd
ex
LegendY-MeanY-MeanY-Mean
200420052006
GSB Station A
15
17
19
21
23
25
27
29
31
5/23 6/6 6/20 7/4 7/18 8/1 8/15 8/29
Date
Tem
p.
(C)
2004
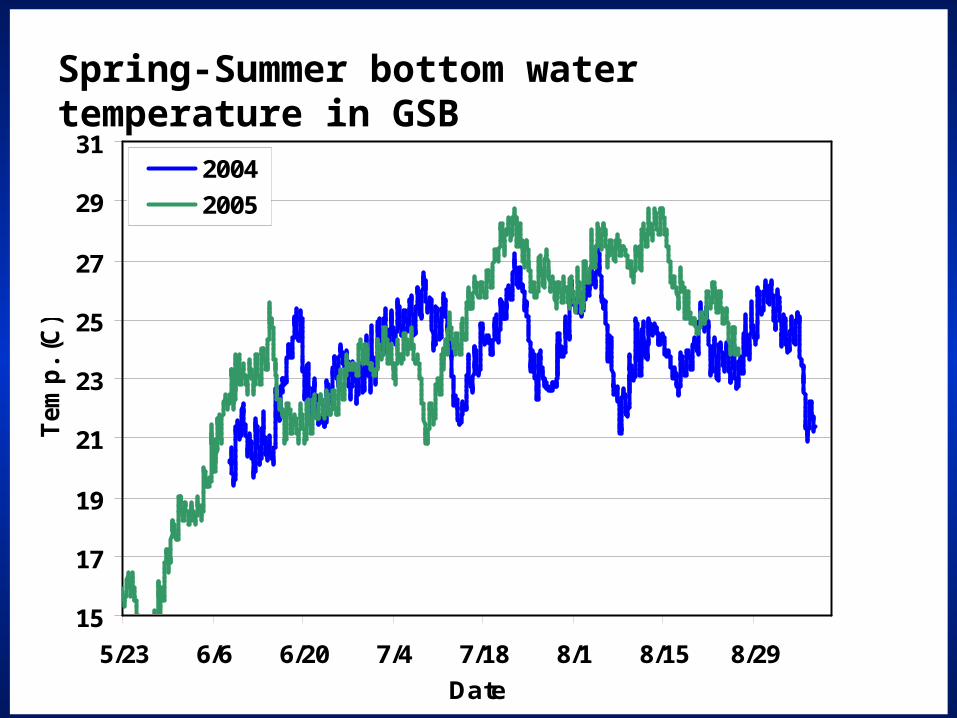
Spring-Summer bottom water temperature in GSB
15
17
19
21
23
25
27
29
31
5/23 6/6 6/20 7/4 7/18 8/1 8/15 8/29
Date
Tem
p.
(C)
2004
2005
Spring-Summer bottom water temperature in GSB
15
17
19
21
23
25
27
29
31
5/23 6/6 6/20 7/4 7/18 8/1 8/15 8/29
Date
Tem
p.
(C)
2004
2005
2006
Spring-Summer bottom water temperature in GSB
No
v-04
Jan
-05
Mar
-05
May
-05
Jul-
05
Sep
-05
No
v-05
Jan
-06
Mar
-06
May
-06
Jul-
06
Sep
-06
Date
6
6.5
7
7.5
8
8.5
9
9.5
10
Co
nd
itio
n I
nd
ex
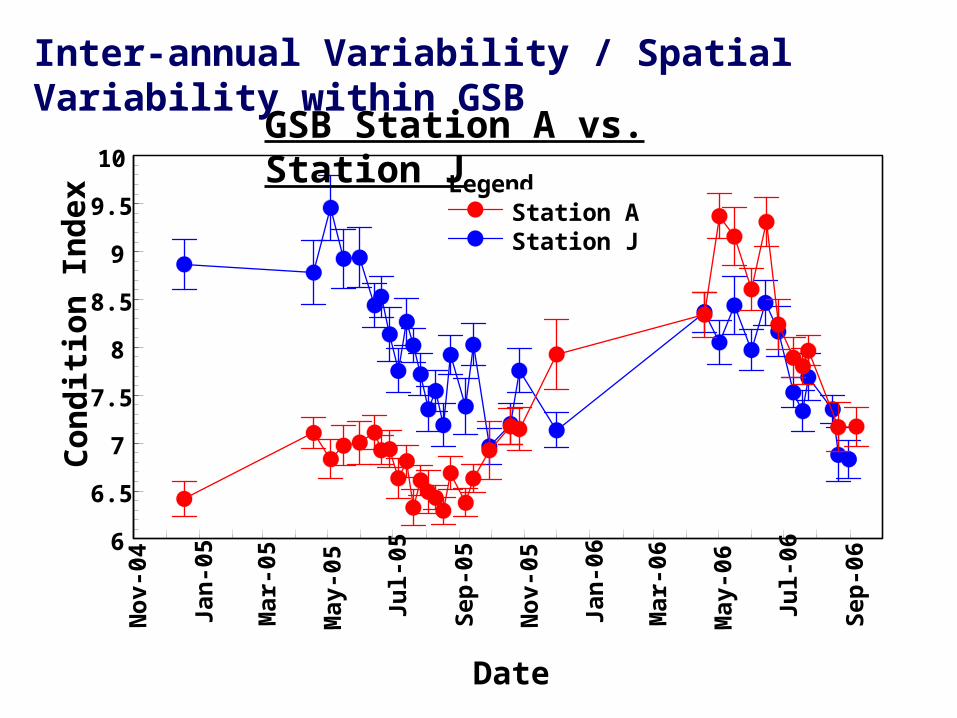
LegendY-MeanY-MeanStation AStation J
GSB Station A vs. Station J
Inter-annual Variability / Spatial Variability within GSB
Temporal and Spatial Variability Among Temporal and Spatial Variability Among Estuaries
Continuous chlorophyll readings from GSB and PB clam restoration sites, 2004
Conclusions from Spawning Evaluation: Conclusions from Spawning Evaluation: Temporal variationTemporal variation
1.1. There is large inter-annual variability in clam condition and There is large inter-annual variability in clam condition and spawning, reflecting variability in environmental factors. spawning, reflecting variability in environmental factors.
2. Environmental conditions in Fall appear to have a major 2. Environmental conditions in Fall appear to have a major influence on condition and spawning the following year.influence on condition and spawning the following year.
3.3. Over the past 3 years, 2006 was the best year for clam Over the past 3 years, 2006 was the best year for clam conditioning, this was correlated with good clam growth conditioning, this was correlated with good clam growth throughout the bay. throughout the bay.
4.4. 2006 was the worst year in Coecles harbor (PB), may be 2006 was the worst year in Coecles harbor (PB), may be associated with a red dinoflagelate bloom in the Fall of 2005 associated with a red dinoflagelate bloom in the Fall of 2005 (Gobler, in press)(Gobler, in press)
Conclusions from Spawning Evaluation: Conclusions from Spawning Evaluation: Spatial variationSpatial variation
1.1. Similar levels of condition and spawning patterns were Similar levels of condition and spawning patterns were observed at 8 sites across CGSB in 2006. (Site J was the observed at 8 sites across CGSB in 2006. (Site J was the poorest)poorest)
2.2. Largest differences were observed between systems Largest differences were observed between systems (i.e. Great South Bay vs. Peconic Estuary vs. Long (i.e. Great South Bay vs. Peconic Estuary vs. Long Island Sound)Island Sound)
3.3. Site differences can vary between years.Site differences can vary between years.
Overall observations from this large-scale Overall observations from this large-scale shellfish restoration projectshellfish restoration project
• Involving many partners is time consuming, but Involving many partners is time consuming, but essential for sustaining momentum and supportessential for sustaining momentum and support
• Try to anticipate and address all the major threats Try to anticipate and address all the major threats impacting the species ecological requirementsimpacting the species ecological requirements
• Monitoring is expensive yet critical for evaluating Monitoring is expensive yet critical for evaluating success and being success and being adaptiveadaptive to unforeseen to unforeseen circumstances (monitor at scale)circumstances (monitor at scale)
• By incorporating a BACI project design you can By incorporating a BACI project design you can interest researchers and pool research and interest researchers and pool research and restoration $ restoration $
• Long-term success requires preventing past threats Long-term success requires preventing past threats from re-occurring. (Could require a philosophical, from re-occurring. (Could require a philosophical, political, and/or environmental shift)political, and/or environmental shift)
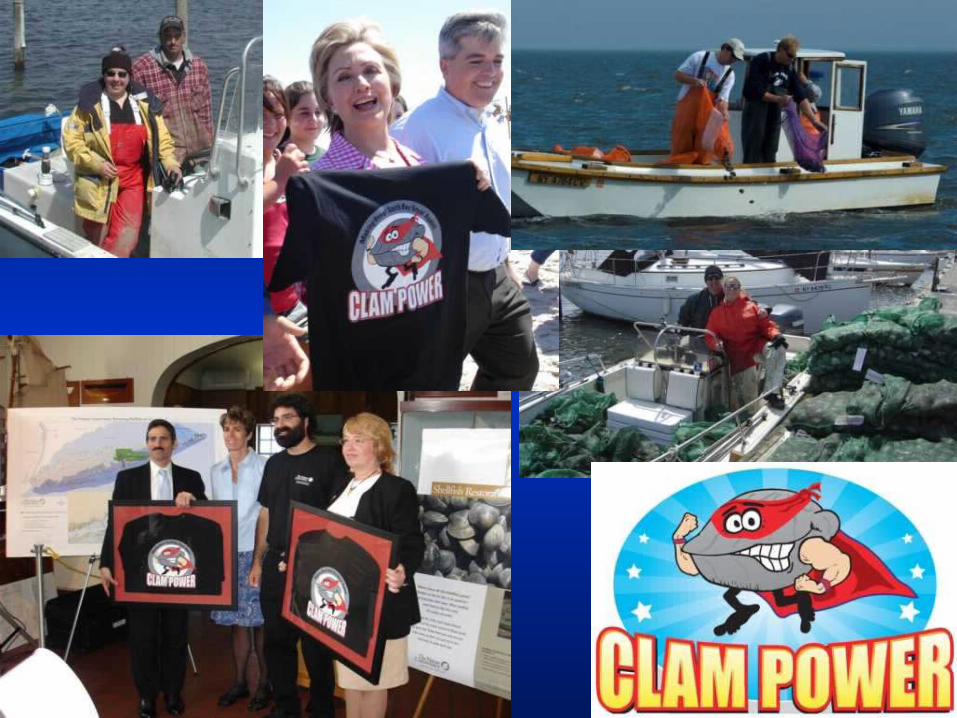
AcknowledgementsAcknowledgements• Suffolk CountySuffolk County
•Long Island Maritime MuseumLong Island Maritime Museum
•West Sayville Boat BasinWest Sayville Boat Basin
•CCECCE
•A long list of private A long list of private foundations and individuals who foundations and individuals who have contributed to this projecthave contributed to this project
•A dedicated and growing core A dedicated and growing core of Bluepoints volunteersof Bluepoints volunteers


![[PPT]Clam Dissection · Web viewDissection of the Clam Venus mercenaria * copyright cmassengale * * * * * * copyright cmassengale Resource * * * * * * * * * * * * * * * * * * * * *](https://static.documents.pub/doc/80x56/5aa6232f7f8b9a7c1a8e5555/pptclam-dissection-viewdissection-of-the-clam-venus-mercenaria-copyright-cmassengale.jpg)


