Suite 800 505 Montgomery Street San Francisco, CA 94111-6533 Steven F. Greenwald (415) 276-6528 tel (415) 276-6599 fax [email protected]June 26, 2017 Jeanine Townsend, Clerk to the Board State Water Resources Control Board 1001 I Street, 24th Floor Sacramento, CA 95814 RE: Cogentrix Comments on Draft Staff Report for Encina Power Station OTC Compliance Extension Dear Water Board Members: Cogentrix Energy Power Management LLC (Cogentrix) is pleased to submit comments on the Draft Staff Report for Amendment to the Water Quality Control Policy on the Use of Coastal and Estuarine Waters for Power Plant Cooling for Encina Power Station (Encina) located in Carlsbad, California. Cogentrix appreciates that the reliability of the State’s power grid is paramount and thus does not oppose a Once-through Cooling (OTC) extension for part of Encina. Nonetheless, we also recognize that in ensuring reliability, the State Water Resources Control Board (Water Board) must also not ignore its mission to lower the use of coastal and estuarine waters for power plant cooling. Cogentrix proposes that an objective of the Water Board should be to mitigate potential water usage in 2018 as a condition of this extension which would align with the spirit and intent of the regulations, the protection of oceans and sea life. Cogentrix has been an active participant in this process, providing both oral and written comments to the State Advisory Committee for Cooling Water Intake Structures (SACCWIS) at its February 23, 2017 meeting, and to the Water Board at its March 21, 2017 meeting. Cogentrix has previously raised two concerns to the Water Board. The first concern was that the SACCWIS extension request was supported by stale data from the California Independent System Operator (CAISO). Fortunately in a May 17, 2017 submission to the Water Board, the CAISO appropriately replaced the interim 2018 Encina Reliability Study with the most current Final 2018 Local Capacity Technical Analysis Report and Study Results (Final CAISO Study) as the supporting analysis for the extension. (8/15/17) Board Meeting OTC Policy Amendment- Encina Deadline: 7/7/17 by 12 noon 6-26-17
Transcript
Suite 800
505 Montgomery Street San Francisco, CA 94111-6533
The second concern was that an extension of Encina would result in the procurement of
more capacity than was necessary for reliability at the expense of other non-OTC generation in
the San Diego Area.
Cogentrix recommended that to the extent the Final CAISO Study identifies a reliability
need for Encina, any extension of Encina should be limited to the fewest amount of units needed
for reliability, and take into account the availability in 2018 of all non-OTC generation in the San
Diego area. Cogentrix’s recommendation to limit the amount of Encina capacity to support
reliability in 2018 is consistent with the position the CAISO advanced in its May 17 letter to
Thomas Howard, Executive Director:
Further, the ISO wishes to draw your attention to the specific
findings that require additional clarification. As noted on pages
69-74 the ISO’s studies have identified the continued need for
local capacity in the San Diego/Imperial Valley area. Taking all
other resources in the local capacity areas into account, this
results in a need for approximately 100 MW from the Encina plant,
which supports the need for the extension of the OTC compliance
date to the end of 2018.1
Based on the concerns raised and the progress thus far in this process, Cogentrix submits
the following comments on the May 22nd, 2017, Draft Staff Report and proposes changes
specifically regarding Section 9.
First, in describing the four SACCWIS Options, Cogentrix notes that SACCWIS Option
32 emphasizes the lack of time available for new construction. Option 3 thus errs by ignoring the
option of contracting with existing, available capacity alternatives such as uncontracted fast start,
fast ramping peaking plants. These existing facilities require no “construction lead time,” but
rather are immediately available to provide reliability within the San Diego basin without use of
ocean and estuarial water for cooling.
Second, Cogentrix recommends an Alternative be added to the Section 9 subsection
titled, “Alternatives and Discussion for the State Water Board.” It currently posits two
alternatives as 1) No Action; and 2) Adopt the Amendment as described (OTC compliance date
change until 12/31/18).
1 CAISO Letter to Thomas Howard, Executive Director RE: 2018 Local Capacity Technical Analysis, May 17, 2017
(emphasis added).
2 Section 9, WATER BOARD Draft Staff Report for Encina Power Plant OTC Extension, May 22, 2017, at 9.
Jeanine Townsend, Clerk to the Board
State Water Resources Control Board
June 26, 2017
Page 3
Cogentrix proposes an “Alternative 3” which recognizes and addresses the current
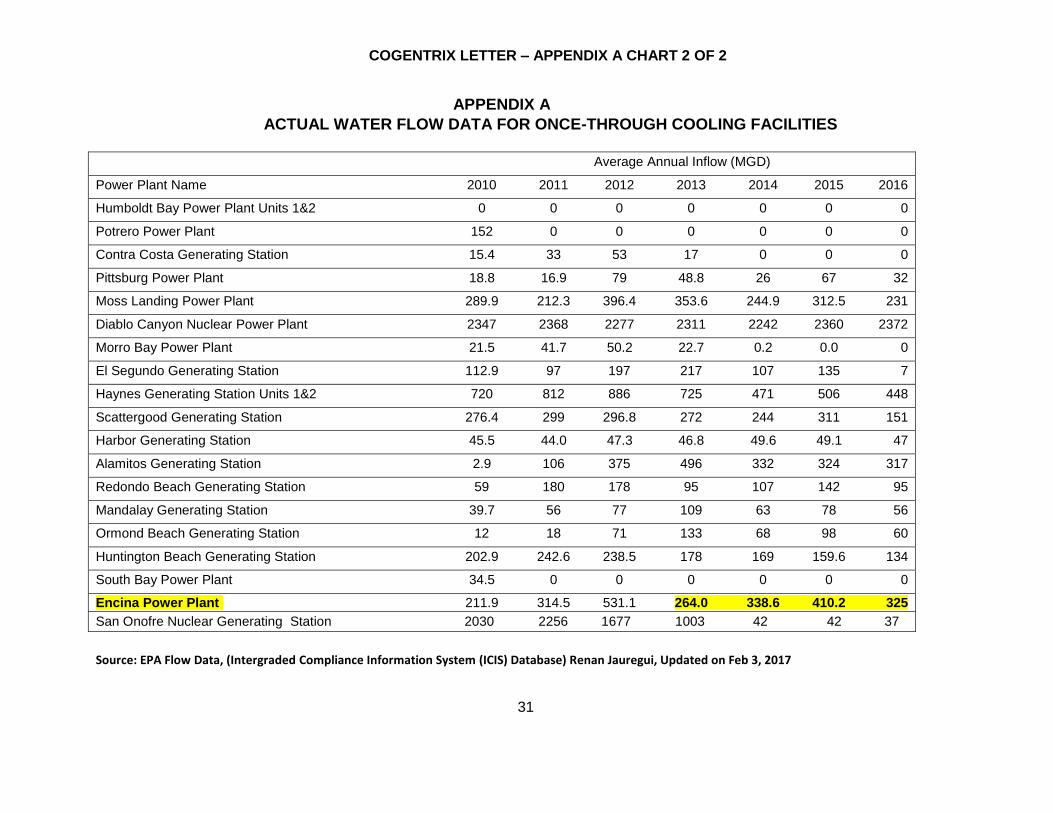
inability of Encina to limit ocean flows when operating below full capacity. In Appendix A to
these comments, Cogentrix provides Encina Capacity Factor versus Actual Ocean Flows Data.
Appendix A compares the ocean water usage from a year with Encina low capacity factor to a
year with Encina high capacity factor and demonstrates that the amount of water usage is near
the same level in each of the years. Cogentrix accordingly proposes that a variable speed pump
would be effective in restricting cooling water usage during periods in which only one or two of
the Encina units are required for reliability.
Cogentrix recommends that this “Alternative 3” be inserted as follows:
Alternative 3: Adopt the Amendment as described with the following additional
mitigation measures:
1. All other non-OTC generation in the San Diego sub-area shall be utilized
(contracted to be available) which provides assurance that the reliability need for
Encina is reduced to the extent possible.
2. Prior to January 1, 2018, Encina shall install a variable speed pump on the
water intake system to reduce water flow for power plant cooling to only the
amount needed for the number of units dispatched.
Cogentrix appreciates the Water Board’s consideration of these comments and
respectfully urges the Water Board to consider, adopt and approve Alternative 3. Cogentrix
believes that adoption of Alternative 3 would ensure grid reliability and also be consistent with
and best advance the mission and goals of the OTC regulations.
Sincerely,
Davis Wright Tremaine LLP
Steven F. Greenwald
Jeanine Townsend, Clerk to the Board
State Water Resources Control Board
June 26, 2017
Page 4
cc: State Water Resources Control Board Members
Chair, Felicia Marcus
Vice Chair, Steven Moore
Member, Tam M. Doduc
Member, Dorene D'Adamo
Member, E. Joaquin Esquivel
Mr. Phil Crader, Assistant Deputy Director, Division of Water Quality
Ms. Mariela Paz Carpio-Obeso, Ocean Standards Unit Chief, Division of Water Quality
COGENTRIX LETTER – APPENDIX A CHART 1 OF 2
California Energy Commission – Tracking Progress Recent Power Production Patterns of OTC Facilities
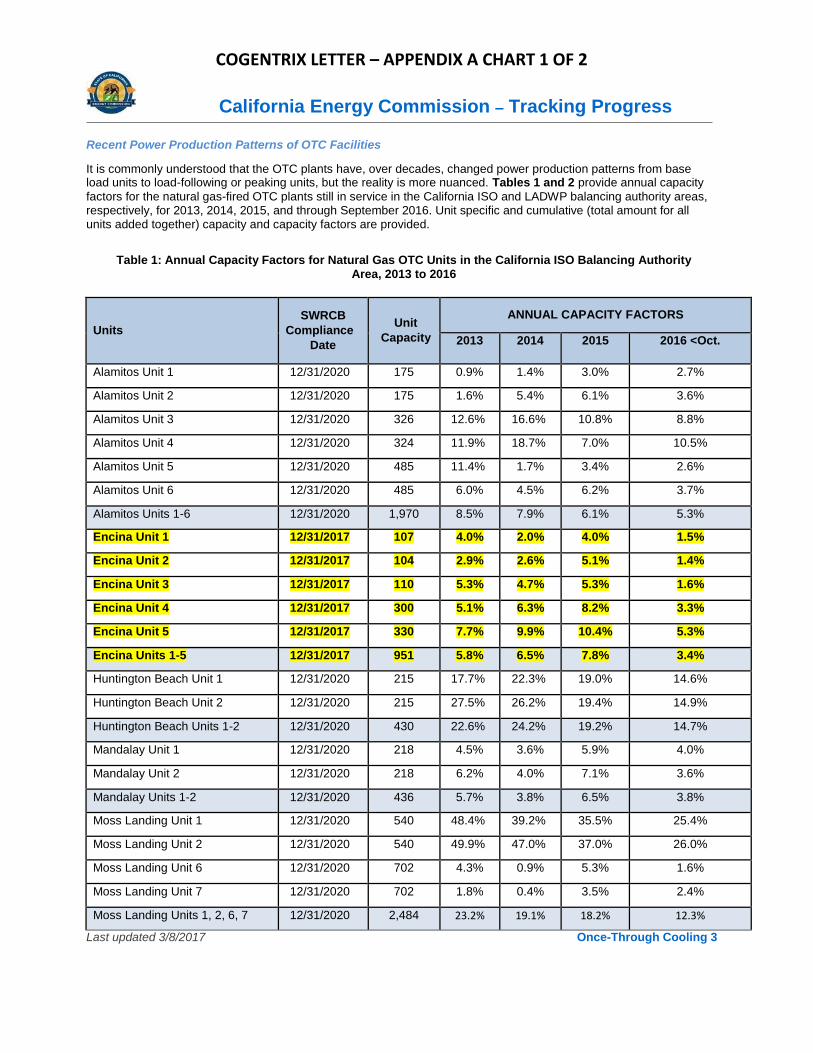
It is commonly understood that the OTC plants have, over decades, changed power production patterns from base load units to load-following or peaking units, but the reality is more nuanced. Tables 1 and 2 provide annual capacity
factors for the natural gas-fired OTC plants still in service in the California ISO and LADWP balancing authority areas, respectively, for 2013, 2014, 2015, and through September 2016. Unit specific and cumulative (total amount for all units added together) capacity and capacity factors are provided.
Table 1: Annual Capacity Factors for Natural Gas OTC Units in the California ISO Balancing Authority
Area, 2013 to 2016
Units SWRCB
Compliance Date
Unit
Capacity
ANNUAL CAPACITY FACTORS
2013 2014 2015 2016 <Oct.
Alamitos Unit 1 12/31/2020 175 0.9% 1.4% 3.0% 2.7%
Alamitos Unit 2 12/31/2020 175 1.6% 5.4% 6.1% 3.6%
Alamitos Unit 3 12/31/2020 326 12.6% 16.6% 10.8% 8.8%
Alamitos Unit 4 12/31/2020 324 11.9% 18.7% 7.0% 10.5%
Alamitos Unit 5 12/31/2020 485 11.4% 1.7% 3.4% 2.6%
Alamitos Unit 6 12/31/2020 485 6.0% 4.5% 6.2% 3.7%
Alamitos Units 1-6 12/31/2020 1,970 8.5% 7.9% 6.1% 5.3%
Encina Unit 1 12/31/2017 107 4.0% 2.0% 4.0% 1.5%
Encina Unit 2 12/31/2017 104 2.9% 2.6% 5.1% 1.4%
Encina Unit 3 12/31/2017 110 5.3% 4.7% 5.3% 1.6%
Encina Unit 4 12/31/2017 300 5.1% 6.3% 8.2% 3.3%
Encina Unit 5 12/31/2017 330 7.7% 9.9% 10.4% 5.3%
Encina Units 1-5 12/31/2017 951 5.8% 6.5% 7.8% 3.4%
Huntington Beach Unit 1 12/31/2020 215 17.7% 22.3% 19.0% 14.6%
Huntington Beach Unit 2 12/31/2020 215 27.5% 26.2% 19.4% 14.9%
Huntington Beach Units 1-2 12/31/2020 430 22.6% 24.2% 19.2% 14.7%
Mandalay Unit 1 12/31/2020 218 4.5% 3.6% 5.9% 4.0%
Mandalay Unit 2 12/31/2020 218 6.2% 4.0% 7.1% 3.6%
Mandalay Units 1-2 12/31/2020 436 5.7% 3.8% 6.5% 3.8%
Moss Landing Unit 1 12/31/2020 540 48.4% 39.2% 35.5% 25.4%
Moss Landing Unit 2 12/31/2020 540 49.9% 47.0% 37.0% 26.0%
Moss Landing Unit 6 12/31/2020 702 4.3% 0.9% 5.3% 1.6%
Moss Landing Unit 7 12/31/2020 702 1.8% 0.4% 3.5% 2.4%


![arXiv:0709.3792v1 [astro-ph] 24 Sep 2007The CS J(2–1) and J(5–4) lines (at 98.0 and 244.9 GHz, respec-tively) were observed in parallel on March 12. On March 13, the 220–211](https://static.documents.pub/doc/80x56/5fa85a2f74ccc44d330b0f01/arxiv07093792v1-astro-ph-24-sep-2007-the-cs-j2a1-and-j5a4-lines-at.jpg)


