Appendix A ................................................................................................................................ 25
RE:CONNECT analysis: Summary report September 2014
2
1 Introduction RE:CONNECT was the Mayor’s Low Carbon Zones programme that ran between September 2009 and
September 2012. It aimed to deliver a 20% saving in carbon dioxide (CO2) emissions (on a 1990
baseline) in ten neighbourhoods in London by the end of the programme, and to put them on a path
to a 60% reduction by 2025, in line with the Mayor’s CO2 emissions reduction target.
The intention of the programme was to explore and demonstrate a range of new approaches to
neighbourhood-scale carbon saving that involved communities and businesses. The broad
hypothesis being tested was that integrating efforts across sectors in the same geography and
engaging people in lowering the carbon footprint of their neighbourhood could provide cost-
effective carbon savings and a wider set of outcomes in terms of local sustainability.
The programme was seed funded by the Greater London Authority (GLA) and each Zone was
managed by a London borough, with external funding being brought in by the boroughs and their
partners. The GLA funding was used in different ways by each borough and supported a range of
activities covering project management, community engagement and other incentives. Each Zone
comprised an area with an average of around 1,500 homes and a variety of commercial and public
buildings. Carbon reduction projects and baselines were agreed with the Zones at the beginning of
the programme, with revisions being made over time where more effective projects could be
delivered and in response to changing circumstances within each Zone – particularly in relation to
external funding regimes.
With the programme now complete, the GLA has commissioned the Centre for Sustainable Energy
(CSE) to use the reported carbon saving data from each Zone to analyse the project in terms of its
success against that objective. The primary aim of this analysis is to report the outcomes of the
programme, and draw out findings and learnings to take forward in designing future carbon saving
programmes that will keep London on track to meet its 2025 carbon reduction target.
This report concentrates on the carbon saving aspects of the programme and presents findings from
analysis of the data collected during the programme and from interviews conducted with the
RE:CONNECT stakeholders (see appendix A for a full list of stakeholders). It does not give detailed
attention to the additional local sustainability objectives of the programme.
RE:CONNECT aimed to reduce emissions in three types of buildings: homes, community and public
sector buildings, and businesses and commercial buildings. The analysis presents results from each
of these sectors individually as well as their combined impact on emissions reductions.
The RE:CONNECT programme took place in ten areas across London. The characteristics of the Zones
varied considerably in terms of housing type and tenure, levels of deprivation, and the amount of
public and commercial buildings. They were selected in part for their representativeness of a range
of London neighbourhoods. As such, caution should be taken in making direct comparisons between
Zones.
RE:CONNECT analysis: Summary report September 2014
3
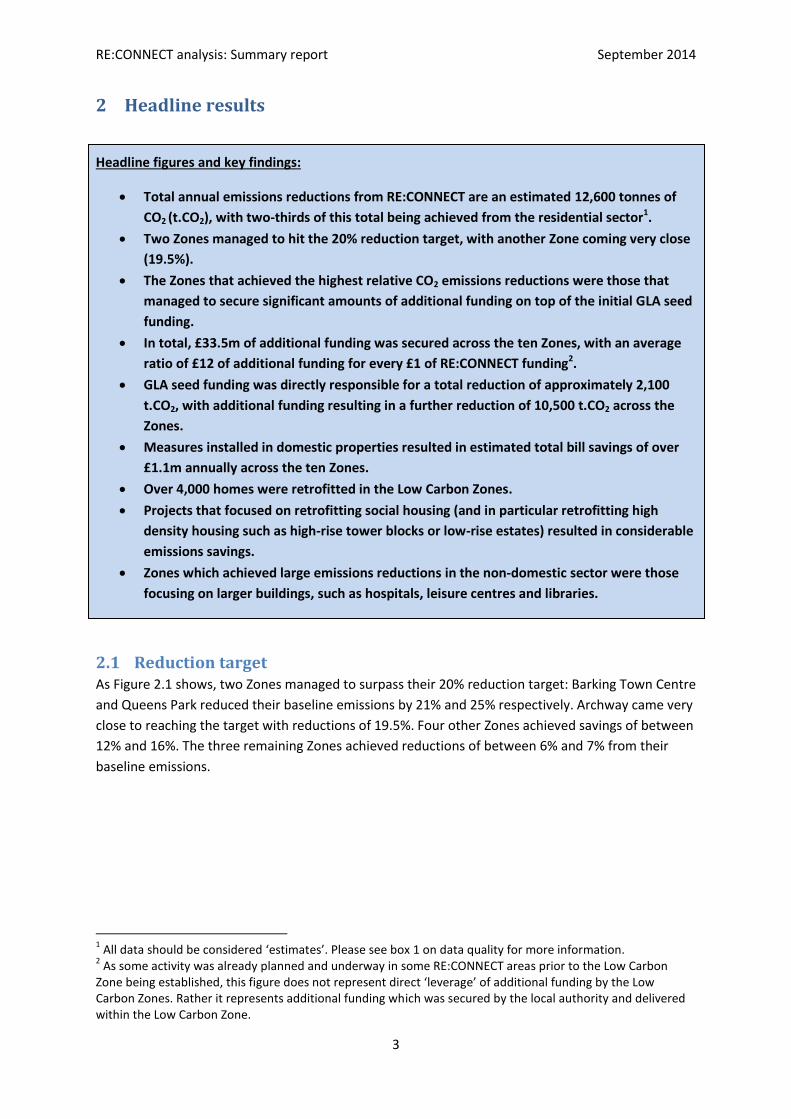
2 Headline results
Headline figures and key findings:
Total annual emissions reductions from RE:CONNECT are an estimated 12,600 tonnes of
CO2 (t.CO2), with two-thirds of this total being achieved from the residential sector1.
Two Zones managed to hit the 20% reduction target, with another Zone coming very close
(19.5%).
The Zones that achieved the highest relative CO2 emissions reductions were those that
managed to secure significant amounts of additional funding on top of the initial GLA seed
funding.
In total, £33.5m of additional funding was secured across the ten Zones, with an average
ratio of £12 of additional funding for every £1 of RE:CONNECT funding2.
GLA seed funding was directly responsible for a total reduction of approximately 2,100
t.CO2, with additional funding resulting in a further reduction of 10,500 t.CO2 across the
Zones.
Measures installed in domestic properties resulted in estimated total bill savings of over
£1.1m annually across the ten Zones.
Over 4,000 homes were retrofitted in the Low Carbon Zones.
Projects that focused on retrofitting social housing (and in particular retrofitting high
density housing such as high-rise tower blocks or low-rise estates) resulted in considerable
emissions savings.
Zones which achieved large emissions reductions in the non-domestic sector were those
focusing on larger buildings, such as hospitals, leisure centres and libraries.
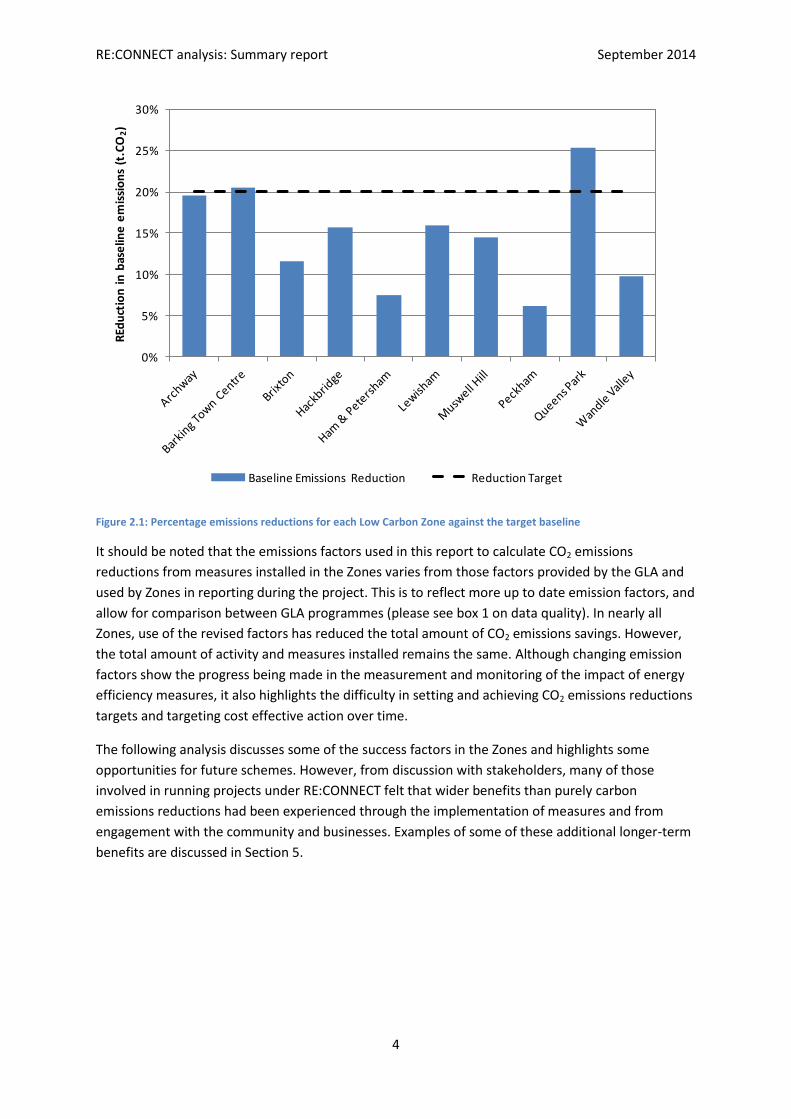
2.1 Reduction target As Figure 2.1 shows, two Zones managed to surpass their 20% reduction target: Barking Town Centre
and Queens Park reduced their baseline emissions by 21% and 25% respectively. Archway came very
close to reaching the target with reductions of 19.5%. Four other Zones achieved savings of between
12% and 16%. The three remaining Zones achieved reductions of between 6% and 7% from their
baseline emissions.
1 All data should be considered ‘estimates’. Please see box 1 on data quality for more information.
2 As some activity was already planned and underway in some RE:CONNECT areas prior to the Low Carbon
Zone being established, this figure does not represent direct ‘leverage’ of additional funding by the Low Carbon Zones. Rather it represents additional funding which was secured by the local authority and delivered within the Low Carbon Zone.
RE:CONNECT analysis: Summary report September 2014
4
Figure 2.1: Percentage emissions reductions for each Low Carbon Zone against the target baseline
It should be noted that the emissions factors used in this report to calculate CO2 emissions
reductions from measures installed in the Zones varies from those factors provided by the GLA and
used by Zones in reporting during the project. This is to reflect more up to date emission factors, and
allow for comparison between GLA programmes (please see box 1 on data quality). In nearly all
Zones, use of the revised factors has reduced the total amount of CO2 emissions savings. However,
the total amount of activity and measures installed remains the same. Although changing emission
factors show the progress being made in the measurement and monitoring of the impact of energy
efficiency measures, it also highlights the difficulty in setting and achieving CO2 emissions reductions
targets and targeting cost effective action over time.
The following analysis discusses some of the success factors in the Zones and highlights some
opportunities for future schemes. However, from discussion with stakeholders, many of those
involved in running projects under RE:CONNECT felt that wider benefits than purely carbon
emissions reductions had been experienced through the implementation of measures and from
engagement with the community and businesses. Examples of some of these additional longer-term
benefits are discussed in Section 5.
0%
5%
10%
15%
20%
25%
30%R
Edu
ctio
n i
n b
ase
line
em
issi
on
s (t
.CO
2)
Baseline Emissions Reduction Reduction Target
RE:CONNECT analysis: Summary report September 2014
5
Box 1: Note on data quality
Due to limitations in data capture and the time lag in reporting, the data used in this report should
be considered estimates. Where specific data on housing types was reported (such as RdSAP and
Carbon Emissions Reduction Target reported figures), this data is used. However, where this data
was not available, national average emissions factors provided by the Energy Saving Trust have been
used. Where measures have not been consistently classified CSE has made assumptions and applied
the emissions factors for the nearest standard measure type. This may result in under or over
estimations of emissions savings. However, the GLA believes these to be a sufficiently reliable
indication of emissions savings attributable to the RE:CONNECT programme.
For reasons of comparison, the GLA has applied revised Energy Saving Trust emissions factors to the
data in line with those used by other GLA-delivered domestic energy efficiency programmes such as
RE:NEW. This has resulted in variations in CO2 emissions reported by individual Low Carbon Zones in
Zone-specific reports. For example, the following Zones reported total CO2 emissions reductions
under emissions factors agreed with the GLA within the lifetime of the project:
Ham and Petersham: Reported savings of 807 tonnes CO2
Peckham: Reported a 12.1% reduction within the domestic sector, and a 3.1% reduction within
the commercial sector
Wandle Valley: Reported savings of 854 tonnes CO2
As multiple GLA-funded programmes (RE:NEW, Decent Homes and Targeted Funding Stream) were
delivered in some Zones, caution should be made in ‘adding together’ CO2 emissions reductions
across programmes.
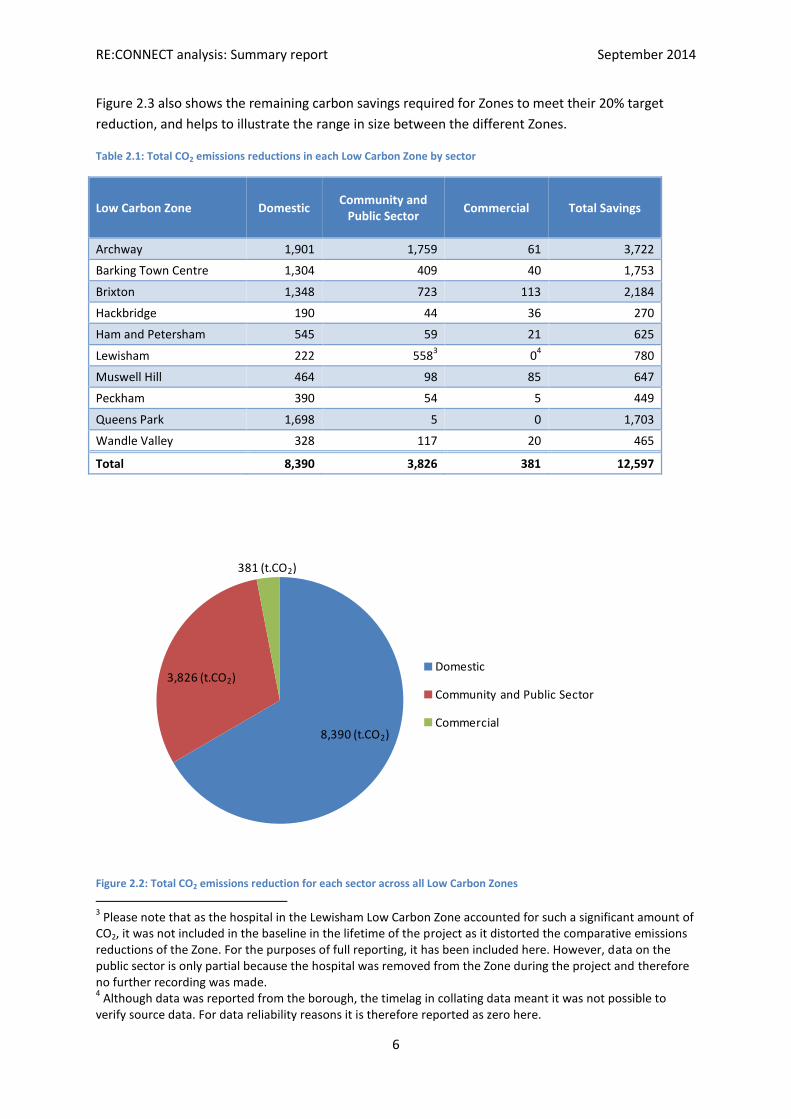
2.2 Total emissions reductions RE:CONNECT resulted in total annual CO2 savings of an estimated 12,600 t.CO2 across the ten Low
Carbon Zones. Table 2.1 shows the emissions reduction for each Zone and sector. In the domestic
sector, Archway, Queens Park, Brixton and Barking Town Centre Low Carbon Zones achieved the
highest overall emissions reductions. This, however, largely reflects the relative size of the Zones,
with these four Zones being the largest of the ten areas.
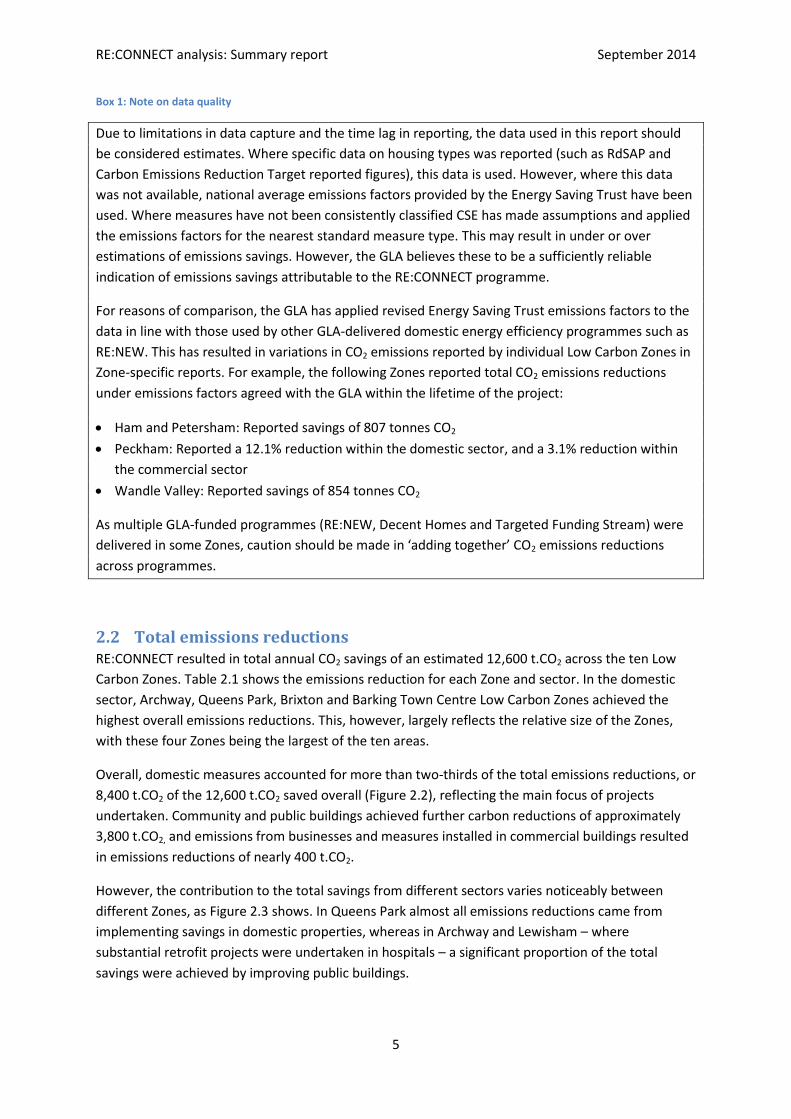
Overall, domestic measures accounted for more than two-thirds of the total emissions reductions, or
8,400 t.CO2 of the 12,600 t.CO2 saved overall (Figure 2.2), reflecting the main focus of projects
undertaken. Community and public buildings achieved further carbon reductions of approximately
3,800 t.CO2, and emissions from businesses and measures installed in commercial buildings resulted
in emissions reductions of nearly 400 t.CO2.
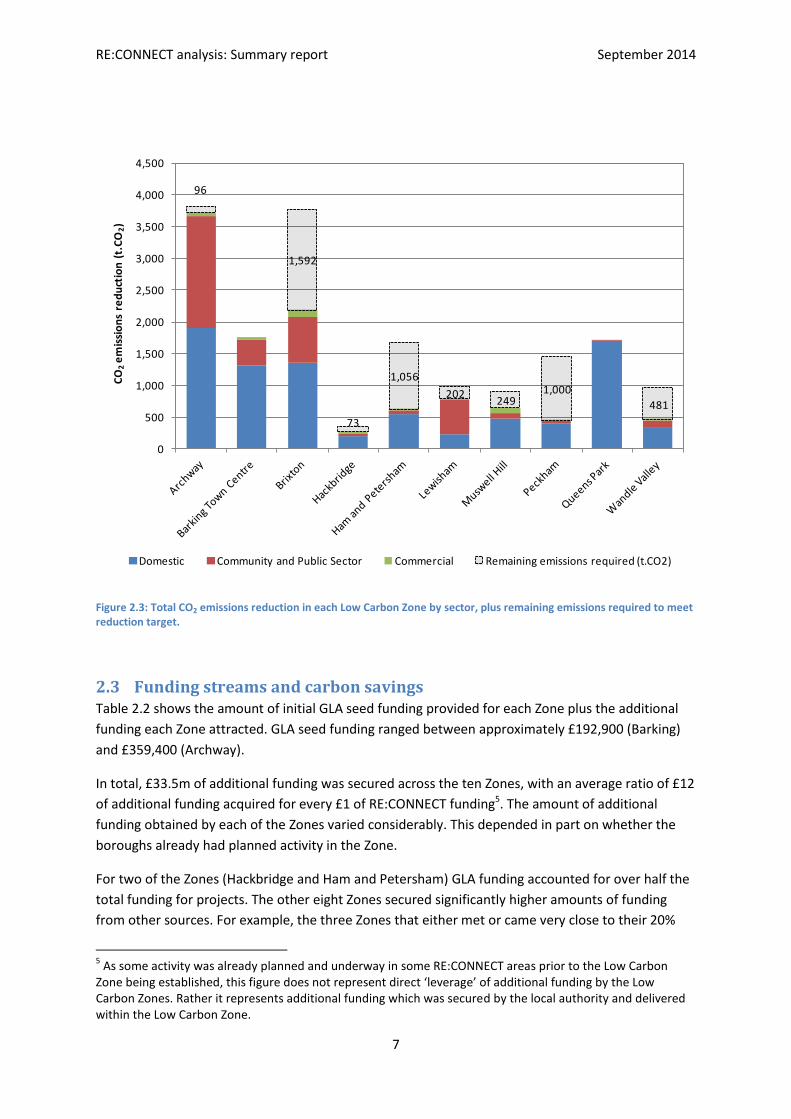
However, the contribution to the total savings from different sectors varies noticeably between
different Zones, as Figure 2.3 shows. In Queens Park almost all emissions reductions came from
implementing savings in domestic properties, whereas in Archway and Lewisham – where
substantial retrofit projects were undertaken in hospitals – a significant proportion of the total
savings were achieved by improving public buildings.
RE:CONNECT analysis: Summary report September 2014
6
Figure 2.3 also shows the remaining carbon savings required for Zones to meet their 20% target
reduction, and helps to illustrate the range in size between the different Zones.
Table 2.1: Total CO2 emissions reductions in each Low Carbon Zone by sector
Low Carbon Zone Domestic Community and
Public Sector Commercial Total Savings
Archway 1,901 1,759 61 3,722
Barking Town Centre 1,304 409 40 1,753
Brixton 1,348 723 113 2,184
Hackbridge 190 44 36 270
Ham and Petersham 545 59 21 625
Lewisham 222 5583 0
4 780
Muswell Hill 464 98 85 647
Peckham 390 54 5 449
Queens Park 1,698 5 0 1,703
Wandle Valley 328 117 20 465
Total 8,390 3,826 381 12,597
Figure 2.2: Total CO2 emissions reduction for each sector across all Low Carbon Zones
3 Please note that as the hospital in the Lewisham Low Carbon Zone accounted for such a significant amount of
CO2, it was not included in the baseline in the lifetime of the project as it distorted the comparative emissions reductions of the Zone. For the purposes of full reporting, it has been included here. However, data on the public sector is only partial because the hospital was removed from the Zone during the project and therefore no further recording was made. 4 Although data was reported from the borough, the timelag in collating data meant it was not possible to
verify source data. For data reliability reasons it is therefore reported as zero here.
8,390 (t.CO2)
3,826 (t.CO2)
381 (t.CO2)
Domestic
Community and Public Sector
Commercial
RE:CONNECT analysis: Summary report September 2014
7
Figure 2.3: Total CO2 emissions reduction in each Low Carbon Zone by sector, plus remaining emissions required to meet reduction target.
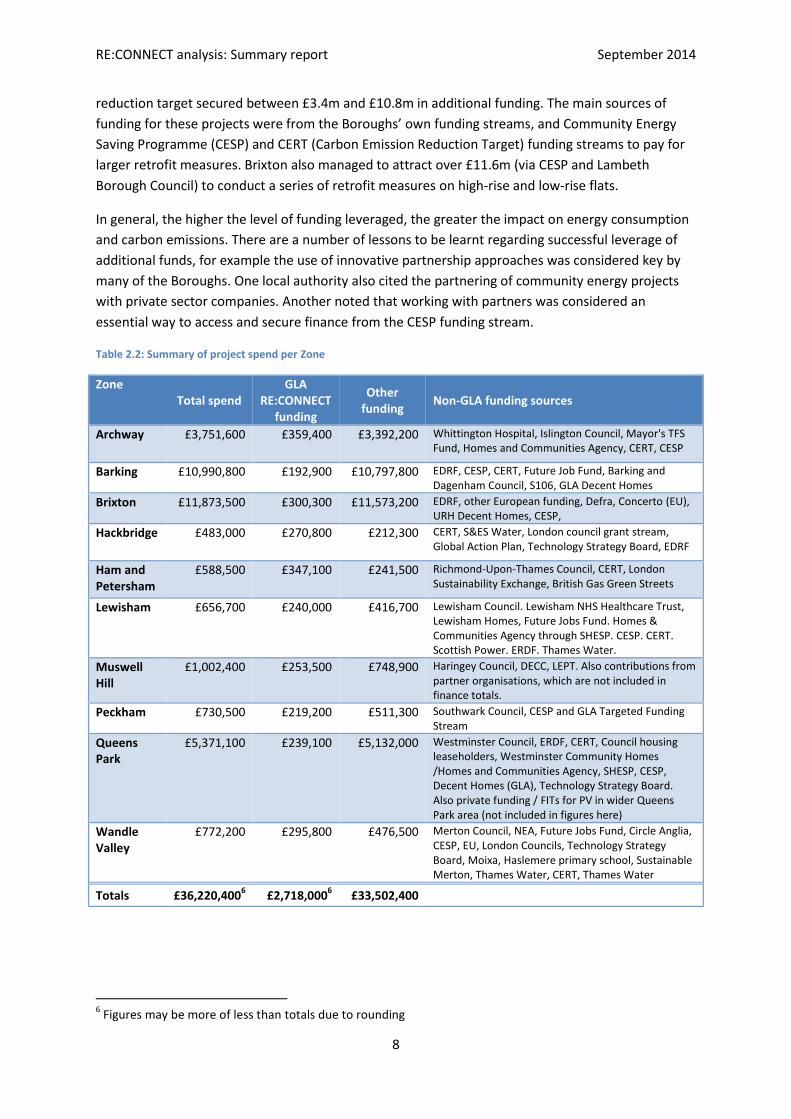
2.3 Funding streams and carbon savings Table 2.2 shows the amount of initial GLA seed funding provided for each Zone plus the additional
funding each Zone attracted. GLA seed funding ranged between approximately £192,900 (Barking)
and £359,400 (Archway).
In total, £33.5m of additional funding was secured across the ten Zones, with an average ratio of £12
of additional funding acquired for every £1 of RE:CONNECT funding5. The amount of additional
funding obtained by each of the Zones varied considerably. This depended in part on whether the
boroughs already had planned activity in the Zone.
For two of the Zones (Hackbridge and Ham and Petersham) GLA funding accounted for over half the
total funding for projects. The other eight Zones secured significantly higher amounts of funding
from other sources. For example, the three Zones that either met or came very close to their 20%
5 As some activity was already planned and underway in some RE:CONNECT areas prior to the Low Carbon
Zone being established, this figure does not represent direct ‘leverage’ of additional funding by the Low Carbon Zones. Rather it represents additional funding which was secured by the local authority and delivered within the Low Carbon Zone.
96
1,592
73
1,056
202249
1,000
481
0
500
1,000
1,500
2,000
2,500
3,000
3,500
4,000
4,500
CO
2e
mis
sio
ns
red
uct
ion
(t.
CO
2)
Domestic Community and Public Sector Commercial Remaining emissions required (t.CO2)
RE:CONNECT analysis: Summary report September 2014
8
reduction target secured between £3.4m and £10.8m in additional funding. The main sources of
funding for these projects were from the Boroughs’ own funding streams, and Community Energy
Saving Programme (CESP) and CERT (Carbon Emission Reduction Target) funding streams to pay for
larger retrofit measures. Brixton also managed to attract over £11.6m (via CESP and Lambeth
Borough Council) to conduct a series of retrofit measures on high-rise and low-rise flats.
In general, the higher the level of funding leveraged, the greater the impact on energy consumption
and carbon emissions. There are a number of lessons to be learnt regarding successful leverage of
additional funds, for example the use of innovative partnership approaches was considered key by
many of the Boroughs. One local authority also cited the partnering of community energy projects
with private sector companies. Another noted that working with partners was considered an
essential way to access and secure finance from the CESP funding stream.
Table 2.2: Summary of project spend per Zone
Zone Total spend
GLA RE:CONNECT
funding
Other funding
Non-GLA funding sources
Archway £3,751,600 £359,400 £3,392,200 Whittington Hospital, Islington Council, Mayor's TFS Fund, Homes and Communities Agency, CERT, CESP
Barking £10,990,800 £192,900 £10,797,800 EDRF, CESP, CERT, Future Job Fund, Barking and Dagenham Council, S106, GLA Decent Homes
Brixton £11,873,500 £300,300 £11,573,200 EDRF, other European funding, Defra, Concerto (EU), URH Decent Homes, CESP,
Hackbridge £483,000 £270,800 £212,300 CERT, S&ES Water, London council grant stream, Global Action Plan, Technology Strategy Board, EDRF
Ham and Petersham
£588,500 £347,100 £241,500 Richmond-Upon-Thames Council, CERT, London Sustainability Exchange, British Gas Green Streets
Lewisham £656,700 £240,000 £416,700 Lewisham Council. Lewisham NHS Healthcare Trust, Lewisham Homes, Future Jobs Fund. Homes & Communities Agency through SHESP. CESP. CERT. Scottish Power. ERDF. Thames Water.
Muswell Hill
£1,002,400 £253,500 £748,900 Haringey Council, DECC, LEPT. Also contributions from partner organisations, which are not included in finance totals.
£5,371,100 £239,100 £5,132,000 Westminster Council, ERDF, CERT, Council housing leaseholders, Westminster Community Homes /Homes and Communities Agency, SHESP, CESP, Decent Homes (GLA), Technology Strategy Board. Also private funding / FITs for PV in wider Queens Park area (not included in figures here)
Wandle Valley
£772,200 £295,800 £476,500 Merton Council, NEA, Future Jobs Fund, Circle Anglia, CESP, EU, London Councils, Technology Strategy Board, Moixa, Haslemere primary school, Sustainable Merton, Thames Water, CERT, Thames Water
Totals £36,220,4006 £2,718,000
6 £33,502,400
6 Figures may be more of less than totals due to rounding
RE:CONNECT analysis: Summary report September 2014
9
In addition, the GLA-organised quarterly get-togethers between the various RE:CONNECT local
authorities which were noted as a helpful opportunity to share advice between authorities on
available funding streams, and on how specific funds were successfully leveraged.
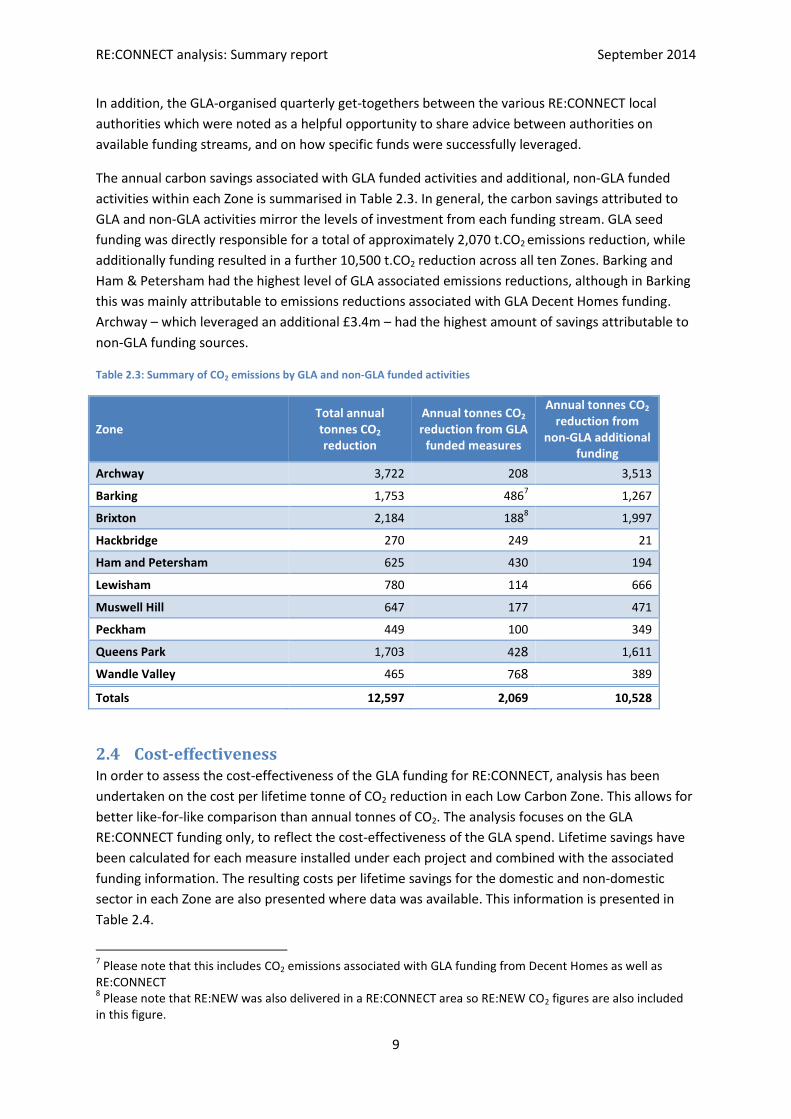
The annual carbon savings associated with GLA funded activities and additional, non-GLA funded
activities within each Zone is summarised in Table 2.3. In general, the carbon savings attributed to
GLA and non-GLA activities mirror the levels of investment from each funding stream. GLA seed
funding was directly responsible for a total of approximately 2,070 t.CO2 emissions reduction, while
additionally funding resulted in a further 10,500 t.CO2 reduction across all ten Zones. Barking and
Ham & Petersham had the highest level of GLA associated emissions reductions, although in Barking
this was mainly attributable to emissions reductions associated with GLA Decent Homes funding.
Archway – which leveraged an additional £3.4m – had the highest amount of savings attributable to
non-GLA funding sources.
Table 2.3: Summary of CO2 emissions by GLA and non-GLA funded activities
Zone Total annual tonnes CO2 reduction
Annual tonnes CO2 reduction from GLA
funded measures
Annual tonnes CO2 reduction from
non-GLA additional funding
Archway 3,722 208 3,513
Barking 1,753 4867 1,267
Brixton 2,184 1888 1,997
Hackbridge 270 249 21
Ham and Petersham 625 430 194
Lewisham 780 114 666
Muswell Hill 647 177 471
Peckham 449 100 349
Queens Park 1,703 428 1,611
Wandle Valley 465 768 389
Totals 12,597 2,069 10,528
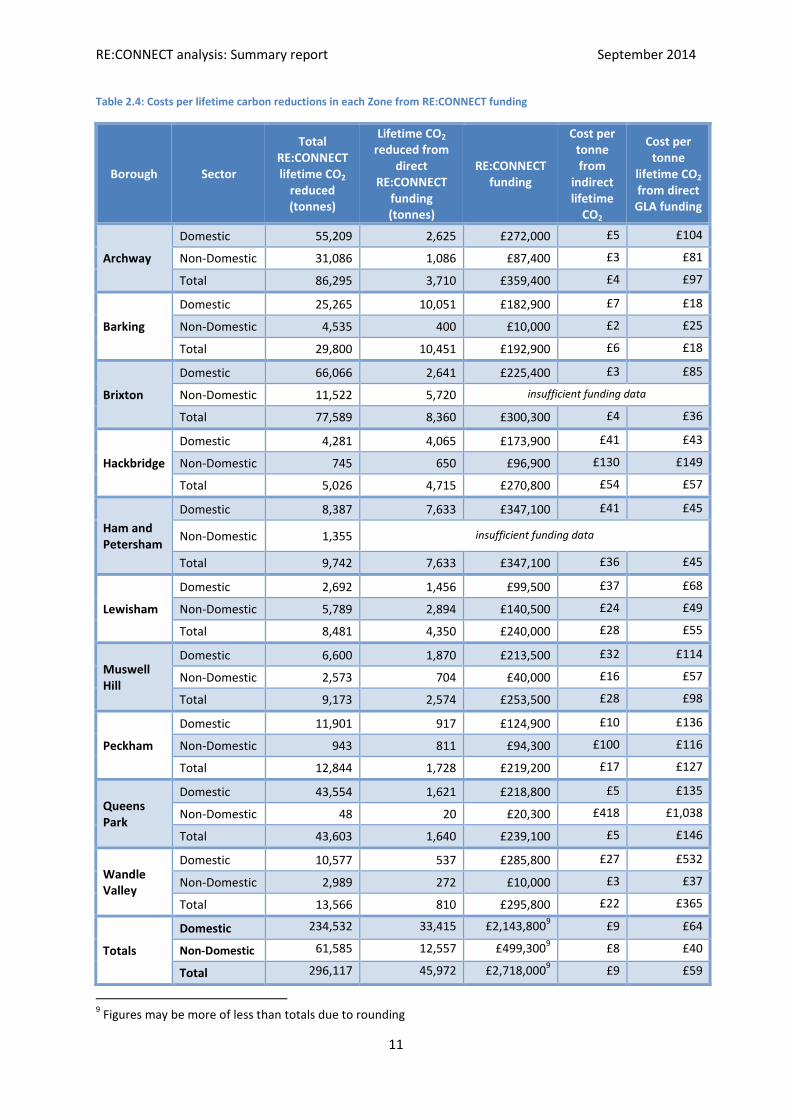
2.4 Cost-effectiveness In order to assess the cost-effectiveness of the GLA funding for RE:CONNECT, analysis has been
undertaken on the cost per lifetime tonne of CO2 reduction in each Low Carbon Zone. This allows for
better like-for-like comparison than annual tonnes of CO2. The analysis focuses on the GLA
RE:CONNECT funding only, to reflect the cost-effectiveness of the GLA spend. Lifetime savings have
been calculated for each measure installed under each project and combined with the associated
funding information. The resulting costs per lifetime savings for the domestic and non-domestic
sector in each Zone are also presented where data was available. This information is presented in
Table 2.4.
7 Please note that this includes CO2 emissions associated with GLA funding from Decent Homes as well as
RE:CONNECT 8 Please note that RE:NEW was also delivered in a RE:CONNECT area so RE:NEW CO2 figures are also included
in this figure.
RE:CONNECT analysis: Summary report September 2014
10
RE:CONNECT seed funding paid for direct CO2 emissions reductions of 2,069 t.CO2. The average cost
efficiency for these direct emissions reductions was £59 per lifetime t.CO2. However, when looking
at both the direct and indirect CO2 emissions delivered by the other funding in the Zone, the GLA
cost efficiency was £9 per lifetime t.CO2
For domestic projects, the cost per lifetime savings associated with direct GLA funding varies
between £18 per lifetime t.CO2 in Barking to £532 per lifetime t.CO2 in Wandle Valley, with an
average of £64. Compared to CERT and Energy Company Obligation (ECO)-traded prices, the indirect
CO2 emissions reductions price is very low at an average of £9. However, the cost per tonne of CO2
for direct GLA emissions is more in line with prices for hard to treat properties.
For non-domestic measures, some projects were missing information for funding and carbon
emissions in different Zones, so it has not been possible to produce a figure for each non-domestic
sector in each Zone. However, using the information available, the cost of carbon reduction
programmes in non-domestic projects as a whole had average costs of £40 per lifetime tonne of CO2
of direct GLA funding (around two thirds of the average for domestic projects), and £8 for indirect
lifetime savings in the Zone, in line with the domestic sector.
RE:CONNECT analysis: Summary report September 2014
11
Table 2.4: Costs per lifetime carbon reductions in each Zone from RE:CONNECT funding
Borough Sector
Total RE:CONNECT lifetime CO2
reduced (tonnes)
Lifetime CO2 reduced from
direct RE:CONNECT
funding (tonnes)
RE:CONNECT funding
Cost per tonne from
indirect lifetime
CO2
Cost per tonne
lifetime CO2 from direct GLA funding
Archway
Domestic 55,209 2,625 £272,000 £5 £104
Non-Domestic 31,086 1,086 £87,400 £3 £81
Total 86,295 3,710 £359,400 £4 £97
Barking
Domestic 25,265 10,051 £182,900 £7 £18
Non-Domestic 4,535 400 £10,000 £2 £25
Total 29,800 10,451 £192,900 £6 £18
Brixton
Domestic 66,066 2,641 £225,400 £3 £85
Non-Domestic 11,522 5,720 insufficient funding data
Total 77,589 8,360 £300,300 £4 £36
Hackbridge
Domestic 4,281 4,065 £173,900 £41 £43
Non-Domestic 745 650 £96,900 £130 £149
Total 5,026 4,715 £270,800 £54 £57
Ham and Petersham
Domestic 8,387 7,633 £347,100 £41 £45
Non-Domestic 1,355 insufficient funding data
Total 9,742 7,633 £347,100 £36 £45
Lewisham
Domestic 2,692 1,456 £99,500 £37 £68
Non-Domestic 5,789 2,894 £140,500 £24 £49
Total 8,481 4,350 £240,000 £28 £55
Muswell Hill
Domestic 6,600 1,870 £213,500 £32 £114
Non-Domestic 2,573 704 £40,000 £16 £57
Total 9,173 2,574 £253,500 £28 £98
Peckham
Domestic 11,901 917 £124,900 £10 £136
Non-Domestic 943 811 £94,300 £100 £116
Total 12,844 1,728 £219,200 £17 £127
Queens Park
Domestic 43,554 1,621 £218,800 £5 £135
Non-Domestic 48 20 £20,300 £418 £1,038
Total 43,603 1,640 £239,100 £5 £146
Wandle Valley
Domestic 10,577 537 £285,800 £27 £532
Non-Domestic 2,989 272 £10,000 £3 £37
Total 13,566 810 £295,800 £22 £365
Totals
Domestic 234,532 33,415 £2,143,8009 £9 £64
Non-Domestic 61,585 12,557 £499,3009 £8 £40
Total 296,117 45,972 £2,718,0009 £9 £59
9 Figures may be more of less than totals due to rounding
RE:CONNECT analysis: Summary report September 2014
12
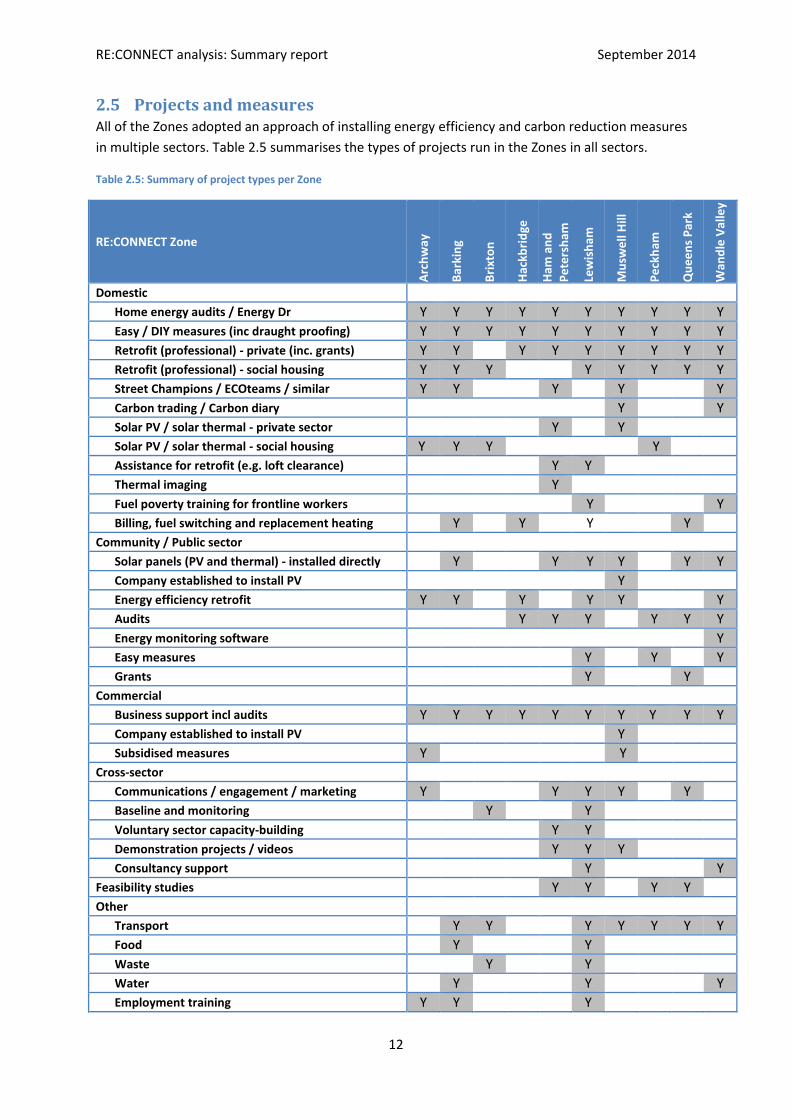
2.5 Projects and measures All of the Zones adopted an approach of installing energy efficiency and carbon reduction measures
in multiple sectors. Table 2.5 summarises the types of projects run in the Zones in all sectors.
Table 2.5: Summary of project types per Zone
RE:CONNECT Zone
Arc
hw
ay
Bar
kin
g
Bri
xto
n
Hac
kbri
dge
Ham
an
d
Pe
ters
ham
Lew
ish
am
Mu
swe
ll H
ill
Pe
ckh
am
Qu
ee
ns
Par
k
Wan
dle
Val
ley
Domestic
Home energy audits / Energy Dr Y Y Y Y Y Y Y Y Y Y
Easy / DIY measures (inc draught proofing) Y Y Y Y Y Y Y Y Y Y
Retrofit (professional) - private (inc. grants) Y Y Y Y Y Y Y Y Y
Retrofit (professional) - social housing Y Y Y Y Y Y Y Y
Street Champions / ECOteams / similar Y Y Y Y Y
Carbon trading / Carbon diary Y Y
Solar PV / solar thermal - private sector Y Y
Solar PV / solar thermal - social housing Y Y Y Y
Assistance for retrofit (e.g. loft clearance) Y Y
Thermal imaging Y
Fuel poverty training for frontline workers Y Y
Billing, fuel switching and replacement heating Y Y Y Y
Community / Public sector
Solar panels (PV and thermal) - installed directly Y Y Y Y Y Y
Company established to install PV Y
Energy efficiency retrofit Y Y Y Y Y Y
Audits Y Y Y Y Y Y
Energy monitoring software Y
Easy measures Y Y Y
Grants Y Y
Commercial
Business support incl audits Y Y Y Y Y Y Y Y Y Y
Company established to install PV Y
Subsidised measures Y Y
Cross-sector
Communications / engagement / marketing Y Y Y Y Y
Baseline and monitoring Y Y
Voluntary sector capacity-building Y Y
Demonstration projects / videos Y Y Y
Consultancy support Y Y
Feasibility studies Y Y Y Y
Other
Transport Y Y Y Y Y Y Y
Food Y Y
Waste Y Y
Water Y Y Y
Employment training Y Y Y
RE:CONNECT analysis: Summary report September 2014
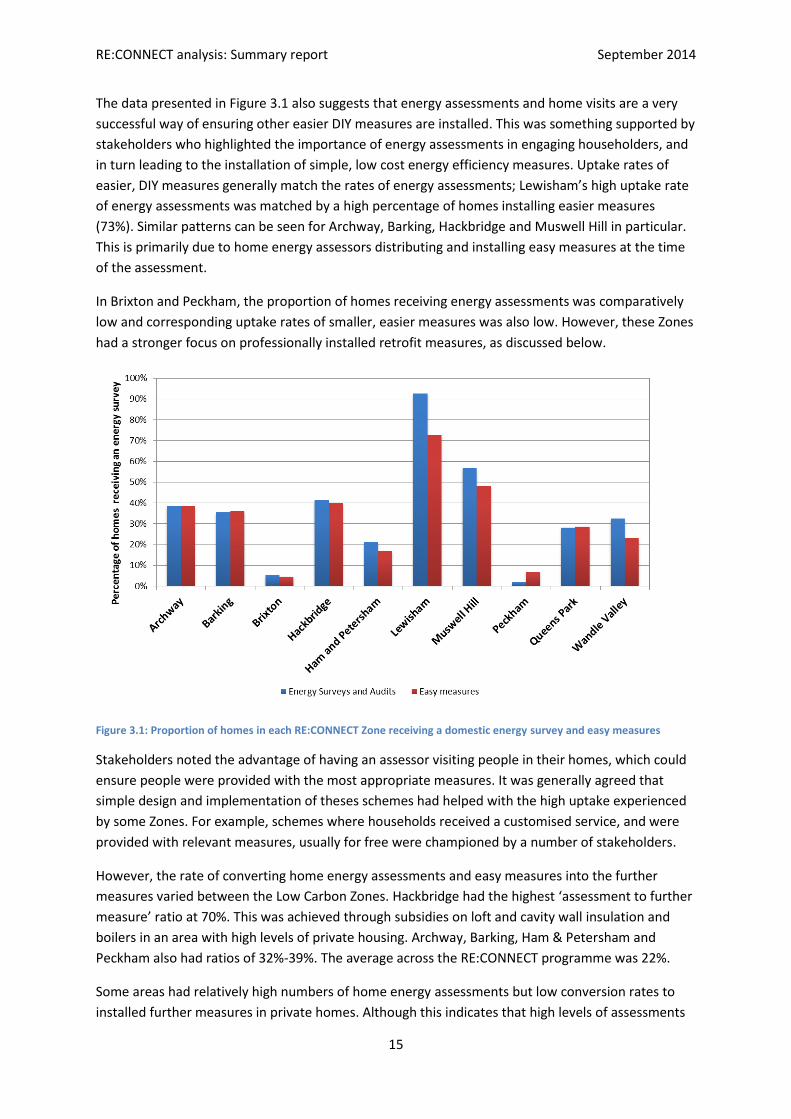
13
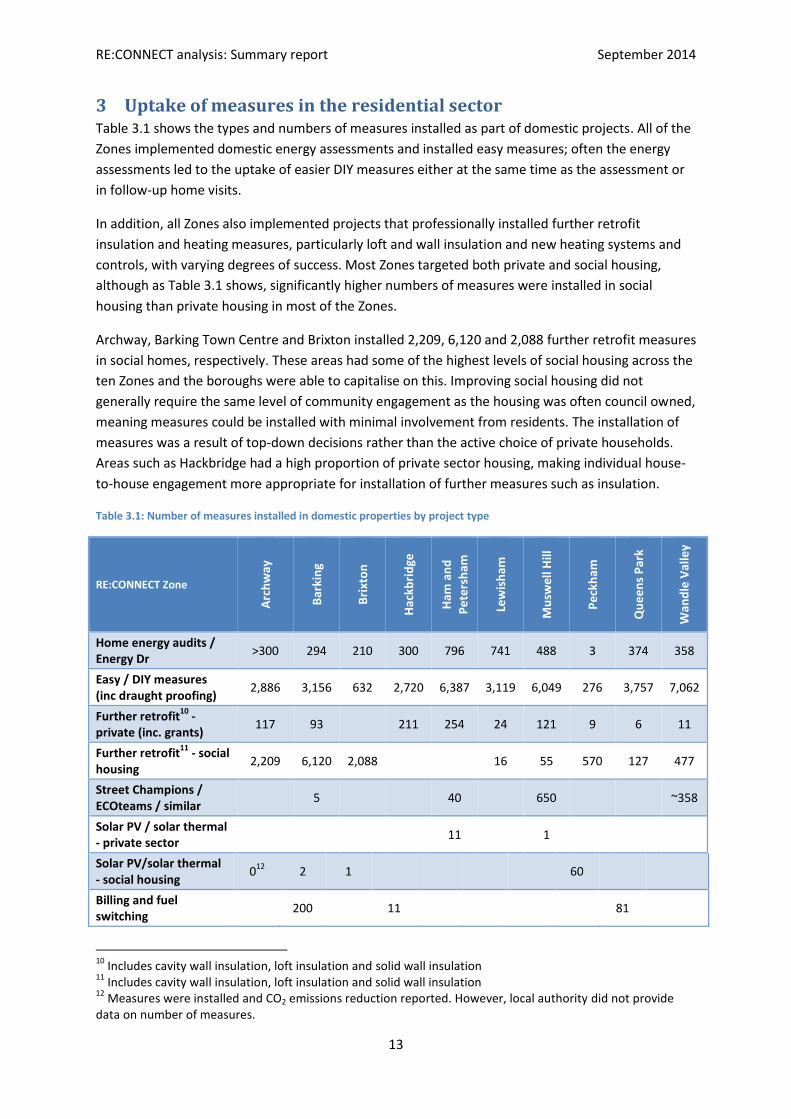
3 Uptake of measures in the residential sector Table 3.1 shows the types and numbers of measures installed as part of domestic projects. All of the
Zones implemented domestic energy assessments and installed easy measures; often the energy
assessments led to the uptake of easier DIY measures either at the same time as the assessment or
in follow-up home visits.
In addition, all Zones also implemented projects that professionally installed further retrofit
insulation and heating measures, particularly loft and wall insulation and new heating systems and
controls, with varying degrees of success. Most Zones targeted both private and social housing,
although as Table 3.1 shows, significantly higher numbers of measures were installed in social
housing than private housing in most of the Zones.
Archway, Barking Town Centre and Brixton installed 2,209, 6,120 and 2,088 further retrofit measures
in social homes, respectively. These areas had some of the highest levels of social housing across the
ten Zones and the boroughs were able to capitalise on this. Improving social housing did not
generally require the same level of community engagement as the housing was often council owned,
meaning measures could be installed with minimal involvement from residents. The installation of
measures was a result of top-down decisions rather than the active choice of private households.
Areas such as Hackbridge had a high proportion of private sector housing, making individual house-
to-house engagement more appropriate for installation of further measures such as insulation.
Table 3.1: Number of measures installed in domestic properties by project type
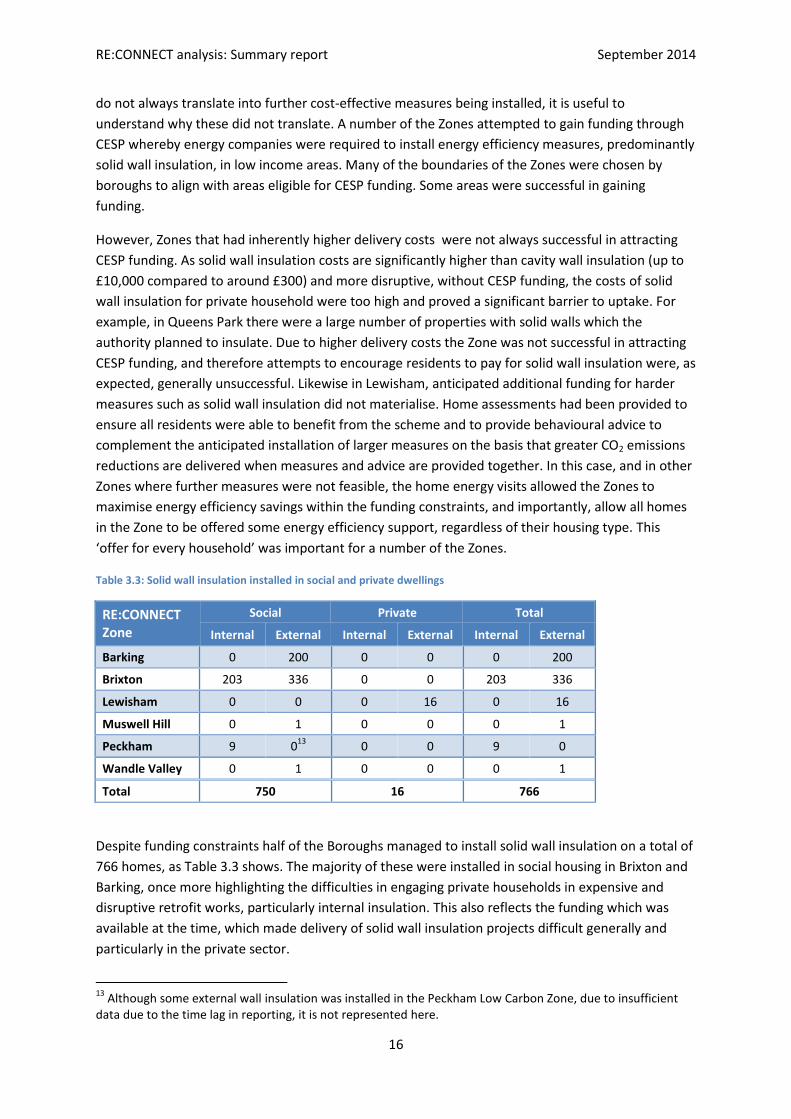
Despite funding constraints half of the Boroughs managed to install solid wall insulation on a total of
766 homes, as Table 3.3 shows. The majority of these were installed in social housing in Brixton and
Barking, once more highlighting the difficulties in engaging private households in expensive and
disruptive retrofit works, particularly internal insulation. This also reflects the funding which was
available at the time, which made delivery of solid wall insulation projects difficult generally and
particularly in the private sector.
13
Although some external wall insulation was installed in the Peckham Low Carbon Zone, due to insufficient data due to the time lag in reporting, it is not represented here.
RE:CONNECT analysis: Summary report September 2014
17
4 Uptake of measures in the non-domestic sector Across the different Zones, projects that focused on community and public buildings were more
diverse than domestic projects, reflecting the larger variety of buildings being targeted. The most
commonly occurring projects focused on energy audits, energy efficiency retrofits and the
installation of solar panels, which were installed on schools in six of the Zones.
Most of the Zones opted for business support and energy audits of businesses and commercial
properties. However, Archway also negotiated a successful lighting systems upgrade programme by
offering significant subsidies to businesses.
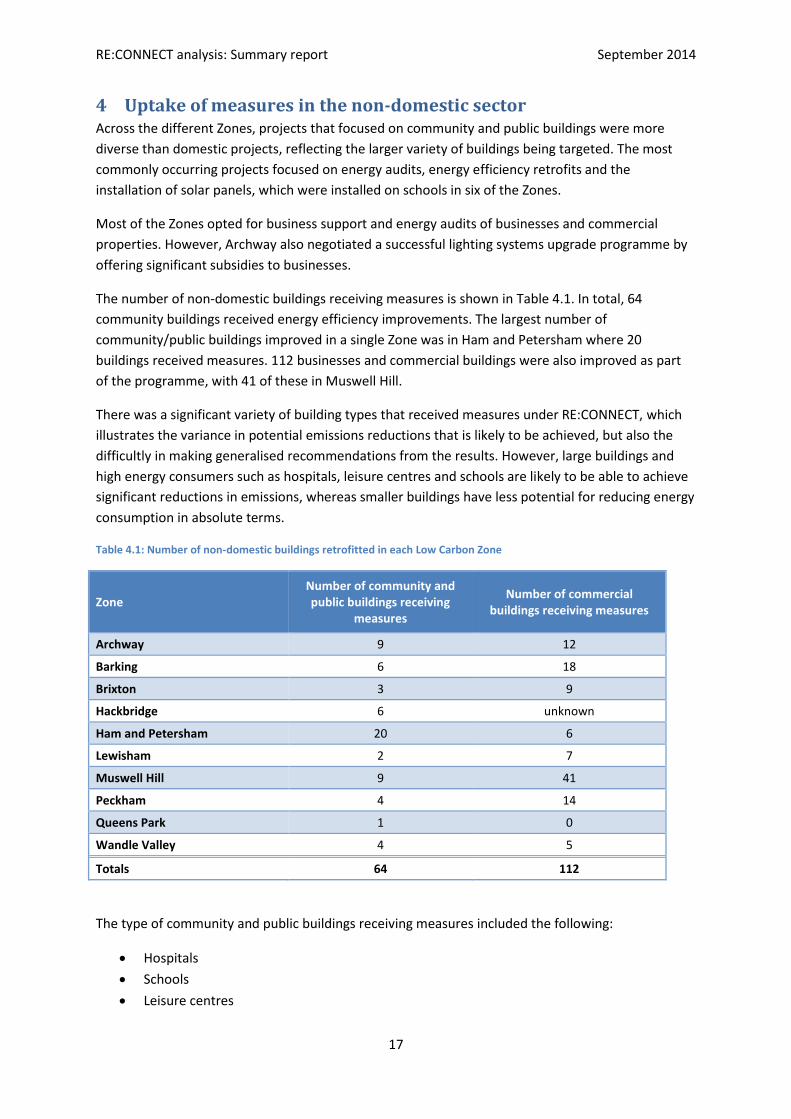
The number of non-domestic buildings receiving measures is shown in Table 4.1. In total, 64
community buildings received energy efficiency improvements. The largest number of
community/public buildings improved in a single Zone was in Ham and Petersham where 20
buildings received measures. 112 businesses and commercial buildings were also improved as part
of the programme, with 41 of these in Muswell Hill.
There was a significant variety of building types that received measures under RE:CONNECT, which
illustrates the variance in potential emissions reductions that is likely to be achieved, but also the
difficultly in making generalised recommendations from the results. However, large buildings and
high energy consumers such as hospitals, leisure centres and schools are likely to be able to achieve
significant reductions in emissions, whereas smaller buildings have less potential for reducing energy
consumption in absolute terms.
Table 4.1: Number of non-domestic buildings retrofitted in each Low Carbon Zone
Zone Number of community and public buildings receiving
measures
Number of commercial buildings receiving measures
Archway 9 12
Barking 6 18
Brixton 3 9
Hackbridge 6 unknown
Ham and Petersham 20 6
Lewisham 2 7
Muswell Hill 9 41
Peckham 4 14
Queens Park 1 0
Wandle Valley 4 5
Totals 64 112
The type of community and public buildings receiving measures included the following:
Hospitals
Schools
Leisure centres
RE:CONNECT analysis: Summary report September 2014
18
Community centres
Libraries
Police stations
Fire stations
Town halls
GP surgery
The types of commercial properties and buildings being improved in several Zones included:
Supermarket
Beauty salon/Hairdresser
Restaurant
Pharmacy
Offices
The following sections present the types and numbers of each measure installed in commercial
properties (Section 4.1) and community and public buildings (Section 4.2).
4.1 Commercial Sector Analysis Nearly all Zones undertook activities in the commercial sector predominantly with small to medium
enterprises (SMEs), although a number of Zones reported difficulties in engaging with businesses,
particularly SMEs. The most common explanation for this was funding constraints whereby free
measures were not available and several Zones could only offer audits, carbon foot-printing or
energy efficiency advice, which did not necessarily fit with the SMEs’ needs. In additional, several
interviewees noted that many of the SMEs had fewer than five employees and, as such, dedicating
time to an energy efficiency advisor was not a priority. Finally, many of these small businesses
rented premises meaning they were either unable or unmotivated to make changes in the building,
especially if they had to pay or partly pay for measures themselves.
However, a number of Zones were successful in achieving significant savings in the commercial
sector. Most of these were achieved through energy audits and monitoring, energy efficient light
bulb replacements and installing energy efficient lighting systems. Overall, Brixton achieved the
highest emissions reductions, largely through multiple ‘further’ retrofit measures such as new
boilers in a small number of SMEs. Archway and Muswell Hill also had a greater level of success
engaging with SMEs; in Archway this was partly attributed to a strong sense of community, with
good communication between local businesses. As with other Zones, Archway offered free audits for
businesses, but a key difference being that this was followed up with a grant of up to 80% of the cost
of installing energy efficient lighting.
Muswell Hill also had a light bulb amnesty and offered free, comprehensive audits to reduce energy
use by working with the University of Middlesex and the Global Action Plan. Audits were followed up
with awards for businesses which spurred interest as businesses were attracted by the opportunity
to communicate their successes with customers. This is an interesting finding, as it shows that
prestige can be a great motivator to engage SMEs with, as opposed to solely focussing on financial
savings.
RE:CONNECT analysis: Summary report September 2014
19
Some Zones tried engaging with larger business chains but found that there was usually a corporate
social responsibility strategy determined centrally, leaving little flexibility and control at the local
level. A notable exception was the success of Muswell Hill, where community owned solar panels
were installed on the local Marks & Spencer.
Zones reported that the ability to capitalise on relationships that already existed within a given local
authority, working with other council departments, and finding external partners helped them
achieve their objectives, particularly in a resource-constrained environment.
4.2 Community/Public Sector Analysis The Zones with the highest CO2 emissions reductions from the commercial and public sectors were
those with large buildings located within the Zones. Overall, the majority of the savings were
achieved through a range of easier measures (draughtproofing and energy efficient lightbulbs),
although a number of Zones also upgraded heating systems and controls, upgraded lighting systems
and installed a range of insulation measures.
As shown in Section 2, Archway was the most successful in terms of reducing emissions from
community and public buildings. This success was due in part to Islington Council’s Climate Change
Partnership – an initiative designed to engage local businesses in energy saving opportunities. Whilst
the majority of these reductions were from the hospital in the Zone, other projects focused on
installing lighting, insulation, heating and solar arrays in other large energy consuming buildings,
including several schools, a leisure centre and a community centre. While the total number of
buildings improved is fewer than in some other Zones, the buildings that have been improved are
generally larger and demonstrated significant potential for emissions reduction. Furthermore, the
measures that have been installed are high impact measures that are likely to result in the most
significant long term savings.
Brixton also achieved significant savings in a small number of community buildings, again by focusing
on large properties. Emissions reductions here were mostly the result of a substantial lighting system
retrofit, but behaviour changes and improved housekeeping also contributed to the savings total.
It was noted that in the case of community buildings, flexibility was important as each building had
different requirements and managers with their own priorities. For example, Haringey Council
supported the successful retrofitting of a local dance academy, and as part of this process helped the
Academy complete a feasibility study for funding to get the building re-clad and re-glazed – a long-
term objective of the Academy. Assisting them in achieving their own objectives ensured a trusted
relationship that allowed a successful outcome for both parties.
Capitalising on existing relationships within engaged community groups was also important for
working in community buildings and institutions. For example, the Muswell Hill Sustainability Group
(MHSG) was instrumental in ensuring a good relationship with three local schools where PV was
installed; they were particularly fortunate to have a local governor within MHSG who facilitated the
process.
RE:CONNECT analysis: Summary report September 2014
20
5 Other successes In addition to the CO2 emissions reductions and energy savings achieved in the Low Carbon Zones,
there were a number of other wider impacts. In the case of Wandle Valley, the relationship that was
established between the local council and Sustainable Merton has been repeated in subsequent
projects, such as a Green Deal pilot project. For example, work with young people in the Zone led to
11 people going into employment or education. A detailed report on the Wandle Valley Zone is
available at http://www.merton.gov.uk/wvlcz_final_report_2012.pdf.
Similarly in Muswell Hill, the MHSG continues to be involved in several projects and has held more
events as well as initiating an active discussion regarding the potential for installing solar at a large
local social housing scheme. This work is being pursued in partnership with the council and they
hope to release another community share offer as a result. MHSG are also considering more
business engagement in the future, including using the offering of free/heavily subsidised LEDs as a
hook for businesses to complete a survey, which may then lead to them being able to access
additional subsidised energy efficiency measures.
In Brixton, the social enterprise Community Draught Busters built their expertise by installing
measures in properties previously identified by the Green Doctors (funding for the delivery of
Groundwork’s Green Doctors programme was only for six months). Both of these community groups
have established strong legacies that have continued following the end of the project.
In addition, Brixton’s community led initiative has been held up as exemplary not just within London
but also across other parts of the country. The model proved so successful that the Zone manager
went on to co-found Repowering London, which now provides advice and expertise to the council in
order to extend the scheme to the rest of the borough.
Lewisham Council delivered participatory budgeting, building on work the Council had undertaken
previously around this type of community engagement and using this in an environmental context.
This led to engagement amongst residents and an online forum was established which enabled
people to discuss environmental issues and share ideas. The community chose to increase recycling
facilities around the social housing blocks within the Zone. These blocks previously had low levels of
recycling and issues with fly-tipping but recycling increased significantly across all of the blocks.
Finally, RE:CONNECT was able to provide the foundation for key demonstration projects under the
Low Carbon London programme. Led by London’s electricity distribution network operator UK Power
Networks, this major Smart Grid demonstrator used the Zones to deploy smart meters, to put
communication and automation technology across the network and to run a set of trials to emulate
a Smart Grid such as Time of Use tariffs and monitoring of PV panels and CHP usage and their grid
impacts14.
14
The full results of those trials will be available at http://innovation.ukpowernetworks.co.uk/innovation/en/Projects/tier-2-projects/Low-Carbon-London-(LCL)/
RE:CONNECT analysis: Summary report September 2014
21
6 Conclusions Cross comparison between the Zones and general recommendations are not applicable to all types
of areas. Nevertheless, this section presents a series of conclusions from the data analysis and
interviews with stakeholders to consider when designing future area-based carbon reduction
programmes.
Make-up of areas and use of data
The characteristics of each Zone have a significant influence on the types of project that will be most
effective. Some Zones had more businesses (both large and small), community groups or community
buildings to work with than others; the housing make-up of areas differed; and the social capital and
community- involvement varied hugely across Zones. Therefore, having a clear understanding of the
make-up of a Zone in terms of demographics, housing type and tenure, scale and type of public
buildings, and commercial buildings is important in designing the most effective programme for a
given area.
The Low Carbon Zones used data to understand the composition of homes and buildings within their
area and to target their programme of work to varying degrees. Publically, freely available small area
statistics and data are obtainable from a range of sources15 and other data is available at a small
cost, for example, domestic EPC data providing information on efficiency of individual houses has
subsequently become available since the Low Carbon Zone project finished (although this does not
cover all properties in the country). Local authorities should also have access to internal datasets
such as social housing stock, private sector housing condition surveys, Warm Front and Building
Control data.
The form, comprehensiveness and accuracy of data that was used varied between authorities, as did
the usefulness of particular datasets. Some authorities had comprehensive internal databases, and
internal energy expertise to manipulate the data usefully. Internal data coverage for the Zones was
generally more comprehensive where there was a higher proportion of public rather than private
housing within the Zone (i.e. local authorities are less likely to hold comprehensive and accurate
data about the latter). Some authorities used housing archetypes to predict the private housing
make-up, whilst others procured additional datasets held privately; for example, one authority used
the Energy Saving Trust’s HEED data. One authority mentioned that the poor accuracy of data used
meant that the number of measures that they predicted they could install was far higher than what
they were actually able to install.
Using data should be encouraged by ensuring that expertise and resources are available for a
specific project and that preliminary data analysis is awarded upfront priority. It assists in a number
of ways, most significantly in understanding the make-up and composition of an area and in
targeting specific projects at the most suitable housing. This results in more targeted efficiencies and
projects with higher impacts. For example, a specific data use recommendation for non-domestic
15
These include Office for National Statistics (ONS), Neighbourhood Statistics, Index of Multiple Deprivation (IMD), Department for Energy and Climate Change (DECC) and Department for Communities and Local Government (DCLG).
RE:CONNECT analysis: Summary report September 2014
22
projects would be to identify larger public buildings that are the least efficient by using EPC ratings
data16 (which includes floor areas) and focus on engaging and targeting those as a priority.
Similarly, levels of priority should also be given to collection of data during a scheme in order to
effectively and efficiently obtain feedback on the success or otherwise of different interventions and
approaches.
Reducing emissions from social housing
Retrofitting social housing proved to be very successful for reducing CO2 emissions in a number of
Zones, particularly areas with social housing in the form of high-rise flats and low-rise estates. In
these Zones, a high proportion of properties received retrofitting measures and large savings were
achieved (e.g. Archway and Brixton). Works conducted on social housing can be more
straightforward in terms of securing funding and the ability to professionally install higher cost,
larger impact measures such as insulation and heating improvements. Furthermore, social tenants
are more likely to be receptive to works conducted when: a) no capital investment is required by
them; and b) they are likely to experience warmer homes and/or lower utility bills as a result of the
measures. Local authorities and Housing Associations can also have requirements to achieve energy
efficiency and carbon reduction targets in social housing stocks and this type of intervention is likely
to be given a higher priority than engaging with privately owned or rented property owners. Local
authorities and social housing providers can receive support to retrofit their social housing stock
through the London RE:NEW programme. More information is available at
www.london.gov.uk/renew.
Reducing emissions from private households
All Zones conducted domestic energy assessments as a method of auditing and implementing
household behavioural change. It was consistently noted by interviewees as being particularly
successful in terms of engaging householders, and leading to the installation of simple, low cost
energy efficiency measures. The most successful domestic projects also seemed to benefit from a
simple yet flexible approach. A good example of this being where households received a customised
service following an energy assessment, and were provided with a series of relevant measures that
had been identified as being beneficial to their homes. Future schemes could seek to follow these
successes and note the benefit and positive impact of door-to-door, face-to-face engagement with
households.
However, to ensure that CO2 emissions are maximised, engagement and installation of easy
measures should translate into ‘further measures’ being installed. The rate of converting home
energy assessments and easy measures into the further measures varied between the Low Carbon
Zones. The most successful Zones at conversion were those that had relatively high amounts of
homes with ‘easy’ loft and cavity walls that needed insulating. They targeted assessments on private
housing requiring loft and cavity wall insulation and boilers, and offered subsidies on these
measures. Local authorities should be aware that high levels of assessments do not always translate
into further cost-effective measures being installed. This is particularly the case in areas with high
levels of private solid walled properties where the significantly higher costs and disruption involved
16
Data available here: http://www.cse.org.uk/resources/open-data/display-energy-certificate-data