RE-DESIGN OF MARKETING DASHBOARD FOR
SUPPORTING MARKETING MANAGER IN DATA
ANALYSIS – THAI RETAILER PERSPECTIVES
BY
MR. JATUPHOL CHAWAPATNAKUL
AN INDEPENDENT STUDY SUBMITTED IN PARTIAL
FULFILLMENT OF
THE REQUIREMENTS FOR THE DEGREE OF
MASTER OF SCIENCE PROGRAM IN MARKETING
(INTERNATIONAL PROGRAM)
FACULTY OF COMMERCE AND ACCOUNTANCY
THAMMASAT UNIVERSITY
ACADEMIC YEAR 2015
COPYRIGHT OF THAMMASAT UNIVERSITY
RE-DESIGN OF MARKETING DASHBOARD FOR
SUPPORTING MARKETING MANAGER IN DATA
ANALYSIS – THAI RETAILER PERSPECTIVES
BY
MR. JATUPHOL CHAWAPATNAKUL
AN INDEPENDENT STUDY SUBMITTED IN PARTIAL
FULFILLMENT OF THE REQUIREMENTS FOR THE DEGREE
OF MASTER OF SCIENCE PROGRAM IN MARKETING
(INTERNATIONAL PROGRAM)
FACULTY OF COMMERCE AND ACCOUNTANCY
THAMMASAT UNIVERSITY
ACADEMIC YEAR 2015
COPYRIGHT OF THAMMASAT UNIVERSITY
(1)
Independent Study Title Re-Design of Marketing Dashboard for
Supporting Marketing Manager in Data Analysis
– Thai Retailer Perspectives
Author Mr. Jatuphol Chawapatnakul
Degree Master of Science Program in Marketing
(International Program)
Major Field/Faculty/University Faculty of Commerce and Accountancy
Thammasat University
Independent Study Advisor Professor Ken Miller, Ph.D.
Academic Years 2015
ABSTRACT
Marketing Dashboard design has been an area under spotlight since the introduction of
business data analysis. For retail business, where the competition is tough and rapid needs good
supporting information for creating strategies and taking actions to cope with different
situations in the competitive landscape. Due to the lack of business data analysis in the Thai
market and the transforming of consumer behavior over the explosion of social media and
online marketing, study of marketing dashboard design nowadays is still quite limited and its
paradigm is still shifting.
This study is a contemporary topic in academic marketing, which focuses on application
in technology (data collection and analysis) in order to improve the efficiency of marketing.
The total research duration is 90 days starting from 9th January to 7 April 2015. The objectives
of this research are to understand the data usage behavior of retailers in business analysis (eg.
Day to day operation, trend and customer feedbacks, campaign responses) and to identify
characteristics of data presented to make it easy to use for setting marketing strategy.
(2)
This study gathered data from secondary sources such as literature, articles and online
contents to create guidelines for the findings and analysis. Besides, primary sources were
collected through the in-depth interview of personnel that relate to marketing and data analysis
from 15 managers from different retail companies in Thailand to scope down the data collected
and findings from the secondary sources. The qualitative approach was used to analyze the
research findings.
Typically, they perform data analysis activities in 3 stages which are the planning stage,
the execution stage and the reporting stage. In this study, 4 out of 15 marketing managers from
Thai retailers are using a marketing dashboard, and the remaining 11 are using scheduled
reports and they have to request for additional ad-hoc reports from business intelligence
department in their data analysis processes. To design a marketing dashboard, the designer
should focus on the key design factors as the core of the design starting by marketing objectives,
KPIs, limitations, key issue patterns and the evaluation of marketing performances. After that,
the designer should consider the key design criteria that create direction of the design process,
and design features that are the scope that focuses on the functions of the dashboard to validate
the design and deliver the most efficiency to the managers.
Keywords: Marketing Dashboard, Marketing Strategy, Business Analytics, Customer
Relationship Management, Campaign Management, Key Performance Indicator, Big Data,
Management Information System, User Experience Design, Information Technology, Data
Visualization
(3)
ACKNOWLEDGEMENT
Without valuable contributions from the persons below who devoted their knowledge
and time in order to fulfill and complete this thesis and also support my studies in the Master’s
Degree at Thammasat University, I would have never achieved the final purposes of my
education. Therefore, I would like to express my deepest gratitude to the following people:
Prof. Dr. Ken Miller, my advisor who gave me valuable advices, guidance, suggestions
and valuable comments to the researches direction in this study. His contribution has led this
study to the completeness of the final outcome.
All 15 candidates for the interview who contributed their valuable time sharing their
experiences toward the marketing roles in different industries. Without their supports, this
study’s framework could never be fulfilled.
Mr. Pawin Suthapong who leaded me to know the word “dashboard” in the information
management and work efficiency perspectives making me realize my preferences and expertise.
Dr. Toni Ivergard who gave me the great passion in information management and work
efficiency improvement over his half-century experiences and exposures in control systems
design and ergonomics.
Prof. Dr. Philip C. Zerrillo, Asst. Prof. Pannapachr Itthiopassagul and MIM office staff,
especially Ms. Sirinadda Kaweewattana who contributed their best efforts in designing and
managing this world-class quality Master’s degree program. The whole 2-year period of
studying at Thammasat university has sharpen my perspectives, knowledge, attitudes and
exposures not only in the field of marketing, but also my personal qualifications.
(4)
Finally, I deeply appreciate supports from my family, my friends and my colleagues
who always supports me in all kind of activities in my life. I would have never completed this
thesis without their goodwill.
Jatuphol Chawapatnakul
7 April 2016
(5)
TABLE OF CONTENT
ABSTRACT (1)
ACKNOWLEDGEMENT (3)
TABLE OF CONTENT (5)
TABLE OF FIGURES (7)
CHAPTER 1 INTRODUCTION 1
1.1. Field of Research 2
1.2. Research Objectives 2
CHAPTER 2 REVIEW OF LITERATURE 3
2.1. Retail Business and Its General Objectives 3
2.2. Retail Marketing Managers’ Roles and Responsibilities 3
2.3. Retail Business Situation in Thailand in 2015 4
2.4. Retail Business and the Evolution of Big Data 5
2.5. Big Data Analysis; Tools and Objectives for Retail Marketing 6
2.6. Information Dashboard: Critical Information at a Glance 6
2.6.1. Advantages of Implementing Marketing Dashboard 7
2.6.2. Key Consideration in Dashboard Design 7
2.6.3. Methodology in Designing an Information Dashboard 8
2.6.4. Information Dashboard Characteristics 9
CHAPTER 3 RESEARCH METHODOLOGY 10
3.1. Secondary Data 10
(6)
3.2. Primary Data 10
3.3. Literature and Analysis Frameworks 11
CHAPTER 4 RESULTS AND DISCUSSION 13
4.1. Interview Results 13
4.1.1. Marketing Objectives of Retailers in Relation to Data Analysis 13
4.1.2. Marketing Managers’ Data Usage Behavior in Business Analysis 14
4.1.3. Obstacles for Marketing Managers’ in Their Data Analysis Activities 19
4.2. Observations from Existing Solutions 22
4.2.1. Klipfolio (Klipfolio, n.d.) 23
4.2.2. Qlickview (Qlick.com, n.d.) 25
4.2.3. Tableau (Tableau, n.d.) 27
4.2.4. Summary of Key Features from the Case Studies 28
CHAPTER 5 SUMMARY AND RECOMMENDATIONS 30
REFERENCES 35
APPENDIX – INTERVIEW QUESTIONS 40
BIOGRAPHY 42
(7)
TABLE OF FIGURES
Figure 1: Literature Framework (Developed from literature review) 11
Figure 2: Analysis Framework (Developed from research methodology) 12
Figure 3: Marketing Activity Life Cycle (Developed from the interview) 14
Figure 4: Marketing Managers' Data Analysis Processes in Planning Stage (Developed from
the interview) 15
Figure 5: Marketing Manager’s Works in General (Developed from the interview) 16
Figure 6: Marketing Managers' General Procedures in Data Analysis (Developed from the
interview) 17
Figure 7: General Data Flow Between Business Functions (Developed from the interview) 20
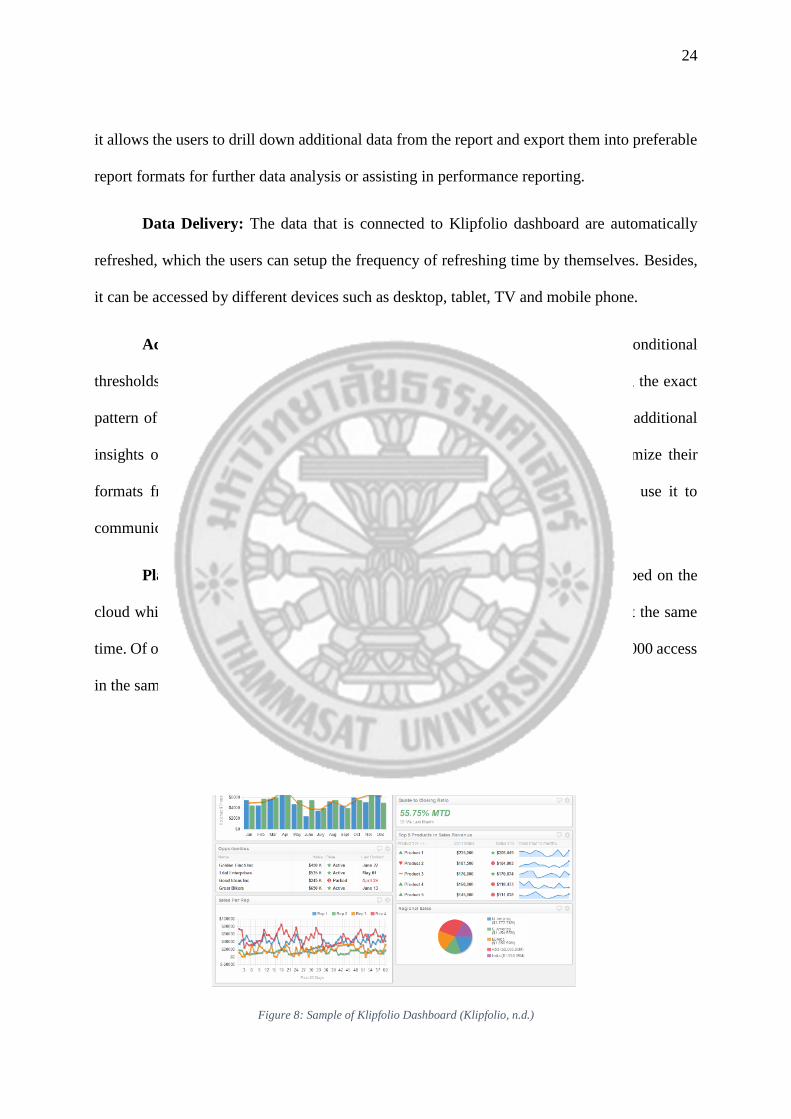
Figure 8: Sample of Klipfolio Dashboard (Klipfolio, n.d.) 24
Figure 9: Sample of Qlickview Dasoboard (Qlick.com, n.d.) 26
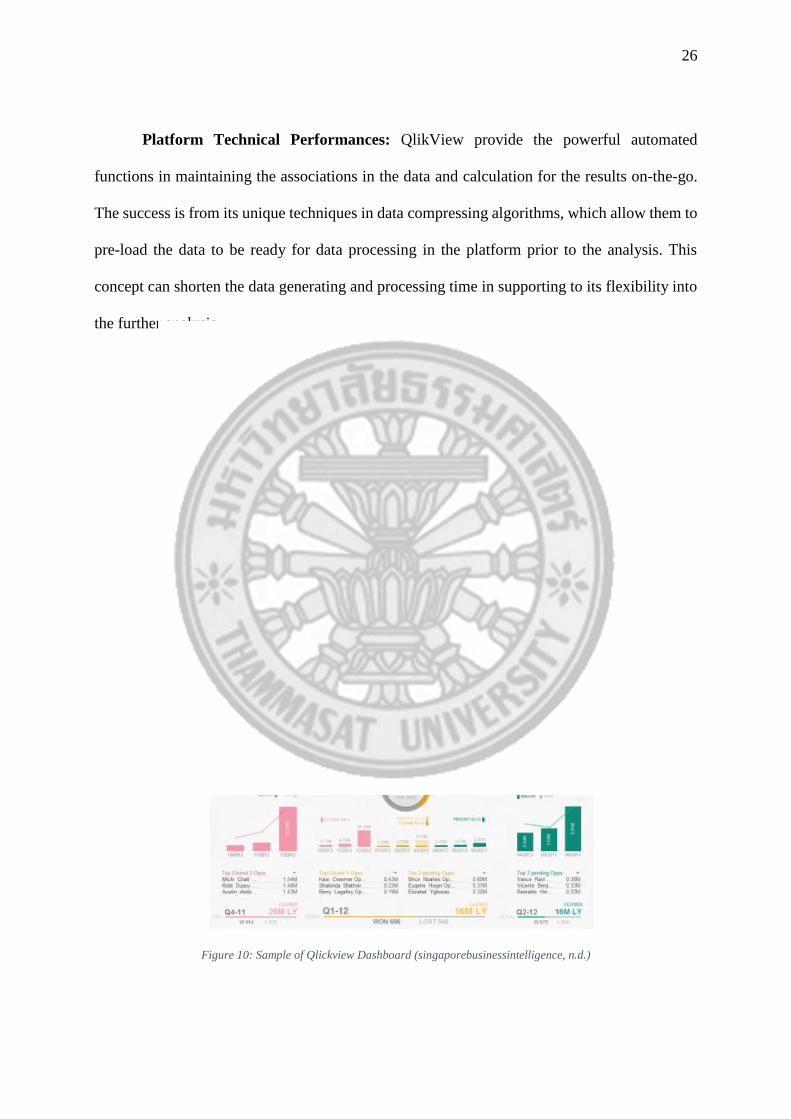
Figure 10: Sample of Qlickview Dashboard (singaporebusinessintelligence, n.d.) 26
Figure 11: Sample of Tableau Dashboard (Covalentmarketing.com, 2012) 28
Figure 12: Principle in Designing Marketing Dashboard (Developed from analysis and
findings) 32
1
CHAPTER 1
INTRODUCTION
In retail business, a large amount of data related to each individual retail company (eg.
sales transaction, customer data, review) is generated every second from various sources of
information. These data are valuable resources for business analysis for creating suitable
strategies for companies to improve performances in different functions such as business
operations, resource planning, sales and marketing. These benefits have driven data analysis
to become a crucial function that create competitive advantage for all companies. However, data
analysis in most companies in the market is not making good use of the collected data, since it requires
a lot of factors such as personnel’s knowledge in different fields and high capability of computer
software and hardware. Therefore, there are many data analysis platform providers offer software
solutions to manage and analyze data for each specific business functions.
Marketing is another business function that make uses a lot of retail data. It could be one of
the factors that create competitive advantages for a company, which makes the studies of marketing
data analysis to be more significant. Hence, the concept of information dashboard is introduced to
gather and display significant information necessary for management decision making and strategy
setting. Somehow, the design of dashboard requires a lot of knowledge, not only from the system
designers, but also the marketers, management and data analyst roles in the companies to drive the
best performance from the data analysis. Thailand, as one of the most competitive emerging
markets in the world has also paid much attention to the application of marketing data analysis
over a decade. This study’s findings will give guidelines for designing marketing dashboard for
readers who are marketing personnel, data system designer and managers who are responsible
for companies’ data and information systems in Thailand.
2
1.1. Field of Research
This study is a contemporary topic in academic marketing, which focuses on application
in technology (data collection and analysis) in order to improve the efficiency of marketing.
1.2. Research Objectives
This research was conducted to achieve the following objectives:
1. To understand the data usage behavior of retailers in business analysis (eg. Day to
day operation, trend and customer feedbacks, campaign responses).
2. To identify process in designing a dashboard to create the good characteristics of
data presentation for marketing data analysis.
From reading this study, the reader will be able to answer the following research question:
“How to design marketing dashboard for data analysis platform in the most effective
way for supporting Thai retailers’ business application?”
3
CHAPTER 2
REVIEW OF LITERATURE
Literature used in this study includes textbooks, articles, blogs discussions and online
contents related to big data management, retail business marketing and business analysis.
2.1. Retail Business and Its General Objectives
“Retail” is defined by Oxford Dictionary as “The sale of goods to the public in relatively
small quantities for use or consumption rather than for resale”. Depending on each individual
firm’s business strategies, retail objectives were defined differently. Lewis & Dart (2014)
suggested that, in general, the major objective of the retail business is to create revenue by
leading traffic into the store. To achieve the objective, retailers create the “touch points” that
attract the customers to buy the goods, which that is when marketing takes places. However,
there are different objectives are created into the company’s key performance indicators (KPI)
such as increasing of sales transaction, increasing ticket size, increasing gross profit, increasing
store traffic, increasing buying frequency, improving customers’ satisfaction level and reducing
losses. For marketing, the measurement of KPI achievement can also be considered toward the
activities’ success rate comparing to the investment such as return on investment, conversion
rate, target achievement, etc.
2.2. Retail Marketing Managers’ Roles and Responsibilities
Marketing Managers’ roles and responsibilities are usually defined differently in
different industries and companies. In general, they are diverse and varied, which majorly focus
to the same objective, to support the company sales performances. However, Merchant &
Demand (n.d.) have summarized that the roles and functions of marketing managers and
officers include:
4
1. Conducting Market Research: Marketing managers need to understand about
market situation including customers’ need and also the competitors’ movements to
verify the business opportunities.
2. Developing the Marketing Strategy: Marketing managers are responsible for
creating strategies to create the outline for the company’s direction and make sure
the company’s product or service would be delivered to the target customers
properly, effectively and efficiently.
3. Managing Customer Relationship: Marketing managers are accountable for
maintaining the customers’ relationship with the company to make sure the
customers are loyal to the company, spend more on the company’s
products/services and not switch to the other competitors.
4. Managing Employee: Marketing managers are in charge of managing the staffs
within the marketing department for the marketing activations to be executed
according to the plan and also collaborate with the other departments to deliver the
related tasks smoothly.
5. Identifying New Business Opportunities: With understanding of the market
situation, customers’ need, market trends and also activities within the company,
marketing managers are answerable for verifying business opportunities for setting
up the direction for the company.
2.3. Retail Business Situation in Thailand in 2015
In 2015, the Thai economy has improved from the year before when there were big
changes in Thai political situation due to the military coup in May 2014. Thai government
issued regulations to support the economic situation throughout the supply chain in most
industries ranged from manufacturing, production, logistics to the reduction of retail tax
5
campaigns for supporting spending within the country (Focus-economics.com, 2016). The
improvement of the economic situation caused retail sales value to gain 8% growth from 2014
up to US$163 billion in 2015 (Statista.com, 2016), which has stimulated the big retailers
including department stores, specialty stores, convenience stores, supermarkets and
hypermarkets to start expanding their new branches in the major cities throughout the country
(EuromonitorInternational, 2016). Besides, digital technologies became the significant
advertising channel in the retail businesses. The leading retailers have applied different online
advertising to promote their products and services by digital campaigns in social media, online
advertising and also e-commerce, which has significant growth for 15.29% in 2015 to the value
of US$13 billion (Boonnoon, 2015). Due to the high competition in the retailing landscape, the
advertising budget in the Thai retail market grew 2.8% up to US$3.75 billion in 2015.
2.4. Retail Business and the Evolution of Big Data
Revolution of technologies have created massive amount of data. Schmarzo (2013)
suggested that, for retail business, data is created every second from customers’ behavior in the
store such as time of purchase, amount of purchase, frequency of purchase, traffic in the store
and the products purchased altogether. These type of data are considered internal data that is
collected from the customers’ activities within the store. However, there are another type of
data that is collected from the customers outside the store, which are collected from market
researchers, social media and online media tracking, which collect the information regarding
the customers’ perception toward goods, market trend, customers’ intention to buy, etc. These
data are valuable resources that retailers collect to analyze the customers’ behavior, perception
and the company’s performance in order to improve their product and service.
6
2.5. Big Data Analysis; Tools and Objectives for Retail Marketing
According to LaValle, et. Al (2011), collection of retail data over decades cause
competitive benefits to the retail tremendously if the collected data is properly analyzed.
However, due to the massive amount of data collected, challenges that cause difficulties for the
analysis are the business creativity and knowledge in data synchronization and finding
relationships between data. Therefore, there are numbers of marketing solution software that
provides ease of analysis for the marketing manager to analyze and create strategy from
different kinds of data. Example of the data that most retailers analyze are Sales data, Market
data, Promotional and marketing data, Customer-centric data, Supply chain and operations data
and Merchandising data (James, 2010). These analysis of data from these tools can be used to
understand more about the customers, market and the retailers’ performance. Measurement can
be evaluated by the success of marketing campaigns, evaluate and determine buying patterns,
finding optimal mix of product types and quantities by time and location, etc.
2.6. Information Dashboard: Critical Information at a Glance
The dashboard concept was initially developed from control system in industrial process
for measuring the operation performance and monitor production status. The first dashboard was
introduced in the 1980s as the “Executive Information Systems” (EIS) to present the necessary
information for the executives for making decisions and create business strategies. The main
functional objective of dashboard design is to select and display the critical information for
managerial purposes into the limited space “clearly and immediately” (Few, 2013). For the
marketing objective, the dashboard should allow the users to see the bigger picture of the
marketing situations, manage the marketing activities more efficiently, monitor and compare
KPIs, choose effective channels, evaluate the funnels and the conversions, and reach the target
7
customers more effectively (Webseoanalytics.com, 2015). For the better understanding in the
marketing situation, the information in the dashboard can be presented in the form of graphical
information, illustration pictures, map and geographical images, texts, colors, etc.
2.6.1. Advantages of Implementing Marketing Dashboard
The reasons in implementing marketing dashboard is suggested by
Webseoanalytics.com (2015) into 6 topics that, it allows the company to:
• See the bigger picture of the marketing performances and situations
• Plan and makes the marketing activities to be executed more effectively
• Monitor, evaluate and compare the company’s Key Performance Indicators
(KPIs) toward different period of time, location, and campaigns
• Measure the efficiency of different marketing channels and optimize the
advertising budget effectively
• Verify the conversion rate of different activities performed in different stages of
marketing funnels
• Understand more about the company’s target market in terms of insights and
behaviors
In addition to the advantages mentioned above, Geckoboard.com (2016) has suggested
that the efficient marketing dashboard also allows the marketing managers to have the better
picture to “spot trends, seize possibilities and prevent looming problems” (geckoboard.com, n.d.).
2.6.2. Key Consideration in Dashboard Design
Salesforce.com, one of the leading CRM platform has suggested in its blog that, in order
to design an effective dashboard that can be used to demonstrate progresses and impact on the
8
business, it is significant that these “key consideration in the dashboard design” (Thornton, 2013)
are considered:
• What is the purpose of the dashboard?
• Who needs to see the dashboard?
• How often will the dashboard be seen?
• What will the dashboard look like?
• How much data is included and presented into the dashboard?
• What is the time period to cover in the dashboard?
The design concept should be aligned to the users’ expectations, not the designers’, to
make sure they can make the best use out of the designed dashboard. These questions suggested
by salesforce.com will lead the direction of the marketing dashboard design to create the best
practice and present all the necessary information for monitoring the performance of marketing
activities in different situations.
2.6.3. Methodology in Designing an Information Dashboard
With the key considerations are considered in the design process, Few (2013) has
suggested the preliminary methodology to design an effective information dashboard as follows:
• Begin with a definition
• Focus on goal, not the means
• Get into people’s heads
• Ask the right questions
• Identify information that really matters
• Identify useful context for measure
9
2.6.4. Information Dashboard Characteristics
There are various articles discussed about the good characteristics of marketing
dashboard in general. Sweetspotintelligence.com (2013) has suggested that the characteristics
of marketing dashboard should be:
• Clearly display the important matrices and key trends, KPIs, comparisons and
graphical or small tables of data and leads to actionable insights if needed
• Rapidly responses with notifications, whether it is good news, bad news or
normal situation to make sure that the marketing managers can evaluate and plan
to take actions to the situations in time
• Up to date with the quick-enough information as well as its accessibility to the
necessary information
• Flexibly allow the users to interact with easy-to-use features such as filtering
data and switching views
As summary of the literature review, data analysis has played significant roles in retail
business in achieving its business objectives. To serve the different business purposes, many
tools and systems are developed to analyze the collected marketing data. Moreover, the explosion
of social media and online marketing creates digital economy which shift the customers’ behavior to
change meaningfully which also result the paradigm of marketing data analysis to be changed all the
time. If the retail data is analyzed efficiently, it can be a key success in driving the companies’
competitiveness. Therefore, it is significant for the systems to present clear and prompt
information to the user effectively, which is key principles of the marketing dashboard design.
10
CHAPTER 3
RESEARCH METHODOLOGY
So as to collect the necessary information for the research purpose, the data was
collected from secondary and primary sources as follows.
3.1. Secondary Data
Collection of secondary data was conducted from the following aspects:
Case studies of 3 retail dashboards (Klipfolio, Qlickview and Tableau)
Success and failure cases of data analysis in retail business
Literature in the related fields (Business analysis, Information dashboard
design, etc.)
3.2. Primary Data
Primary data was collected by the qualitative approach based on interviews with
marketing manager, business analysts, MIS system manager or related roles and responsibilities
from 15 retailers in Thailand (excluding e-commerce channels) with topic coverage of issues
regarding marketing data analysis:
Objective of data analysis in marketing (Measure sales performance, Measure
success of campaigns, Management report, etc.)
Situations in marketing decision making (Routine activities, Ad-hoc activities,
Research for campaign setting, etc.)
Management report characteristics
Problems with data analysis in retail business application
11
3.3. Literature and Analysis Frameworks
Since the design of a system should be based on users’ objectives, the analysis of the
collected data made use of the primary data as the critical factors in scoping down the secondary
data. The following diagram illustrates the literature framework used as the guideline for
analyzing the collected data from this research.
Figure 1: Literature Framework (Developed from literature review)
First, the overall “big data” collected through different activities in retail business are
extracted down to become “marketing data” through the analysis of the retail landscape and
retail business objectives, which are the primary data collected from the in-depth interview, and
the functions and features of the marketing data analysis tools. Later on, the marketing data will
be seized and summarized from the roles and responsibilities of marketing managers to scope
and specify the features used to support the marketing mangers’ behavior in data analysis. After
that, observations to the case studies from current business dashboard solutions available in the
market will be used as the benchmarks to the interview result for summarizing the dashboard
12
characteristics, as well as the customers’ responses on their usage including problems, success
and failures and analysis purposes and situations. At last, the management report characteristics
will be used as the guideline that scope down the necessary information to be presented onto
the “marketing dashboard”. The analysis framework is illustrated as the diagram below:
Figure 2: Analysis Framework (Developed from research methodology)
In order to validate the research analysis as well as its results, the key independent
variables in this research including, retail type, currently used data management system,
management supports, personnel knowledge background. After controlling the Independent
variables, the dependent variables in this research should cover the following aspects:
Efficiency of the analytic platform. (to be measured by satisfaction level (ease of use)
of the user, increment of productivity in business in terms of sales, cost reduction)
Characteristics and function of the dashboard
13
CHAPTER 4
RESULTS AND DISCUSSION
4.1. Interview Results
4.1.1. Marketing Objectives of Retailers in Relation to Data Analysis
From the interview to 15 marketing managers in different retail industries in Thailand
including 4 banks, 3 supermarkets, 5 fashion retailers and 3 department stores (the name of the
companies and respondents are requested to be kept confidentially), 10 out of the 15
respondents suggested that their companies share similar marketing objectives, which are to
increase sales revenue by acquiring new customers, increase sales from the existing
customers, and prevent customers from switching brand. The goal of these marketing
objectives can be measured differently in each industry and each company’s KPIs such as return
on investment, target sales revenue, buying frequency, product holdings, gross profit margin
and ticket size. In order to fulfill these business objectives, they have to research, collect, study
and monitor sales data to understand the behaviors and needs of their prospect customers,
existing customers and also their lost customers. However, these analyses can be performed
under 2 specific circumstances:
1. The company have collected their customers’ information and an individual
customer can be identified (eg. membership, subscription, privileges)
2. The product/service provided by the company have long-term involvement with the
customers that allow them to purchase or have after-sales services provided the
company’s service/product frequently (eg. maintenance, interests fee, premium)
14
However, all the respondents from the remaining companies that still have not met the
above circumstances have also realized the importance of customers’ data analysis and have
tried to evolve by finding opportunities in promoting activities to collect their customers’ data.
Therefore, the finding and analysis in this study will be focusing onto the companies that has
successfully collected and analyze their marketing data by focusing onto their customers’ data.
Apart from customers’ data analysis, all respondents also analyze and create marketing
strategies from sales data in relation to location, channel, time and products, which allows
them to understand the customers’ needs and segment them by geographical areas.
4.1.2. Marketing Managers’ Data Usage Behavior in Business Analysis
From the interview result, task of the marketing managers in their marketing activity
life cycle can be summarized as in the diagram below:
Figure 3: Marketing Activity Life Cycle (Developed from the interview)
From above diagram, marketing managers’ tasks and responsibilities can be classified
by the characteristics of data analysis behavior into 3 stages:
15
1. Before the execution: Analyze and Verify Marketing Objectives and Create
Marketing Plan – The Planning Stage / Campaign Setup
The respondents suggested that the planning stage usually takes place at
the end of the year to set up the next step for their marketing strategies.
Therefore, most of the activities during this stage requires lots of data and
information to be analyzed. Their task start from the direction from management
which require them to study and analyze the market and company situation.
After that, they start from looking into overall status of the company’s current
performance, which majorly look into the sales performance of the company.
After that, they find out about the trends and opportunities for the business
expansions and create their marketing objectives or KPIs. Later on, they create
marketing plan for proposing to management by finding additional related data
to verify the target, set of activities, resources and investments to be executed
aligning with the expected timeline required for achieving the KPIs created by
the direction from management. When the plan is approved and ready to be
executed, they request the scheduled report from business intelligence
department or request them to generate the data matrices related to the marketing
plan for monitoring the performances. The process of data analysis behavior
during this stage can be illustrated as the diagram below:
Figure 4: Marketing Managers' Data Analysis Processes in Planning Stage
(Developed from the interview)
16
2. During the execution: Execute Marketing Activities, Monitor Sales Performances,
Adjust Strategies and Activations – The Day-to-Day Operation Stage
Duration of the execution process is the longest period of the marketing
managers’ roles and responsibilities (roughly 80% of their working time), which
can also be considered as their day-to-day operation. In summary of the
interview to the 15 respondents, the daily works for the marketing managers
share similar tasks characteristics. Even there are slight difference from the other
6 respondents in detail, 9 respondents suggested that their major tasks can be
summarized and illustrated below:
Figure 5: Marketing Manager’s Works in General (Developed from the interview)
The tasks within a day of a marketing manager starts with tasks and
communications management to make sure the marketing activities continue
smoothly and reach their KPIs without any problem. After that, he/she monitor
the sales status to evaluate the marketing performances and check if anything
went wrong and assure the sales meet their target. If there is any issue with the
sales performances that causes better-than-expected or worse-than-expected
sales, he/she looks into the cause of the issue and setup short-term plan or on-
top promotion to promote sales supporting the issue. Next, they follow up and
allocate all the jobs dedicated to the team members and different departments
according to the on-going tasks. At the end of the day, he/she list up all the in-
completed tasks and tasks needed to be done in the next day.
17
The data analysis processes take places alongside with the execution and
strategy adjustment. They generally start this process from checking their overall
sales/promotion performances from the marketing dashboard/performance
report, which are created specifically for the certain KPIs and targets binding to
the plan. If the overall performances are as expected to the achievement of their
target, they generally stop the data analysis activities. However, if the results are
not going according to their expectations, they dig deeper into the problems by
looking into the sales/promotions performances contribution by channel and by
product/service. After that, they look into the causes of the problems with the
available data on-hand to find the way to solve the problem. If the data and
information on-hand is not enough, they request additional data from the data
owners in different departments or the business intelligence department for
finding the way to optimize their strategies. The marketing managers’ data
analysis behavior can be illustrated as the following diagram.
Figure 6: Marketing Managers' General Procedures in Data Analysis (Developed from the interview)
When all the required information is gathered, they use those data to
optimize their plan, or create another backup/support plan to get the
sales/promotion performances to be on track.
However, the marketing managers suggested that they usually spend a
lot of time on finding out the cause of the problem. In addition, they also have
18
to wait for the data from the other departments in case that the data they already
have is not enough for the analysis. Therefore, the dashboard that could notify
them when the results are not as expected, and point direct to the cause of the
problems would make their execution much more effective.
3. After the execution: Summarize and Report Marketing Results to Management
– The Report Generating Stage
Finally, when the plan has completely executed, they summarize and
report marketing results to management. Basically, they compare the overall
actual sales/promotions performances from the marketing plan’s execution to
the target and find out the KPIs achievements rate. After that, they find out about
the causes of the results in terms of reasons in successes or reasons for failures
such as top products sold, top sales/promotions channels, best performance
activities, etc. Lastly, they find out about the potential for the improvement and
other business opportunities for the future strategies. When all the data and
information are gathered, they present the information into a presentation and
report management for the performances.
The respondents suggested that the process of reporting is the time-
consuming process, since they need a lot of support information for management
presentation. In addition, they have to illustrate the marketing performances into
graphical form, which generally takes a long time for the preparation. Therefore,
if the scheduled report or the marketing dashboard could support them in this
process, they will utilize their working time much more effectively.
19
4.1.3. Obstacles for Marketing Managers’ in Their Data Analysis Activities
From the interview, 11 out of 15 respondents stated that, due to the limitation by their
information technology departments and difficulties in the synchronization with their current
legacy data systems, they are not using a proper “Marketing Dashboard” in their work. They
suggested that mostly, the data from different departments are stored in different data platforms
for example, customers’ data are usually stored in the Customer Relationship Management
(CRM) database, sales transaction are usually stored in the finance/accounting or Retail
Management System (RMS) database, product data are usually stored in the Product Data
Management (PDM) system database and inventory and stock data are usually stored in the
Warehouse Management System (WMS) database. In general, these data can be accessed by
the Business Intelligence (BI) department, which are generally analyzed and summarized into
a scheduled reports based on different requirements from various departments. This issue has
caused them difficulties in the data analysis processes due to the limited capability in accessing
the necessary information, and hence, they have to request the report owner for the additional
data report. These reports are generally created into spreadsheet or data table format, which 4
of them stated that, by only looking into just the data table, they had difficulties in interpreting
data and finding opportunities in creating marketing campaigns. Instead, the other 7
respondents stated that they prefer the data to be presented in spreadsheet (mentioned in the
interview as Microsoft Excel Spreadsheet) form because they can mine and choose different
dimensions to analyze the data and present them in forms of graphical information by
themselves. In addition, it takes a long time just to wait for the other departments in completing
a report, which many times are too slow in responding to the market situations.
Apart from the previously mentioned 11 respondents, the remaining 4 respondents
stated that they are using marketing dashboard in their works. The functions that they like about
20
the dashboards are the graphical information presentation that makes them understand their
current performances and also information coverage that meets their needs in achieving the
KPIs. However, in case of needing the deeper or additional data, they will have to request the
data from different responsible departments or different legacy systems, which usually takes
long time in gathering all the data they need.
Figure 7: General Data Flow Between Business Functions (Developed from the interview)
They also stated that to make the better use of the marketing dashboard, it should
provide them with the actionable insight, notify them when there is an unexpected situation and
should be able to present the data just within the time they need. Otherwise, 2 respondents out
of the 4 suggested that the existing dashboard technical performance is low that it causes long
data processing time and occasionally create errors and hangs when generating report.
In summary of the interview result from the 15 respondents, the design and application
of marketing dashboards in an organization should support the marketing managers in solving
the following problems:
1. Lack of authority in data access: Most manager suggested that they need to request
the necessary data for their analysis from different departments or business
21
intelligence department. In some cases, the data that they require are kept with high
confidentiality such as customer information, sales performance or financial
performance and need to request for authorities from management to access the data.
This problem causes them long time and complex process in requesting data for the
analysis especially from different departments. Setting authority for different kind of
data will allow them to access the necessary or frequently used data and analyze data
more efficient. To be perfect, the dashboard should be able to display the external data
related to the current situation and the overall market situation properly.
2. Lack of flexibility in data template adjustment and exporting data for further
analysis: This problem causes limitation in finding insights and sales opportunities.
Most marketing managers are willing to have flexibility in adjusting data criteria
and exporting the data for further analysis. For additional preference, marketing
managers are expecting the dashboard to assist them in constructing performance
report for updating management, which usually is the time-consuming process.
3. Delay of the data delivery: One of the biggest problems to the big retailers are that
the data system has been long implemented, which are usually developed based on
the legacy systems implemented by ERP giants. These systems are extremely
complex with less flexibility in the additional implementation from other data
platform. More importantly, they are implemented based solely on the local servers
in different store outlets around the country and rely on weak network
infrastructures from decades ago. This has caused the transmission of the retail data,
which are generated every single second causing data package to become enormous.
With the low connection performances, these data usually take time in the
transmission and frequently cause delays in storing into the major databank. This
22
problem causes some marketing activation to be insufficient since some of the data-
driven activities need up-to-date data for finding insight or to indicate the
concerning issues that are needed to be fixed at a time.
4. Unable to interpret data and identify issues and problems correctly: This
problem might lead to misunderstandings about the marketing situation and may
cause the KPIs to be out of reach. Most marketing managers need the perfect
dashboard to be able to display the data representing the current situation and point
to the cause in case of not-normal performances. In short, the dashboard should be
able to suggest the “actionable insight” for the users.
5. Errors or software performance unable to response with loads of data
generated: There would be no meaning in using and implementing if the dashboard
cannot be used within the certain period of time that the user need. The software
should be able to handle the access of information from many people in various
departments at the same time and can flexible in retrieving information from
different legacy systems as well as other external sources.
To sum up from the interview, the author suggested that the key design factors that is
needed to be considered for marketing dashboard designing should cover: Data Synchronization,
User Interface Flexibility, Data Delivery, Actionable insights and Platform Technical
Performances in order to create the best support for marketing managers in data analysis.
4.2. Observations from Existing Solutions
The research in this study also includes observation of the existing case studies from
dashboard solutions available in the market to verify the match between their product design
and the marketing managers’ expectation. Samples used in this research includes 3 of the
23
leading Business Intelligence solution providers namely Klipfolio, Qlickview, and Tableau.
The observations will be based on the sample of the marketing dashboard design provided on
the net and also the product specifications and functions provided on the websites. Analysis of
the case study will be based on the key design factors from the interview results.
4.2.1. Klipfolio (Klipfolio, n.d.)
Klipfolio is an online dashboard and business intelligence platform operated under
Klipfolio Inc., a Canadian Software company in 2001. It provides the real-time solution that
supports companies in data analysis and monitor performances in business sectors.
Data Synchronization: Klipfolio provide the solution that allow user to interface data
from various kind of sources to be presented on the dashboard including the static data from a
file, dynamic data from different leading databases platforms. In addition, the users can also
connect data from other external sources such as cloud applications, share drives, and also feed
information from different data sources with the availability of their Application Programming
Interfaces (APIs) such as facebook, twitter, news portal, google analytics, salesforce, etc.
without any problem in the file format differences. For privacy issue, it also allows the users to
setup different level of authorities for each specific groups of users visualized specifically for
each different departments.
User Interface Flexibility: The users can choose to upload, connect to different sources
of data and choose the way of connecting and visualizing the data by themselves. Besides,
Klipfolio also provides data visualization tools that allow the users to edit the formula and logic
of the tool such as “transforming, combining, slicing up, filtering, etc. with any data set through
easy-to-use command functions before it goes live in a dashboard” (Klipfolio, n.d.). Moreover,
24
it allows the users to drill down additional data from the report and export them into preferable
report formats for further data analysis or assisting in performance reporting.
Data Delivery: The data that is connected to Klipfolio dashboard are automatically
refreshed, which the users can setup the frequency of refreshing time by themselves. Besides,
it can be accessed by different devices such as desktop, tablet, TV and mobile phone.
Actionable insights: Klipfolio allow the users to manipulate the data, setup conditional
thresholds or format (such as the case of the matrices exceed / below the threshold, the exact
pattern of matrices occur, etc.) and choose the way to present the data to provide additional
insights or notify the user with different visualization tools with ability to customize their
formats freely. Moreover, the users can add comments to any visualization and use it to
communicate with the other team members for further activations.
Platform technical performances: Klipfolio is the platform that is developed on the
cloud which means that it can handle the access of information from many users at the same
time. Of one organization, it claimed to be able to handle the access of more than 10,000 access
in the same time with scalable pricing based on the amount of data accessed.
Figure 8: Sample of Klipfolio Dashboard (Klipfolio, n.d.)
25
4.2.2. Qlickview (Qlick.com, n.d.)
QlikView is a business intelligence & visualization software provided by Qlick, a
Swedish software company founded in 1993. The company is also the owner of Qlick Sense,
Qlick Data Market, Qlick Analytics, and other products that relate to big data analysis and
business insights.
Data Synchronization: QlikView allow its users to consolidate data from multiple
sources and combine them into one dashboard. It also provides the search function for words
or phrases, which the users can find a specific piece of information directly. In relationship to
the selected information, the system will automatically indicate the connections between the
selected data to the search result.
User Interface Flexibility: QlickView’s user interface is designed to be user-friendly
and considered its users to require no coding knowledge. Therefore, the marketing managers
can customize the dashboards by themselves. It also provides various ready-to-use analysis
tools such as different types of charts and graphs, and allow the users to create relationship
between different data set freely. In addition, the expert users who have programming
knowledge could also customize their specific types of charts, graphs or even unique business
applications by themselves. These tools can also be shared or sold to the other QlickView users
through QlickMarket.
Data Delivery: QlikView dashboards can be accessed from different devices especially
desktops and mobile devices. It allows the users to setup the report schedules and templates freely.
Actionable insights: With the features that allow its users to see the associations in
different datasets, QlikView could help its users to state the issues and find the causes of the
issues easily through the prepared visualization in the dashboard.
26
Platform Technical Performances: QlikView provide the powerful automated
functions in maintaining the associations in the data and calculation for the results on-the-go.
The success is from its unique techniques in data compressing algorithms, which allow them to
pre-load the data to be ready for data processing in the platform prior to the analysis. This
concept can shorten the data generating and processing time in supporting to its flexibility into
the further analysis.
Figure 9: Sample of Qlickview Dasoboard (Qlick.com, n.d.)
Figure 10: Sample of Qlickview Dashboard (singaporebusinessintelligence, n.d.)
27
4.2.3. Tableau (Tableau, n.d.)
Tableau is a data visualization product focuses on business intelligence from Tableau
Software, an American computer software company founded in 2003. It allows the users to
create and share data insights from different sources of data across the organization flexibly.
Data Synchronization: Tableau is design to be ready for integrating enormous data
from big data platforms, cloud services down to an excel spreadsheet. Through the credentials
to different sources of data, which can be customized easily, integration of external data and
sources of information such as social media or online portals are also possible.
User Interface Flexibility: Tableau does not require the users to write code to create
the connections between those data, therefore, the marketing managers could handle all the
operations by themselves. The user can also blend and twist the dimension of the data presented
on the dashboard freely without needing any programming knowledge. This includes
connecting/joining/cutting tables, creating/editing metadata, and digging/mixing/filtering data
deeper with just drag and drop functions.
Data Delivery: Data integrated into Tableau will be updated automatically with the live
connection to the data sources. Otherwise, the users can also set automatic update schedules or
reports and share the dashboard with the other users freely. It can also be accessed from mobile
devices or go live on the web with rapid speed.
Actionable insights: Tableau’s allow the users to manage the dashboard and setup the
way the data is presented, which means they can choose to create the graphical interfaces that
can notify and identify different situations freely.
Platform Technical Performances: Its technical methodology in processing and
presenting the dashboard is from the pre-load data into the platform, which allows the data
28
mining and further analysis to be ready within a short period of time. Besides, its platform is
developed on the cloud, meaning the cost of use will be depending on the actual amount of data
processed and accessed, which generally much safer than the legacy systems.
Figure 11: Sample of Tableau Dashboard (Covalentmarketing.com, 2012)
4.2.4. Summary of Key Features from the Case Studies
From the observations, the 3 leading dashboard platforms provided the functions and
features that are matched with the major requirements summarized in the key findings from the
interview with marketing mangers’. The author would like to summarize that in order to
implement a marketing dashboard, the designer should take these features into considerations:
1. Easy-to-use and simple Graphical User Interface (GUI)
2. APIs to connect to different data sources such as big data platform, cloud
applications, share drives, social media, news portal, analytics tools and static
spreadsheet files
29
3. Customizable dashboard including graphs and charts depending on business
objectives
4. Notification to identify the specific situations based on the specified pattern and
interface for pointing to the related data to the cause
5. Flexibility for the interface in combining, mixing, deducting and filtering the data
6. Schedule update to ensure the up-to-date data
7. Reporting system that can be used to share and communicate with other users
These software features should be put into the marketing dashboard, which the design
factors and design criteria that associate with each individual features will be the constraints to
the detailed designs. The relationships between the design criteria, design factors and design
features will be discussed in the next summary session.
30
CHAPTER 5
SUMMARY AND RECOMMENDATIONS
As the conclusion for answering the first objective, “To understand the data usage
behavior of retailers in business analysis”, we can conclude that the marketing managers’
behaviors in the marketing data analysis can be separated into 3 stages which are “before the
execution” or “planning stage” to find opportunities and objectives in the marketing plan.
Another stage is the “during the execution” or “execution stage” to monitor and make sure
the performance goes according to the plan, find the cause that are the problems to the
unexpected situations and find the adjustments to the plan. Finally, the “after the execution”
or “reporting stage” to analyze, report the performance and summary the key
successes/failures to the managements. In this study, most retailers in Thailand are not using a
marketing dashboard, which from the interview, only 4 out of 15 respondents stated that they
are using a marketing dashboard. The remaining managers are using scheduled reports
generated by the business intelligence department from their organization and they have to
additional ah-hoc reports from different departments.
However, all of the respondents suggested that there are difficulties for analyzing data
from their perspectives with the current system, which are the lack of authority in data access
that cause delay and complex processes in obtaining data. Another problem is the lack of
flexibility in data template adjustment and exporting data for further analysis which cause them
limitation in perceiving the data in the angle and matrices that they want. In addition, the delay
of the data delivery which is caused from limitations of the existing legacy systems cause the
analysis to be delayed and many times causes obstacles in executing or adjusting their
marketing plan. Moreover, they are unable to interpret data and identify issues and problems
31
correctly due to the large amount of data are involved in the retail marketing data analysis and
there is no indication of the problems and issues at a moment. Lastly, errors or software
performance unable to response with loads of data generated causes them problems in the data
mining and analysis process in many critical moments.
All the respondents are aware of the importance of a marketing dashboard that it will
help them in understanding the marketing situation, support them in the planning process, track
and monitor the sales/promotions performances, and also summary and report the plans or
campaigns results to management easier. They also suggested that a good marketing dashboard
are also needed to act as the management dashboard that can inform the marketing statuses to
the management, which can simplify the report making tasks which are their long/complex-
processing duties.
Another conclusion to the objective “To identify process in designing a dashboard to
create the good characteristics of data presentation for marketing data analysis” is that, the
principle in designing marketing dashboard is depending on the key design factors, which is the
core considerations in the collecting requirements for the design processes of a marketing
dashboard. Whilst, the considerations will be created based on different criteria that related to
each design factors in each stages. These key design criteria will be used as the direction and
frame for scoping the capability of the dashboard outputs, which are the key design features.
These features are the necessary components in terms of supporting user efficiency in the
dashboard applications. The relationship between the 3 major matrices can be illustrated and
explained as below:
32
Figure 12: Principle in Designing Marketing Dashboard (Developed from analysis and findings)
First, designing of a marketing dashboard should be started from considering the
marketing objectives which is the key factor that setup the direction of the remaining design
processes. The designer should start by thinking about the types of data that are involved in the
business analysis such as customers’ data, sales data, product data and/or other external data.
The criteria for determining the types of datasets that will be presented onto the dashboard will
be the users’ task, responsibilities and expectations from the dashboard about how the
dashboard will help them in their works. Another criterion is the availability or readiness of
the data and their sources to be included into the dashboard. The outcome from the design
factor in this process will be the design requirements for the dashboard API lists that associates
in synchronizing the data from different sources altogether.
The second step to be considered are the marketing managers’ KPIs such as sales value,
transaction, ticket size, frequency, product holding, etc. and the targets of the KPIs, which are
the framesets that indicate the key message that the dashboard should tell the user. These factors
will be set by the historical data, market situations and company’s direction for scoping the
33
matrices to be measured in the dashboard. Outcome of the design factor will be the function
that setup the points of achievement and thresholds in the measurements in the dashboard.
The third step in the consideration will be based on limitations in the design processes
such as technologies, implementation cost, company’s policies, management authorities and
marketing managers’ knowledge and skills in terms of technological and analytics. These
factors are scoped down by authorities in accessing each dataset for the marketing managers,
flexibility / performances of the legacy systems in allowing the dashboard to access and collect
the data and also management supports in terms of budget, training allowances, internal
collaborations and authorities in making decisions. The key features of the dashboard that is the
outcome of this process are the characteristics of the GUI in the dashboard that is easy-to-use
enough for allowing the users to setup and apply things by themselves. Besides, for reducing
the implementation cost of the dashboard, it should be implemented as a cloud-based
application, which reduces the limitation of the performances and cost of the system. Also, the
data to be presented in the dashboard should be pre-loaded and pre-authorized to reduce the
difficulties in accessing the data that associate with the marketing operations.
The fourth stage will be the consideration of the key issue patterns of the different
performance statuses that the users need to pay attention to such as the indication of high or
low performances, abnormality in the data matrices, or even the indication stating that the
overall performances go well without any problem. This factor will allow the user to be notified
and understand the marketing situation clearer. Therefore, they can find more information and
take actions in fixing or boosting the sales performance effectively. The criteria in designing
are the level of data synchronization which allow the related data to be synced and display onto
the dashboard and also the requirement that the data should be presented on the dashboard on
time that the activations are needed to be notified.
34
Last but not lease, at the fifth stage, the designer should consider the way for evaluating
marketing performances such as the characteristics of charts or graphs used to illustrate the
sales performances. The consideration sets are based on the dimension of the matrices bounded
to the KPIs such as budget, channel, time, location, product, etc. These matrices will be the key
setup points about how the data are visualized on the dashboard. In addition, it also indicates
the message, frequency and formats for the insights that the users would like to retrieve. The
key design criteria for this process are the flexibility and accessibility of the dashboard that
allow the users to retrieve more data related to the different scenarios.
At last, all the concept of the dashboard design should be revised over time due to the
changes of technologies, business objectives, organization structures, and also the market
trends. Following these principles and frameworks, the people who are responsible in designing
or using the dashboard will be able to create the marketing dashboard for supporting data
analysis and marketing activations more effectively.
35
REFERENCES
Amazon.com. (n.d.). Sales Dashboard. Retrieved December 15, 2015, from Kindle Direct
Publishing: https://kdp.amazon.com/help?topicId=A1Q7HTA3U1A5Y5
Ayyar, R. (2015, May 26). 4 Essential Characteristics of a Great Marketing Dashboard.
Retrieved from Semrush.com: https://www.semrush.com/blog/4-characteristics-great-
marketing-dashboard/
Boonnoon, J. (2015, November 19). E-commerce market on path of growth. Retrieved from
nationmultimedia.com: http://www.nationmultimedia.com/business/E-commerce-
market-on-path-of-growth-30273257.html
Christopher, M. (2005). Logistics and Supply Chain Management: Creating Value-Adding
Networks (3rd ed.). Edinburgh: Pearson Education.
Court, D., Elzinga, D., Mulder, S., & J, O. (2009, June). The consumer decision journey.
Retrieved December 16, 2015, from McKinsey&Company:
http://www.mckinsey.com/insights/marketing_sales/the_consumer_decision_journey#
Covalentmarketing.com. (2012, December 12). Marketing Dashboards The Tableau Way.
Retrieved from Covalentmarketing.com:
http://covalentmarketing.com/blog/2012/12/26/marketing-dashboards-the-tableau-
way/
Deming, E. W. (1993). PDSA cycle. In The New Economics for Industry, Government, and
Education (p. 132). Boston: MIT Press.
EuromonitorInternational. (2016, January). Retailing in Thailand. Retrieved from
Euromonitor International: http://www.euromonitor.com/retailing-in-thailand/report
36
Few, S. (2013). Information Dashboard Design: Displaying Data for At-a-Glance
Monitoring. Analytics Press.
Focus-economics.com. (2016, March 22). Thailand Economic Outlook. Retrieved April 4,
2016, from Focus-Economics: http://www.focus-economics.com/countries/thailand
geckoboard.com. (n.d.). Making the most of a marketing data dashboard. Retrieved APRIL 4,
2016, from geckoboard.com: https://www.geckoboard.com/learn/marketing-data-
dashboard/#.VwI106R942w
Hemann, C., & Burbary, K. (2013). Digital Marketing Analytics - Making Sense of Consumer
Data in a Digital World. Indiana: Que Publishing.
Ivergard, T., & Hunt, B. (2009). Handbook of Control Room Design and Ergonomics: A
Perspective of the Future (2nd ed.). Boca Raton: CRC Press.
James, L. (2010, October 24). Data Analysis for the Retail Industry. Retrieved Dec 17, 2015,
from Yellow Fin: https://www.yellowfinbi.com/YFCommunityNews-Data-Analysis-
for-the-Retail-Industry-Part-1-100068
Klipfolio. (n.d.). Dashboard Examples. Retrieved December 16, 2015, from Klipfolio:
http://www.klipfolio.com/resources/dashboard-examples
Klipfolio. (n.d.). KPI Examples and Templates. Retrieved December 16, 2015, from
Klipfolio: http://www.klipfolio.com/resources/kpi-examples
Klipfolio.com. (2016, April 6). Salesforce Dashboard. Retrieved from Klipfolio.com:
https://www.klipfolio.com/resources/dashboard-examples/sales/salesforce
LaValle, S., Lesser, E., Shockley, R., Hopkins, M. S., & Kruschwitz, N. (2011). Big Data,
Analytics and the Path from Insights to Value. MITSloan Management Review, 52.
37
Lewis, R., & Dart, M. (2014). The New Rules of Retail: Competing in the World's Toughest
Marketplace (2nd ed.). New York: Palgrave Macmillan.
Lind, D. A., Marchal, W. G., & Wathen, S. A. (2013). Basic Statistics for Business and
Economics. New York: McGraw-Hill Education.
Merchant, P., & Demand, M. (n.d.). What Are the Functions of a Marketing Manager or
Officer? Retrieved from Chron.com: http://smallbusiness.chron.com/functions-
marketing-manager-officer-15574.html
Nomi. (n.d.). Top 10 Answers Retailers Want from In-Store Analytics. Retrieved December
12, 2015, from http://www.nomi.com/: http://www.nomi.com/uncategorized/2014/top-
10-answers-retailers-want-store-analytics/
Office.com. (n.d.). Power BI - Overview and Learning. Retrieved April 5, 2016, from
Office.com: https://support.office.com/en-us/article/Power-BI-Overview-and-
Learning-02730e00-5c8c-4fe4-9d77-46b955b71467
Qlick.com. (n.d.). Introducing the Qlickview Business Discovery Platform. Retrieved April 5,
2016, from Qlick.com: http://global.qlik.com/uk/explore/products/qlikview
Schmarzo, B. (2013). Big Data: Understanding How Data Powers Big Business. Indiana:
John Wiley & Sons.
singaporebusinessintelligence. (n.d.). QlikView for Salesforce.com. Retrieved April 5, 2016,
from singaporebusinessintelligence:
http://singaporebusinessintelligence.blogspot.com/2015/08/qlikview-for-
salesforcecom.html
38
Statista.com. (2016). Forecast for Thailand's retail sales from 2008 to 2016 (in billion U.S.
dollars). Retrieved from Statista.com:
http://www.statista.com/statistics/232746/forecast-for-retail-sales-of-thailand/
Sweetspotintelligence.com. (2013, October 2). The five features all great marketing
dashboards do have in common. Retrieved from Sweetspotintelligence.com:
http://www.sweetspotintelligence.com/en/2013/10/02/the-five-features-all-great-
marketing-dashboards-do-have-in-common/
Tableau. (n.d.). 6 Tips for Better Sales Performance Dashboards. Retrieved December 14,
2015, from tableau:
http://www.tableau.com/sites/default/files/media/whitepaper_6tipsforbettersalesperfor
mancedashboards_eng.pdf?ref=lp&signin=ea1da4f8c50033ba296a142d14b00cc7&1[
os]=windows
Tableau. (n.d.). Tableau. Retrieved April 6, 2016, from Tableau:
https://www.tableau.com/products
Thornton, K. (2013, August 1). 6 Dashboards Every Sales Leader Needs. Retrieved
December 6, 2015, from salesforce.com:
https://www.salesforce.com/blog/2013/08/dashboards-sales-leaders.html
Treacy, M. (n.d.). Excel Dashboard Course. Retrieved April 4, 2016, from
Myonlinetraininghub.com: http://www.myonlinetraininghub.com/excel-dashboard-
course
Webseoanalytics.com. (2015, October 21). 6 reasons why you need a marketing dashboard.
Retrieved December 15, 2015, from Webseoanalytics.com:
39
http://www.webseoanalytics.com/blog/6-reasons-why-you-need-a-marketing-
dashboard-for-your-business/
Webseoanalytics.com. (n.d.). Webseoanalytics.com. Retrieved April 4, 2016, from 6 Reasons
Why You Need A Marketing Dashboard For Your Business:
http://www.webseoanalytics.com/blog/6-reasons-why-you-need-a-marketing-
dashboard-for-your-business/
41
APPENDIX – INTERVIEW QUESTIONS
1. What is your position? (demographic)
2. Can you describe your routine work? (overall)
3. How can you categorize the data that your company collect? (company, customer,
competitor, collaborators, context)
4. How do you use data in your work? (situations)
5. How do you manage and analyze data in your company? (process)
6. What tool are you using for analyzing your data? (technology)
7. What are the major problems in your data analysis? (barrier)
8. What factors would make you analyze the data more effectively? (support)
9. What information is usually asked by management? (objectives)
10. What data and information do you usually show in performance report? (design)
11. What data and information is shown in your data management dashboard? (design)
12. What does your current data dashboard tell you? (design)
13. What function in your dashboard that you use the most frequent? (design)
14. What do you like the most about your dashboard? (design)
15. What do you dislike the most about your dashboard? (design)
16. What do you expect to see in your data dashboard? (design)
17. What information do you usually check after checking the dashboard? (design)
18. Do you usually use external data for your data analysis? (design)
19. What is the most success situation caused by analyzing data effectively? (Case studies)
20. What is the most failure situation caused by analyzing data wrongly? (Case studies)
42
BIOGRAPHY
Name Mr. Jatuphol Chawapatnakul
Date of Birth August 6, 1985
Educational Attainment
2014-2016: Master of Science in Marketing,
Thammasat University
2008-1010: Master of Science in Product and
Process Development, Malardalen University
2003-2007: Bachelor of Engineering in
Information Engineering, King Mongkut’s
Institute of Technology Ladkrabang
Work Experiences 2014-2015: E-commerce Business Development
Manager, Central Food Retail Co., Ltd.
2012-2014: Assistant Product Manager - Retail
Business Development, Kasikornbank PLC.
2011-2012: Marketing Executive & Product
Development, Open Rice Thailand Co., Ltd.
2010-2011: Solution Integrator, Wisdom Vast
Co., Ltd.