Royal Dutch Shell October 13, 2017 Royal Dutch Shell plc October 13, 2017 Re-shaping Shell, to create a world-class investment case Chemicals Investor Briefing John Abbott – Downstream Director Graham van’t Hoff – EVP Chemicals #makethefuture
Transcript
Royal Dutch Shell October 13, 2017
Royal Dutch Shell plcOctober 13, 2017
Re-shaping Shell, to create a world-class investment caseChemicals Investor BriefingJohn Abbott – Downstream DirectorGraham van’t Hoff – EVP Chemicals
#makethefuture
Royal Dutch Shell October 13, 2017
John AbbottDownstream DirectorRoyal Dutch Shell plc
Royal Dutch Shell October 13, 2017 3
Definitions & cautionary note
Reserves: Our use of the term “reserves” in this presentation means SEC proved oil and gas reserves.
Resources: Our use of the term “resources” in this presentation includes quantities of oil and gas not yet classified as SEC proved oil and gas reserves. Resources are consistent with the Society of Petroleum Engineers (SPE) 2P + 2C definitions.
Discovered and prospective resources: Our use of the term “discovered and prospective resources” are consistent with SPE 2P + 2C + 2U definitions.
Organic: Our use of the term Organic includes SEC proved oil and gas reserves excluding changes resulting from acquisitions, divestments and year-average pricing impact.
Shales: Our use of the term ‘shales’ refers to tight, shale and coal bed methane oil and gas acreage.
Underlying operating cost is defined as operating cost less identified items. A reconciliation can be found in the quarterly results announcement.
The companies in which Royal Dutch Shell plc directly and indirectly owns investments are separate legal entities. In this release “Shell”, “Shell group” and “Royal Dutch Shell” are sometimes used for convenience where references are made to Royal Dutch Shell plc and its subsidiaries in general. Likewise, the words “we”, “us” and “our” are also used to refer to subsidiaries in general or to those who work for them. These expressions are also used where no useful purpose is served by identifying the particular company or companies. ‘‘Subsidiaries’’, “Shell subsidiaries” and “Shell companies” as used in this release refer to companies over which Royal Dutch Shell plc either directly or indirectly has control. Entities and unincorporated arrangements over which Shell has joint control are generally referred to as “joint ventures” and “joint operations” respectively. Entities over which Shell has significant influence but neither control nor joint control are referred to as “associates”. The term “Shell interest” is used for convenience to indicate the direct and/or indirect ownership interest held by Shell in a venture, partnership or company, after exclusion of all third-party interest.
This release contains forward-looking statements concerning the financial condition, results of operations and businesses of Royal Dutch Shell. All statements other than statements of historical fact are, or may be deemed to be, forward-looking statements. Forward-looking statements are statements of future expectations that are based on management’s current expectations and assumptions and involve known and unknown risks and uncertainties that could cause actual results, performance or events to differ materially from those expressed or implied in these statements. Forward-looking statements include, among other things, statements concerning the potential exposure of Royal Dutch Shell to market risks and statements expressing management’s expectations, beliefs, estimates, forecasts, projections and assumptions. These forward-looking statements are identified by their use of terms and phrases such as ‘‘anticipate’’, ‘‘believe’’, ‘‘could’’, ‘‘estimate’’, ‘‘expect’’, ‘‘goals’’, ‘‘intend’’, ‘‘may’’, ‘‘objectives’’, ‘‘outlook’’, ‘‘plan’’, ‘‘probably’’, ‘‘project’’, ‘‘risks’’, “schedule”, ‘‘seek’’, ‘‘should’’, ‘‘target’’, ‘‘will’’ and similar terms and phrases. There are a number of factors that could affect the future operations of Royal Dutch Shell and could cause those results to differ materially from those expressed in the forward-looking statements included in this release, including (without limitation): (a) price fluctuations in crude oil and natural gas; (b) changes in demand for Shell’s products; (c) currency fluctuations; (d) drilling and production results; (e) reserves estimates; (f) loss of market share and industry competition; (g) environmental and physical risks; (h) risks associated with the identification of suitable potential acquisition properties and targets, and successful negotiation and completion of such transactions; (i) the risk of doing business in developing countries and countries subject to international sanctions; (j) legislative, fiscal and regulatory developments including regulatory measures addressing climate change; (k) economic and financial market conditions in various countries and regions; (l) political risks, including the risks of expropriation and renegotiation of the terms of contracts with governmental entities, delays or advancements in the approval of projects and delays in the reimbursement for shared costs; and (m) changes in trading conditions. No assurance is provided that future dividend payments will match or exceed previous dividend payments. All forward-looking statements contained in this release are expressly qualified in their entirety by the cautionary statements contained or referred to in this section. Readers should not place undue reliance on forward-looking statements. Additional risk factors that may affect future results are contained in Royal Dutch Shell’s 20-F for the year ended December 31, 2016 (available at www.shell.com/investor and www.sec.gov ). These risk factors also expressly qualify all forward looking statements contained in this release and should be considered by the reader. Each forward-looking statement speaks only as of the date of this presentation, October 13, 2017. Neither Royal Dutch Shell plc nor any of its subsidiaries undertake any obligation to publicly update or revise any forward-looking statement as a result of new information, future events or other information. In light of these risks, results could differ materially from those stated, implied or inferred from the forward-looking statements contained in this release.
With respect to operating costs synergies indicated, such savings and efficiencies in procurement spend include economies of scale, specification standardisation and operating efficiencies across operating, capital and raw material cost areas.
We may have used certain terms, such as resources, in this release that United States Securities and Exchange Commission (SEC) strictly prohibits us from including in our filings with the SEC. U.S. Investors are urged to consider closely the disclosure in our Form 20-F, File No 1-32575, available on the SEC website www.sec.gov.
Royal Dutch Shell October 13, 2017 4
Energy challenge
Source: UN Population Fund; UN World population Prospects (2015 revision); World Urbanisation Prospects (2014 revision); IEA, Energy Technology Perspectives 2015; Shell New Lens Scenarios
Growing populationGlobal population will increase from around 7.4 billion today to nearly 10 billion by 2050, with 67% living in cities
Rising demandGlobal energy demand will likely be almost 60% higher in 2060than today, with 2 billion vehicles on the road (800 million today)
Ongoing supplyRenewable energy could triple by 2050, but we will still need large amounts of oil and gas to provide the full range of energy products we need
Mitigating climate changeNet-zero emissions is a potentially achievable societal ambition
Growing global demand for energy as population and living standards increase
Royal Dutch Shell October 13, 2017
Strategy
“Let’s make the future” STRATEGIC
Focus portfolio on resilient positions
Invest in advantaged projects
Value chain integration
OPERATIONAL
Reset cost and capital spending
First class execution projects
and operations
Unrelenting focus on HSSE and
licence to operate
Leader: value + influence
Reducing our carbon
intensity
Shared value with
society
World-class investment case
FCF/share + ROCE growth
Conservative financial
management
5
Royal Dutch Shell October 13, 2017
Strong free cash flow and returns
Driving strategy in multiple time horizons
CONVENTIONALOIL + GAS
CHEMICALS
OIL PRODUCTS
DEEP WATERINTEGRATED GAS
SHALES NEW ENERGIES
Cash engines:today
Growth priorities: 2016+
Future opportunities: 2020+
Competitive + resilient
Funds dividends + balance sheet
FCF + ROACE pathway
Affordable growth in advantaged positions
Material value + upside
Managed exposure
Path to profitability
Cash engines 2020+
Relentless portfolio high-grading
6
Royal Dutch Shell October 13, 2017 7
Downstream Cash engine
Further strengthen our financial performance
Upgrading our portfolio
Returns + free cash flow improvement
Chemicals growth priority
Marketing Refining & Trading Chemicals
Growth priority
Differentiated products
Brand leverage + customer offer
Selective growth
Full integration with trading
Improve retained assets
Reducing refining capacity
Advantaged feedstock from
Upstream and refining
Strong product portfolio with
proprietary technology
Focused growth into
differentiated leading positions
Royal Dutch Shell October 13, 2017
Graham van‘t HoffExecutive Vice President - Chemicals
Royal Dutch Shell October 13, 2017 9
Agenda Chemicals demand
Position of Shell Chemicals within the industry
Shell Chemicals strategy
Execution
Financial performance
Growth projects
Q&A
01
02
03
04
05
06
07
Royal Dutch Shell October 13, 2017 10
Solar impulse:90% of the aircraft’s structure made from chemical technology
Royal Dutch Shell October 13, 2017 11
Chemicals
Growth priority
*Cracker base chemicals (Aromatic derivatives, Ethylene, Propylene and Isobutylene). Source: IHS/Shell analysis
Chemicals demand outlook
Shell produces key petrochemical building blocks
Limited impact of recycling Chemicals enabling CO2
reduction 0
100,000
200,000
300,000
400,000
500,000
2000 2005 2010 2015 2020 2025 2030
N. America S. America Europe Middle East Asia Others
Petrochemicals* demand in kT per annum
Asia 37%
Asia 52%
Royal Dutch Shell October 13, 2017 12
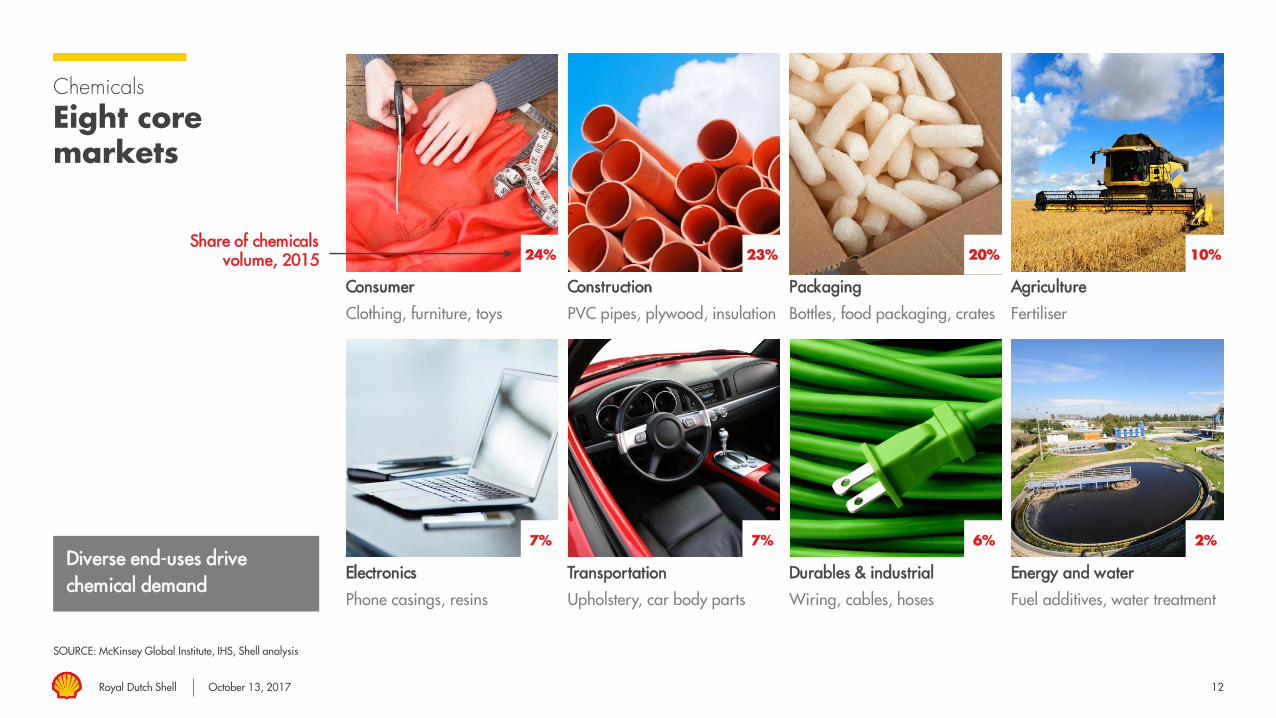
Chemicals
Eight core markets
SOURCE: McKinsey Global Institute, IHS, Shell analysis
Diverse end-uses drive chemical demand
Consumer
Clothing, furniture, toys
Construction
PVC pipes, plywood, insulation
Packaging
Bottles, food packaging, crates
Agriculture
Fertiliser
Electronics
Phone casings, resins
Transportation
Upholstery, car body parts
Durables & industrial
Wiring, cables, hoses
Energy and water
Fuel additives, water treatment
Share of chemicals volume, 2015 24% 23% 20% 10%
7% 7% 6% 2%
Royal Dutch Shell October 13, 2017
ChemicalsGrowth priority
Positioning in the competitive landscape
Access to advantaged feedstock
Process technologies
Big integrated sites
Large scale
Customised solutions
Product-materials innovation
Production close to markets
Medium scale sites
13
BASE CHEMICALS/ SOLUTIONSPERFORMANCE
Pure Chemical Companies
FEED
STO
CKS
CO
NSU
MER
S
INTERMEDIATES
Add Differentiation
Royal Dutch Shell October 13, 2017 14
Chemicals
Value chains
C2
C4
C6
C3
C1Ammonia
Methanol Acetic Acid / VAM
Urea
Ethylene
Propylene
Propylene Oxide
Acrylic Acid Super Absorbents
Butadiene
Butenes Solvents
Benzene
Phenol
Toluene
Xylene
TDI
Paraxylene
Polycarbonate
No Shell participation
Shell participation PTA
INTERMEDIATES
Agriculture
EO/MEG
Alpha olefins HODer Surfactants Consumer
Polyethylene
Polyester
Films
Containers
Packaging
Packaging
Polypropylene
Polyols Polyurethane foam Consumer
Styrene Polystyrene Moulded panels
Consumer
Construction
MDINBZ / aniline
Electronics
Elastomers Automotive
Fibres Consumer
NA
PHTH
A /
HEA
VY
LIQ
UID
S (O
IL) ET
HA
NE
LPGBI
O B
ASE
FEE
D
C8
BASE CHEMICALSFEEDSTOCKS PERFORMANCE END PRODUCTCONVERTER
MET
HA
NE
Royal Dutch Shell October 13, 2017
ChemicalsGrowth priority
Positioning in the competitive landscape
Competitors are actively acquiring or developing differentiation further down the value chains
Source: company reports, Shell analysis
15
FEED
STO
CK
PRODUCTS & MARKETS
Adv
anta
ged
Gen
eric
SolutionsBase Chem/Intermediates
Established Integrated Oil companies
Moving towards specialties
Low cost operatorsIn-market advantage
Active aggregation of technology and position
Royal Dutch Shell October 13, 2017
ChemicalsStrategy Advantaged
Feedstock First Class Footprint Strong Product & Customer Portfolio
Excellence Every Day & HSSE
Access Advantaged Feedstock Monetize With Competitive Advantage
Base chemicals cycles Feedstock portfolio has shifted to
advantaged feed and more gas
Key to robust profitability is keeping a balanced exposure to different regions, feedstocks, markets and therefore, margin sources
Indicative industry margins ($/mT)
67%
33%
53%47%
2007
2016
Liquid
Gas
1990 1996 2002 2008 2014
AdvantagedFeedstock First class footprint
Strong product & customer
portfolio
Excellence every day &
HSSE
Ethane cracker margin USGCNaphtha margin NEANaphtha margin WE
Feedstock disparity
Oil Gas Feed ParityOil Gas Feed Parity
Royal Dutch Shell October 13, 2017
Buenos Aires
Singapore
Scotford
Sarnia
Durban
19
Chemicals
Focused and balanced footprint
China in-market
Small Chemical activities at group refineriesAdvantaged gas feed siteIntegrated Chemical/refinery mega sites/clusters
US Gulf coast
FEP & Stanlow
Moerdijk, Pernis Nanhai
Rheinland
Shell-CNOOC JV –Petrochemical complex
Capacity* is regionally balanced
33
40
27
Portfolio consolidated from 133 locations in 1998 to 15 today
* Base Chemicals Capacity (C2+C3+bz); Portfolio includes Shell operated (12) and non-operated (3)
Americas
Europe
Asia
AdvantagedFeedstock
First class footprint
Strong product & customer
portfolio
Excellence every day &
HSSE
Deer ParkGeismarNorcoMobile
BukomJurong
Royal Dutch Shell October 13, 2017
Chemicals
Market-leading process technologies
Underpinned by high performance proprietary catalysis systems
Shell Chemicals proprietary technology
OMEGA (Monoethyleneglycol)
SMPO (Styrene Monomer/Propylene
Oxide/Polyols)
SHOP (Higher Olefins and Detergent Alcohols)
DPC/PC (Diphenyl carbonate)
Shell has been active in petrochemicals since 1929
Long history of product & technology development
~1,000 customers:
Annual product sales: >17 million tonnes
Long-term contracts and relationships with strong
partners
AdvantagedFeedstock
First class footprint
Strong product & customer
portfolio
Excellence every day &
HSSE
20
Royal Dutch Shell October 13, 2017 21
Chemicals
Operating and safety performance
Downtime as % of capacity
Chemicals plants – unplanned downtime
%
AdvantagedFeedstock
First class footprint
Strong product & customer
portfolio
Excellence every day &
HSSE
0
2
4
6
8
10
12
2012 2013 2014 2015 2016
Unplanned downtime without “big-hits” Unplanned downtime “big-hits” impact
Royal Dutch Shell October 13, 2017 22
Chemicals
Financial and competitive performance
Earnings and ROACE on CCS basis, excluding identified items; Shell ROACE calculations for 2012 has been restated for the impact of IAS 19; source: company reports, Shell analysis
$ billion
Earnings
%
0
5
10
15
20
25
30
13Q1 14Q1 15Q1 16Q1 17Q1
Competitive performance – ROACE 4Q rolling
Ensure robust performance under different market conditions and grow base business