Reactive nitrogen emissions from crop and livestock farming in India Viney P. Aneja a, * , William H. Schlesinger b , Jan Willem Erisman c , Sailesh N. Behera d , Mukesh Sharma d , William Battye e a North Carolina State University, Raleigh, NC 27695, USA b Cary Institute of Ecosystem Studies, Millbrook, NY 12545, USA c Energy Research Center of The Netherlands, Petten, The Netherlands d Indian Institute of Technology, Kanpur 208016, India e EC/R Inc., Chapel Hill, NC 27514, USA article info Article history: Received 5 May 2011 Received in revised form 10 November 2011 Accepted 14 November 2011 Keywords: Reactive nitrogen Agricultural emissions Fertilizer application Animal operations India abstract The rapid increase in anthropogenic nitrogen emissions to the atmosphere is matter of concern for the environment, as these may lead to photochemical air pollution, reduced visibility, eutrophication of surface waters, changes in biodiversity, acid rain, stratospheric ozone depletion, and global warming. In this study, ambient emissions of reactive nitrogen (ammonia and nitrous oxide) from animal and crop farming are analyzed for the base year 2003. This objective was achieved by the systematic development of a spatially resolved emissions inventory on a Geographic Information System (GIS) platform. Emis- sions of ammonia (NH 3 ) and nitrous oxide (N 2 O) were estimated: (i) from livestock; 1705 Gg/yr and 214 Gg yr 1 and (ii) fertilizer applications; 2697 Gg yr 1 and 326 Gg yr 1 . These estimated emissions were compared and contrasted with global, U.S., and European emissions of reactive nitrogen; emissions from India were second only to China. From the spatially resolved emission inventory, it was observed that the state of Uttar Pradesh has the highest NH 3 emission (522 Gg yr 1 ) followed by the state of Maharashtra (425 Gg yr 1 ) both from animal and crop farming. Similarly the State of Uttar Pradesh has the highest N 2 O emission (70 Gg yr 1 ) followed by the state of Maharashtra (47 Gg yr 1 ). Ó 2011 Elsevier Ltd. All rights reserved. 1. Introduction With its triple covalent bond, nitrogen gas (N 2 ) is very unreac- tive, accounting for nearly all of the nitrogen present at the surface of the Earth. Other N compounds are present only in trace concentrations; however, these trace N species play a vital role for life. Biologically-active, photochemically-reactive, and radiatively- active nitrogen compounds in the atmosphere, hydrosphere, and biosphere are collectively referred to as reactive nitrogen (Nr) (Galloway et al., 2003; EPA, 2011). The Nr includes inorganic chemically-reduced forms of nitrogen [e.g., ammonia (NH 3 ) and ammonium ion (NH þ 4 )], inorganic chemically-oxidized forms of N [e.g., nitrogen oxides (NO x ), nitric acid (HNO 3 ), nitrous oxide (N 2 O), nitrogen pentaoxide (N 2 O 5 ), nitrous acid (HONO), peroxy acetyl compounds such as peroxyacytyl nitrate (PAN), and the nitrate ion (NO 3 )] and organic compounds (e.g., urea, amines, amino acids, and proteins). Over the past few decades, human activities leading to the production of reactive nitrogen from diatomic nitrogen (N 2 ) have exceeded the natural rate of nitrogen fixation on land at the global scale (Galloway et al., 2004; Schlesinger, 2009; EPA, 2011). Although nitrogen (N) is a major nutrient that governs growth and reproduction of organisms, accumulations of reactive nitrogen from various sources have profound effects on air and water quality, leading to human disease and respiratory failure (Bell et al., 2004; Aneja et al., 2006a, 2006b, 2008a, 2009; Singh and Singh, 2008; Erisman et al., 2008; EPA, 2011). The world’s population has grown from about 1.5 billion at the beginning of the 20th century to 7.0 billion today. This population increase has been accompanied by the advent and growth of “intensive” agriculture, with associated impacts to the environment (Aneja et al., 2001 , 2008a, 2009; Erisman et al., 2008). Over the past few decades, the number of domestic animals in the world has increased faster than the human population. Between 1960 and 2000, while the human population roughly doubled, the number of domestic animals roughly tripled (Oenema, 2006). Increases in livestock populations are particularly large in developing countries such as India and China (Gerber et al., 2005; Galloway et al., 2008). * Corresponding author. Tel.: þ1 919 515 7808; fax: þ1 919 515 7802. E-mail addresses: [email protected], [email protected](V.P. Aneja). Contents lists available at SciVerse ScienceDirect Atmospheric Environment journal homepage: www.elsevier.com/locate/atmosenv 1352-2310/$ e see front matter Ó 2011 Elsevier Ltd. All rights reserved. doi:10.1016/j.atmosenv.2011.11.026 Atmospheric Environment 47 (2012) 92e103
Reactive nitrogen emissions from crop and livestock farming in India
Viney P. Aneja a,*, William H. Schlesinger b, Jan Willem Erisman c, Sailesh N. Behera d, Mukesh Sharma d,William Battye e
aNorth Carolina State University, Raleigh, NC 27695, USAbCary Institute of Ecosystem Studies, Millbrook, NY 12545, USAc Energy Research Center of The Netherlands, Petten, The Netherlandsd Indian Institute of Technology, Kanpur 208016, Indiae EC/R Inc., Chapel Hill, NC 27514, USA
a r t i c l e i n f o
Article history:Received 5 May 2011Received in revised form10 November 2011Accepted 14 November 2011
1352-2310/$ e see front matter � 2011 Elsevier Ltd.doi:10.1016/j.atmosenv.2011.11.026
a b s t r a c t
The rapid increase in anthropogenic nitrogen emissions to the atmosphere is matter of concern for theenvironment, as these may lead to photochemical air pollution, reduced visibility, eutrophication ofsurface waters, changes in biodiversity, acid rain, stratospheric ozone depletion, and global warming. Inthis study, ambient emissions of reactive nitrogen (ammonia and nitrous oxide) from animal and cropfarming are analyzed for the base year 2003. This objective was achieved by the systematic developmentof a spatially resolved emissions inventory on a Geographic Information System (GIS) platform. Emis-sions of ammonia (NH3) and nitrous oxide (N2O) were estimated: (i) from livestock; 1705 Gg/yr and214 Gg yr�1 and (ii) fertilizer applications; 2697 Gg yr�1 and 326 Gg yr�1. These estimated emissionswere compared and contrasted with global, U.S., and European emissions of reactive nitrogen; emissionsfrom India were second only to China. From the spatially resolved emission inventory, it was observedthat the state of Uttar Pradesh has the highest NH3 emission (522 Gg yr�1) followed by the state ofMaharashtra (425 Gg yr�1) both from animal and crop farming. Similarly the State of Uttar Pradesh hasthe highest N2O emission (70 Gg yr�1) followed by the state of Maharashtra (47 Gg yr�1).
� 2011 Elsevier Ltd. All rights reserved.
1. Introduction
With its triple covalent bond, nitrogen gas (N2) is very unreac-tive, accounting for nearly all of the nitrogen present at the surfaceof the Earth. Other N compounds are present only in traceconcentrations; however, these trace N species play a vital role forlife. Biologically-active, photochemically-reactive, and radiatively-active nitrogen compounds in the atmosphere, hydrosphere, andbiosphere are collectively referred to as reactive nitrogen (Nr)(Galloway et al., 2003; EPA, 2011). The Nr includes inorganicchemically-reduced forms of nitrogen [e.g., ammonia (NH3) andammonium ion (NHþ
4 )], inorganic chemically-oxidized forms of N[e.g., nitrogen oxides (NOx), nitric acid (HNO3), nitrous oxide (N2O),nitrogen pentaoxide (N2O5), nitrous acid (HONO), peroxy acetylcompounds such as peroxyacytyl nitrate (PAN), and the nitrate ion(NO�
3 )] and organic compounds (e.g., urea, amines, amino acids,
and proteins). Over the past few decades, human activities leadingto the production of reactive nitrogen from diatomic nitrogen (N2)have exceeded the natural rate of nitrogen fixation on land at theglobal scale (Galloway et al., 2004; Schlesinger, 2009; EPA, 2011).Although nitrogen (N) is a major nutrient that governs growth andreproduction of organisms, accumulations of reactive nitrogenfromvarious sources have profound effects on air andwater quality,leading to human disease and respiratory failure (Bell et al., 2004;Aneja et al., 2006a, 2006b, 2008a, 2009; Singh and Singh, 2008;Erisman et al., 2008; EPA, 2011).
The world’s population has grown from about 1.5 billion at thebeginning of the 20th century to 7.0 billion today. This populationincrease has been accompanied by the advent and growth of“intensive” agriculture, with associated impacts to the environment(Aneja et al., 2001, 2008a, 2009; Erisman et al., 2008). Over the pastfew decades, the number of domestic animals in the world hasincreased faster than the human population. Between 1960 and2000, while the human population roughly doubled, the number ofdomestic animals roughly tripled (Oenema, 2006). Increases inlivestock populations are particularly large in developing countriessuch as India and China (Gerber et al., 2005; Galloway et al., 2008).
Fig. 1. Atmospheric emissions, transport, transformation and deposition of reactive nitrogen (Source: Aneja et al., 2008a). *Indirect deposition is direct to land followed by runoff orseepage through groundwater to a surface water-body.
Greater food requirements to meet nutritional requirementsof a growing population result in agricultural emissions of NH3,and N2O, as well as losses of nitrate to water bodies due toleaching and runoff. Once released to the atmosphere by eitherman-made (anthropogenic) or natural processes, these Nrcompounds undergo transformation in various reactions e.g., ingas phase (Crutzen, 1970, 1979; NRC, 1991) and gas-to-particleconversion (Baek and Aneja, 2004; Baek et al., 2004; and Baeket al., 2006; Behera and Sharma, 2010a, 2011a, 2011b), trans-port associated with wind, and finally wet and dry deposition(Fig. 1). Reactive nitrogen lost from agricultural systems canenter groundwater, streams, lakes, estuaries, and coastal waterswhere the Nr can undergo further transformation in a widerange of biotic and abiotic processes (Schlesinger, 2009). Unusualaccumulations of reactive N can perturb the environment witha host of beneficial and detrimental effects, for exampleincreased crop yields from nitrogen fertilizer or decreasedhuman health by the respiration of nitrogen-derived aerosols(Aneja et al., 2009). Substantial evidence points to perturbationof the global nitrogen cycle, but the exact quantification of themagnitude and spatial distribution of this perturbation is pres-ently unknown.
Table 1 presents global estimates for sources and sinks of N2Oand NH3. Emissions from agricultural activities, both crop andanimal, are known to contain reactive nitrogen compounds, espe-cially NH3 and N2O. N2O is one of the important greenhouse gasesin Earth’s atmosphere (Bouwman et al., 1995); it has approximately300 times the global warming potential of carbon dioxide (Olivieret al., 1998; Shindell et al., 2009). It is now also the major speciescontributing to the depletion of stratospheric ozone (Ravishankaraet al., 2009). Ammonia is the most abundant alkaline constituent inthe atmosphere (Aneja et al., 2008a, 2008b, 2008c), where itregulates atmospheric acidity (Brasseur et al., 1999). In addition,NH3 is also an important source of atmospheric aerosols (PMfine),because it facilitates gas-to-particle conversion (Baek and Aneja,2004; Baek et al., 2004; Sharma et al., 2007; Behera and Sharma,2010b). Its deposition contributes to soil acidification throughoxidation of the deposited ammonia to acidic compounds (Roelofset al., 1987).
While developed nations are concerned with reducing emis-sions of Nr to the environment, developing nations are far awayfrom such initiatives. This paper provides estimates of NH3 and N2Oemissions from farming (both crop and livestock) in India usingemission factors with regional specificity, livestock species char-acteristics, and regional inventories of the types of fertilizersapplied. Emissions to the atmosphere via waste managementsystems for livestock (non-dairy cattle, dairy cattle, buffaloes,sheep, goats, pigs, horses, asses and mules, camels, and poultry)
V.P. Aneja et al. / Atmospheric Environment 47 (2012) 92e10394
and fertilizer usage are estimated. This paper uses a GeographicInformation System (GIS) to provide spatially resolved state-wideestimates of NH3 and N2O emissions from animal farming andfertilizer applications in India for the base year 2003. We compareand contrast these estimates with the estimates from previousstudies in other regions of the world.
2. Study area and methodology
The methodology adopted in this study has three steps. In thefirst step, identification of the sources responsible for Nr emissionsand collection of source information including location, livestockpopulation (of nine livestock types) and fertilizer consumption(four fertilizers types) were undertaken. In the second step, emis-sion factors for different sources were adopted on the basis of
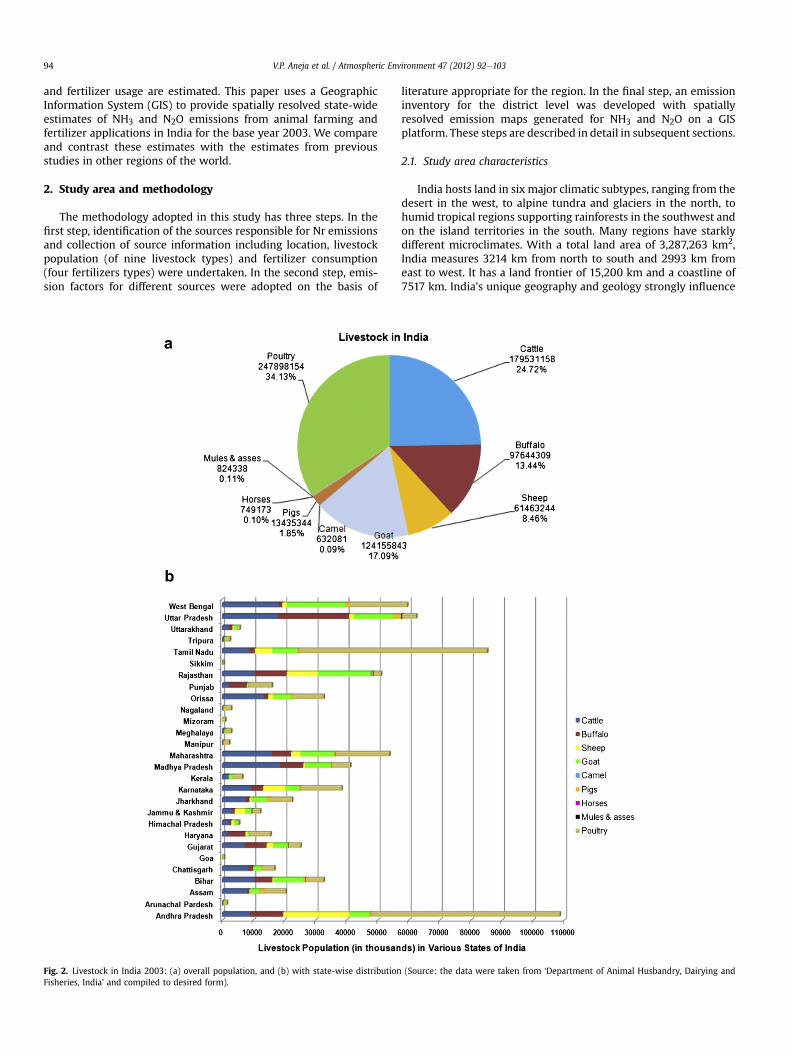
Fig. 2. Livestock in India 2003: (a) overall population, and (b) with state-wise distributionFisheries, India’ and compiled to desired form).
literature appropriate for the region. In the final step, an emissioninventory for the district level was developed with spatiallyresolved emission maps generated for NH3 and N2O on a GISplatform. These steps are described in detail in subsequent sections.
2.1. Study area characteristics
India hosts land in six major climatic subtypes, ranging from thedesert in the west, to alpine tundra and glaciers in the north, tohumid tropical regions supporting rainforests in the southwest andon the island territories in the south. Many regions have starklydifferent microclimates. With a total land area of 3,287,263 km2,India measures 3214 km from north to south and 2993 km fromeast to west. It has a land frontier of 15,200 km and a coastline of7517 km. India’s unique geography and geology strongly influence
(Source: the data were taken from ‘Department of Animal Husbandry, Dairying and
its climate; this is particularly true for the Himalayas in the northand the Thar Desert in the northwest.
India ranks second worldwide in farm output today. Agricultureand allied sectors, such as forestry and logging, accounted for 16.6%of the gross domestic product (GDP) in 2007, and employed 52% ofthe total workforce. India is the world’s largest producer of milk,cashew nuts, coconuts, tea, ginger, turmeric and black pepper. Italso has the world’s largest cattle population (281 million). It is thesecond largest producer of wheat, rice, sugar, groundnut and inlandfish. It is the third largest producer of tobacco and accounts for 10%of the world fruit production, with first rank in the production ofbanana and sapota.
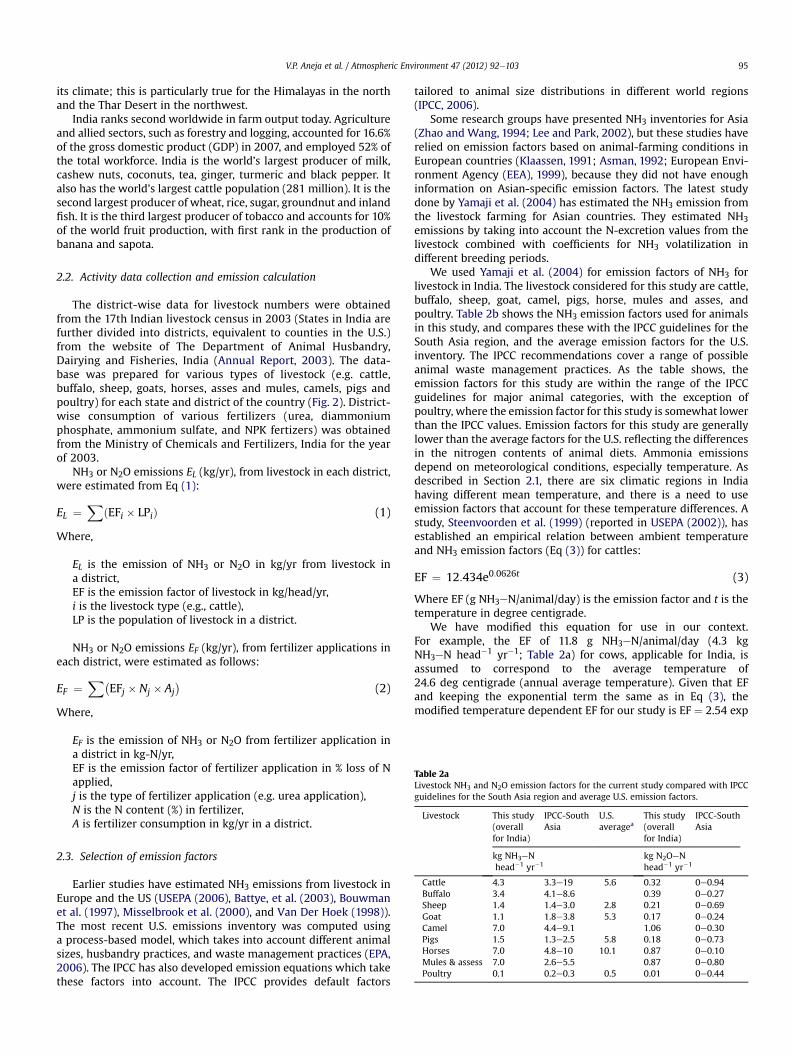
Table 2aLivestock NH3 and N2O emission factors for the current study compared with IPCCguidelines for the South Asia region and average U.S. emission factors.
Livestock This study(overall
IPCC-SouthAsia
U.S.averagea
This study(overall
IPCC-SouthAsia
2.2. Activity data collection and emission calculation
The district-wise data for livestock numbers were obtainedfrom the 17th Indian livestock census in 2003 (States in India arefurther divided into districts, equivalent to counties in the U.S.)from the website of The Department of Animal Husbandry,Dairying and Fisheries, India (Annual Report, 2003). The data-base was prepared for various types of livestock (e.g. cattle,buffalo, sheep, goats, horses, asses and mules, camels, pigs andpoultry) for each state and district of the country (Fig. 2). District-wise consumption of various fertilizers (urea, diammoniumphosphate, ammonium sulfate, and NPK fertizers) was obtainedfrom the Ministry of Chemicals and Fertilizers, India for the yearof 2003.
NH3 or N2O emissions EL (kg/yr), from livestock in each district,were estimated from Eq (1):
EL ¼X
ðEFi � LPiÞ (1)
Where,
EL is the emission of NH3 or N2O in kg/yr from livestock ina district,EF is the emission factor of livestock in kg/head/yr,i is the livestock type (e.g., cattle),LP is the population of livestock in a district.
NH3 or N2O emissions EF (kg/yr), from fertilizer applications ineach district, were estimated as follows:
EF ¼X�
EFj � Nj � Aj�
(2)
Where,
EF is the emission of NH3 or N2O from fertilizer application ina district in kg-N/yr,EF is the emission factor of fertilizer application in % loss of Napplied,j is the type of fertilizer application (e.g. urea application),N is the N content (%) in fertilizer,A is fertilizer consumption in kg/yr in a district.
Earlier studies have estimated NH3 emissions from livestock inEurope and the US (USEPA (2006), Battye, et al. (2003), Bouwmanet al. (1997), Misselbrook et al. (2000), and Van Der Hoek (1998)).The most recent U.S. emissions inventory was computed usinga process-based model, which takes into account different animalsizes, husbandry practices, and waste management practices (EPA,2006). The IPCC has also developed emission equations which takethese factors into account. The IPCC provides default factors
tailored to animal size distributions in different world regions(IPCC, 2006).
Some research groups have presented NH3 inventories for Asia(Zhao and Wang, 1994; Lee and Park, 2002), but these studies haverelied on emission factors based on animal-farming conditions inEuropean countries (Klaassen, 1991; Asman, 1992; European Envi-ronment Agency (EEA), 1999), because they did not have enoughinformation on Asian-specific emission factors. The latest studydone by Yamaji et al. (2004) has estimated the NH3 emission fromthe livestock farming for Asian countries. They estimated NH3emissions by taking into account the N-excretion values from thelivestock combined with coefficients for NH3 volatilization indifferent breeding periods.
We used Yamaji et al. (2004) for emission factors of NH3 forlivestock in India. The livestock considered for this study are cattle,buffalo, sheep, goat, camel, pigs, horse, mules and asses, andpoultry. Table 2b shows the NH3 emission factors used for animalsin this study, and compares these with the IPCC guidelines for theSouth Asia region, and the average emission factors for the U.S.inventory. The IPCC recommendations cover a range of possibleanimal waste management practices. As the table shows, theemission factors for this study are within the range of the IPCCguidelines for major animal categories, with the exception ofpoultry, where the emission factor for this study is somewhat lowerthan the IPCC values. Emission factors for this study are generallylower than the average factors for the U.S. reflecting the differencesin the nitrogen contents of animal diets. Ammonia emissionsdepend on meteorological conditions, especially temperature. Asdescribed in Section 2.1, there are six climatic regions in Indiahaving different mean temperature, and there is a need to useemission factors that account for these temperature differences. Astudy, Steenvoorden et al. (1999) (reported in USEPA (2002)), hasestablished an empirical relation between ambient temperatureand NH3 emission factors (Eq (3)) for cattles:
EF ¼ 12:434e0:0626t (3)
Where EF (g NH3eN/animal/day) is the emission factor and t is thetemperature in degree centigrade.
We have modified this equation for use in our context.For example, the EF of 11.8 g NH3eN/animal/day (4.3 kgNH3eN head�1 yr�1; Table 2a) for cows, applicable for India, isassumed to correspond to the average temperature of24.6 deg centigrade (annual average temperature). Given that EFand keeping the exponential term the same as in Eq (3), themodified temperature dependent EF for our study is EF ¼ 2.54 exp
Table 2bLivestock NH3 emission factors (kg NH3eN head�1 yr�1) with region specific of India used for the current study.
Climatic region of India Cattle Buffalo Sheep Goat Camel Pigs Horses Mules & assess Poultry
a U.S. emissions estimates for animal husbandry include the application of animal wastes to cropland.
V.P. Aneja et al. / Atmospheric Environment 47 (2012) 92e10396
(0.062t). Similarly, the Eq (3) is modified for other livestock animalsand revised EFs for various climatic regions are given in Table 2b.
The IPCC guidelines show N2O emission from animal wastemanagement systems in each region of the world, using values forN-excretion per head of six different types of livestock; cattle (beef),cattle (dairy), poultry, sheep, pigs, and other animals (Houghtonet al., 1997). In addition to these recommended values, N2O emis-sion factors were estimated from the N-excretion values of theother four types of livestock; buffaloes, camels, horses, and goats,obtained from Van der Hoek (1994). Table 2 provides the emissionfactors used in this study to estimate the emission of N2O fromvarious livestock types in India, and compares these factors withthe IPCC guidelines for South Asia. The emission factors (Table 2a)for various livestock are expressed as ‘kg NH3eN head�1 yr�1’ forNH3 emission and ‘kg N2OeN head�1 yr�1’ for N2O emission. NH3and N2O emissions were estimated from Eq (1) by multiplyingthese individual emission factors with respective livestock pop-ulation. It is to be noted that the reported results were translatedfrom NH3eN to NH3 and N2OeN to N2O with suitable conversionfactors.
Several research groups in the past have estimated NH3 emis-sion from synthetic fertilizer applied on agricultural land in theworld (e.g. Bouwman et al., 1997; Misselbrook et al., 2000; Lee andPark, 2002). The emission factors vary as a function of the chemicalcomposition of the fertilizer, soil properties (pH, calcium content,water content, buffering capacity, porosity, etc.), meteorologicalconditions (temperature, wind speed, precipitation), mode ofapplication, and soil and water management (Bouwman et al.,1997). The most recent U.S. emissions inventory uses a processmodel which takes into account soil and meteorological conditionsin different U.S. regions (EPA, 2006). However, due to lack of data,the NH3 emission from fertilizers cannot generally be presented asa function of all the above factors. For instance, IPCC guidelines givea flat emission factor of 10% of the nitrogen content for all syntheticfertilizers. We have adopted the emission factors from the studiesby Bouwman et al. (1997) for NH3, as they have been compiled fordifferent regions of the world. In India the most common syntheticnitrogen fertilizers applied on the agricultural land are urea,
Table 3Synthetic fertilizer NH3 emission factors used in this study compared with theranges of factors used in the U.S.
Fertilizer Ncontent(%)
This study US This study
NH3eN(% loss ofN applied)
N2OeN(% loss ofN applied)
Urea 46 25 15e20 1.4Diammonium
phosphate21 5 5 0.25
Ammoniumsulfate
21 8 5e15 0.35
NPK fertilizer 17 4 6e8 0.2
diammonium phosphate, ammonium sulfate and NPK fertilizers.Table 3 lists the emission factors used in this study and comparesthem to the ranges of factors used in the U.S. The factor used forurea is somewhat higher than the factors used in the U.S., whilefactors for other fertilizers fall within the ranges used in the U.S.
The IPCC assumed an N2O emission factor of 1.25 � 1.0% offertilizer N applied. No allowance was made for different fertilizertypes, for different soil management and cropping systems, and forvariations in rainfall, which are important variables. U.S. emissionsof nitrous oxide were estimated using the DayCent model (EPA,2010; Del Grosso et al., 2008), which takes into account nitrifica-tion and denitrification reactions and other competing removalmechanisms for nitrogen. The emissions inventory does not reportsimplified emission factors for N2O; however, estimated emissionsamounted to about 1.5% of the available nitrogen from anthropo-genic and natural sources of nitrogen. We have adopted the emis-sion factors from Smith et al. (1997), which are listed in Table 3. Theemission factor used for urea (1.4%) is higher than the IPCCguidelines and similar to the 1.5% emission rate obtained for theU.S. Our emission factors for other fertilizers are somewhat lowerthan either the IPCC guidelines or the U.S. modeling results. Table 3presents the N2O emission from the fertilizer application throughdirect pathways. To estimate N2O emission from indirect pathways,we have used the emission factors of one Indian study done byBhatia et al. (2004). In the indirect pathways, N2O emissions fromvolatilized N of fertilizer and manure, and emission from leachedand runoff N from fertilizer and manure were considered. For theindirect pathways from fertilizer application, we assumed anemission factor as 0.5% of N applied.
2.4. Development of spatially resolved emission inventory
A GIS tool, Geostatistical Analyst extension of ArcGIS (ArcMap,version 9.2; ESRI Inc., Redlands, WA, USA) was used to developa base map of India. The map was digitized to extract the district,state and national boundaries in the form of polygons, as per theprocedures in Behera et al. (2011). These vector data (polygoninformation) were converted to different thematic layers to deter-mine the locations of areas of specific interest and also for furtherediting. These thematic layers were used for computing emissionsand extracting inventories. The different thematic layers includemaps of activity data, population, area boundaries etc. The attributevalues (of livestock population, fertilizer consumption in eachdistrict) stored in map tables were utilized to generate the maps ofthe desired emission. Finally, a spatially-resolved emission inven-tory was developed for each district.
3. Results and discussion
3.1. Scenarios of the sources in India
The livestock population of India is large, and animals play animportant role in the agricultural economy even though they often
Fig. 3. Fertilizer Consumption in India 2003: (a) Overall consumption, and (b) with state-wise distribution (Source: the data were taken from ‘Ministry of Chemicals and Fertilizers,India’ and compiled to desired form).
Table 4aEmissions of NH3 and N2O from different livestock.
receive inadequate nourishment. In 2001 there were an estimated219.6 million cattle, more than in any other country and repre-senting about 15% of the world’s total. For 2003, India’s livestockpopulation as a proportion of the world’s total is: cattle 13.5%,buffaloes 55.1%, sheep 5.7%, goats 16.1%, pigs 1.8% and horses 1.4%(Annual Report, 2003) (http://dms.nic.in/ami/home.htm). Theoverall highest livestock population is found in the state of AndhraPradesh, followed by Tamil Nadu, Uttar Pradesh and West Bengal.The greatest individual population of livestock is found for cattle inMadhya Pradesh (18.58 million), buffalo in Uttar Pradesh (22.91
V.P. Aneja et al. / Atmospheric Environment 47 (2012) 92e10398
million), sheep in Andhra Pradesh (21.37 million), goats in WestBengal (18.77 million), camels in Rajasthan (0.49 million), pigs inUttar Pradesh (2.28 million), horses in Jammu and Kashmir (0.17million), mules and asses in Uttar Pradesh (0.23 million) andpoultry in Andhra Pradesh (60.70 million).
Fig. 4. District-wise spatially resolved emissions f
Fig. 3 shows the fertilizer consumption, applied on land foragriculture purposes in India for the year 2003. Urea accounts forthe greatest use (46.21%), followed by NPK (28.27%), diammoniumphosphate (25.45%) and ammonium sulfate (0.08%). The percentageof each fertilizer usedwas based on its consumption relative to total
rom livestock in India: (a) NH3, and (b) N2O.
Table 4bEmissions of NH3 and N2O from fertilizer application.
Category Emission of NH3 Emission of N2O (Gg/yr)
Gg/yr % Directa Indirectb Total %
Diammoniumphosphate
124.8 4.6 45.2 16.1 61.3 18.8
Urea 2481.5 92.0 179.9 64.2 244.1 74.8Ammonium
sulfate0.6 0.02 0.04 0.50 0.5 0.2
NPK 89.7 3.3 5.8 14.5 20.3 6.2
a emission direct pathways of fertilizer application.b emission is from indirect pathways of fertilizer application.
consumption (i.e., sum of diammonium phosphate, urea, ammo-nium sulfate and NPK fertilizers). The highest fertilizer consump-tion was in the state of Uttar Pradesh followed by Andhra Pradesh,Punjab, Maharashtra and West Bengal. The highest individualfertilizer consumption is: diammonium phosphate in Andhra Pra-desh (1.18 million metric tons), urea in Uttar Pradesh (2.36 millionmetric tons), ammonium sulphate in Andhra Pradesh (6339 metrictons) and NPK in Uttar Pradesh (1.39 million metric tons).
3.2. Emission inventory for India
The NH3 and N2O from the waste for each type of livestock, wasestimated at state and district levels by multiplying the specificemission factor by the livestock population, taking into account theN-excretion value from each livestock. Table 4a presents theemissions of NH3 and N2O from livestock excretion (from wastemanagement process excluding the application of these wastes onland). For NH3, cattle contributed the highest emission (56.1%) ofthe total emission from livestock; followed by the buffalo (23.6%).Although the population of poultry was highest, their contributionstowards the NH3 pollution were low owing to their low emissionfactors. For N2O, cattle also contributed the highest proportion(42.3%), followed by buffalo (28.1%) and goats (15.5%), towards thetotal emission from the livestock sector. Uttar Pradesh has thegreatest NH3 emission from livestock (215.9 Gg yr�1), followed byMadhya Pradesh (148.4 Gg yr�1) and West Bengal (142.5 Gg yr�1).Similarly the greatest contributor to N2O emission from livestock isUttar Pradesh (28 Gg yr�1), followed by Madhya Pradesh(17 Gg yr�1) and Maharashtra (16 Gg yr�1). Fig. 4a and b showdistrict-wise spatially-resolved emissions of NH3 and N2O fromlivestock. From these maps, it has been observed that the regionscomprising states of West Bengal, Maharashtra, Andhra Pradesh,Orissa, and Bihar have the greatest areas with emissions of NH3 andN2O per unit area (Gg/yr/km2) from livestock.
NH3 and N2O from fertilizer applications on agricultural land foreach type of fertilizer were estimated at state and district levels bymultiplying the specific emission factor for each fertilizer byfertilizer type consumption (as described in Section 3). Table 4bpresents the emissions of NH3 and N2O from the application fromvarious fertilizers. It can be observed that for NH3, urea contributedhighest emission (92.0%) among fertilizers. Similarly for N2O, ureaalso contributed the highest emission (74.8%). Uttar Pradesh has thegreatest NH3 emission from fertilizer (306 Gg yr�1) followed byPunjab (294 Gg yr�1) and Maharashtra (283 Gg yr�1). Similarly thehighest contributors of N2O emission from fertilizer are Uttar Pra-desh (42 Gg yr�1) followed by Punjab (33 Gg yr�1) and AndhraPradesh (32 Gg yr�1). Fig. 5a and b show the district-wise spatiallyresolved emissions of NH3 and N2O from fertilizer applications.From these maps, it has been observed that the regions comprisingstates of Punjab, Haryana, Gujarat, Maharashtra, Bihar, Andhra
Pradesh, Karnataka, and Tamil Nadu have the largest areas havingemissions of NH3 and N2O per unit area (Gg/yr/km2) from fertilizerapplications.
For assessing uncertainty in the agricultural NH3 emissions,ranges for all input parameters (e.g. activity date, emission factor)were used in the emission inventory for calculating NH3 volatili-zation (Beusen et al., 2008). In this study, the activity level dataused are accurate, as these data are recorded at the district level.However the uncertainty in emission factors is potentially signifi-cant, as there are no published experimental data on the emissionsfor individual sources in India. Therefore, the uncertainty in therange of emission estimates of NH3 and N2O from livestock andfertilizer application were calculated based on different emissionfactors available in the literature. In this task, suitable lower- andupper-limit estimates for emission factors (Tables 2 and 3) wereutilized for estimates for emissions inventories. With this approach,the range of NH3 emission was estimated to be from 3158 to9124 Gg yr�1 (our NH3 estimate was 4454 Gg yr�1). Similarly therange of N2O emission was estimated to be between 424 and859 Gg yr�1 (our N2O estimate was 550 Gg yr�1).
3.3. Comparison of emission estimates with previous studies
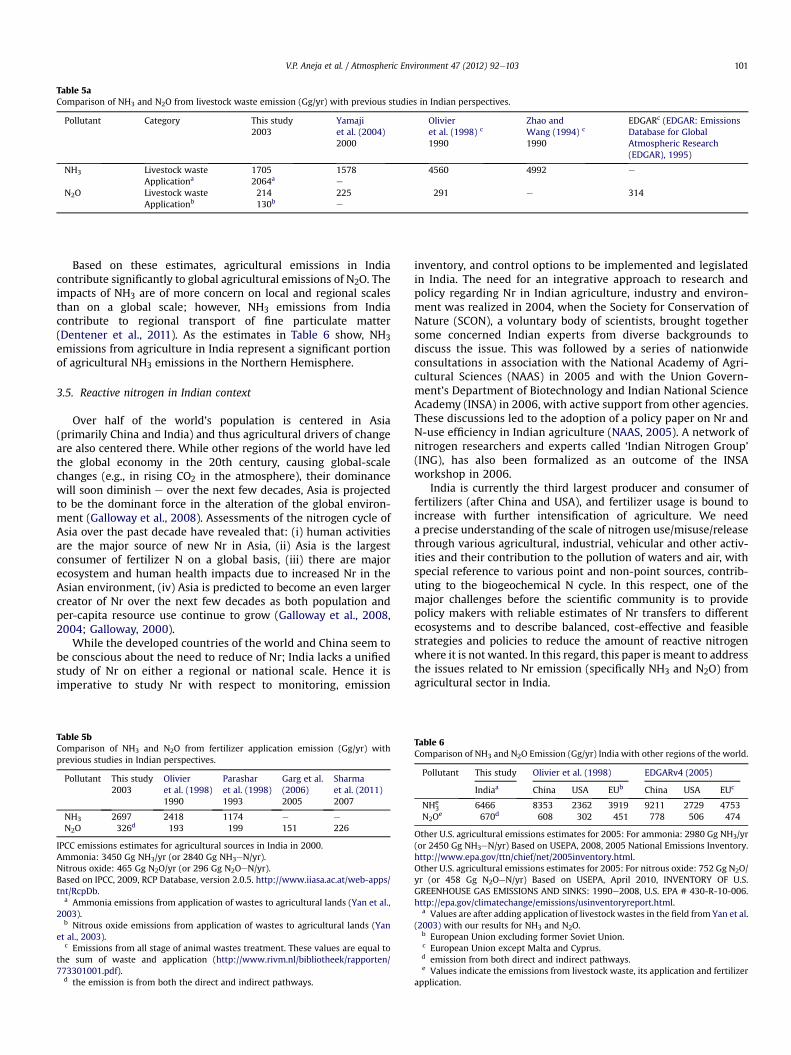
The total amount of NH3 and N2O emissions from livestockwere estimated at 1705 Gg/yr and 214 Gg yr�1, respectively, for thebase year 2003 (Table 5a). Our estimate of NH3 emissions cannotbe compared directly with previous studies (Olivier et al., 1998;Zhao and Wang, 1994) since their values included NH3 emissionsafter the application of manure as fertilizer. But it can be comparedwith Yamaji et al. (2004), where they calculated NH3 as1578 Gg yr�1, similar to our value of 1705 Gg yr�1. Table 5a alsopresents the NH3 emissions from animal excreta used as manurewhich were estimated by Yan et al. (2003). Due to the lack of re-ported region-specific emission factors and activity level data formanure application from each livestock type, we have taken thetotal estimated value from Yan et al. (2003) for comparison of ourvalues with earlier studies. Our result for NH3 emission (fromwaste generation and application) is 17% less than by Olivier et al.(1998) and is 24% less than by Zhao and Wang (1994) for India.Though our results are lower than these earlier estimates, ourapproach has finer resolutions for the emissions inventory and hasmore appropriate activity data. We also generated regional specificemission factors based on earlier empirical relationship betweenmeteorology and emission factor. For N2O, our results matchedwell with Yamaji et al. (2004).
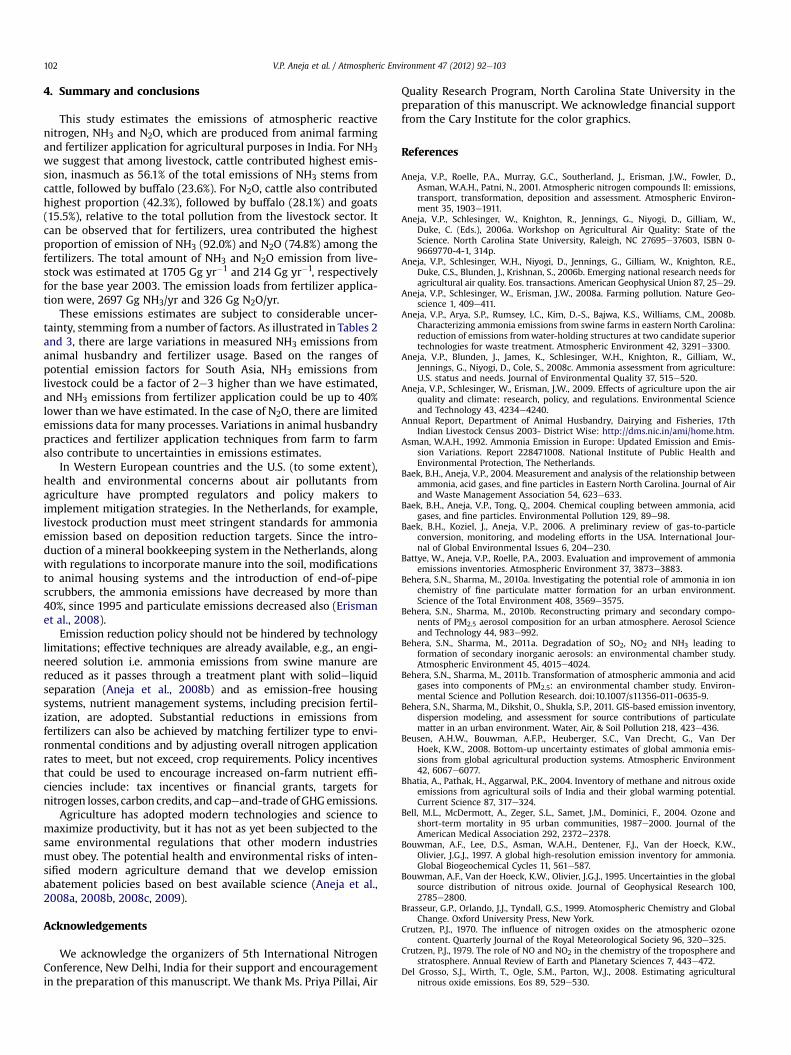
Table 5b presents the NH3 and N2O emissions from fertilizerapplication in comparisonwith the earlier studies (e.g. Olivier et al.,1998; Parashar et al., 1998). Our values for NH3 are higher than thevalues by Olivier et al. (1998), perhaps due to greater consumptionof fertilizer in recent years. In comparing our results with Parasharet al. (1998) for the year 1993 in India, our results are higher forNH3; perhaps due to rising fertilizer consumption during the past10 years. Our results are also higher than the results of Garg et al.(2006) and Sharma et al. (2011). The reason might be due to theselection of higher emission factors in our study. Overall, we believethat our work is more appropriate in the sense that we had theactivity level data at district levels and chose the emission factorssuitable for Asian context.
3.4. Reactive nitrogen emissions in India compared to global, U.S.,and European emissions
Table 6 presents NH3 and N2O emission for India, China, Euro-pean Union countries and the USA. The emission for India is fromthis study, including animal waste management and fertilizer
V.P. Aneja et al. / Atmospheric Environment 47 (2012) 92e103100
application from direct and indirect pathways. The values for thelivestock manure application have been taken from Yan et al.(2003)). The emission values in Table 6 for all regions are fromsources including livestock manure and its application, and
Fig. 5. District-wise spatially resolved emissions from f
fertilizer application. Overall, comparing the data from this studywith other regions reported by earlier studies, India stands secondafter China for emission of both NH3 and N2O from the agriculturalsector.
ertilizer application in India: (a) NH3, and (b) N2O.
Table 5aComparison of NH3 and N2O from livestock waste emission (Gg/yr) with previous studies in Indian perspectives.
Pollutant Category This study2003
Yamajiet al. (2004)2000
Olivieret al. (1998) c
1990
Zhao andWang (1994) c
1990
EDGARc (EDGAR: EmissionsDatabase for GlobalAtmospheric Research(EDGAR), 1995)
NH3 Livestock waste 1705 1578 4560 4992 e
Applicationa 2064a e
N2O Livestock waste 214 225 291 e 314Applicationb 130b e
Based on these estimates, agricultural emissions in Indiacontribute significantly to global agricultural emissions of N2O. Theimpacts of NH3 are of more concern on local and regional scalesthan on a global scale; however, NH3 emissions from Indiacontribute to regional transport of fine particulate matter(Dentener et al., 2011). As the estimates in Table 6 show, NH3emissions from agriculture in India represent a significant portionof agricultural NH3 emissions in the Northern Hemisphere.
3.5. Reactive nitrogen in Indian context
Over half of the world’s population is centered in Asia(primarily China and India) and thus agricultural drivers of changeare also centered there. While other regions of the world have ledthe global economy in the 20th century, causing global-scalechanges (e.g., in rising CO2 in the atmosphere), their dominancewill soon diminish e over the next few decades, Asia is projectedto be the dominant force in the alteration of the global environ-ment (Galloway et al., 2008). Assessments of the nitrogen cycle ofAsia over the past decade have revealed that: (i) human activitiesare the major source of new Nr in Asia, (ii) Asia is the largestconsumer of fertilizer N on a global basis, (iii) there are majorecosystem and human health impacts due to increased Nr in theAsian environment, (iv) Asia is predicted to become an even largercreator of Nr over the next few decades as both population andper-capita resource use continue to grow (Galloway et al., 2008,2004; Galloway, 2000).
While the developed countries of the world and China seem tobe conscious about the need to reduce of Nr; India lacks a unifiedstudy of Nr on either a regional or national scale. Hence it isimperative to study Nr with respect to monitoring, emission
Table 5bComparison of NH3 and N2O from fertilizer application emission (Gg/yr) withprevious studies in Indian perspectives.
Pollutant This study2003
Olivieret al. (1998)1990
Parasharet al. (1998)1993
Garg et al.(2006)2005
Sharmaet al. (2011)2007
NH3 2697 2418 1174 e e
N2O 326d 193 199 151 226
IPCC emissions estimates for agricultural sources in India in 2000.Ammonia: 3450 Gg NH3/yr (or 2840 Gg NH3eN/yr).Nitrous oxide: 465 Gg N2O/yr (or 296 Gg N2OeN/yr).Based on IPCC, 2009, RCP Database, version 2.0.5. http://www.iiasa.ac.at/web-apps/tnt/RcpDb.
a Ammonia emissions from application of wastes to agricultural lands (Yan et al.,2003).
b Nitrous oxide emissions from application of wastes to agricultural lands (Yanet al., 2003).
c Emissions from all stage of animal wastes treatment. These values are equal tothe sum of waste and application (http://www.rivm.nl/bibliotheek/rapporten/773301001.pdf).
d the emission is from both the direct and indirect pathways.
inventory, and control options to be implemented and legislatedin India. The need for an integrative approach to research andpolicy regarding Nr in Indian agriculture, industry and environ-ment was realized in 2004, when the Society for Conservation ofNature (SCON), a voluntary body of scientists, brought togethersome concerned Indian experts from diverse backgrounds todiscuss the issue. This was followed by a series of nationwideconsultations in association with the National Academy of Agri-cultural Sciences (NAAS) in 2005 and with the Union Govern-ment’s Department of Biotechnology and Indian National ScienceAcademy (INSA) in 2006, with active support from other agencies.These discussions led to the adoption of a policy paper on Nr andN-use efficiency in Indian agriculture (NAAS, 2005). A network ofnitrogen researchers and experts called ‘Indian Nitrogen Group’(ING), has also been formalized as an outcome of the INSAworkshop in 2006.
India is currently the third largest producer and consumer offertilizers (after China and USA), and fertilizer usage is bound toincrease with further intensification of agriculture. We needa precise understanding of the scale of nitrogen use/misuse/releasethrough various agricultural, industrial, vehicular and other activ-ities and their contribution to the pollution of waters and air, withspecial reference to various point and non-point sources, contrib-uting to the biogeochemical N cycle. In this respect, one of themajor challenges before the scientific community is to providepolicy makers with reliable estimates of Nr transfers to differentecosystems and to describe balanced, cost-effective and feasiblestrategies and policies to reduce the amount of reactive nitrogenwhere it is not wanted. In this regard, this paper is meant to addressthe issues related to Nr emission (specifically NH3 and N2O) fromagricultural sector in India.
Table 6Comparison of NH3 and N2O Emission (Gg/yr) India with other regions of the world.
Pollutant This study Olivier et al. (1998) EDGARv4 (2005)
Indiaa China USA EUb China USA EUc
NHe3 6466 8353 2362 3919 9211 2729 4753
N2Oe 670d 608 302 451 778 506 474
Other U.S. agricultural emissions estimates for 2005: For ammonia: 2980 Gg NH3/yr(or 2450 Gg NH3eN/yr) Based on USEPA, 2008, 2005 National Emissions Inventory.http://www.epa.gov/ttn/chief/net/2005inventory.html.Other U.S. agricultural emissions estimates for 2005: For nitrous oxide: 752 Gg N2O/yr (or 458 Gg N2OeN/yr) Based on USEPA, April 2010, INVENTORY OF U.S.GREENHOUSE GAS EMISSIONS AND SINKS: 1990e2008, U.S. EPA # 430-R-10-006.http://epa.gov/climatechange/emissions/usinventoryreport.html.
a Values are after adding application of livestock wastes in the field from Yan et al.(2003) with our results for NH3 and N2O.
b European Union excluding former Soviet Union.c European Union except Malta and Cyprus.d emission from both direct and indirect pathways.e Values indicate the emissions from livestock waste, its application and fertilizer
V.P. Aneja et al. / Atmospheric Environment 47 (2012) 92e103102
4. Summary and conclusions
This study estimates the emissions of atmospheric reactivenitrogen, NH3 and N2O, which are produced from animal farmingand fertilizer application for agricultural purposes in India. For NH3we suggest that among livestock, cattle contributed highest emis-sion, inasmuch as 56.1% of the total emissions of NH3 stems fromcattle, followed by buffalo (23.6%). For N2O, cattle also contributedhighest proportion (42.3%), followed by buffalo (28.1%) and goats(15.5%), relative to the total pollution from the livestock sector. Itcan be observed that for fertilizers, urea contributed the highestproportion of emission of NH3 (92.0%) and N2O (74.8%) among thefertilizers. The total amount of NH3 and N2O emission from live-stock was estimated at 1705 Gg yr�1 and 214 Gg yr�1, respectivelyfor the base year 2003. The emission loads from fertilizer applica-tion were, 2697 Gg NH3/yr and 326 Gg N2O/yr.
These emissions estimates are subject to considerable uncer-tainty, stemming from a number of factors. As illustrated in Tables 2and 3, there are large variations in measured NH3 emissions fromanimal husbandry and fertilizer usage. Based on the ranges ofpotential emission factors for South Asia, NH3 emissions fromlivestock could be a factor of 2e3 higher than we have estimated,and NH3 emissions from fertilizer application could be up to 40%lower than we have estimated. In the case of N2O, there are limitedemissions data for many processes. Variations in animal husbandrypractices and fertilizer application techniques from farm to farmalso contribute to uncertainties in emissions estimates.
In Western European countries and the U.S. (to some extent),health and environmental concerns about air pollutants fromagriculture have prompted regulators and policy makers toimplement mitigation strategies. In the Netherlands, for example,livestock production must meet stringent standards for ammoniaemission based on deposition reduction targets. Since the intro-duction of a mineral bookkeeping system in the Netherlands, alongwith regulations to incorporate manure into the soil, modificationsto animal housing systems and the introduction of end-of-pipescrubbers, the ammonia emissions have decreased by more than40%, since 1995 and particulate emissions decreased also (Erismanet al., 2008).
Emission reduction policy should not be hindered by technologylimitations; effective techniques are already available, e.g., an engi-neered solution i.e. ammonia emissions from swine manure arereduced as it passes through a treatment plant with solideliquidseparation (Aneja et al., 2008b) and as emission-free housingsystems, nutrient management systems, including precision fertil-ization, are adopted. Substantial reductions in emissions fromfertilizers can also be achieved by matching fertilizer type to envi-ronmental conditions and by adjusting overall nitrogen applicationrates to meet, but not exceed, crop requirements. Policy incentivesthat could be used to encourage increased on-farm nutrient effi-ciencies include: tax incentives or financial grants, targets fornitrogen losses, carbon credits, and capeand-trade of GHGemissions.
Agriculture has adopted modern technologies and science tomaximize productivity, but it has not as yet been subjected to thesame environmental regulations that other modern industriesmust obey. The potential health and environmental risks of inten-sified modern agriculture demand that we develop emissionabatement policies based on best available science (Aneja et al.,2008a, 2008b, 2008c, 2009).
Acknowledgements
We acknowledge the organizers of 5th International NitrogenConference, New Delhi, India for their support and encouragementin the preparation of this manuscript. We thank Ms. Priya Pillai, Air
Quality Research Program, North Carolina State University in thepreparation of this manuscript. We acknowledge financial supportfrom the Cary Institute for the color graphics.
Aneja, V.P., Schlesinger, W., Knighton, R., Jennings, G., Niyogi, D., Gilliam, W.,Duke, C. (Eds.), 2006a. Workshop on Agricultural Air Quality: State of theScience. North Carolina State University, Raleigh, NC 27695e37603, ISBN 0-9669770-4-1, 314p.
Aneja, V.P., Schlesinger, W.H., Niyogi, D., Jennings, G., Gilliam, W., Knighton, R.E.,Duke, C.S., Blunden, J., Krishnan, S., 2006b. Emerging national research needs foragricultural air quality. Eos. transactions. American Geophysical Union 87, 25e29.
Aneja, V.P., Arya, S.P., Rumsey, I.C., Kim, D.-S., Bajwa, K.S., Williams, C.M., 2008b.Characterizing ammonia emissions from swine farms in eastern North Carolina:reduction of emissions fromwater-holding structures at two candidate superiortechnologies for waste treatment. Atmospheric Environment 42, 3291e3300.
Aneja, V.P., Blunden, J., James, K., Schlesinger, W.H., Knighton, R., Gilliam, W.,Jennings, G., Niyogi, D., Cole, S., 2008c. Ammonia assessment from agriculture:U.S. status and needs. Journal of Environmental Quality 37, 515e520.
Aneja, V.P., Schlesinger, W., Erisman, J.W., 2009. Effects of agriculture upon the airquality and climate: research, policy, and regulations. Environmental Scienceand Technology 43, 4234e4240.
Annual Report, Department of Animal Husbandry, Dairying and Fisheries, 17thIndian Livestock Census 2003- District Wise: http://dms.nic.in/ami/home.htm.
Asman, W.A.H., 1992. Ammonia Emission in Europe: Updated Emission and Emis-sion Variations. Report 228471008. National Institute of Public Health andEnvironmental Protection, The Netherlands.
Baek, B.H., Aneja, V.P., 2004. Measurement and analysis of the relationship betweenammonia, acid gases, and fine particles in Eastern North Carolina. Journal of Airand Waste Management Association 54, 623e633.
Baek, B.H., Aneja, V.P., Tong, Q., 2004. Chemical coupling between ammonia, acidgases, and fine particles. Environmental Pollution 129, 89e98.
Baek, B.H., Koziel, J., Aneja, V.P., 2006. A preliminary review of gas-to-particleconversion, monitoring, and modeling efforts in the USA. International Jour-nal of Global Environmental Issues 6, 204e230.
Battye, W., Aneja, V.P., Roelle, P.A., 2003. Evaluation and improvement of ammoniaemissions inventories. Atmospheric Environment 37, 3873e3883.
Behera, S.N., Sharma, M., 2010a. Investigating the potential role of ammonia in ionchemistry of fine particulate matter formation for an urban environment.Science of the Total Environment 408, 3569e3575.
Behera, S.N., Sharma, M., 2010b. Reconstructing primary and secondary compo-nents of PM2.5 aerosol composition for an urban atmosphere. Aerosol Scienceand Technology 44, 983e992.
Behera, S.N., Sharma, M., 2011a. Degradation of SO2, NO2 and NH3 leading toformation of secondary inorganic aerosols: an environmental chamber study.Atmospheric Environment 45, 4015e4024.
Behera, S.N., Sharma, M., 2011b. Transformation of atmospheric ammonia and acidgases into components of PM2.5: an environmental chamber study. Environ-mental Science and Pollution Research. doi:10.1007/s11356-011-0635-9.
Behera, S.N., Sharma, M., Dikshit, O., Shukla, S.P., 2011. GIS-based emission inventory,dispersion modeling, and assessment for source contributions of particulatematter in an urban environment. Water, Air, & Soil Pollution 218, 423e436.
Beusen, A.H.W., Bouwman, A.F.P., Heuberger, S.C., Van Drecht, G., Van DerHoek, K.W., 2008. Bottom-up uncertainty estimates of global ammonia emis-sions from global agricultural production systems. Atmospheric Environment42, 6067e6077.
Bhatia, A., Pathak, H., Aggarwal, P.K., 2004. Inventory of methane and nitrous oxideemissions from agricultural soils of India and their global warming potential.Current Science 87, 317e324.
Bell, M.L., McDermott, A., Zeger, S.L., Samet, J.M., Dominici, F., 2004. Ozone andshort-term mortality in 95 urban communities, 1987e2000. Journal of theAmerican Medical Association 292, 2372e2378.
Bouwman, A.F., Lee, D.S., Asman, W.A.H., Dentener, F.J., Van der Hoeck, K.W.,Olivier, J.G.J., 1997. A global high-resolution emission inventory for ammonia.Global Biogeochemical Cycles 11, 561e587.
Bouwman, A.F., Van der Hoeck, K.W., Olivier, J.G.J., 1995. Uncertainties in the globalsource distribution of nitrous oxide. Journal of Geophysical Research 100,2785e2800.
Brasseur, G.P., Orlando, J.J., Tyndall, G.S., 1999. Atomospheric Chemistry and GlobalChange. Oxford University Press, New York.
Crutzen, P.J., 1970. The influence of nitrogen oxides on the atmospheric ozonecontent. Quarterly Journal of the Royal Meteorological Society 96, 320e325.
Crutzen, P.J., 1979. The role of NO and NO2 in the chemistry of the troposphere andstratosphere. Annual Review of Earth and Planetary Sciences 7, 443e472.
Del Grosso, S.J., Wirth, T., Ogle, S.M., Parton, W.J., 2008. Estimating agriculturalnitrous oxide emissions. Eos 89, 529e530.
Frank, D., Keating, T., Akimoto, H. (Eds.), 2011. Hemispheric Transport of AirPollution, 2010ePart A: Ozone and Particulate Matter, Air Pollution Studies No.17. Task Force on Hemispheric Transport of Air Pollution acting within theframework of the Convention on Long-range Transboundary Air Pollution,United Nations, New York, NY and Geneva, Switzerland.
EDGAR: Emissions Database for Global Atmospheric Research (EDGAR): 1995.http://www.rivm.nl/bibliotheek/rapporten/773301001.pdf.
EDGAR: Emissions Database for Global Atmospheric Research (EDGAR): 2005.http://edgar.jrc.ec.europa.eu/, EDGAR v4, EDGAR FT32, EDGAR Hyde datasets.
EEA (European Environment Agency), 1999. Atmospheric emission inventoryguidebook, Second edition. EEA, Copenhagen emissions inventories. Atmo-spheric Environment, 37, pp. 3873e3883.
EPA (Environmental Protection Agency), 2006. Documentation for the Final 2002Nonpoint Sector National Emission Inventory for Criteria and Hazardous AirPollutants. http://www.epa.gov/ttn/chief/net/2002inventory.html.
EPA, 2010. Inventory of U.S. Greenhouse Gas Emissions and Sinks: 1990e2008.EPA 430-R-10-006. http://www.epa.gov/climatechange/emissions/usinventoryreport.html.
EPA, 2011. Reactive Nitrogen in the United States: An Analysis of Inputs, Flows,Consequences, and Management Options. EPA-SAB-11-013/August 2011/. www.epa.gov/sab. http://yosemite.epa.gov/sab/sabproduct.nsf/67057225CC780623852578F10059533D/$File/EPA-SAB-11-013-unsigned.pdf.
Erisman, J.W., Bleeker, A., Hensen, A., Vermeulen, A., 2008. Agricultural air quality inEurope and the future perspectives. Atmospheric Environment 42, 3209e3217.
Galloway, J.N., 2000. Nitrogen mobilization in Asia. Nutrient Cycling in Agro-ecosystem 57, 1e12.
Galloway, J., Raghuram, N., Abrol, Y.P., 2008. A perspective on reactive nitrogen ina global, Asian and Indian context. Current Science 94, 1375e1381.
Garg, A., Shukla, P.R., Kapshe, M., 2006. The sectoral trends of multigas emissionsinventory of India. Atmospheric Environment 40, 4608e4620.
Gerber, P., Chilonda, P., Franceschini, G., Menzi, H., 2005. Geographical determinantsand environmental implications of livestock production intensification in Asia.Bioresource Technology 96, 263e276.
Houghton, J.T., Meira Filho, L.G., Lim, B., Treanton, K., Mamaty, I., Bonduki, Y.,Griggs, D.J., Callender, B.A. (Eds.), 1997. Revised 1996 IPCC Guidelines forNational Greenhouse Gas Inventories: Greenhouse Gas Inventory ReferenceManual, vol. 3. UK Meteorological Office, Bracknell.
IPCC (Intergovernmental Panel on Climate Change), 2006. Guidelines for NationalGreenhouse Gas Inventories. http://www.ipcc-nggip.iges.or.jp/public/2006gl/index.html.
Klaassen, G., 1991. Past and Future Emissions of Ammonia in Europe. Part 1 ofa Report to: Ministry for Public Housing, Physical Planning and Environment.International Institute for Applied Systems Analysis, Laxenburg, Austria.
Lee, Y.-H., Park, S.-U., 2002. Estimation of ammonia emission in South Korea. Water,Air and Soil Pollution 135, 23e37.
NAAS, 2005. Policy Options for Efficient Nitrogen Use. Policy Paper No. 33. NationalAcademy of Agricultural Sciences, New Delhi, p. 12.
National Research Council (NRC), 1991. Rethinking the Ozone Problem in Urban andRegional Air Pollution. National Academy Press, Washington, DC.
Oenema, O., 2006. Nitrogen budgets and losses in livestock systems. InternationalCongress Series 1293, 262e271.
Olivier, J.G.J., Bouwman, A.F., Van der Hoek, K.W., Berdowski, J.J.M., 1998. Global airemission inventories for anthropogenic sources of NOx, NH3 and N2O in 1990.Environmental Pollution 102 (S1), 135e148.
Parashar, D.C., Kushrestha, U.C., Sharma, C., 1998. Anthropogenic emissions of NOx,NH3 and N2O in India. Nutrient Cycling Agroecosystem 52, 255e259.
Ravishankara, A.R., Daniel, J.S., Portmann, R.W., 2009. Nitrous oxide (N2O): thedominant ozone-depleting substance emitted in the 21st century. Science,123e125. doi:10.1126/science.1176985.
Roelofs, J.G.M., Boxman, A.W., Van Dijk, H.F.G., 1987. Effect of ammonium on naturalvegetation and forest. In: Asman, W.H., Diederen, H.S.M.A. (Eds.), Ammonia andAcidification, pp. 266e276.
Schlesinger, W.H., 2009. On the fate of anthropogenic nitrogen. Proceedings of theNational Acdemy of Sciences, U.S 106, 203e208.
Sharma, M., Kishore, S., Tripathi, S.N., Behera, S.N., 2007. Role of atmosphericammonia in the formation of inorganic secondary particulate matter: a study atKanpur, India. Journal of Atmospheric Chemistry 58, 1e17.
Sharma, S.K., Choudhury, A., Sarkar, P., Biswas, S., Singh, A., Dadhich, P.K., Singh, A.K.,Majumdar, S., Bhatia, A., Mohini, M., Kumar, R., Jha, C.S., Murthy, M.S.R.,Ravindranath, N.H., Bhattacharya, J.K., Karthik, M., 2011. Greenhouse gasinventory estimates for India. Current Science 101, 1e11.
Singh, B., Singh, Y., 2008. Reactive nitrogen in Indian agriculture: inputs, use effi-ciency and leakages. Current Science 94, 1382e1393.
Smith, K.A., McTaggart, I.P., Tsuruta, H., 1997. Emissions of N2O and NO associatedwith nitrogen fertilization in intensive agriculture, and the potential for miti-gation. Soil Use and Management 13, 296e304.
Steenvoorden, J.H.A.M., Bruins, W.J., van Eerdt, M.M., Hoogeveen, M.W.,Hoogervorst, N., Huijsmans, J.F.M., Leneman, H., van der Meer, H.G.,Monteney, G.J., de Ruiter, F.J., 1999. Monitoring van nationale ammoniake-missies uit de landbouw. Reeks Milieuplanning 6. DLO-Staring Centrum,Wageningen, The Netherlands.
Syakila, A., Kroeze, C., 2011. The global nitrous oxide budget revisited. GreenhouseGas Measurement and Management 1, 17e26.
US EPA, 2002. Review of Emission Factors and Methodologies to Estimate AmmoniaEmissions from Animal Waste Handling. EPA/600/R-02/017. U.S. EPA, Office ofResearch and Development, Research Triangle Park, North Carolina.
Van der Hoek, K.W., 1994. Calculation of N Excretion and NH3 Emissions byGreenhouse Gases in the Netherlands. Technical Report 222901003. NationalInstitute of Public Health and Environmental Protection, The Netherlands.
Van Der Hoek, K.W., 1998. Estimating ammonia emission factors in Europe:summary of the work of the UNECE ammonia expert panel. AtmosphericEnvironment 32, 315e316.
Yamaji, K., Ohara, T., Akimoto, H., 2004. Regional-specific emission inventory forNH3, N2O, and CH4 via animal farming in South, Southeast, and East Asia.Atmospheric Environment 38, 7111e7121.
Yan, X., Akimoto, H., Ohara, T., 2003. Estimation of nitrous oxide, nitric oxide, andammonia emissions from croplands in East, Southeast, and South Asia. GlobalChange Biology 9, 1080e1096.
Zhao, D., Wang, A., 1994. Emission of anthropogenic ammonia emission in Asia.Atmospheric Environment 28, 689e694.