135
Reactor Modeling and Process Analysis for Partial Oxidation of Natural Gas Bogdan Albrecht

Reactor Modeling and Process Analysis for Partial Oxidation of Natural Gas
Bogdan Albrecht

This research has been supported by PiT, the Twente Research School for Process Technology and Senter, an Agency of the Dutch Ministry of Economic Affairs. Composition of the Graduation Committee:
Chairman: Prof.dr.ir. H.J. Grootenboer Univ. Twente, CTW Secretary: Prof.dr.ir. H.J. Grootenboer Univ. Twente, CTW Promoter: Prof.dr.ir. Th.H. van der Meer Univ. Twente, CTW Assistant Promotor: Dr.ir. J.B.W. Kok Univ. Twente, CTW Members: Prof.dr.ir. J.A.M. Kuipers Univ. Twente, TNW Prof.dr.ir. M. Wolters Univ. Twente, CTW Prof.dr. D.J.E.M. Roekaerts TU Delft Prof.ir. J.P. van Buijtenen TU Delft Prof.dr.ir. L.P.H. de Goey TU Eindhoven Prof.dr. H.B. Levinsky RU Groningen
Title: Reactor Modeling and Process Analysis for Partial Oxidation of Natural Gas Author: Bogdan Albrecht ISBN: 90-365-2100-9 Printed by Febodruk B.V., Enschede, The Netherlands, 2004 © Bogdan Albrecht, Enschede, The Netherlands, 2004

REACTOR MODELING AND PROCESS ANALYSIS FOR PARTIAL OXIDATION OF NATURAL GAS
DISSERTATION
to obtain the doctor’s degree at the University of Twente,
on the authority of the rector magnificus, prof.dr. F.A. van Vught,
on account of the decision of the graduation committee, to be publicly defended
on Friday 15th of October 2004 at 15.00
by
Bogdan Alexandru Albrecht born on July 3rd, 1973 in Bucharest, Romania

This dissertation is approved by promoter: prof.dr.ir. Th.H. van der Meer and assistant promoter: dr.ir. J.B.W. Kok

To my wife Gratiela and my daughter Ana


Contents 1 Introduction 1
1.1 Background of the research .............................................................................. 1 1.2 Synthesis gas production................................................................................... 3 1.3 Scope of the thesis ............................................................................................ 6 1.4 Outline of the thesis .......................................................................................... 7
2 Partial oxidation gas turbine plant 9
2.1 Introduction....................................................................................................... 9 2.2 Operation of the partial oxidation gas turbine plant ....................................... 11 2.3 Exergy analysis of the partial oxidation gas turbine plant.............................. 12
2.3.1 Exergy analysis method ....................................................................... 12 2.3.2 Case study ............................................................................................ 14 2.3.3 Results.................................................................................................. 15
2.4 Conclusions..................................................................................................... 18 3 Simplified models for the partial oxidation reactor 19
3.1 Introduction..................................................................................................... 19 3.2 PREMIX simulations ...................................................................................... 21
3.2.1 Methane flammability limits................................................................ 21 3.2.2 Freely propagating flames ................................................................... 22
3.3 PSR simulations .............................................................................................. 26 3.3.1 Residence time effect........................................................................... 27 3.3.2 Pressure effect...................................................................................... 29
3.4 Conclusions..................................................................................................... 32 4 A model for turbulent rich combustion applied on the partial
oxidation of natural gas 35 4.1 Introduction..................................................................................................... 35 4.2 Structure of the combustion model ................................................................. 36 4.3 Gas phase model ............................................................................................. 37
4.3.1 Enthalpy loss variable .......................................................................... 37 4.3.2 Reaction progress variable................................................................... 39 4.3.3 Thermo-chemical database .................................................................. 40

viii Contents
5 Soot 47 5.1 Soot formation and modeling.......................................................................... 47
5.1.1 Soot formation in flames...................................................................... 47 5.1.2 Mechanism of soot formation .............................................................. 47 5.1.3 Soot modeling ...................................................................................... 48
5.2 Soot model for the partial oxidation of natural gas ........................................ 48 5.2.1 Nucleation ............................................................................................ 49 5.2.2 Surface growth ..................................................................................... 50 5.2.3 Particle agglomeration ......................................................................... 51 5.2.4 Oxidation.............................................................................................. 52 5.2.5 Source terms of soot parameters transport equations .......................... 53 5.2.6 Turbulent transport equations for soot parameters .............................. 54
6 Simulations of the partial oxidation of natural gas with the
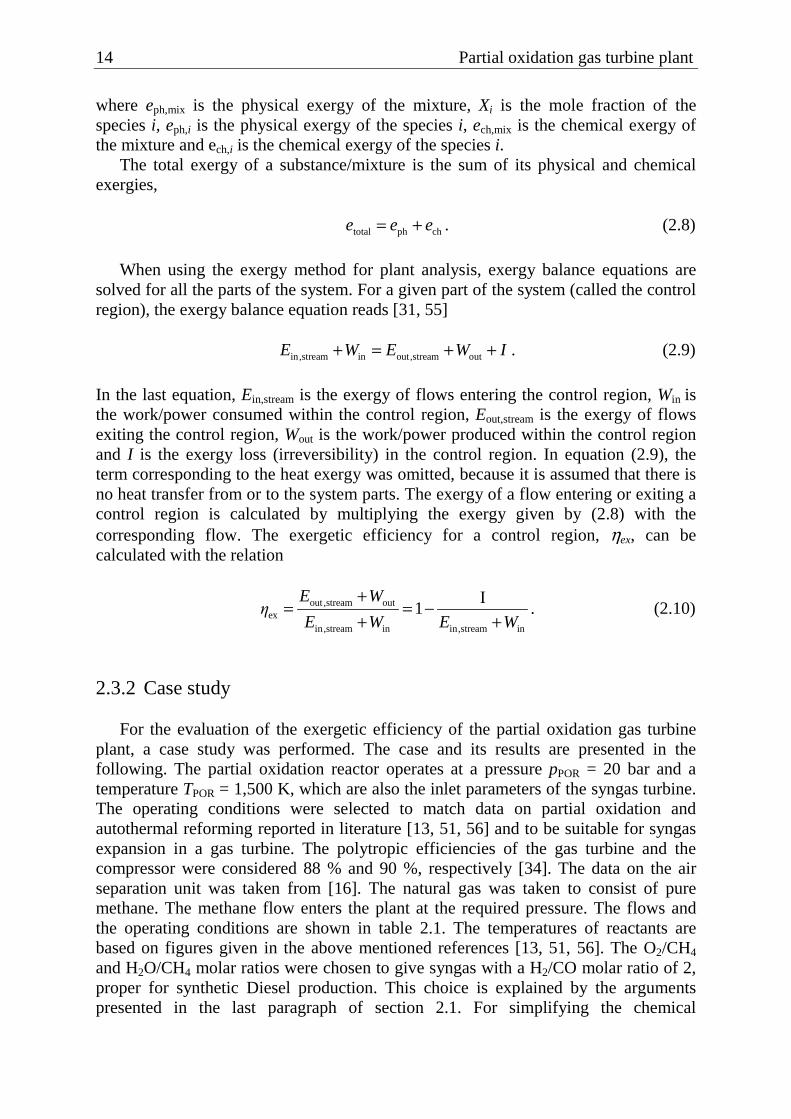
turbulent rich combustion model 57 6.1 Introduction..................................................................................................... 57 6.2 Summary of transport equations ..................................................................... 57 6.3 Thermo-chemical databases............................................................................ 61 6.4 Modeling domains and boundary conditions.................................................. 62 6.5 Results ............................................................................................................. 67
6.5.1 Effect of reactor diameter .................................................................... 67 6.5.2 Effect of methane and oxygen concentrations in the mixture ............. 75
6.6 Combustion regimes ....................................................................................... 79 6.7 Conclusions..................................................................................................... 83
7 Conclusions and recommendations 85
7.1 Conclusions..................................................................................................... 85 7.2 Recommendations for future research ............................................................ 87
Nomenclature 89 A Chemical exergy of hydrogen and carbon monoxide 95 B Detailed results of the exergy analysis of the partial oxidation gas
turbine plant 97 C PREMIX and PSR codes 101
C.1 PREMIX code ............................................................................................... 101 C.2 PSR code ....................................................................................................... 102
D Mathematical description of chemically reacting flows 105
D.1 Introduction................................................................................................... 105 D.2 Governing equations for laminar reacting flows .......................................... 105 D.3 Turbulent reactive flows ............................................................................... 109

ix
E Evaluation of predicted soot parameters and oxidation rates 113 References 115 Summary 119 Samenvatting 121 Curriculum Vitae 123 Acknowledgments 125

x Contents

Chapter 1 Introduction
Abstract
In this chapter, the topic of the research - partial oxidation of natural gas - is introduced. The background of the investigation is discussed. The applications of the syngas, the product of the partial oxidation process, are reviewed. The state-of-the-art partial oxidation technology is presented. The existing syngas production methods are described and compared. The novel partial oxidation process proposed by the present work is put forward. The objectives and approach of the research are shown. The outline of the thesis is given.
1.1 Background of the research
This thesis refers to the partial oxidation of natural gas for syngas production. Partial oxidation is a process in which the quantity of oxidizer is less than that stoichiometric requested for the complete combustion of a hydrocarbon fuel. The product of the partial oxidation process is called synthesis gas or syngas and consists of a gas mixture composed primarily of hydrogen and carbon monoxide. Such mixtures represent the intermediary step from hydrocarbons to bulk chemicals (methanol, DME, ammonia, acetic acid, oxo-alcohols, isocyanates) and synthetic fuels (synthetic Diesel) [13].
Methanol, CH3OH, is one of the most important chemical raw materials. In 1993 the world wide production capacity was 22.4⋅106 t. Approximately 70 % of the methanol produced is used in chemical syntheses of, in order of importance, formaldehyde, methyl tert-butyl ether (MTBE), acetic acid and other chemicals. About 15 % of the methanol produced is utilized in the fuel and energy sector. This use has great potential and is increasing. Another chemical synthesized from syngas is dimethyl ether, DME. In 1998 the production of DME in Western Europe was 50,000 t. Most of its use is in the chemical industry. However, DME is also considered an alternative fuel for diesel engines. This because it has a low autoignition temperature, is an oxygenated fuel, which helps establishing a good air-fuel mixture, preventing soot formation and enables NOx reduction. Syngas is also used for the production of ammonia. In 1997 about 85 % of ammonia production was consumed for fertilizers. Ammonia is either converted into solid fertilizers (e.g. urea) or directly applied to arable soil. The industrial use of ammonia is around 15 %. Actually every nitrogen atom in industrially produced chemicals compounds, like plastics and fibers, comes directly or indirectly from ammonia [57]. An additional use of synthesis gas is

2 Introduction
the manufacture of synthetic Diesel. This is a high quality transportation fuel, free of nitrogen and sulfur impurities and aromatic compounds. It has a high cetane number (above 70 as opposed to 40−50 for standard Diesel) and burns with reduced emission of particulates, carbon monoxide and hydrocarbons [9].
Syngas is produced by gasification of coal, oil residue, biomass and organic waste and by reforming of natural gas. One of the most important feedstocks for syngas production is natural gas.
The efficiency of the partial oxidation process depends on the conversion efficiency of natural gas to hydrogen and carbon monoxide and the efficiency of the produced syngas heat recovery. The commercially established processes for the production of syngas from gaseous or liquid hydrocarbons by partial oxidation are the Texaco, Shell and Lurgi processes [57]. All three processes use waste-heat boiler configurations for heat recovery. Superheated steam at 10 – 14 MPa is produced for utilization in steam turbines for power generation. Drawback of this heat recovery system is the low exergetic efficiency caused by the unavoidable exergy loss associated with heating low temperature steam (below 600 °C) with high temperature syngas (above 1,200 °C). A schematic of the Texaco oil gasification process is given in figure 1.1 [57]. It can be noticed that a large section of the plant presented in figure 1.1 is dedicated to soot removal. In case of using natural gas as feedstock, however, the soot formation is much reduced as compared to heavy oils. As a result, the plant is a great deal simplified.
Figure 1.1. Texaco oil gasification process. a) Preheater; b) Reactor; c) Venturi scrubbing section; d) Soot scrubber; e) Decanter; f) Flash distillation; g) Naphtha column; h) Water clarification [57].
In the present research, an alternative system of syngas heat recovery is proposed. Namely, the syngas residual heat is converted to mechanical power by expansion in a gas turbine. The expected exergetic efficiency of this system is higher than that of the

1.2 Synthesis gas production 3
conventional processes due to the higher temperature of the working fluid (top temperatures in excess of 1,200 °C for syngas as opposed to 600 °C for steam). The power is used to run an air separation unit, which provides the necessary oxygen to the partial oxidation process. This way, the partial oxidation process has a high efficiency heat recovery system and is independent of external sources of energy.
Because the syngas is expanded in a gas turbine to produce power, the partial oxidation reactor must have a high power density. This is achieved by using a turbulent flow inside the reactor, similar to the gas turbines combustion chambers. The partial oxidation process is characterized by a high fuel to oxidizer ratio, far beyond the stoichiometric ratio. It follows that partial oxidation represents an ultra rich combustion process. Furthermore, in order to have a homogeneous mixture of natural gas and oxidizer inside the reactor, which is beneficial for the efficient conversion of natural gas to syngas, the flow is also premixed. Based on the arguments presented above, the proposed partial oxidation process is a turbulent rich premixed combustion process.
1.2 Synthesis gas production
The main production processes of syngas from natural gas are steam methane reforming, thermal partial oxidation and autothermal reforming. A short description of these processes is given below [13, 45, 51, 56].
Steam methane reforming (SMR) is the most conventional process for syngas production from natural gas. This technology essentially consists of a fired heater containing catalyst filled tubes. Natural gas and steam are preheated to about 850 K and passed through catalyst tubes. The natural gas - steam mixture is catalytically converted to hydrogen, carbon monoxide and carbon dioxide. The reaction is endothermic, the heat being provided by external burners. The syngas exits the reformer at about 1,150 K. Schematic of the SMR process in given in figure 1.2 [56]. The following global reactions take place inside the catalyst tubes 1
4 2 2CH H O CO 3H , 206 kJ mol−+ = + ∆ = +h , (1.1) 1
2 2 2CO H O CO H , 41 kJ mol−+ = + ∆ = −h . (1.2) Equation (1.1) is the reforming reaction (endothermic) and equation (1.2) is the water-gas shift reaction (slightly exothermic). The heat or reaction (∆h) was also indicated. The comparison of the heat of reaction values indicates that the net reaction is endothermic. For this reason, additional energy has to be provided by external heating (see figure 1.2).

4 Introduction
Figure 1.2. Typical SMR process scheme [56].
An alternative way to produce synthesis gas is by partial oxidation (POX). Instead of steam, pure oxygen is used at elevated pressure and temperature as an oxidizer of the natural gas. The overall reaction describing the process is 1
4 2 2CH 0.5O CO 2H , 36 kJ mol−+ = + ∆ = −h . (1.3) Reaction (1.3) is exothermic; the syngas exits the partial oxidation reactor at high temperature. Furthermore, the partial oxidation reaction is carried out usually at high pressures (see table 1.1). A plant of syngas production based on the partial oxidation process was shown in figure 1.1, section 1.1. In figure 1.3, a typical POX reactor is depicted [56]. Preheated natural gas and oxygen are fed to the reactor. They are mixed by a burner and react in a turbulent diffusion flame. The reactor is refractory lined to sustain the high temperatures of the produced syngas (1,650 K).
Another competing technology is autothermal reforming (ATR). This process combines partial oxidation and adiabatic-steam reforming. A typical ATR process is presented in figure 1.4 [13]. The process represented in figure 1.4 consists of a natural gas preheat section, a reactor and heat recovery section and a gas separation unit. A desulphurization unit is also present. The steam reforming of natural gas takes place in the autothermal reformer. A mixture of natural gas-steam and oxygen is fed to the reactor. Partial oxidation reactions occur in a combustion zone and then the products pass through a catalyst bed, where reforming reactions occur. The ATR reactor consists of a refractory lined pressure vessel with a burner, a combustion chamber and a catalyst bed. It has a design similar to that of the POX reactor shown in figure 1.3, but contains also a catalyst bed in the last part. The produced syngas temperature is about 1,300 K as compared to 1,650 K for the POX reactor. This reduction in the syngas temperature is required by the presence of the catalyst which does not support higher temperature values.

1.2 Synthesis gas production 5
Figure 1.3. Typical POX reactor [56].
Figure 1.4. Typical ATR process scheme [13].
Typical operating conditions and H2/CO molar ratio for synthesis gas production
methods discussed above are given in table 1.1.

6 Introduction
Table 1.1. Characteristics of syngas production methods.
Operating conditions Method
Temperature (°C) Pressure (bar) H2/CO
SMR 750 – 900 15 – 40 3 – 5 ATR 850 – 1,000 20 – 40 1.6 – 2.65 POX 1,200 – 1,500 20 – 150 1.6 – 1.8
The comparison of SMR, ATR and POX technologies for syngas production from
natural gas leads to the following conclusions. In contrast to POX and ATR, SMR has a bulky installation, due to the large SMR furnace with catalyst tubes and large flue gas heat recovery section. However, this method is preferred for the production of hydrogen, as a result of the high H2/CO molar ratio (see table 1.1). When compared with ATR, POX has a smaller CO2 removal system (for full CO2 recycle) and does not use a catalyst. This makes POX more compact and with a higher power density than ATR. On the other hand, ATR has a less expensive reactor and heat recovery section than POX, due to lower temperatures and produces no soot. In addition, ATR is a more flexible process than POX in view of the H2/CO molar ratio of syngas produced (see table 1.1). It follows that an optimal process of syngas manufacture from natural gas with a H2/CO molar ratio below 2 would combine the compactness and power density of POX, the soot free operation of ATR and a high efficiency, compact heat recovery system. The partial oxidation process proposed in this thesis targets to these objectives.
1.3 Scope of the thesis
As mentioned in section 1.1, the present work aims to a novel partial oxidation process of natural gas in which the syngas is expanded in a gas turbine for heat recovery. It was stated that the suggested partial oxidation is a turbulent rich premixed combustion. The main goal of the thesis is to develop a combustion model for the computational fluid dynamics (CFD) investigation of the proposed partial oxidation process. This model can be used as a numerical tool for the partial oxidation reactor design optimization. The optimization issues for a partial oxidation process are a high conversion efficiency of natural gas to hydrogen and carbon monoxide and a low soot production. The combustion model has to predict gaseous species concentrations and soot formation for the turbulent rich premixed combustion conditions. The development of the model is carried out with an innovative approach. This is the modification and application of well known methods of combustion modeling to the partial oxidation process.
Rich combustion modeling poses additional difficulties compared to the much more studied case of lean combustion. These are more complex chemistry and soot occurrence. While a lean combusting mixture can be described with a good degree of approximation by C1 species only, in the rich combustion system the reaction path to C2+ hydrocarbons becomes more important [53]. The effect of soot presence in the

1.4 Outline of the thesis 7
product gas is twofold: first, soot is a contamination species for the product gas and second, it influences flame phenomena like radiation. To cope with the complex chemistry issue, a detailed reaction mechanism mapped on a reaction progress variable is used, for the description of the gaseous reactions. The soot formation is modeled by the empirical processes of nucleation, surface growth, agglomeration and oxidation. The influence of soot radiation on the gas phase chemistry is taken into account by using an enthalpy loss variable.
The analysis of the integration of a partial oxidation reactor, a gas turbine and an air separation unit is also within the scope of this work. In this integrated plant, the syngas turbine generates mechanical power by expanding the syngas produced by partial oxidation. The oxygen is delivered by the air separation unit, which is driven by the turbine. An exergy analysis is carried out for the partial oxidation gas turbine plant. The goal of the investigation is to show that the proposed plant has superior exergetic efficiency and is energetically independent. The analysis aims also to point out the exergy losses in the various plant components (reactor, turbine, air separation unit, etc).
1.4 Outline of the thesis
In this thesis, first the partial oxidation gas turbine plant is analyzed, from the exergetic point of view. Then, simplified models are applied for the numerical investigation of the partial oxidation reactor. The governing equations of chemically reacting flows are then formulated. The last part of the thesis is dedicated to the CFD modeling of the reactor with an in-house developed turbulent rich combustion model.
In chapter 2, the basic partial oxidation gas turbine plant is introduced. Then, the exergy analysis of a case study is presented. The analysis shows that the syngas turbine is a highly efficient way of syngas residual heat recovery and it provides autonomy to the partial oxidation gas turbine plant.
In chapter 3, the partial oxidation reactor is modeled in zero- and one-dimensional rich combustion systems: perfectly stirred reactors and freely propagating flames. The influences of residence time, pressure, equivalence ratio and type of oxidizer on the partial oxidation produced syngas are investigated. The propagation properties of rich flames are studied.
In chapter 4, the in-house developed three-dimensional turbulent rich combustion model for partial oxidation reactor modeling is described. The turbulent transport equations for the combustion scalars are formulated. The thermo-chemical database used to incorporate the detailed chemistry in the combustion model is presented as well.
Chapter 5 describes the soot model for the prediction of soot formation in the partial oxidation process. First, soot effects on flame phenomena (e.g., radiation) are discussed. Then, the mechanism of soot formation is shown. The processes of soot nucleation, surface growth, agglomeration and oxidation are presented in detail. In the last part of the chapter, the turbulent transport equations for soot parameters are formulated.

8 Introduction
In chapter 6, the results of numerical simulations with the in-house developed combustion model are shown. The transport equations of the combustion model are summarized. The effects of reactor diameter and methane and oxygen concentrations in the mixture on the partial oxidation process are investigated. The combustion regimes for the simulated cases are identified. Finally, conclusions and recommendations are given in chapter 7.

Chapter 2 Partial oxidation gas turbine plant
Abstract
In this chapter, a novel synthesis gas production process based on partial oxidation of natural gas is investigated. The proposed process generates synthesis gas and power in a gas turbine plant. The plant integrates a partial oxidation reactor, a syngas turbine and an air separation unit. Natural gas and oxygen are converted to syngas in the partial oxidation reactor. The oxygen is supplied by the air separation unit. The syngas is expanded in the syngas turbine to generate shaft power. The turbine runs the air separation unit. The goal of the investigation is to show that the integration of a gas turbine in a partial oxidation process is a highly efficient way of syngas heat recovery and provides autonomy to the partial oxidation process. The method used is the exergy analysis of the plant. The irreversibilities of the plant components and the exergetic efficiency of the plant are calculated for a case study. The exergy analysis results are presented in a Grassmann diagram.
2.1 Introduction
In section 1.2, the syngas production methods have been discussed and the typical operating conditions have been presented (see table 1.1). By inspecting the figures presented in table 1.1, it can be noticed that the syngas produced by partial oxidation is characterized by the highest temperatures. It follows that the efficiency of the partial oxidation process is highly influenced by the efficiency of the syngas residual heat recovery. In section 1.1, it was mentioned that the commercially established processes for the production of syngas by partial oxidation (Texaco, Shell, Lurgi) use waste-heat boiler configurations for heat recovery. Superheated steam at 10 – 14 MPa is produced for use in steam turbines. In the present study, the syngas residual heat is converted to mechanical power by syngas expansion in a gas turbine. The expected exergetic efficiency of this system is higher than that of the conventional processes due to higher temperature of the working fluid (top temperatures of 1,500 K for syngas as opposed to 900 K for steam). The power is mainly used to run the air separation unit, which provides the necessary oxygen to the partial oxidation process. This way, the partial oxidation process becomes independent of external sources of energy. Another advantage of the proposed installation is that the syngas turbine is much more compact than the conventional steam boiler and turbine system.
Special attention deserves to be paid to the production of synthetic fuels from natural gas. A very promising route to monetize stranded natural gas is the gas-to-

10 Partial oxidation gas turbine plant
liquid technology (GTL). An example of such a process is the well established Shell Middle Distillate Synthesis Process (SMDS) [9]. GTL technology consists of two main steps. In the first step, the natural gas is converted to syngas and in the second step the syngas is converted to liquid hydrocarbons. The second step of the process uses the Fisher-Tropsch technology (FT). For the first step one has to choose between SMR and POX. The conversion of natural gas with steam will produce a synthesis gas with a H2/CO ratio of at least 3. As the H2/CO ratio requested by the FT synthesis of high quality middle distillates is about 2 and of aromatics 1.6, the combination of SMR with FT will result in surplus hydrogen which is usually burned in the SMR furnace. A gas with an H2/CO ratio of about 2 can be produced by partial oxidation. For the manufacture of high quality middle distillates, little or no adjustment of the H2/CO ratio is required, consequently giving a high overall process efficiency [9]. The H2/CO ration of 2 and the energetic autonomy recommend the partial oxidation process proposed here as a highly competitive route for the conversion of natural gas to synthetic fuel.
The use of a partial oxidation process in a gas turbine system was described also by other investigators [35, 48, 50, 66]. In [50], a two-stage gas turbine topping cycle of a combined gas-steam power generation system was analyzed. In the first stage, partial oxidation of the fuel with sub-stoichiometric combustion air occurs at high pressure, the partial oxidation products being fed to the partial oxidation gas turbine. In the second stage, the products from the partial oxidation gas turbine exit are combusted at a low pressure and a low level of excess air. The complete combustion products are expanded in a low pressure gas turbine. The partial oxidation technology is thought to raise the efficiency of natural gas fired advanced turbine systems up to 68 % (based on LHV) and ensure NOx emissions less than 6 ppm. The latter effect was explained by almost no NOx formation in the partial oxidation reducing atmosphere of the first stage and low emissions of NOx in the low excess air combustion of the second stage. In [35], a similar partial oxidation system has been investigated. The analysis indicated that the partial oxidation gas turbine cycle has a similar performance with conventional cycles, within feasible range of pressures (maximum pressure of 40 bar) and temperatures (turbine inlet temperature of 1,200 − 1,400 °C). However, it was shown that the reduced atmosphere in the partial oxidation stage allows the use of C-C composites for turbine blades. These can sustain higher turbine inlet temperatures, leading to higher gas turbine cycle efficiency. In [35], the idea of using the partial oxidation gas turbine system for co-production of synthesis gas and power was also advanced. The partial oxidation concept was also discussed in [66]. The proposed chemical gas turbine system consisted of a fuel rich combustor and a turbine. This was integrated in a combined gas-steam cycle for power generation and compared to conventional combined cycles. The thermal efficiency of the proposed system was 64 % (based on LHV) for a chemical gas turbine inlet temperature of 1,800 °C as opposed to 61.9 % of a conventional cycle with a turbine inlet temperature of 1,450 °C. C-C composites blades have been considered for the chemical gas turbine, as discussed above. In [48], a chemical reactor and an expander have been used for the production of ethylene, ammonia and methanol. The calculated exergy loss in the chemical reactor was lower than 10 %, much lower than the exergy loss in the combustion chamber of a modern gas turbine which is about 25 %.

2.2 Operation of the partial oxidation gas turbine plant 11
2.2 Operation of the partial oxidation gas turbine plant In the present section, a basic synthesis gas production process based on the partial
oxidation of natural gas is described. Synthesis gas and power are generated in a partial oxidation gas turbine plant. This is the integrated plant of a partial oxidation reactor, a syngas turbine and an air separation unit. Natural gas is converted with oxygen to syngas in the partial oxidation reactor. Steam is also fed to the reactor to control the temperature of the process and the syngas composition. The syngas is expanded in the gas turbine. The oxygen is supplied by the air separation unit. The plant generates sufficient shaft power to be self-sustaining and some output power. Auxiliary products are gaseous nitrogen, liquid nitrogen and liquid argon. This gas turbine plant is very compact and has high exergetic efficiency.
The lay-out designed for the partial oxidation gas turbine plant is presented in figure 2.1. The installation consists of three main parts: 1. The partial oxidation reactor (POR); 2. The syngas turbine (SGT) and heat exchangers for syngas heat recovery (HENG,
2OHE );
3. The air separation unit (ASU) and the oxygen compressor (C). The process works as follows. The ASU separates the oxygen from the air. It produces, besides gaseous oxygen (GOX), liquid oxygen (LOX), gaseous nitrogen (GAN), liquid nitrogen (LIN) and liquid argon (LAR), too. In the mixer M, the liquid oxygen stream is vaporized and heated by mixing it with the gaseous oxygen stream. Together, they form the total oxygen stream to be fed to the POR. The compressor C raises the pressure of oxygen from pASU, which is the ASU delivery pressure, to pPOR, requested by the partial oxidation process. The ASU and the compressor C are driven by the SGT. The SGT expands the high temperature and pressure syngas flow to generate power. The heat exchangers HENG and
2OHE preheat the natural gas (NG)
and oxygen streams, respectively, using the residual heat of the syngas stream exiting the SGT. The temperature of the partial oxidation process and the syngas composition are controlled by the oxygen to natural gas and steam to natural gas ratios. Therefore, steam at pPOR and TSteam is fed to the POR as well.

12 Partial oxidation gas turbine plant
Figure 2.1. Lay-out of the partial oxidation gas turbine plant.
2.3 Exergy analysis of the partial oxidation gas turbine plant 2.3.1 Exergy analysis method
The partial oxidation gas turbine plant described in the previous section was analyzed by performing an exergy analysis. The exergy calculations have been made following [1, 55]. The relations used are presented in the following.
The physical exergy of a substance at the pressure p and the temperature T is given by
( ) ( )ph, ,0 0 ,0= − − −i i i i ie h h T s s , (2.1)
where eph,i is the physical exergy of species i, hi and si are the enthalpy and entropy of species i at the actual conditions (p, T) and hi,0 and si,0 are the enthalpy and entropy of species i at the environmental state (p0, T0).
In view of the high operating temperatures, all components of the working fluid can be assumed to behave like an ideal gas. The chemical exergy of a reference substance (substance which is present in the atmospheric air) is then calculated with
ch, 0
1ln⎛ ⎞
= ⎜ ⎟⎝ ⎠
ii
e RTX
, (2.2)
where ech,i is the chemical exergy of species i, R is the universal gas constant and Xi is the mole fraction of the species i in the air. The following atmospheric air composition

2.3 Exergy analysis of the partial oxidation gas turbine plant 13
was used [1]: 2NX = 0.7567,
2OX = 0.2035, 2H OX = 0.0303,
2COX = 0.0003, Xothers =
0.0092. For a substance other than a reference substance (e.g., a fuel), the chemical exergy
is calculated by considering a reversible chemical reaction between the suitable reference substances. Let us consider the stoichiometric combustion of a hydrocarbon fuel with oxygen
m n 2 2 2
n nC H m O mCO H O
4 2⎛ ⎞+ + → +⎜ ⎟⎝ ⎠
. (2.3)
The chemical exergy of the fuel is given by
2
m n m n
2 2
nm
4O
ch,C H C H 0 0 0 nm 2CO H O
( , ) ln
+⎛ ⎞⎜ ⎟= −∆ + ⎜ ⎟⎜ ⎟⎝ ⎠
Xe G T p RT
X X
, (2.4)
where ( )
m nC H 0 0,∆G T p is the total variation of Gibbs free energy in the hydrocarbon
combustion reaction and Xi, i standing for O2, CO2 or H2O, are the mole fractions of these species in the atmospheric air. The total variation of Gibbs free energy in the hydrocarbon combustion reaction is calculated with the relation
m n 2 2
m n 2
C H 0 0 CO 0 0 H O 0 0
C H 0 0 O 0 0
n( , ) m ( , ) ( , )
2
n( , ) m ( , ) ,
4
∆ = + −
⎡ ⎤⎛ ⎞− + +⎜ ⎟⎢ ⎥⎝ ⎠⎣ ⎦
G T p g T p g T p
g T p g T p (2.5)
where ( )
2CO 0 0,g T p , ( )2H O 0 0,g T p , ( )
m nC H 0 0,g T p and ( )2O 0 0,g T p are the Gibbs free
energies of formation at environmental state (T0, p0), for CO2, H2O, CmHn and O2, respectively. Following (2.3), (2.4) and (2.5), the calculation of the chemical exergy of methane is straightforward (m = 1, n = 4). As for CO and H2, which are the primary components of syngas, relation (2.4) has to be adjusted in accordance with their stoichiometric combustion reactions (see appendix A). The Gibbs free energies of formation have been taken from [1].
The physical and chemical exergies for a mixture, such as syngas, are given by ph,mix ph,=∑ i i
i
e X e , (2.6)
ch,mix ch, 0 ln= +∑ ∑i i i i
i i
e X e RT X X , (2.7)
14 Partial oxidation gas turbine plant
where eph,mix is the physical exergy of the mixture, Xi is the mole fraction of the species i, eph,i is the physical exergy of the species i, ech,mix is the chemical exergy of the mixture and ech,i is the chemical exergy of the species i.
The total exergy of a substance/mixture is the sum of its physical and chemical exergies, total ph ch= +e e e . (2.8)
When using the exergy method for plant analysis, exergy balance equations are
solved for all the parts of the system. For a given part of the system (called the control region), the exergy balance equation reads [31, 55] in,stream in out,stream out+ = + +E W E W I . (2.9)
In the last equation, Ein,stream is the exergy of flows entering the control region, Win is the work/power consumed within the control region, Eout,stream is the exergy of flows exiting the control region, Wout is the work/power produced within the control region and I is the exergy loss (irreversibility) in the control region. In equation (2.9), the term corresponding to the heat exergy was omitted, because it is assumed that there is no heat transfer from or to the system parts. The exergy of a flow entering or exiting a control region is calculated by multiplying the exergy given by (2.8) with the corresponding flow. The exergetic efficiency for a control region, ηex, can be calculated with the relation
out ,stream outex
in,stream in in,stream in
I1
+= = −
+ +E W
ηE W E W
. (2.10)
2.3.2 Case study
For the evaluation of the exergetic efficiency of the partial oxidation gas turbine plant, a case study was performed. The case and its results are presented in the following. The partial oxidation reactor operates at a pressure pPOR = 20 bar and a temperature TPOR = 1,500 K, which are also the inlet parameters of the syngas turbine. The operating conditions were selected to match data on partial oxidation and autothermal reforming reported in literature [13, 51, 56] and to be suitable for syngas expansion in a gas turbine. The polytropic efficiencies of the gas turbine and the compressor were considered 88 % and 90 %, respectively [34]. The data on the air separation unit was taken from [16]. The natural gas was taken to consist of pure methane. The methane flow enters the plant at the required pressure. The flows and the operating conditions are shown in table 2.1. The temperatures of reactants are based on figures given in the above mentioned references [13, 51, 56]. The O2/CH4 and H2O/CH4 molar ratios were chosen to give syngas with a H2/CO molar ratio of 2, proper for synthetic Diesel production. This choice is explained by the arguments presented in the last paragraph of section 2.1. For simplifying the chemical

2.3 Exergy analysis of the partial oxidation gas turbine plant 15
calculations, the composition of the syngas was estimated at equilibrium. The code used for these calculations was EQUIL, which belongs to the CHEMKIN-II chemical kinetics package [29]. Other simplifications made are that no pressure drops and heat losses through the plant components and pipe connections were taken into account. Table 2.1. Flows and operating conditions of the case study.
Components Species Xi T (K) p (bar) CH4 0.44 730 O2 0.29 540 Reactants H2O 0.27 650 CO 0.24 H2 0.51 CO2 0.04
Products
H2O 0.21
1,500
20
2.3.3 Results
Following the POGTP lay-out presented in figure 2.1, the exergy of every flow entering and exiting the plant components have been calculated with the use of equations (2.1) − (2.8). The methane flow was taken equal to 1 kg s-1. The irreversibility within a plant component is calculated with the exergy balance equation (2.9). The calculations have been made with an in-house developed Mathcad 2000 worksheet. The thermodynamic data were taken from NIST Chemistry WebBook [39]. Detailed exergy analysis results of the POGTP are presented in appendix B. These are summarized in table 2.2. In the last column, the exergy loss corresponding to each plant component is shown. Horizontally, it can be noticed that the irreversibility within a plant component equals the difference between the exergies entering and the exergies exiting the corresponding component, following equation (2.9). In the last row, the exergy balance of the entire plant is presented. Vertically, it can be seen that the difference between the work produced by the SGT and the sum of the work consumed by the ASU and C is equal to the output work of the POGTP. Similarly, the sum of the irreversibilities of the plant component equals the irreversibility of the entire plant. By applying relation (2.10) for the whole plant, one obtains the following expression of the exergetic efficiency of the POGTP,
4 4
Syngas out,POGTPAux. Pr od. POGTPex,POGTP
CH Steam Air CH Steam Air
1+ +
= = −+ + + +
E E W IηE E E E E E
. (2.11)
Filling in the last relation the figures from the last row of table 2.2, the calculated exergetic efficiency of the plant is 82.80 %.

16 Partial oxidation gas turbine plant
Table 2.2. Results of the exergy analysis of the partial oxidation gas turbine plant.
Estreams,in Estreams,out Comp. Stream kW Stream kW
W (kW) I (kW)
SGT Syngas 48,952 Syngas 43,381 5,302 269
POR CH4 O2 Steam
52,874 544 743
Syngas 48,952 - 5,209
C O2 221 O2 500 297 18
HENG CH4 Syngas
52,357 43,381
CH4 Syngas
52,874 42,618
- 246
HEO2 O2 Syngas
500 42,618
O2 Syngas
544 42,571
- 3
M GOX LOX
157 190
O2 221 - 126
ASU Air 0.26
GOX LOX GAN LIN LAR
157 190 109 807 37
4,550 3,250
POGTP CH4 Steam Air
52,357 743 0.26
Syngas Aux. Prod.
42,571
953 455 9,121
With the use of the numbers given in table 2.2, the exergy flows and
irreversibilities of the partial oxidation gas turbine plant are represented in the Grassmann diagram from figure 2.2. Due to the very high ratio between the largest exergy flow and the smallest one, the diagram was divided in two zones. In the upper part (within the dashed line rectangle), all the exergy flows are represented eight times larger than their real values. The heat exchanger HE includes the exergy losses of both heat exchangers (HENG,
2OHE ). All the exergy flows are expressed as percentages of
the input methane exergy. The largest and most important exergy output of the plant is the syngas flow (81.30 %). Other contributions are the auxiliary products of the air separation unit (1.82 %) and the output power (0.87 %). The exergy input is primarily the methane flow (100 %) and secondary the steam flow (1.42 %). The efficiency of the POGTP, based on these figures, is 82.80 % (see also relation (2.11)).
Regarding the exergy losses, the most important irreversible loss occurs in the POR (9.96 %), followed by the ASU (6.21 %). The positive value of the output power proves the POGTP to be self-supporting.
The irreversibility in the POR is due to the conversion of chemical energy of the methane to thermal energy of the syngas. It can be reduced by increasing the temperature of the partial oxidation process. However, there are two limitations for the maximum temperature of the process. First, the temperature is controlled by the O2/CH4 molar ratio, which must not take values outside its optimal range (about 0.55 − 0.65) for a high conversion of methane to hydrogen and carbon monoxide [13, 51,

2.3 Exergy analysis of the partial oxidation gas turbine plant 17
56]. When the O2/CH4 ratio is increased, more methane is converted to H2O and CO2 and less to H2 and CO. Second, the temperature of the syngas must not exceed the turbine inlet temperature, which is limited by material constrains. Nevertheless, these material constrains can be removed by using C-C composites for the turbine blades, which can operate at temperatures above 1,500 °C [66].
Figure 2.2. Grassmann diagram of the partial oxidation gas turbine plant. For clarity, all the exergy flows within the dashed line rectangle are represented eight times larger.
About the exergy loss and the power consumption of the ASU, they can be
reduced by using an ASU especially designed for a POX process, optimized towards the production of high pressure gaseous oxygen. In most applications, the synthesis gas is needed at elevated pressures. It follows that a recompression stage should be included before the syngas exits the POGTP. In case of using an ASU with low specific work consumption (it is expected that the specific work consumption can be as low as 1.3 MJ kg oxygen-1), it can be shown that the power delivered by the SGT is sufficient to run the ASU and the syngas compressors.

18 Partial oxidation gas turbine plant
A final remark has to be made on the efficiency of using a gas turbine for syngas heat recovery. The chemical exergy of the syngas produced in the partial oxidation reactor is about 80 % of the chemical exergy of the natural gas (see table B.1, appendix B). The syngas turbine produces power equal to about 10 % of the natural gas exergy. This is utilized to drive the ASU. Hence, if air would be used instead of oxygen in the partial oxidation process, the exergetic efficiency could increase up to 90 %. The drawback is that the syngas would contain nitrogen.
2.4 Conclusions
The proposed partial oxidation process generates syngas in an integrated plant of a partial oxidation reactor, a syngas turbine and an air separation unit. The syngas is expanded in the turbine which converts the gas sensible heat to power. This is used to run the air separation unit. The exergy analysis of the plant shows that the proposed process has a high exergetic efficiency (82.8 %). The analysis also proves that the plant is self-supporting (positive net output power). The plant produces syngas with a H2/CO molar ratio of about 2, which is optimal for the FT synthesis of high quality middle distillates. In view of the conclusions presented above, the proposed process is a competitive route for the conversion of natural gas to synthetic fuel with application to monetizing stranded natural gas. When compared to conventional processes for syngas production, the partial oxidation system presented here offers the advantages of energetic autonomy and compactness at high efficiency. It should be noted that a gas turbine is about 10 – 100 times more compact than a steam boiler in a conventional POX, an ATR or a SMR unit.

Chapter 3
Simplified models for the partial oxidation reactor
Abstract
In this chapter, the effect of process parameters like residence time, pressure, equivalence ratio and type of oxidizer on the partial oxidation of natural gas in model types of reactors is analyzed. The analysis tool is the CHEMKIN chemical kinetics simulation package. The partial oxidation reactor is investigated, modeling it either as a freely propagating flame or as a perfectly stirred reactor. The freely propagating flame gives information about the propagation properties of rich flames as occurring in the partial oxidation process. A correlation function of the laminar flame speed with the adiabatic flame temperature for rich mixtures is established. The perfectly stirred reactor (PSR) shows the limits of improving natural gas conversion by enhancing the mixing of initial mixture with products. Both the laminar flame and the PSR calculations indicate that the residence time necessary to approach equilibrium in ultra rich mixtures, for best conversion of natural gas to hydrogen and carbon monoxide, is very long, in excess of 1,000 ms.
3.1 Introduction
In chapter 2, the integration of a partial oxidation reactor and a gas turbine was investigated by means of an exergy analysis. The composition of the syngas was estimated at equilibrium. This was an appropriate estimation for the evaluation of the exergetic efficiency of the integrated plant. In reality, it is a challenge for the designer to achieve this reactor performance. The actual chemical performance of the partial oxidation reactor is important for three reasons. First, the reactor design and operating conditions has to ensure a high conversion of natural gas to products (hydrogen and carbon monoxide). Second, the hydrogen to carbon monoxide ratio in the syngas is relevant for the downstream application of the syngas produced. For example, a syngas suitable for synthetic fuel production by Fisher-Tropsch process has the hydrogen to carbon monoxide molar ratio of 2 [9]. Third, the syngas has to be free of carbon particles (or to contain a minimum amount of soot), in view of syngas expansion in a gas turbine for heat recovery and to minimize the downstream soot removal effort. In the present chapter, the partial oxidation process inside the reactor is investigated. In doing that, simplified models for the partial oxidation reactor are applied and CHEMKIN-II codes are used. Later, in chapter 4, an in-house developed

20 Simplified models for the partial oxidation reactor
turbulent rich combustion model for the simulation of the detailed three-dimensional chemically reacting flow conditions in the partial oxidation reactor will be presented.
The partial oxidation process is simulated here in a freely propagating flame and in a perfectly stirred reactor. The freely propagating flame configuration gives information about the propagation properties of rich flames, as those produced by partial oxidation, with respect to stoichiometric flames. The PSR configuration corresponds to the perfect mixing between reactants and products. This case shows the limits of improving natural gas conversion by enhancing the mixing inside the partial oxidation reactor. The simulations have been performed with the CHEMKIN-II chemical kinetics simulation codes PREMIX, PSR and EQUIL [29]. The chemistry is described by the detailed reaction mechanism GRI-Mech 3.0 [7]. It consists of 325 reactions and 53 species and it was optimized for the conditions presented in table 3.1. Table 3.1. Optimization conditions for the reaction mechanism GRI-Mech 3.0.
Parameter Value Temperature (K) 1,000 − 2,500 Pressure (Pa) 150 − 106 Fuel equivalence ratio 0.1 − 5
It can be noticed that the rich mixtures which correspond to partial oxidation
processes (equivalence ratio of 3 – 4) fall within the equivalence ratio range for which the mechanism GRI-Mech 3.0 was optimized. The choice of GRI-Mech for simulating the combustion of rich mixtures is also supported by results obtained with this mechanism by other investigators [46]. In [46], laminar CH4/O2/Ar flames at equivalence ratios between 0.92 and 1.94 and low pressure (20 − 60 Torr) have been simulated using the PREMIX code. Eight reaction mechanisms have been tested. GRI-Mech was one of the three which gave the best agreement with the experiments.
In the partial oxidation process natural gas is converted to syngas with the use of an oxidizer. This oxidizer depends on the subsequent utilization of the syngas. When nitrogen is not desired in the syngas (e.g., for the production of synthetic Diesel or methanol), the oxidizer is pure oxygen. When syngas is used for the production of ammonia, the oxidizer is air or oxygen enriched air. The natural gas, on the other hand, has different compositions, depending on its origin. Therefore, two types of mixtures were considered for the present investigation. One of them consists of pure methane (CH4) and pure oxygen (O2) and the other consists of natural gas and oxygen enriched air. The natural gas (NG) has 85 % vol. CH4 and 15 % vol. N2. This composition was chosen to give the same lower heating value (LHV) as the Groningen natural gas [21]. The oxygen enriched air is a mixture of nitrogen and oxygen with a mole fraction of oxygen higher than that of air. Hereafter it is abbreviated as NITROX and contains 40 % vol. O2 and 60 % vol. N2.
In the following sections the simulations performed with the PREMIX, PSR and EQUIL codes are described. The analyzed parameters are residence time, pressure, equivalence ratio and type of oxidizer. The numerical investigation is used to determine the effect of the variation of these process parameters on syngas composition and temperature.

3.2 PREMIX simulations 21
3.2 PREMIX simulations 3.2.1 Methane flammability limits
Prior to simulating the partial oxidation process, the flammability limits of mixtures of CH4 with different oxidizers have been examined. The effects of temperature and pressure on the upper flammability limit (UFL) of CH4/O2 and CH4/Air mixtures were reported in [15] and [58], respectively. Based on the data from these two references, a chart was drawn in figure 3.1.
In [15] and [58], the UFL is expressed as mole fractions of CH4 in the mixtures. For the present investigation, fuel equivalence ratios corresponding to the flammability limits were calculated from the CH4 mole fractions. In figure 3.1, the resulted equivalence ratios are plotted against pressure, for two initial temperatures, 293 K and 473 K and two types of mixtures, CH4/O2 and CH4/Air. These equivalence ratios are denoted by φUFL. Figure 3.1 shows that, for both types of mixtures, the UFL increases with the pressure and initial temperature. Examining the numbers presented in figure 3.1 for CH4/Air mixtures with an initial temperature of 473 K, the φUFL almost triples from a value of 2 at 1 bar to 5.5 at 20 bar. As expected, for the same initial temperature, CH4/O2 mixtures show higher values of the φUFL, which increases from 4.5 at 1 bar (extrapolated value) to 8 at 20 bar. Regarding the NG/NITROX mixtures, the flammability limits are expected to be between those of CH4/O2 and CH4/Air mixtures. In the next section, results of freely propagating flames simulations at a pressure of 6 bar and an initial temperature of 673 K are presented. The values of the φUFL at 6 bar and 473 K are 3 for CH4/Air mixtures and 5 for CH4/O2 mixtures. The latter value was approximated by extrapolation of the experimental curve. Assuming a further increase of the φUFL when increasing the initial temperature from 473 K to 673 K, it can be concluded that all the mixtures to be investigated, CH4/O2, NG/NITROX and CH4/Air, with equivalence ratios between 1 and 4, are between the flammability limits. In figure 3.1, two operation points have been also plotted. They correspond to a NG/NITROX mixture with an equivalence ratio (φ) of 3.1, at a pressure (p) of 6 bar and an initial temperature (Tin) of 673 K (solid rhombus) and a CH4/O2 mixture with φ = 4 at p = 20 bar and Tin = 673 K (solid circle). The partial oxidation of these two mixtures will be simulated with the in-house developed combustion model in chapter 6. The point representing the NG/NITROX mixture is between the φUFL lines for CH4/Air and CH4/O2 mixtures at Tin = 473 K, very close to the former. Considering the increase of φUFL with Tin from 473 to 673, the operating point is within the flammability limits. As for the point representing the CH4/O2 mixture, it is already below the φUFL line for CH4/O2 mixtures at Tin = 473 K, so it will be inside the flammability limits at a higher initial temperature (Tin = 673 K).

22 Simplified models for the partial oxidation reactor
1
3
5
7
9
11
13
0 10 20 30 40 50p (bar)
φU
FL Extrapolated
Operation (673 K)
Figure 3.1. Dependence on pressure and temperature of methane upper flammability limits for CH4/O2 (solid lines) and CH4/Air (dashed lines) mixtures [15, 58]. Transparent symbols indicate the initial temperature: 293 K (triangles) and 473 K (squares). Solid symbols represent the operation points: NG/NITROX mixture, φ = 3.1, p = 6 bar, Tin = 673 K (rhombus) and CH4/O2 mixture, φ = 4, p = 20 bar, Tin = 673 K (circle). 3.2.2 Freely propagating flames
The propagation properties of rich flames, as those obtained by partial oxidation, have been studied by simulating freely propagation flames with the code PREMIX. This code is described in the appendix C. Three types of mixtures have been simulated: CH4/O2, NG/NITROX and CH4/Air. The equivalence ratio was varied from 1 to 4. The equivalence ratio of 1 corresponds to the stoichiometric combustion of CH4. The equivalence ratio of 4 corresponds to the partial oxidation of CH4, as described by reaction (1.3), section 1.2. The pressure and the initial temperature used for the simulations were 6 bar and 673 K, respectively. These conditions were chosen to match the foreseen experiments at University of Twente [32]. Figures 3.2a and 3.2b present the laminar flame speed (sL) and the adiabatic flame temperature (Tad), respectively, for all flames simulated, as functions of the fuel equivalence ratio, denoted by φ.

3.2 PREMIX simulations 23
1
10
100
1,000
1 1.5 2 2.5 3 3.5 4φ
sL (
cm s
-1)
(a)
1,400
1,800
2,200
2,600
3,000
3,400
1 1.5 2 2.5 3 3.5 4φ
Tad
(K
)
(b)
Figure 3.2. Laminar flame speed (a) and adiabatic flame temperature (b) of rich CH4/O2 (solid line), NG/NITROX (dashed line) and CH4/Air (dotted line) mixtures, as a function of equivalence ratio. Operating conditions: p = 6 bar, Tin = 673 K. A logarithmic scale was used for the laminar flame speed sL. It can be noticed that both sL and Tad decrease with increasing φ for all types of mixtures. The flame speed and temperature also decrease with the increase of the nitrogen content of the mixture. Thus, in figure 3.2a, the flame speed for the CH4/O2 systems show values of about 20 to 800 cm s-1 while the CH4/Air systems have the flame speed in the range 5 to 100 cm s-1. NG/NITROX systems are characterized by values of the flame speed in between, in the range 10 to 300 cm s-1. As a reference (see [60], page 118), a stoichiometric CH4/Air mixture has a laminar flame speed of

24 Simplified models for the partial oxidation reactor
about 40 cm s-1 at ambient conditions of pressure and initial temperature. Looking at the values presented in figure 3.2b, the flame temperature is in the range 1,700 – 3,300 K for CH4/O2 mixtures, 1,600 – 2,900 K for NG/NITROX mixtures and 1,500 – 2,400 K for CH4/Air mixtures. Based on the data presented in figures 3.2a and 3.2b, the laminar flame speed was plotted on a logarithmic scale against the inverse of the adiabatic flame temperature, in figure 3.3. For each type of mixture, an Arrhenius type function was fitted for the calculated points. The general relation between sL and Tad has the expression
a
adL Le
−=
E
2RTs A . (3.1) In equation (3.1), AL is a pre-exponential factor of the laminar flame speed, Ea is an activation energy and R is the universal gas constant. This activation energy corresponds to a global reaction which describes the conversion of reactants to products in the partial oxidation process. The dependence of sL on Tad in the form of the Arrhenius function given by equation (3.1) is similar with that delivered by the Zeldovich’s analysis for the stoichiometric combustion of CH4, as reported in [60], pages 118 – 119. However, in reference [60], a pre-exponential factor which is a function of pressure is also present. In addition, the adiabatic flame temperature was varied by changing the initial temperature of the mixture. In the present work, equation (3.1) was calculated for a pressure of 6 bar and a initial temperature of 673 K. The influence of pressure was not investigated. The ratio Ea/R has the unit K and is therefore called the activation temperature, denoted by Ta. The activation temperatures divided by 2 (see equation (3.1)) are given by the slopes of the fitting lines plotted in figure 3.3. The pre-exponential factors and the activation temperatures are presented in table 3.2. Examining the figures reported in table 3.2, it can be noticed that the activation temperatures have similar values (around Ta = 20,000 K), which is confirmed by the resemblance of the slopes of the lines shown in figure 3.3. As for the pre-exponential factors, the lowest corresponds to the CH4/Air mixtures (AL = 4,369.5 cm s-1) and it is roughly double for NG/NITROX systems and triple for CH4/O2 mixtures. Inspecting the fitting curves in figure 3.3, they overlap very well with the calculated points for ultra rich mixtures with equivalence ratio in the range 2.5 – 4. For less rich mixtures, the accuracy of the approximation of the simulated data decreases with decreasing equivalence ratio. The explanation is the significant change of the chemical kinetics due to the fact that the combustion of ultra rich mixtures (partial oxidation) produces mainly H2 and CO as opposed to the stoichiometric combustion which leads to the products H2O and CO2. The fitting of the data is also less exact for CH4/O2 mixtures than for NG/NITROX and CH4/Air mixtures. This is caused by the much larger temperature range spanned by the CH4/O2 mixtures compared to the NG/NITROX and CH4/Air mixtures.

3.2 PREMIX simulations 25
1
10
100
1,000
2 4 6 8104/T ad (K
-1)
sL (
cm s
-1)
Figure 3.3. Laminar flame speed as a function of adiabatic flame temperature for rich CH4/O2 (square symbols, solid trendline), NG/NITROX (triangle symbols, dashed trendline) and CH4/Air (rhombus symbols, dotted trendline) mixtures. Operating conditions: p = 6 bar, Tin = 673 K. Table 3.2. Activation temperatures and pre-exponential factors for the Arrhenius type laminar flame speed – adiabatic flame temperature correlations.
Mixture Ta (K) AL (cm s-1) CH4/O2 20,668.0 13,210.0 NG/NITROX 20,406.0 8,015.5 CH4/Air 19,727.6 4,369.5
To get some insight on the structure of rich flames, a NG/NITROX flame with equivalence ratio 3.1 was used for analysis. The mole fractions of the main species and the temperature are plotted versus residence time in figure 3.4. Residence times were found by integrating the predicted gas velocities. The flame presents an initial, narrow flame front, with fast reactions, the main products being H2, H2O and CO. Inside this region all the oxygen is consumed while unconverted methane is still present in a post flame zone. This post flame zone is characterized by slow endothermic reforming reactions of CH4 with H2O. As a result, the temperature and H2O and CH4 mole fractions decrease and H2 and CO mole fractions increase. Also present in figure 3.4 are the mole fractions of carbon dioxide and acetylene. The carbon dioxide formed in the initial fast reaction zone remains practically constant in the post flame zone. This shows that the reactions in which CO2 takes place are too slow to produce any change of its concentration for the residence time investigated (50 ms). As for C2H2, this is produced in the initial part of the flame and then its mole fraction decreases slowly in the post flame zone. The values of the mole fractions of H2, CO and C2H2 for the residence time of 50 ms are going to be compared with those

26 Simplified models for the partial oxidation reactor
given by PSR simulations in figure 3.5a, section 3.3.1. The flame structure of the rich flame discussed here is in contrast with that of stoichiometric and lean flames, for which the post flame zone is in equilibrium.
0
0.1
0.2
0.3
0.4
0 10 20 30 40 50τ (ms)
Xi
400
800
1,200
1,600
2,000
T (
K)
Figure 3.4. Structure of a rich NG/NITROX flame: temperature (solid line, no symbol) and mole fractions of H2 (grey squares), CO (grey triangles), CH4 (grey rhombuses), H2O (transparent squares), CO2 (transparent triangles), O2 (transparent rhombuses) and C2H2 (transparent circles). Operating conditions: φ = 3.1, p = 6 bar, Tin = 673 K.
3.3 PSR simulations
A number of simulations have been performed with the PSR code for the partial oxidation process. The code is presented in appendix C. Three operating pressures, three residence times, two mixtures and equivalence ratios between 1 and 4 were investigated. They are shown in table 3.3. As far as the pressure is concerned, usually the partial oxidation process runs at pressures above 20 bar. The 1 and 6 bar pressures are included for the study of the pressure effect on the partial oxidation process and for comparison with planned experiments at University of Twente [32]. Regarding the residence time, 50 ms corresponds to the conditions of the intended experiments already mentioned, 1,000 ms is in the range of residence times reported in the literature dedicated to the partial oxidation process [45] and an infinite residence time is the limit reached at equilibrium. For each case studied, the equilibrium was determined with the code EQUIL. In the next two sections, the results of the PSR computations are analyzed.

3.3 PSR simulations 27
Table 3.3. Case studies for PSR simulations.
Mixture CH4/O2
NG/NITROX
Pressure, p (bar) 1 6
20
Residence time, τ (ms) 50
1,000 ∞ (equilibrium)
Equivalence ratio, φ 1 – 4 3.3.1 Residence time effect In this section the main parameter under investigation is the residence time in the reactor. Simulations have been performed for the residence times, mixtures and equivalence ratios presented in table 3.3. The pressure was equal to 20 bar for the CH4/O2 mixtures and 6 bar for the NG/NITROX mixtures. The 20 bar pressure was selected for the CH4/O2 mixtures to match the operating conditions most commonly used for partial oxidation processes. The 6 bar pressure was chosen for the NG/NITROX mixtures to simulate the planned experimental conditions. The initial temperature was 673 K for all simulations, in accordance with data reported in the literature and the intended experiments at our university. Based on the calculated moles of H2, CO, C2H2 and CH4, two ratios have been defined as
2
2
4
out outH CO
H CO inCH
+
+=
N Nn
N, 2 2
2 2
4
outC H
C H inCH
=N
nN
(3.2)
where
2H CO+n and 2 2C Hn are the normalized moles of H2 + CO (
2
out outH CO+N N ) and C2H2
(2 2
outC HN ) produced, through the moles of CH4 introduced (
4
inCHN ), respectively. Figures
3.5a and 3.5b present the ratios 2H CO+n and
2 2C Hn as functions of the equivalence ratio
φ, for rich mixtures of NG/NITROX and CH4/O2, respectively. Given that H2 and CO are the desired products of the partial oxidation process, the values of the ratio
2H CO+n
show the conversion efficiency of CH4 to syngas. Considering C2H2 as the soot precursor, the values of the ratio
2 2C Hn indicate the likelihood of soot formation.
Figure 3.5a illustrates that the residence time plays a role only for NG/NITROX mixtures with an equivalence ratio higher than 2. For lower equivalence ratios, the temperature is high enough to drive the chemical systems to equilibrium in a time shorter than 50 ms. As a result, the normalized moles
2H CO+n and 2 2C Hn , corresponding
to the residence times of 50 ms and 1,000 ms, overlap their equilibrium values. It can be also seen that C2H2 is an intermediate species, which is present in the products only

28 Simplified models for the partial oxidation reactor
under non-equilibrium conditions. A similar behavior can be observed in figure 3.5b for CH4/O2 mixtures with the only difference that the equivalence ratio from which the residence time has influence on
2H CO+n and 2 2C Hn is 2.5 as opposed to 2 for
NG/NITROX systems. This can be explained by the fact that NG/NITROX mixtures have lower products temperatures than CH4/O2 mixtures, for the same equivalence ratio, due to the dilution with N2 (see also figure 3.2b). It follows that NG/NITROX systems, as opposed to CH4/O2 mixtures, are not in equilibrium for φ values of 2 − 2.5. For equivalence ratios in the range 2 − 4 for NG/NITROX mixtures and 2.5 − 4 for CH4/O2 mixtures, it is shown that, as expected,
2H CO+n increases while 2 2C Hn decreases
with increasing the residence time from 50 ms to ∞ (equilibrium). Further inspection of
2H CO+n curves reveals a decrease of the moles with increasing equivalence ratio,
which takes place from a threshold value of the equivalence ratio on. This threshold value is about 2.5 for NG/NITROX mixtures and 3 for CH4/O2 mixtures, at a residence time of 1,000 ms. It is slightly lower for the residence time of 50 ms. Thus, for NG/NITROX mixtures and a residence time of 1,000 ms,
2H CO+n decreases from
the peak value of 2.24 at φ = 2.5 to 1.15 at φ = 4. As for CH4/O2 mixtures and the same residence time,
2H CO+n shows the maximum value of 2.42 at φ = 3 and than
decrease to 1.56 at φ = 4. Based on the fact that the partial oxidation of CH4, as described by reaction (1.3), section 1.2, corresponds to an equivalence ratio of 4, the decrease of
2H CO+n when increasing the equivalence ratio appears unexpected. The
explanation comes from the chemical kinetics of rich mixture combustion: for richer mixtures, the chemical reactions are slower. It follows that, increasing the equivalence ratio at a constant residence time, the conversion of CH4 to H2 and CO decreases. Another aspect which deserves consideration is the decrease of
2H CO+n at
equilibrium when increasing the equivalence ratio from 3.5 to 4, as pointed out in figures 3.5a and 3.5b. If the only species taken into consideration when calculating the chemical equilibrium were CH4, O2, H2 and CO, according to the partial oxidation global reaction (1.3), the equilibrium value of
2H CO+n would have increased
monotonically from equivalence ratio 1 to 4. In the present investigation, however, all 53 species present in the detailed reaction mechanism GRI-Mech 3.0 have been included. This way, the equilibrium was slightly changed, resulting in the observed pattern of the equilibrium curves. In order to compare PSR and freely propagating flame configurations, the values of
2H CO+n and 2 2C Hn corresponding to the rich flame presented in figure 3.4, section
3.3.2 (NG/NITROX mixture, φ = 4, p = 6 bar, Tin = 673 K) have been also depicted in figure 3.5a. It can be noticed that the values calculated for the freely propagating flame at a residence time of 50 ms are close to but slightly higher than those shown by the 50 ms curve of PSR simulations.

3.3 PSR simulations 29
0
0.5
1
1.5
2
2.5
3
1 1.5 2 2.5 3 3.5 4
φ
nH
2+C
O
0
0.1
0.2
0.3
0.4
nC
2H2
PREMIX (50 ms)
(a)
0
0.5
1
1.5
2
2.5
3
1 1.5 2 2.5 3 3.5 4
φ
nH
2+C
O
0
0.1
0.2
0.3
0.4
nC
2H2
(b)
Figure 3.5. Effect of residence time on the partial oxidation process for NG/NITROX mixtures at p = 6 bar and Tin = 673 K (a) and CH4/O2 mixtures at p = 20 bar and Tin = 673 K (b). Square symbols H2 + CO, rhombus symbols C2H2. Solid lines equilibrium, dashed lines 1,000 ms, dotted lines 50 ms. In (a), the values corresponding to the NG/NITROX flame shown in figure 3.4, section 3.3.2, are also plotted. 3.3.2 Pressure effect
In the present section, the parameter analyzed is the pressure inside the reactor. A number of cases have been simulated using the pressures, mixtures and equivalence

30 Simplified models for the partial oxidation reactor
ratios presented in table 3.3. Two residence times have been considered: ∞ (equilibrium) and 50 ms. The initial temperature was 673 K. The same two ratios defined in section 3.3.1 (
2H CO+n and 2 2C Hn ) have been used for the study of the
pressure effect on the partial oxidation process. In figure 3.6a, 2H CO+n is plotted
against the equivalence ratio, for NG/NITROX mixtures, at equilibrium. In figure 3.6b, besides
2H CO+n , 2 2C Hn is also given, for the same mixtures, but at a residence
time of 50 ms. 2 2C Hn was not plotted in figure 3.6a because C2H2 is not present in the
mixtures at equilibrium, as observed in figure 3.5a, section 3.3.1. Figure 3.6a shows that the equilibrium values of
2H CO+n are influenced by pressure differently in various
ranges of equivalence ratio. Thus, the curves indicate a decrease of 2H CO+n with
pressure for φ = 1 − 1.5 and φ = 3 − 4. In the rest of the equivalence ratio range, the curves corresponding to 1, 6 and 20 bar overlap each other. In the following, only the range φ = 3 − 4 will be discussed, as this is most relevant for partial oxidation processes. Thus, figure 3.6a indicates that
2H CO+n decreases when increasing the
pressure from 1 to 20 bar and that the difference between the values of 2H CO+n related
to different pressures increase with increasing equivalence ratio. This confirms results reported also by other investigators [43, 44]. It should be noted that the range of equivalence ratio φ = 3 − 4 corresponds to equilibrium temperatures of NG/NITROX mixtures of 1,460 − 1,050 K, similar to those investigated in [43, 44]. Examining the curves plotted in figure 3.6b, two zones can be distinguished (see also figure 3.5a, section 3.3.1) an equilibrium zone, for φ = 1 − 2 and a non-equilibrium zone, for φ = 2 − 4. For the reason already given in connection with figure 3.6a, the values of
2H CO+n
will be commented only for the range φ = 3 − 4. Comparing figures 3.6b and 3.6a, it can be noticed that, in figure 3.6b,
2H CO+n increases with pressure at τ = 50 ms, as
opposed to figure 3.6a, where 2H CO+n decreases with pressure at equilibrium. The
increase of 2H CO+n with pressure observed in figure 3.6b shows that the chemical
kinetics data used for the simulations favors the H2 and CO production at elevated pressures, for the residence time investigated (τ = 50 ms). As far as C2H2 is concerned, the value of
2 2C Hn is 0 under equilibrium conditions (φ = 1 − 2) and decreases when
increasing the pressure in the non-equilibrium region (φ = 2 − 4). Given that C2H2 is considered the soot precursor, the latter result indicates that more soot is likely to form at lower pressures. This is in accordance with reference [13], where it is stated that, in autothermal reforming (ATR), low pressures (< 12 bar) may not be applied due to soot formation.

3.3 PSR simulations 31
0
0.5
1
1.5
2
2.5
3
1 1.5 2 2.5 3 3.5 4
φ
nH
2+C
O
(a)
0
0.5
1
1.5
2
2.5
1 1.5 2 2.5 3 3.5 4
φ
nH
2+C
O
0
0.1
0.2
0.3
0.4
nC
2H2
(b)
Figure 3.6. Effect of pressure on the partial oxidation process for NG/NITROX mixtures at equilibrium and Tin = 673 K (a) and at τ = 50 ms and Tin = 673 K (b). Solid lines 20 bar, dashed lines 6 bar, dotted lines 1 bar. Square symbols H2 + CO, rhombus symbols C2H2. However, many other references report an increase of the soot volume fraction with pressure following the relation
m
S pf ~ . (3.3)

32 Simplified models for the partial oxidation reactor
In equation (3.3), 1 ≤ m ≤ 2 for laminar rich premixed C2H4/Air flames and various laminar and turbulent diffusion flames [19] and m = 3 for laminar CH4/Air non-premixed flame at pressures lower than 30 bar [52]. In chapter 5, a model for soot formation in turbulent rich premixed flames will be given. Although the effect of pressure on soot formation is not investigated, a predicted soot volume fraction increase with pressure as ∼ p3 can be anticipated (for explanation, see section 5.2.5, last paragraph). Similar results with those shown in figures 3.6a and b for NG/NITROX mixtures have been also obtained for CH4/O2 mixtures. This is why the latter results have not been represented. The conclusion is that the conversion efficiency of the partial oxidation process, given by
2H CO+n , decreases with pressure, provided that chemical
equilibrium is reached. For non-equilibrium conditions, however, it was found that the conversion efficiency in the partial oxidation process increases with pressure. As for C2H2, considered the soot precursor, it was shown that C2H2 is not present in partial oxidation mixtures at equilibrium and that the production of C2H2 in non-equilibrium conditions decreases with pressure.
3.4 Conclusions
The partial oxidation process of natural gas has been simulated in freely propagating flames and perfectly stirred reactors. Different types of mixtures and operating conditions have been numerically investigated. The results of the simulations are summarized in the following.
All types of mixtures - CH4/O2, NG/NITROX and CH4/Air - with equivalence ratios between 1 and 4 are between the flammability limits at pressures greater than or equal to 6 bar and an initial temperature of 673 K.
Ultra rich NG/NITROX mixtures at a pressure of 6 bar and with an initial temperature of 673 K have laminar flame speeds in the range 10 – 300 cm s-1.
For all rich mixtures investigated, the laminar flame speed is a function of the adiabatic flame temperature following an Arrhenius type expression. The activation temperature is about 20,000 K and has a minor dependence on the type of the mixture. The pre-exponential coefficient is a strong function of the type of the mixture. The expressions found are best fitted to ultra rich mixtures, with equivalence ratios in the range 2.5 – 4. The post flame zone of ultra rich flames is dominated by slow endothermic reforming reactions of CH4 with H2O. This is in contrast with stoichiometric flames, for which the post flame zone is in equilibrium.
The PSR calculations show that, for NG/NITROX mixtures with equivalence ratios from 1 to 2 and CH4/O2 mixtures with equivalence ratios in the range 1 – 2.5, the products of the CH4 combustion/partial oxidation are in equilibrium. For ultra rich mixtures (equivalence ratio of 2 – 4 for NG/NITROX and 2.5 – 4 for CH4/O2), the conversion efficiency of the partial oxidation process increases with increasing residence time and decreases with the equivalence ratio, for practical residence times

3.4 Conclusions 33
(50 − 1,000 ms). The latter effect manifests itself at lower equivalence ratios for the NG/NITROX mixtures than for CH4/O2 mixtures.
The PSR results also indicate that the residence time necessary to approach equilibrium in ultra rich mixtures, for best conversion of CH4 to H2 and CO, is very long, in excess of 1,000 ms. Another conclusion related to equilibrium mole fractions of H2 and CO is that the maximum production of these products is achieved at an equivalence ratio of 3.5.
Regarding the pressure influence on the partial oxidation process, the conclusion is that, the conversion efficiency of CH4 to H2 and CO decreases with pressure, provided that chemical equilibrium is reached. For non-equilibrium conditions, however, it was found that the conversion efficiency in the partial oxidation process increases with pressure. As for C2H2, considered the soot precursor, it was shown that C2H2 is not present in partial oxidation mixtures at equilibrium and that the production of C2H2 in non-equilibrium conditions decreases with pressure.

34 Simplified models for the partial oxidation reactor

Chapter 4
A model for turbulent rich combustion applied on the partial oxidation of natural gas
Abstract
In chapter 3, the partial oxidation process was simulated with simplified models (the freely propagating flame and the perfectly stirred reactor) using CHEMKIN-II codes. These simplified models provided information on the structure of rich flames as obtained in the partial oxidation process. They showed the effect of different parameters (pressure, residence time, equivalence ratio, type of mixture) on the syngas composition. This data is used to model the partial oxidation reactor for the actual operating conditions. Thus, in the current chapter, an in-house developed combustion model for the CFD investigation of the partial oxidation process is presented. The partial oxidation of natural gas is simulated as a turbulent rich premixed combustion process. The model is structured in two parts. The gas phase model predicts the gaseous chemical species and temperature. The soot model quantifies the soot formation in the turbulent rich flame. The link between the two parts is the concentration of acetylene, which is the soot precursor. The model is implemented in the CFX-5 flow solver.
4.1 Introduction
The main topic of the thesis is the development of a CFD tool which can be used for the optimization of the partial oxidation reactor design. The optimization issues for a partial oxidation process are a high conversion of natural gas to hydrogen and carbon monoxide and a low soot production.
As already mentioned in section 1.1, the partial oxidation of natural gas is modeled as a turbulent rich premixed combustion process. The turbulent flow insures the high power density for the gas turbine application. The partial oxidation is a rich combustion because of the high fuel equivalence ratio (equal to 4, as given by reaction (1.3), section 1.2). The flow is premixed to achieve a homogeneous mixture inside the reactor, considered beneficial for the conversion efficiency of natural gas to syngas.
The numerical investigation of this process is carried out by modification and application of well developed methods of combustion modeling. The resulting structure of the model is given in section 4.2. For the description of the gaseous

36 A model for turbulent rich combustion applied on the partial oxidation
reactions, a detailed reaction mechanism mapped on a reaction progress variable is used. This is presented in section 4.3. The soot formation is modeled by the empirical processes of nucleation, surface growth, agglomeration and oxidation, as shown in chapter 5. The numerical model predicts the flow field, gaseous species (especially H2, CO and C2H2), temperature and soot (mass fraction and number of particles). The model is presented in the following sections.
The use of CFD for the development and analysis of burners utilized in the production of syngas has been reported in [12]. In [12] the application was the autothermal reforming process (for process description, see section 1.2). The flow was non-premixed and the combustion was modeled with the mixed-is-burned model. Flow patterns and temperature distributions have been obtained. However, the mixed-is-burned combustion model uses the infinitely fast reaction assumption and therefore does not provide any specific information on the chemical system. In the present study, a turbulent rich combustion model is developed for the partial oxidation of natural gas. This model predicts chemical species concentrations and soot formation using a reaction progress variable (RPV) approach coupled with a detailed description of the chemical system.
4.2 Structure of the combustion model
A reaction progress variable combustion model has been developed for the CFD investigation of the partial oxidation of natural gas. The partial oxidation is simulated as a turbulent rich premixed combustion process. The model is structured in two parts. The gas phase model predicts the gaseous chemical species and temperature. The soot model quantifies the soot formation in the turbulent rich flame. The link between the two parts is the concentration of acetylene, which is the soot precursor. The combustion model solves transport equations for four scalar variables: r, i, YS and NS. r is the RPV of hydrogen and describes the advance of the gaseous chemical reactions by monitoring the hydrogen production. i is the enthalpy loss variable and evaluates the heat loss due to soot radiation. YS and NS are the soot mass fraction and the soot particle number density, respectively, and describe the formation of soot. The gaseous species mass fractions and the temperature are tabulated as functions of r and i in a thermo-chemical database. The model works as follows. The gas phase module solves the transport equations for r and i. Based on their values, the acetylene mass fraction and temperature are taken from the database and provided to the soot module. This in turn solves the transport equations for YS and NS and supplies the soot mass fraction to the gas phase module for the calculation of the radiation source term of i. Inside the gas phase module, the values of r and i are used to get from the database the source terms of r, needed for the integration of the transport equation of r. The structure of the combustion model, as described above, is given in figure 4.1. The model is implemented in the CFX-5 flow solver [10] with the standard k-ε turbulence model. In section 4.3, the gas phase model is presented in detail. The soot model is described in chapter 5.

4.3 Gas phase model 37
Figure 4.1. Structure of the combustion model.
4.3 Gas phase model
The chemistry is described by the detailed reaction mechanism GRI-Mech 3.0, which was also used for the CHEMKIN simulations reported in chapter 3. The optimization conditions for this mechanism have been given in table 3.1, section 3.1. It was noticed that the rich mixtures which correspond to partial oxidation processes (equivalence ratio of 3 – 4) fall within the equivalence ratio range for which GRI-Mech 3.0 was optimized (0.1 – 5). For a combustion simulation with the GRI-Mech 3.0 mechanism, 53 chemical species transport equations and the enthalpy equation must be solved. In laminar flows it is possible to solve this system. Under turbulent conditions to solve the flow field and the transport equations for such a large number of independent variables is computationally prohibitive. That is why the number of independent variables which describe the turbulence-chemistry interactions has to be minimized. In the present model, the reduction of the variables set is achieved by mapping of the gaseous chemical system on two combustion scalars, r and i. Reaction progress variable models similar to that described in the present paper have been previously used with good results by other investigators for hydrogen flames [25], syngas flames [17, 40] and methane lean flames [33]. 4.3.1 Enthalpy loss variable
As mentioned in section 4.1, partial oxidation is a rich combustion process. Due to the lack of oxidizer to complete the combustion, rich combustion is accompanied by soot formation. In sooting flames, soot is the primary source of heat loss by radiation. To account for this effect, an enthalpy variable was introduced, denoted i. This is defined as the enthalpy loss normalized through the adiabatic enthalpy value and takes

38 A model for turbulent rich combustion applied on the partial oxidation
the value 0 for the adiabatic case and positive values for non-adiabatic situations. The definition relation is
ad
ad
−= h hi
h, (4.1)
where h is the instantaneous local enthalpy and had is the adiabatic enthalpy, which equals the enthalpy of the initial mixture. In appendix D, a general turbulent scalar convection-diffusion equation (Favre-averaged) for chemical species and enthalpy was derived, equation (D.42). Substituting definition (4.1) in equation (D.42), the turbulent transport equation for the enthalpy loss variable reads ( ) ( ),eff∇ ⋅ − ∇ ⋅ ∇ =i iρ i Γ i S% %%u , (4.2)
where ρ is the density, u is the velocity vector, Γi,eff is the effective diffusion coefficient of i and Si is the heat loss due to radiation of soot. The expression of Γi,eff is
T,eff
,T
= +i i
i
µΓ ρDSc
, (4.3)
where Di is the molecular diffusion coefficient of i and µT and ScT are the turbulent viscosity and the turbulent Schmidt number, respectively, discussed in section D.3. The heat loss Si is given by
( )5 5S,rad S wall
ad
4 −= −i
C σf T TS
h. (4.4)
In equation (4.4), CS,rad = 1.307⋅103 m-1 K-1 is a soot radiation constant [28], σ = 5.6704⋅10-8 W m-2 K-4 is the Stefan-Boltzmann constant, fS is the soot volume fraction (see equation 5.21, section 5.2.5), T is the soot temperature and Twall = 1,600 K is the reactor wall temperature. The temperature appears at power 5 (and not 4, as given by the Stefan-Boltzmann law of radiation) because the Plank mean absorption coefficient of soot KS used in equation (4.4) has the expression S S,rad S=K C f T , (4.5)
similar to that given in [61]. Furthermore, it was assumed that the wall radiates with spectral properties identical to those of soot particles. It should be noted that in [67] the optically thin assumption was employed as opposed to [61], where the participating media was thought as optically thick. In spite of the different assumptions made, the soot radiation was modeled in both works the same, in the form of the numerator of relation (4.4). Analogous expressions of soot radiation source term were used also in [8, 36]. The high value of Twall is justified by the fact

4.3 Gas phase model 39
that the partial oxidation reactor wall is lined with a thermally insulating ceramic material to insure the high temperatures needed by the partial oxidation process.
The calculation of the averaged source term iS , from equation (4.2), is described in the next section. 4.3.2 Reaction progress variable
The advance of the gaseous chemical reactions is followed by a reaction progress variable. For an accurate description of the chemical system, the RPV must be a monotonic function of species concentrations. Hence, the species selected for the RPV construction was H2, which is a product with a monotonic variation throughout the flame. This variable is denoted by r and represents the normalized mass fraction of H2. It takes values between 0 in the initial mixture and 1 in the gas at equilibrium. The definition relation is
2 2
2 2
inH H
eq inH H
−=
−Y Y
rY Y
, (4.6)
where
2HY is the mass fraction of H2 and 2
inHY and
2
eqHY are the mass fractions of H2 at
inlet conditions (initial mixture) and at equilibrium conditions, respectively. By introducing a function F, the denominator in relation (4.6) is expressed as ( )
2 2
eq inH H= −F i Y Y . (4.7)
In non-adiabatic combustion,
2
eqHY depends on the heat loss and thus on the enthalpy
variable i. It follows that F is also a function of i. Furthermore, it is assumed that 2HY
and 2
eqHY have a similar dependence on i. As a result, the hydrogen variable r and the
enthalpy loss variable i are considered statistically independent. An analogous assumption was made in [40]. Substituting definition (4.7) in equation (D.42) (see appendix D) and taking into account the dependence of F on i, the turbulent transport equation for r is given by ( ) ( ),eff∇ ⋅ − ∇ ⋅ ∇ = − *
r r iρ r Γ r S F rS% % % %u , (4.8)
where Γr,eff is the effective diffusion coefficient of r, with an expression similar to that given in equation (4.3). In the last equation, rS is the mean chemical source term of
the variable r and *F is the mean of a function F*, which have the following expression

40 A model for turbulent rich combustion applied on the partial oxidation
1∗ ∂=
∂F
FF i
. (4.9)
The averaged source terms rS and iS are calculated by probability density function (PDF) averaging of the source terms Sr and Si, respectively, with the joint PDF of the variables r and i. The expression of rS is
( ) ( ) ( )1 1 1 1
0 0 0 0
d d d d= =∫ ∫ ∫ ∫r r rS S P r,i r i S P r P i r i , (4.10)
where P(r,i) is the joint PDF of variables r and i, P(r) is the PDF of variable r and P(i) is the PDF of variable i. A similar relation defines also iS . In equation (4.10), due to the assumed statistical independence of variables r and i, the joint PDF can be factorized to the product of the independent PDFs. Following the definition (4.1), the enthalpy variable i can also take values grater than 1. However, usual values of heat loss by soot radiation result in value of the variable i between 0 and 1. Therefore, the range of variation for the variable i in equation (4.10) was taken from 0 to 1. For the individual PDFs of r and i, the assumed shape function approach was used. The assumed shape of such a PDF can be a delta or a beta function. In the simulations to be presented later in chapter 6, the single delta shaped functions were employed. This means that the effect of the turbulent fluctuations on the progress of chemical reactions and the heat loss has been neglected. This choice is justified by the fact that the main effect of turbulence is the augmentation of mixing and that the effect on the chemical source term of the progress variable is limited. This is because the description of the chemistry with a RPV considers the slow processes only. The fast processes are taken into account implicitly. Furthermore, the combustion regimes investigation from section 6.6 shows that the partial oxidation process is characterized by a Damköhler number lower than 1. Following [59], in this case, the mean reaction rates may be expressed using mean mass fractions and temperature. 4.3.3 Thermo-chemical database
The source term of i given by relation (4.4) is a function of soot volume fraction
and temperature. As to be described in chapter 5, soot is a function of acetylene and temperature. The chemical source term of r, in equation (4.8), Sr, is a function of the gaseous species mass fractions and temperature. In the same equation, the factor F* is a function of the enthalpy loss variable i. The reduction of the number of scalars describing the combustion is done by pre-calculating the species mass fractions and temperature as functions of r and i. In order to speed up the flame calculations, the density, the chemical source term of r and the function F* are also calculated in a pre-processing step as functions of the combustion scalars r and i. All these quantities are stored in a thermo-chemical database as functions of discrete values of r and i. This database is a look-up table which is accessed during the flame calculation by the flow

4.3 Gas phase model 41
solver to retrieve the chemical source term of r, the density, the temperature, the acetylene mass fraction and the function F* for the integration of the transport equations of r, i, YS and NS. The database is also used to get the final fields of gaseous species mass fractions and temperature based on the computed solution for r and i.
In principle, a thermo-chemical database which is used in a RPV combustion model, as that described in this thesis, is created by solving a system of (N + 1) nonlinear equations, N for gaseous species and one for the enthalpy (N stands for the number of species) [18]. The independent variables are the reaction progress variable r and the enthalpy loss variable i and the unknowns are the species mass fractions and the temperature. Due to the convergence difficulties associated with solving highly nonlinear systems of equations and the complex nature of the chemical system under investigation (ultra rich conditions), an alternative way for calculating the database was used. Because of the intensely turbulent nature of the present combustion process, the combustion was considered to take place within the distributed reaction zone regime. This assumption is supported by the calculated turbulent Damköhler number which is of the order of unity or less, as shown in section 6.4. The microstructure of the distributed reaction zone was modelled as a spectrum of perfectly stirred reactors over a range of residence times and heat losses. A similar approach was reported in [24] with good results. The database was generated by using the PSR code of CHEMKIN-II chemical kinetics package. This code was also employed for simulations shown in chapter 3. Each set of values of the residence time and the heat loss leads to a composition, a temperature and the corresponding enthalpy. Based on the composition, the reaction progress variable r can be calculated. Given the enthalpy, the enthalpy loss variable i can be derived. This way, every pair of values of the residence time and the heat loss results in a pair of combustion scalars values (r, i) which corresponds to a composition and a temperature of the mixture. The composition and the temperature of the mixture at equilibrium (r = 1) was evaluated with the EQUIL code. The minimum calculated value of r for which the PSR code gave a solution was around 0.2. For residence times corresponding to r bellow this value, the mixture did not ignite because of the low temperature. To evaluate the composition of the mixture for the values of r between 0 and 0.2, the ignition zone of a laminar flame, characterized by low temperature chemical reactions, was used. This was taken from the solution of a freely propagating flame simulated with the PREMIX code. EQUIL and PREMIX are codes of CHEMKIN-II software and they have been also employed for simulations presented in chapter 3. In order to show the properties of such a thermo-chemical database, plots of the database used for numerical simulations to be reported in section 6.5.1 are presented in the following. The specifications of the mixture for which the database was calculated are given in table 4.1.

42 A model for turbulent rich combustion applied on the partial oxidation
Table 4.1. Specifications of the NG/NITROX mixture database.
CH4 85 % vol. Natural Gas (NG) N2 15 % vol. O2 40 % vol. Oxidizer (NITROX) N2 60 % vol. Equivalence ratio, φ 3.1 Initial temperature, Tin (K) 673
NG/NITROX mixture parameters
Pressure, p (bar) 6
Figures 4.1a, b and c present the temperature, the acetylene mass fraction and the chemical source term of r, respectively, as functions of the reaction progress variable r, for different values of the enthalpy loss variable i. In figure 4.1a, the different zones of the database calculated with each of the codes PREMIX, PSR and EQUIL are shown, in connection with the temperature plots. Examining the temperature curves, it can be seen that the temperature has a peak for r close to 0.3 and then decreases to the equilibrium value for r equal to 1. This behavior of temperature in rich chemical systems is in contrast with the stoichiometric mixtures, for which the maximum temperature is attained at equilibrium. The explanation is that a rich combustion process takes place in two global steps. In the first step, a part of the fuel (CH4) and all the oxidizer (O2) are converted through exothermic reactions to water and carbon dioxide. This leads to the initial increase of the temperature. In the second step, the rest of the fuel is reformed by water and carbon dioxide to give hydrogen and carbon monoxide. This second step is endothermic and first counterbalances the temperature increase until it reaches its maximum and then provokes the observed decrease of the temperature towards the equilibrium value. The variation of the temperature with i is as expected: temperature decreases when i, which quantifies the heat loss, increases.
By inspecting figure 4.1b, it appears that the acetylene follows the path of an intermediate, with zero values of the mass fraction in initial mixture (r = 0) and at equilibrium (r = 1) and a peak for an intermediate value of r (around 0.4). The variation of the acetylene mass fraction with i follows that of the temperature: it decreases when increasing i. The dependence of the acetylene mass fraction with temperature is important for the prediction of soot formation to be discussed in the next chapter.
Figure 4.1c gives the chemical source term of r, Sr. Sr shows low values in the first part of the r domain due to the slow chemistry in the initial mixture. The following steep raise of the source term is triggered by the ignition of the mixture which takes place at r = 0.2. The high values zone of Sr corresponds to the combustion part of the partial oxidation process, pointed out also by the temperature profile from figure 4.1a. In the last part of the r range, the source term decreases continuously as a result of the slow reactions of the reforming zone. It can be noticed that, though small, Sr remains higher than zero for the entire r domain. This means that Sr can drive the chemical system from initial conditions (r = 0) to full conversion of CH4 to H2 and CO (r = 1), by supporting the progress of r, as described by equation (4.8). However, the actual conversion of CH4 to H2 and CO depends heavily on the residence time available in the particular partial oxidation process, as Sr becomes very small when r is larger than

4.3 Gas phase model 43
0.6. The variation of Sr with i is predictable, the chemical source term of r decreasing with the increase of the heat loss, given by i, due to the associated temperature decrease, which slows down the chemical reactions.
600
800
1,000
1,200
1,400
1,600
1,800
2,000
0 0.2 0.4 0.6 0.8 1r
T (
K)
PREMIX
PSR
EQUIL
(a)
0
0.01
0.02
0.03
0.04
0.05
0.06
0 0.2 0.4 0.6 0.8 1r
YC
2H2
(b)
Figures 4.1a, b. The temperature, T (a) and the mass fraction of C2H2,
2 2C HY (b), as
stored in the database. T and 2 2C HY are represented as functions of the reaction
progress variable r, for different values of the enthalpy loss variable i: i = 0 (solid line), i = 0.25 (dashed line), i = 0.5 (dotted line), i = 0.75 (dash-dotted line) and i = 1.0 (dash-double dotted line). In picture (a), the CHEMKIN codes used to calculate the database for the different domains of r are also indicated.

44 A model for turbulent rich combustion applied on the partial oxidation
0.001
0.01
0.1
1
10
100
1000
0 0.2 0.4 0.6 0.8 1r
S r (
kg m
-3 s
-1)
(c)
Figure 4.1c. The chemical source term of r, Sr, as stored in the database. Sr is represented as a function of the reaction progress variable r, for different values of the enthalpy loss variable i: i = 0 (solid line), i = 0.25 (dashed line), i = 0.5 (dotted line), i = 0.75 (dash-dotted line) and i = 1.0 (dash-double dotted line). A logarithmic scale was used for Sr.
In figure 4.2, the mass fractions of major species H2O, CH4 and O2 are plotted as
functions of r, for the adiabatic case (i = 0). Three regimes can be clearly distinguished in the partial oxidation process: ignition, combustion and reforming. In the ignition part, the chemical reactions are activated. In the combustion zone, part of the CH4 and all the O2 are consumed by fast combustion reactions. Water is formed as the main product. This process lasts until the mass fraction of H2O reaches a maximum. From that moment on, the reforming step of the process begins. The rest of the CH4 is converted with H2O to H2 and CO via slow endothermic reforming reactions.
Figure 4.3 shows the mass fractions of H2 and CO as functions of r, also for the adiabatic case (i = 0). The mass fraction of H2 is a linear function of r, in accordance with the definition (4.6). As for CO, two curves have been plotted. The dashed line depicts the actual variation of CO mass fraction. The dotted line represents a linear approximation of the CO mass fraction curve. It corresponds to a one step global reaction of CH4 conversion to H2 and CO, as given by equation (1.3), section 1.2. The difference between the actual curve and the approximated curve indicates that, in the partial oxidation process, CO is produced by a complex reaction mechanism, involving intermediate species and not by the one step reaction (1.3).

4.3 Gas phase model 45
0
0.1
0.2
0.3
0.4
0 0.2 0.4 0.6 0.8 1r
YC
H4,
YO
2, Y
H2O
Ignition Combustion Reforming
Figure 4.2. Mass fractions of CH4 (solid line), O2 (dash line) and H2O (dotted line), as stored in the database. The mass fractions are represented as functions of the reaction progress variable r for the adiabatic case (i = 0). The partial oxidation steps: ignition, combustion and reforming are also indicated in the figure.
0
0.01
0.02
0.03
0.04
0.05
0.06
0 0.2 0.4 0.6 0.8 1r
YH
2
0
0.2
0.4
0.6
0.8
YC
O
Figure 4.3. Mass fractions of H2 (solid line) and CO (dashed line), as stored in the database. The mass fractions are represented as functions of the reaction progress variable r for the adiabatic case (i = 0). The extra dotted line represents a linear approximation of the CO mass fraction curve. It corresponds to the global reaction of CH4 conversion to H2 and CO, as given by equation (1.3), section 1.2.

46 A model for turbulent rich combustion applied on the partial oxidation
In the next chapter, the soot model will be presented. The gas phase model described in the present chapter and the soot model will be used together for the CFD simulation of the partial oxidation of natural gas process, in chapter 6.

Chapter 5
Soot
Abstract
In the first part of this chapter, an overview on soot formation is given. The mechanism of soot formation, governed by the processes of nucleation, surface growth, agglomeration and oxidation is presented. The detailed modeling of soot and the need for simplified models are then discussed. A two equation model which solves equations for soot mass fraction and soot particle number density is described in detail. The soot model is linked to the gas phase model presented in chapter 4. Together the models predict gaseous species concentrations, temperature and soot in the partial oxidation process.
5.1 Soot formation and modeling 5.1.1 Soot formation in flames
The formation of soot (carbonaceous agglomerates containing millions of carbon atoms) in flames, under fuel rich conditions, is well documented [3, 4, 30]. The formation of soot is of interest from two points of view. On the one hand, soot and polycyclic aromatic hydrocarbons (PAH), which are precursors of soot, are pollutants with adverse human health effects [36]. On the other hand, soot formation can affect flame phenomena [14]. The most obvious flame process affected by soot is radiation. The heat loss due to soot radiation leads to flame temperature reduction, which influences the kinetics of pollutants formation, provokes a change in density and influences the flame length. A secondary phenomenon caused by soot formation is its effect on flame thermo-chemistry and kinetics. Both the endothermic conversion of alkenes to soot intermediates, e.g., acetylene and the different oxidation rates of soot with respect to gas-phase species influence the heat release profile in the flame. These arguments reflect the necessity of soot formation prediction as part of the flame modeling process. 5.1.2 Mechanism of soot formation
The mechanism of soot formation in rich premixed flames is thought to be the following [5]. First, the hydrocarbon fuel is degraded during oxidation into small hydrocarbon radicals from which small hydrocarbons, particularly acetylene are

48 Soot
formed. The latter adds hydrocarbon radicals for growth and the growing unsaturated radicalic hydrocarbons form aromatic rings when containing a sufficiently large number of carbon atoms. The formation of larger aromatic rings (polycyclic aromatic hydrocarbons) occurs mainly via the addition of acetylene. The growth in the third dimension is supposed to happen by coagulation of PAH forming primary soot particles. These primary particles coagulate picking up simultaneously molecules from the gas phase for surface growth. Surface growth contributes to the major part of the final soot concentration while coagulation determines the final size of the soot particles and their irregular aggregate structure. Last, soot is subject to oxidation, the contribution of which to the final soot amount depending on the availability of oxidizing species in the flame (O2, OH, CO2, H2O, H2). 5.1.3 Soot modeling
When modeling soot formation following the mechanism outlined in section 5.1.2, soot formation and oxidation is embedded into the detailed description of the gas phase chemistry that provides gaseous species concentrations up to the first aromatic ring, formation and growth of PAH and formation and growth of soot particles by particle inception, surface growth, agglomeration and oxidation. For numerical simulation the mass balances for all the involved chemical species and the enthalpy balance has to be solved. The growth and oxidation of PAH and soot particles are modeled by the H-abstraction-C2H2-addition (HACA) mechanism. The soot particle phase is treated by means of the balance equation of the moments of the size distribution which leads to a closed system of equations. Detailed modeling results in a large system of equations containing the differential equations for the transport of the mass fractions of the gas phase species, the enthalpy and a limited number of moments of the soot particle size distribution. This large set of differential equations presently can be solved within acceptable computer time for laminar one-dimensional systems only, e.g., premixed flat flames [3]. Due to the turbulent, multidimensional nature of most practical combustion applications such as gas turbines, gas flares and internal combustion engines, simplified soot models are needed.
5.2 Soot model for the partial oxidation of natural gas
In this section, a simplified model of soot formation, based on the processes of nucleation, surface growth, agglomeration and oxidation, is presented. As mentioned earlier, the gas phase chemistry is described by the detailed reaction mechanism GRI-Mech 3.0. This provides the concentrations of gaseous species throughout the flame, in particular acetylene. The soot nucleation and surface growth are linked to the gas phase chemistry by the simplifying assumption that acetylene is the indicative species for the locations in the flame where nucleation and soot mass growth occurs. This approach was used by Lindstedt for laminar non-premixed flames [37, 38] and by Brooks and Moss [8] and Kronenburg et al. [36] for turbulent methane diffusion flames. Nucleation is described by a first-order function of acetylene concentration.

5.2 Soot model for the partial oxidation of natural gas 49
Surface growth is modeled with the HACA mechanism developed by Frenklach and Wang [20] and used by Xu et al. for rich laminar premixed flames [64, 65]. Particle agglomeration is modeled by the normal square dependence in the free molecular regime, used by many other investigators [8, 36, 38]. Soot oxidation by O2 and OH was treated as in reference [36] while soot oxidation by CO2, H2O and H2 was evaluated using data from reference [54].
Similar to soot modeling in turbulent diffusion flames [8, 36], the present model involves the solution of two conservation equations for soot mass fraction YS and soot particle number density NS
( )S SS S⋅∇ = ∇ ⋅ ∇ +Y Yρ Y ρD Y Su , (5.1)
( )S SS S⋅∇ = ∇ ⋅ ∇ +N Nρ N ρD N Su . (5.2)
In these equations, ρ is the density, u is the velocity vector,
SYD and SND are the
molecular diffusion coefficients for YS and NS, respectively, and SYS and
SNS are the
chemical source terms. The source terms are calculated using expressions describing the soot nucleation, surface growth, agglomeration and oxidation, which are presented in the following. 5.2.1 Nucleation
The underlying chemical reaction of nucleation is [28, 30] 2 2 soot 2C H 2C H⎯⎯→ + , (R1) with the reaction rate nu 1 2 2[C H ]=w k . (5.3) In equation (5.3), wnu is the nucleation rate, k1 is the nucleation reaction rate constant and [C2H2] is the acetylene concentration. The reaction rate constant k1 is given in table 5.1.

50 Soot
Table 5.1. Reaction rate constants for soot formation and oxidation, in form of Arrhenius expressions, kj = ATbe-Ta/T. kj A b Ta Units Reference k1 6.3⋅103 0 21,000 K, kmole, m, s [36] k2,f 2.5⋅1011 0 8,047 K, kmole, m, s [64] k2,b 3.9⋅109 0 4,691 K, kmole, m, s [64] k3 1.0⋅1011 0 0 K, kmole, m, s [64] k4 8.4⋅108 0.4 4,222 K, kmole, m, s [64] k6 7.15⋅102 0.5 19,800 K, kmole, m, s [36] k7 3.6⋅10-1 0.5 0 K, kmole, m, s [36] k8 6.35 0 19,500 K, kg, m, s, kPa [54] k9 1.92 0 17,680 K, kg, m, s, kPa [54] k10 3.5⋅10-2 0 17,900 K, kg, s, kPa [54] 5.2.2 Surface growth
Following [20], the soot surface growth is assumed to take place through a sequential two-step process: H abstraction which creates an active site and C2H2 addition which propagates the surface growth. This H-abstraction-C2H2-addition reaction sequence is referred to as the HACA mechanism and is given by 2sootsoot HCHHC +•⎯→←+− , (R2) soot sootC • H C H+ ⎯⎯→ − , (R3) soot 2 2 sootC • C H C H H+ ⎯⎯→ − + , (R4) where Csoot−H represents an arm-chair site on the soot particle surface and Csoot• the corresponding radical. In Xu et al. [49], the rate of soot particle surface growth, based on HACA mechanism, is expressed as sg FW FW=w α w , (5.4)
where αFW is an empirical (steric) factor of order unity and wFW represents an expression involving the various reaction rates of HACA mechanism. The latter is given by
HACA 2,f 4 2 2 sootFW
2,b 2 3 4 2 2
[H][C H ][C H]
[H ] [H] [C H ]
−=
+ +C k k
wk k k
, (5.5)

5.2 Soot model for the partial oxidation of natural gas 51
where CHACA is a constant defined as
CHACA
A
2= WC
N. (5.6)
In equation (5.5), k2,f, k4, k2,b, k3 and k4 are the reaction rate constants of the corresponding reactions of the HACA mechanism, where f stands for forward and b for backward, shown in table 5.1. In the same equation, [Csoot−H] represents the surface density of Csoot−H sites and [H2] and [H] are the concentrations of hydrogen and hydrogen atoms, respectively. In equation (5.6), WC is the molar mass of carbon, which is assumed to be the only constituent of soot and NA is the Avogadro number. The values of the constants [Csoot−H], WC and NA are presented in table 5.2. Table 5.2. Values of constants used in the soot model.
Constant Value Units Reference WC 12 kg kmol-1 − NA 6.023⋅1026 atoms kmol-1 − [Csoot-H] 2.3⋅1019 sites m-2 [64] CS,pa 9 − [36] σB 1.38⋅10-23 J K-1 − ρS 2,000 kg m-3 [36] NC,min 60 atoms particle-1 [36]
In Xu et al. [64], the best correlation of surface growth rate, as expressed in equation (5.4), with experimental data was obtained for the following steric factor
( )FW
12,5000.00115exp⎛ ⎞= ⎜ ⎟
⎝ ⎠α T
T (5.7)
where T is the temperature. This expression was used in the present investigation as well. 5.2.3 Particle agglomeration
The decrease in particle number density is assumed to occur according to particle agglomeration. This step is modelled using the normal square dependence in the free molecular regime [8, 36, 38]
soot n,sootnC C⎯⎯→ , (R5)

52 Soot
( )1/ 2
21/ 2 Bpa S,pa S S
S
62
⎛ ⎞= ρ⎜ ⎟
⎝ ⎠
σ Tw C d N
ρ, (5.8)
where wpa is the particle agglomeration reaction rate, CS,pa is an agglomeration constant, dS is the soot particle diameter, σB is the Boltzmann constant, ρS is the soot density and ρ is the mixture density. The values of the constants CS,pa, σB and ρS are given in table 5.2. 5.2.4 Oxidation
The reaction steps for soot oxidation by O2, OH, CO2, H2O and H2 can be written as [36, 54]
soot 2
1C O CO
2+ ⎯⎯→ , (R6)
sootC OH CO H+ ⎯⎯→ + , (R7) soot 2C CO 2CO+ ⎯⎯→ , (R8) soot 2 2C H O H CO+ ⎯⎯→ + , (R9) soot 2 4C 2H CH+ ⎯⎯→ , (R10) with the reaction rates
2ox,O 6 2[O ]=w k , (5.9)
ox,OH 7[OH]=w k , (5.10)
2 2ox,CO 8 CO=w k p , (5.11)
2 2ox,H O 9 H O=w k p , (5.12)
2 2ox,H 10 H=w k p . (5.13)
In equations (5.9) − (5.13),
2ox,Ow , ox,OHw , 2ox,COw ,
2ox,H Ow and 2ox ,Hw are the reaction
rates of soot oxidation by O2, OH, CO2, H2O and H2, respectively and k6, k7, k8, k9 and k10 are the corresponding reaction rate constants, specified in table 5.1. In the same

5.2 Soot model for the partial oxidation of natural gas 53
equations, [O2] and [OH] are the concentrations of O2 and OH, respectively and 2COp ,
2H Op and 2Hp are the partial pressures of CO2, H2O and H2, respectively.
In the references cited in table 5.1, the reaction rates constants for nucleation, surface growth and oxidation have been used for different situations than the present application (turbulent partial oxidation). Thus, the reaction rate constant of nucleation (k1) and oxidation by O2 (k6) and OH (k7) were used for a turbulent methane/air diffusion flame [36], the reaction rates constants of surface growth (k2, k3, k4) for laminar rich premixed methane/oxygen flames [64] and the reaction rates constants of oxidation by CO2 (k8), H2O (k9) and H2 (k10) for pulverized-coal combustion and gasification [54]. It is hoped however, that these values are a reasonable estimate for the present situation as well. 5.2.5 Source terms of soot parameters transport equations
The source terms in equations (5.1) and (5.2) can be expressed as functions of the rates of nucleation, surface growth, agglomeration and oxidation as follows
( ) S
2 2 2 2
nu C sg S
ox,O ox,OH C ox,CO ox,H O S ox,H S
2
,
= + −
⎡ ⎤− + + + +⎣ ⎦
YS w W w A
w w W w w A w ρY (5.14)
S
Anu pa
C,min
2= −N
NS w w
N, (5.15)
where AS is the soot surface per unit volume and NC,min is the number of carbon atoms in the incipient soot particle, shown in table 5.2. The particle surface area is defined by 2
S S S= πA d ρN (5.16) and the particle diameter is given as
1/3
SS
S S
6 1⎛ ⎞= ⎜ ⎟π⎝ ⎠
Yd
ρ N. (5.17)
Substituting (5.8), (5.16) and (5.17) in (5.14) and (5.15) and rearranging the terms, the expressions of the source terms become
S S S S
2 /3 1/ 3S S S= + +Y Y Y YS α β Y N γ Y , (5.18)
S S S
1/ 6 11/ 6S S= +N N NS α β Y N , (5.19)

54 Soot
where
( ) S
S 2 2 2
S 2
S
S
nu C
2/3
sg ox,O ox,OH C ox,CO ox,H O
S
ox,H
Anu
C,min
1/ 6 1/ 2
2BS,pa
S S
2 ,
6,
2 ,
6 62 .
=
⎛ ⎞⎡ ⎤= − + + + π ⎜ ⎟⎣ ⎦ π⎝ ⎠= −
=
⎛ ⎞ ⎛ ⎞= − ⎜ ⎟ ⎜ ⎟π⎝ ⎠ ⎝ ⎠
Y
Y
Y
N
N
α w W
β w w w W w w ρρ
γ w ρ,Nα w
N
σ Tβ C ρρ ρ
(5.20)
In equation (4.4), section 4.3.1, the heat loss due to soot radiation was expressed as
a function of the soot volume fraction fS. The relation between fS and YS is
S SS
= ρf Y
ρ. (5.21)
In the last paragraph of section 3.3.2, the pressure dependence of fS was discussed
in connection with equation (3.3). Although the effect of pressure on soot formation is not investigated in the present work, it is thought that the soot model would predict an increase of fS with pressure as ∼ p3. This rough estimation is explained as follows. In equation (5.18),
SYS is a function of SYβ . From equations (5.20),
SYβ is a function of the
product wsg⋅ρ. Following equations (5.4) and (5.5), wsg is a function of species concentration and subsequently a function of ρ. As a result of these dependencies,
SYS
is a function of ρ2. This means that YS will also be a function of ρ2. In equation (5.21), fS depends of the product YS⋅ρ. The last two arguments lead to the conclusion that fS is a function of ρ3 and consequently a function of p3. 5.2.6 Turbulent transport equations for soot parameters
By Favre-averaging the laminar equations (5.1) and (5.2), one obtains the following expressions for the turbulent transport equations of the soot parameters YS and NS, analogous to equation (D.42), derived in appendix D, ( )
S SS ,eff S⋅∇ = ∇ ⋅ ∇ +Y Yρ Y Γ Y S% %%u (5.22)
( )S SS ,eff S⋅∇ = ∇ ⋅ ∇ +N Nρ N Γ N S% %%u (5.23)

5.2 Soot model for the partial oxidation of natural gas 55
In these equations, S ,effYΓ and
S ,effNΓ are the effective diffusion coefficients of YS and
NS, respectively. The effective diffusion coefficient of YS is given by
S S
S
T,eff
,T
= +Y Y
Y
µΓ ρDSc
, (5.24)
where µT is the turbulent viscosity and
S ,TYSc is the turbulent Schmidt number for YS.
The effective diffusion coefficient of NS has a similar expression with equation (5.24). The turbulent Schmidt number for both YS and NS were assigned a value of 0.9, which is the default value of CFX-5 for any transport variable. Also present in equations (5.22) and (5.23) are the mean source terms of the soot mass fraction
SYS and the soot
particle number density SNS . They are found by averaging their laminar expressions
given in equations (5.14) and (5.15). Using the simplifying approach of ignoring the effect of turbulent fluctuations on soot parameters, the mean source terms become [8]
S S S S
2/ 3 1/3S S S= + +Y Y Y YS α β Y N γ Y , (5.25)
S S S
1/ 6 11/ 6S S= +N N NS α β Y N , (5.26)
where
SYα , SYβ ,
SγY ,
SNα and SNβ are the averaged forms of the functions given in
equation (5.20). They are determined by averaging with the PDFs of the variables r and i, analogus with the calculation of the mean source term of r, rS . For example,
SYα
has the expression
( ) ( ) ( )S S S
1 1 1 1
0 0 0 0
, d d d d= =∫ ∫ ∫ ∫Y Y Yα α P r i r i α P r P i r i . (5.27)
In the next chapter, the soot model described in the present chapter will be used
together with the gas phase model given in chapter 4 to predict numerically the soot mass fraction and particle number for the partial oxidation process.

56 Soot

Chapter 6
Simulations of the partial oxidation of natural gas with the turbulent rich combustion model
Abstract
In this chapter, the in-house developed combustion model is used to simulate the partial oxidation of natural gas. In the first part of the chapter, the transport equations and the databases used by the model are summarized. Then, the modeling domains and the associated boundary conditions are given. In the main part of the chapter, the results of the simulations obtained with the combustion model are presented. The effects of the reactor diameter and the methane and oxygen concentrations in the mixture on the conversion efficiency of the partial oxidation process are investigated. Finally, the combustion regimes are analyzed and conclusions are formulated.
6.1 Introduction
In chapters 4 and 5 the in-house developed combustion model with its parts, the gas phase model and the soot model, have been presented. In this chapter, the combustion model is used to simulate the partial oxidation of natural gas for several case studies. The partial oxidation is simulated as a turbulent rich premixed combustion process. The combustion model is implemented in the CFX-5 flow solver with the k-ε turbulence model.
6.2 Summary of transport equations
The rich turbulent combustion model consists of turbulent transport equations for four variables. The first two are the reaction progress variable r and the enthalpy loss variable i. They describe the gas phase chemistry. The last two variables are the soot mass fraction YS and the soot particle number density NS and quantify the soot formation.
The RPV r is defined as

58 Simulations of the partial oxidation of natural gas with the combustion model
2 2
2 2
inH H
eq inH H
−=
−Y Y
rY Y
, (6.1)
where
2HY is the mass fraction of H2 and 2
inHY and
2
eqHY are the mass fractions of H2 at
inlet conditions (initial mixture) and at equilibrium conditions, respectively. The denominator in relation (6.1) is denoted with ( )
2 2
eq inH H= −F i Y Y . (6.2)
The turbulent transport of the Favre average of r, r% , is governed by ( ) ( ),eff∇ ⋅ − ∇ ⋅ ∇ = − *
r r iρ r Γ r S F rS% % % %u , (6.3)
where Sr is the chemical source term of r, calculated in the thermo-chemical database , Si is the source term of i, and F* is a function of i. Sr will be shown in the next section, Si is given in equation (6.7) and F* represents
1∗ ∂=
∂F
FF i
. (6.4)
The enthalpy loss variable i is expressed as
ad
ad
−= h hi
h, (6.5)
where h is the current enthalpy and had is the adiabatic enthalpy, which equals the enthalpy of the initial mixture. The turbulent transport equation of the Favre average of i, i% , is ( ) ( ),eff∇ ⋅ − ∇ ⋅ ∇ =i iρ i Γ i S% %%u , (6.6)
where Si has the expression
( )5 5S,rad S wall
ad
4 −= −i
C σf T TS
h. (6.7)
In equation (6.7), fS is the soot volume fraction and T is the soot/gas temperature. The mean source terms for variables r and i are found by PDF averaging, according to
( ) ( )1 1
0 0
d d= ∫ ∫r rS S P r P i r i , ( ) ( )1 1
0 0
d d= ∫ ∫i iS S P r P i r i . (6.8)

6.2 Summary of transport equations 59
In equations (6.8), P(r) and P(i) are the PDFs of r and i respectively, taken as single delta functions in the model. More details on the various terms and factors present in equations (6.3) - (6.8) are given in section 4.3. The turbulent transport equations for YS and NS are ( )
S SS ,eff S⋅∇ = ∇ ⋅ ∇ +Y Yρ Y Γ Y S% %%u , (6.9)
( )
S SS ,eff S⋅∇ = ∇ ⋅ ∇ +N Nρ N Γ N S% %%u , (6.10)
where the source terms
SYS and SNS are given by
S S S S
2/ 3 1/3S S S= + +Y Y Y YS α β Y N γ Y , (6.11)
S S S
1/ 6 11/ 6S S= +N N NS α β Y N . (6.12)
In equations (6.11) − (6.12),
SYα , SYβ ,
SγY ,
SNα and SNβ are functions specified in
section 5.2. For later arguments, the un-averaged source term of YS and NS are also shown
( ) S
2 2 2 2
nu C sg S
ox,O ox,OH C ox,CO ox,H O S ox,H S
2= + −
⎡ ⎤− + + + +⎣ ⎦
YS w W w A
w w W w w A w ρY, (6.13)
S
Anu pa
C,min
2= −N
NS w w
N. (6.14)
In equation (6.13), wnu, wsg, wox,i and wpa are the rate of nucleation, surface grows, oxidation by species i and particle agglomeration, respectively. The different quantities appearing in equations (6.9) − (6.13) are discussed in detail in section 5.2. The combustion model is implemented in the CFD flow solver CFX-5. The solver integrates the RANS equations and the scalar transport equations (6.3), (6.6), (6.9) and (6.10) using the k-ε turbulence model. The density ρ, chemical source term Sr, function F*, temperature T and mass fractions of gaseous species Yi are taken from the thermo-chemical database linked to the flow solver. The chemical source terms of r (Sr), corresponding to the two mixtures which have been investigated, as stored in the database, are discussed in the next section.
A remark has to be made regarding the source term of YS (equations (6.11) and (6.13)). Due to the lack of data from literature and because the planned experiments at University of Twente were still in an early stage, the predictions of the model could not be validated. In order to asses the validity of the soot predictions, results produced by the model were compared with measurements and calculations reported in [64]. The comparison is given in appendix E. Based on the figures presented in appendix E,

60 Simulations of the partial oxidation of natural gas with the combustion model
it was found that the computed soot mass fraction and particle number density are physically meaningful, but the oxidation rates are over predicting the oxidation of soot by H2O (
2ox,H Ow ) and CO2 (2ox,COw ). The explanation is that the reaction rates
coefficients used were designed for different carbon structures than soot and operating conditions, as shown in appendix E. It follows that the oxidation rates parameters have to be adjusted for the present applications by correlating the simulations with experimental data. Since no such data was available, the results which will be presented in the followings were obtained without including the oxidation terms (
2ox,Ow , ox,OHw , 2ox,COw ,
2ox,H Ow and 2ox,Hw ) in the source term of YS. Thus, the un-
averaged and the averaged source terms of YS become
S nu C sg S2YS w W w A= + , (6.15)
S S
2 /3 1/ 3S S
∗= +SY Y YS α β Y N , (6.16)
where
S
∗Yβ is a modified
SYβ function (see section 5.2) given by
S
2/3
sg
S
6∗ ⎛ ⎞= π ⎜ ⎟π⎝ ⎠
Yβ w ρρ
. (6.17)
As already mentioned, the partial oxidation process is simulated by implementing
the turbulent rich combustion model in the CFX-5 flow solver with the standard k-ε turbulence model. The constants used for the turbulence model and the combustion model are given in table 6.1. All the constants have the default CFX-5 values.
Table 6.1. Modeling constants of the k-ε turbulence model and the combustion model. All constants have default CFX-5 values.
k-ε turbulence model Cµ 0.09 Cε,1 1.44 Cε,2 1.92 σk 1.0 σε 1.3 Combustion model Scr,T = Sci,T =
S ,TYSc = S ,TNSc 0.90

6.3 Thermo-chemical databases 61
6.3 Thermo-chemical databases
Two types of mixtures and three reactor diameters have been used to build case studies for the partial oxidation of natural gas. The mixtures parameters are given in table 6.2.
Table 6.2. Parameters of mixtures investigated.
Mixture parameter NG/NITROX CH4/O2 Pressure, p (bar) 6 20 Initial temperature, Tin (K) 673 673 Fuel equivalence ratio, φ 3.1 4.0
In table 6.2, the natural gas (NG) and the NITROX have the same composition as
used for the CHEMKIN simulations in chapter 3. Thus, the NG consists of 85 % vol. CH4 and 15 % vol. N2 and the NITROX has 40 % vol. O2 and 60 % vol. N2. The NG/NITROX mixture at p = 6 bar and Tin = 673 K was simulated in view of comparison with planned experiments at the University of Twente [32]. The CH4/O2 mixture at p = 20 bar and Tin = 673 K was simulated to match operating conditions reported in literature [13, 51, 56].
For each mixture, a thermo-chemical database was built. In figure 6.1 the chemical source terms of r (Sr in equation (6.3)) for the two mixtures are plotted. The curves correspond to the adiabatic case (i = 0). The Sr curve for the NG/NITROX mixture was already presented in figure 4.1c, section 4.3.3. The comments made there are summarized here. Sr shows low values in the first part of the r domain due to the slow chemistry in the initial mixture. The following steep raise of the source term is triggered by the ignition of the mixture which takes place at about r = 0.2 for the NG/NITROX mixture and at a slightly lower value of r for the CH4/O2 mixture. The high values zone of Sr corresponds to the combustion part of the partial oxidation process. In the last part of the r range, the source term decreases continuously as a result of the slow reactions of the reforming zone. It can be noticed that, though small, Sr remains higher than zero for the entire r domain. This means that Sr can drive the chemical system from initial conditions (r = 0) to full conversion of CH4 to H2 and CO (r = 1), by supporting the progress of r, as described by equation (6.3).
Comparing the Sr curves for NG/NITROX and CH4/O2 systems, it can be noticed that the latter is characterized by Sr values one order of magnitude larger for the entire range of r. This is a result of the higher concentrations of reactive components (CH4 and O2) and higher temperatures caused by the lack of the dilution N2 from the CH4/O2 mixture. Thus, the peak value of Sr is almost 20 times higher for CH4/O2 ( 4 2CH /O
,maxrS = 7,170 kg m-3 s-1) than for NG/NITROX ( NG/NITROX,maxrS = 464 kg m-3 s-1). The
higher source term of r for the CH4/O2 mixture will lead to a higher reactor outlet value of r, which means a higher conversion of CH4 to H2 and CO. This effect will be shown in section 6.5, when the simulations results for NG/NITROX and CH4/O2
mixtures are compared.

62 Simulations of the partial oxidation of natural gas with the combustion model
0.001
0.01
0.1
1
10
100
1000
10000
0 0.2 0.4 0.6 0.8 1r
S r (
kg m
-3 s
-1)
Figure 6.1. Source term of r, Sr, for NG/NITROX (solid line) and CH4/O2 (dashed line) mixtures. Sr is represented as a function of the reaction progress variable r, for the adiabatic case (i = 0). A logarithmic scale was used.
6.4 Modeling domains and boundary conditions
As already mentioned in the previous section, three reactor diameters have been simulated. The reactors geometry is given in table 6.3.
Table 6.3. Geometry of the reactors investigated.
Dimension Value Reactor diameter, d1 (mm) 50; 75; 100 Burner inner diameter, d2 (mm) 25 Burner tip diameter, d3 (mm) 12.5 Reactor length, l1 (mm) 1,000
All the cases simulated were swirl stabilized rich flames. The reactor inlet
conditions of the flows are presented in table 6.4. For the calculation of the swirl number, the definition given in [23] was used. This reads
tan ax
tan2
ann ax ann ax
2 d2
d= =
∫
∫A
A
u u r AM
Swd M d u A
, (6.18)

6.4 Modeling domains and boundary conditions 63
where Mtan is the axial flux of angular momentum, Max is the axial thrust, dann is the diameter of annular passage (equal to d2 in figure 6.2), A is the area used for the swirl number calculation (swirl number plane in figure 6.2), utan is the tangential velocity, uax is the axial velocity and r is the radius. The value obtained with equation (6.18) for the swirl number was Sw = 0.69 (see also table 6.4). This was high enough to get recirculation of the hot reacted gases in the cold initial mixture but sufficiently low to avoid any back flow, as shown in figure 6.4, section 6.5 by the zero axial velocity lines. Table 6.4. Reactor inlet conditions of flows simulated.
Inlet flow parameter NG/NITROX CH4/O2 Axial velocity (m s-1) 50 50 Reynolds number 50,000 150,000 Swirl number, Sw 0.69 0.69
The modeling domains are presented in figure 6.2. The Fuel (NG or CH4) is
premixed with the Oxidizer (NITROX or O2) and the Fuel/Oxidizer mixture goes into the burner through radial swirl vanes. The resulted swirling flow enters through an annular channel the partial oxidation reactor.
Figure 6.2. Modelling domains for simulations.
In order to decrease the computational time, the simulations have been carried out in accordance with the following procedure. First, a cold flow simulation was performed, to establish the velocity field for the entire geometry (full modeling domain) presented in figure 6.2. During this run, the combustion model was not used. Then, a reduced modeling domain was defined, for which the inlet profiles of velocity, turbulent kinetic energy and turbulent dissipation were taken from the full domain simulation. This inlet is placed at l2 = 20.5 mm from the burner tip (see figure 6.2). Using the reduced domain, a second cold flow was simulated. The results file was

64 Simulations of the partial oxidation of natural gas with the combustion model
utilized as initial values file for the targeted hot flow simulations, for faster convergence. The reduced domain consists of a quarter of the cylindrical reactor and has the configuration specified in figure 6.2. The diameter (d1) and length (l1) of the reactor, the inner diameter of the burner (d2) and the diameter of the burner tip (d3) are given in table 6.3. Details of reactor and burner geometry can be found in [32]. Also present in figure 6.2 are the radial location of the axial plot (y1) and the axial locations of the radial plots (x1, x2, x3), which are presented in the next section.
Drawings were made in SolidWorks 2003 for both full and reduced modeling domains. They have been subsequently imported in CFX-5 Build, then boundary conditions were set in CFX-5 Pre and the definition files were written. For the reduced domain, a periodic pair of planes was set at the domain interfaces in angular direction (angle measured in a plane perpendicular to the central axis of the reactor). The definition files were run in CFX-5 Solver Manager with a subroutines file containing the combustion model and the database file. The results were visualized with CFX-5 Post and written to data files. This data was plotted in figures 6.4 − 6.9, section 6.5. The computational domains were divided with an unstructured grid. The grid was refined in the burner, where the cell size was 1.6 mm. Subsequently, the grid was expanded geometrically with a rate of 1.2 for the full domain simulation and 1.02 for the reduced domain simulations, until a maximum cell size of 4.5 mm was reached. Then, the cell size was kept constant until the end of the domains. The small geometric expansion factor used for the reduced domain simulations (1.02) was needed in order to improve the prediction of the recirculation zones. For the full domain simulation this was not necessary, since these results have been used only to provide inlet profiles for the reduced modeling domain, in a region where the cell was already very small (the cell size was 1.6 mm in the burner). The fine grid used for the hot flow simulations was also necessary to avoid the overshooting in the transport equation of r, especially in the case of CH4/O2 flow, characterized by abrupt increase and high peak values of the source term Sr. Simulations made with a coarser grid (similar to that used for the full modeling domain) led to overshooting problems. A systematic check of the cold flow solutions for grid independence has been performed within another Ph.D. study carried out in the Laboratory of Thermal Engineering at the University of Twente [27]. The unstructured grid used for the reduced domain simulations with the 50 mm diameter reactor is shown in figure 6.3. It can be noticed that the smallest cell size (1.6 mm) is located in the first part of the domain, close to the inlet. The recirculation zones are also marked in figure 6.3 using zero axial velocity lines (see also figure 6.4a, section 6.5). The slow increase of the cell size results in a fine grid for the entire recirculation areas. In figure 6.3, it can be also noticed the presence of five additional planes, parallel to the walls, which introduce a number of extra grid points close to the walls. This is caused by using the inflated boundary option in CFX-5. The added structured grid near the walls is thought to improve the numerical predictions in these regions.
The CFX-5 flow solver uses false timesteps for the integration of the transport equations. The so-called physical time step was set to achieve a fast convergence behavior of the hot flow simulations. Thus, the timestep used was 5⋅10-4 s for the NG/NITROX mixture and 5⋅10-5 s for the CH4/O2 mixture. Lower timesteps resulted in convergence to a root mean square (RMS) of normalized residuals two orders of

6.4 Modeling domains and boundary conditions 65
magnitude higher than the convergence criteria (10-6) or a bouncy convergence behavior. More details on the simulations and the boundary conditions of the modeling domains are given in the following.
Figure 6.3. The grid used for the reduced domain simulations with the 50 mm diameter reactor, exported from CFX-5. Zero axial velocity lines set the limits of the recirculation zones (in the center and at the corner). Full domain (cold flow)
The full domain cold flow simulation used an isothermal NG/NITROX flow with
4CH 0.234=Y , 2N 0.466=Y and
2O 0.3=Y (the same composition of the NG/NITROX
mixture as employed everywhere throughout this work) at T = 673 K and p = 6 bar. The values of density and the dynamic viscosity were ρ = 2.64 kg m-3 and µ = 2.97⋅10-
5 kg m-1 s-1, respectively. The dynamic viscosity was calculated for the composition and temperature of the NG/NITROX mixture, using data from [21]. The boundary conditions and initialization of the full domain simulation are given bellow. Inlet For the inlet boundary, the mass flow rate was specified, 10.04 kg s−=m& . The
turbulence intensity iT and the turbulent viscosity µT were calculated by default with
T 0.037′
= =ui
u, T T1,000=µ i µ . (6.19)
Using equations (6.19), the turbulent kinetic energy (k) and the turbulent dissipation (ε) are given by
2 2T
3
2=k i u ,
2
T
= µkε ρCµ
. (6.20)

66 Simulations of the partial oxidation of natural gas with the combustion model
Outlet The outlet boundary condition was the specification of the relative static pressure, pstat = 0 Pa. In the outlet, CFX-5 uses constant gradient constraint (generally non-zero) for scalar quantities. Wall The no slip condition for velocity was utilized at walls, uwall = 0 m s-1. CFX-5 uses scalable wall functions for modeling the flow in the near wall region (log law of the wall). Initialization All the variables were given automatically initial values by the CFX-5 solver. Reduced domain (cold and hot flows)
The reason of performing reduced domain cold flow simulations was to provide initial values for velocity, turbulent kinetic energy and turbulent dissipation for the hot flow simulations. The flow was defined as general fluid, which allows fluid properties to be externally specified (e.g., by a database). The hot flow simulations used isothermal NG/NITROX and CH4/O2 flows at 673 K and 6 bar and 20 bar, respectively. The effect of the temperature on the velocity field was accounted for through the density change, given by the database. The molecular dynamic viscosity was the same as for the full domain simulations. Although this was calculated for the NG/NITROX mixture, it was also used for the CH4/O2 mixture because the molecular viscosity is generally two orders of magnitude lower than the turbulent viscosity. It follows that the exact value of the molecular dynamic viscosity is not important for the accuracy of the turbulent simulations. The flow solver uses a so-called combustion thermal diffusivity, given by
= µDρ
. (6.21)
The combustion thermal diffusivity D is the molecular diffusivity of the additional transport variables (r, i, YS, NS) and is used in the transport equations of these variables. The source terms of the additional transport variables are either read from the database (for r) or calculated with the data from the database (for i, YS, NS). The boundary conditions and the initialization for the hot flow simulations are as follows. Inlet For the inlet boundary, the Cartesian velocity components, turbulent kinetic energy and turbulent dissipation have been specified from the full domain simulation. The additional transport variables have been set to zero, r = i = YS = NS = 0.

6.5 Results 67
Outlet and wall As for the full domain simulation, the outlet static pressure was pstat = 0 Pa and the gas velocity at the wall was uwall = 0 m s-1. CFX-5 uses the constant gradient constraint for outlet scalar quantities and scalable wall functions for modeling the flow near the wall. Furthermore, CFX-5 employs the condition of no flux across the wall for additional transport variables. Initialization The initial values of the variables u, k, ε and pstat have been taken from the reduced domain cold flow initial values file. For the additional transport variables, the following values have been specified: r = 0.5, i = 0.1, YS = 0.025 and NS = 1014.
6.5 Results 6.5.1 Effect of reactor diameter
The effect of the reactor diameter on the conversion efficiency of the partial oxidation process was studied by performing simulations with three diameter values: 50, 75 and 100 mm. For all three cases, the mixture was NG/NITROX, at the conditions specified in table 6.2. The results are presented in figures 6.4 and 6.5. In figures 6.4a – c, the axial velocity fields for the three reactor diameters are shown. The burner diameter and the inlet flow conditions are kept constant for all three geometries. They are given in tables 6.3 and 6.4, respectively. Figures 6.4a – c show the presence of a central recirculation zone and a corner recirculation zone. The recirculation zones are created by the expansion of the swirling inlet flow in the reactor. Comparing the velocity fields depicted in these figures, it can be noticed that, by increasing the diameter of the reactor, the recirculation zones are also increased. As a result, the hot burnt gases are better mixed with the initial mixture, stabilizing the flame and speeding up the reactions due to the temperature increase of the initial mixture.
Figure 6.4a. Predictions of axial velocity field for the reactor diameter of 50 mm. Premixed NG/NITROX system with φ = 3.1, p = 6 bar and Tin = 673 K. Zero axial velocity lines (dashed lines) delimit the recirculation zones (in the center and at the corner).

68 Simulations of the partial oxidation of natural gas with the combustion model
Figures 6.4b, c. Predictions of axial velocity field for the reactor diameters of 75 mm (b) and 100 mm (c). Premixed NG/NITROX system with φ = 3.1, p = 6 bar and Tin = 673 K. Zero axial velocity lines (dashed lines) delimit the recirculation zones (in the center and at the corner).
Figures 6.5a – e present the axial profiles of the reaction progress variable r, the enthalpy loss variable i, the temperature, the soot mass fraction YS and the soot particle number density NS, respectively, for the three diameters. The axial plots were made at a radial distance of y1 = 9.375 mm from the reactor centerline (through the middle of the inlet), as shown in figure 6.2. In figure 6.5a, the progress of the chemical reactions is indicated by the evolution of r. The picture shows a very fast increase of the RPV r in the first 20 mm of the reactor length. Thus, r increases from 0 (in the inlet) to 0.41 for the 50 mm diameter, to 0.47 for the 75 mm diameter and to 0.51 for the 100 mm diameter. After this initial zone of fast increase, r continues to rise along the reactor, with higher values for higher reactor diameters. At a distance of 350 mm from the inlet, however, this trend changes and the curves corresponding to 75 and 100 mm reactor diameter intersect each other. From that distance on, the values of r for the 100 mm diameter become lower than those for the 75 mm diameter for the rest of the reactor length. Hence, the outlet values of r are 0.58, 0.60 and 0.61 for the reactor diameters of 50, 100 and 75 mm, respectively. These values show that the conversion efficiency of CH4 to H2 and CO is only around 60 %, which means that

6.5 Results 69
the residence time in the reactor (roughly 50 – 100 ms for a mean gas axial velocity of 10 – 20 m s-1) is too short for the mixture to rich equilibrium. This observation is in agreement with the PSR results presented in figure 3.5, section 3.3.1. The corresponding outlet values of mass fractions of H2 (
2HY ) and CO ( COY ) are given in
table 6.5. The faster increase of r from 0 to 20 mm axial distance and its higher values for
larger diameters from 0 to 350 mm are a result of the faster conversion reactions of reactants (CH4, O2) to products (H2, CO). These are provoked by the larger recirculation zones obtained with higher diameters, as discussed in connection with figures 6.4a – c. The lower values of r from 350 to 1,000 mm for the 100 mm diameter reactor than for the 75 mm diameter reactor are explained later, after the discussion on the soot formation. In figure 6.5d, the axial profiles of the soot mass fraction are given. The picture shows that soot is formed more rapidly and in higher amounts for higher reactor diameters. As found previously, the increase of the reactor diameter leads to faster progress of chemical reactions. This in turn determines the earlier onset of soot formation. In the absence of oxidation, the increase of the soot mass fraction along the reactor is driven by an avalanche process. As a result, the earlier start of soot formation corresponds to higher values of YS at the reactor outlet. In this way, the increase of the reactor diameter leads to the increase of the mass fraction of soot. Hence, the mass fraction of soot at the reactor outlet is 0.00125 for the 50 mm diameter, 0.009 for the 75 mm diameter and 0.027 for the 100 mm diameter. The consequences of higher amounts of soot for the larger reactor diameters are higher heat losses due to radiation and subsequently the lower mixture temperatures. These effects are shown in figures 6.5b and 6.5c, where the enthalpy loss variable i and the temperature T were plotted, respectively. Summarizing the arguments presented, there are two opposed effects on natural gas conversion when enlarging the reactor diameter. On one hand, the variable r has a faster initial increase for higher diameters due to better mixing of initial mixture with products. On the other hand, r increases slower along the reactor (smaller slopes of the curves corresponding to larger diameters) because of the raise of the variable i. Higher values of i determine the reduction of the chemical source term of r (lower temperatures). When the latter effect balances the former one, the curves plotted for 75 and 100 mm intersect each other. From that moment on (350 – 1,000 mm), the variable r has lower values for 100 mm reactor diameter than for 75 reactor diameter, as seen in figure 6.5a. In figure 6.5e, the soot particle number density is presented. For all three reactor diameters, the curves show first an increase of the number of particles due to nucleation and then NS decreases as a result of soot agglomeration (see equations (6.10) and (6.14)). By correlating the higher number of particles shown in figure 6.5e with the lower soot mass fraction revealed in figure 6.5d for the lower reactor diameters, we come to the conclusion that the reactors with lower diameter produce less soot with a lower soot mean diameter.
By comparing the simulations results for all three diameters investigated, we can conclude that the reactor with the diameter of 75 mm gives the best conversion of CH4 to H2 and CO (highest value of r, H2 and CO). This reactor shows also a large recirculation zone which insures flame stability and represents a compromise in view of soot production between the reactor with a diameter of 50 mm, characterized by a

70 Simulations of the partial oxidation of natural gas with the combustion model
very low soot level and the 100 mm diameter reactor which gives a very high soot level.
0
0.2
0.4
0.6
0.8
0 200 400 600 800 1,000x (mm)
r
(a)
Figure 6.5a. Predictions of axial profiles of the reaction progress variable r for three reactor diameters: 50 mm (dotted line), 75 mm (solid line) and 100 mm (dashed line). The plots represent results along a line passing through the middle of the inlet (see figure 6.2). Premixed NG/NITROX system with φ = 3.1, p = 6 bar and Tin = 673 K. Table 6.5. H2 and CO mass fractions at the reactor outlet for three reactor diameters: 50, 75 and 100 mm. Mixture: NG/NITROX.
d1 (mm) 2HY
COY
50 0.0301 0.2214 75 0.0316 0.2383 100 0.0310 0.2375

6.5 Results 71
0
0.1
0.2
0.3
0.4
0.5
0 200 400 600 800 1,000x (mm)
i(b)
600
800
1,000
1,200
1,400
1,600
1,800
2,000
0 200 400 600 800 1,000x (mm)
T (
K)
(c)
Figures 6.5b, c. Predictions of axial profiles of the enthalpy loss variable i (b) and the temperature T (c) for three reactor diameters: 50 mm (dotted line), 75 mm (solid line) and 100 mm (dashed line). The plots represent results along a line passing through the middle of the inlet (see figure 6.2). Premixed NG/NITROX system with φ = 3.1, p = 6 bar and Tin = 673 K.

72 Simulations of the partial oxidation of natural gas with the combustion model
0
0.005
0.01
0.015
0.02
0.025
0.03
0 200 400 600 800 1,000x (mm)
YS
(d)
0.0E+00
4.0E+14
8.0E+14
1.2E+15
1.6E+15
2.0E+15
0 200 400 600 800 1,000x (mm)
NS
(par
ticle
s kg
-1)
(e)
Figures 6.5d, e. Predictions of axial profiles of the soot mass fraction YS (d) and the soot particle number density NS (e) for three reactor diameters: 50 mm (dotted line), 75 mm (solid line) and 100 mm (dashed line). The plots represent results along a line passing through the middle of the inlet (see figure 6.2). Premixed NG/NITROX system with φ = 3.1, p = 6 bar and Tin = 673 K.
In figure 6.6 the axial profiles of the mass fractions of H2, CO and C2H2 for the
reactor with the diameter of 75 mm are given. It can be seen that the mass fraction of the products H2 and CO follow the same pattern as the reaction progress variable r (see figure 6.5a, solid line). Thus, in the first 20 mm of the reactor length, the mass fractions of H2 and CO increase very fast from 0 to 0.0245 for H2 and 0.18 for CO. After this initial zone, the mass fractions continue to rise slowly along the reactor up

6.5 Results 73
to the outlet values of 0.0316 for H2 and 0.238 for CO. The mass fraction of C2H2 has an intermediate species like behavior. Hence, it increases from 0 to 0.05 in the previously mentioned initial zone and than decreases to 0.0284 in the outlet.
0
0.05
0.1
0.15
0.2
0.25
0 200 400 600 800 1,000x (mm)
YH
2, Y
CO, Y
C2H
2
Figure 6.6. Predictions of axial profiles of H2 (solid line), CO (dashed line) and C2H2 (dotted line) mass fractions for the reactor with the diameter of 75 mm. The plots represent results along a line passing through the middle of the inlet (see figure 6.2). Premixed NG/NITROX system with φ = 3.1, p = 6 bar and Tin = 673 K.
Figure 6.7 shows the axial profiles of H2O, CH4 and O2 mass fractions. The mass fraction of H2O increases rapidly in the initial zone (first 10 mm) because of the combustion reactions of CH4 with O2 and than decreases slowly as a result of the reforming reactions which take place in the rest of the reactor. This behavior of the partial oxidation process was already discussed in section 4.3.3. The presence of the combustion reactions zone is also proved by the rapid consumption of all the O2 and a part of CH4, as illustrated in figure 6.7. In figure 6.7 only the first 200 mm of the reactor length were taken into account in order to emphasis the initial fast reaction (combustion) zone and because the profiles of the species mass fractions continue the trends shown for the rest of the reactor.
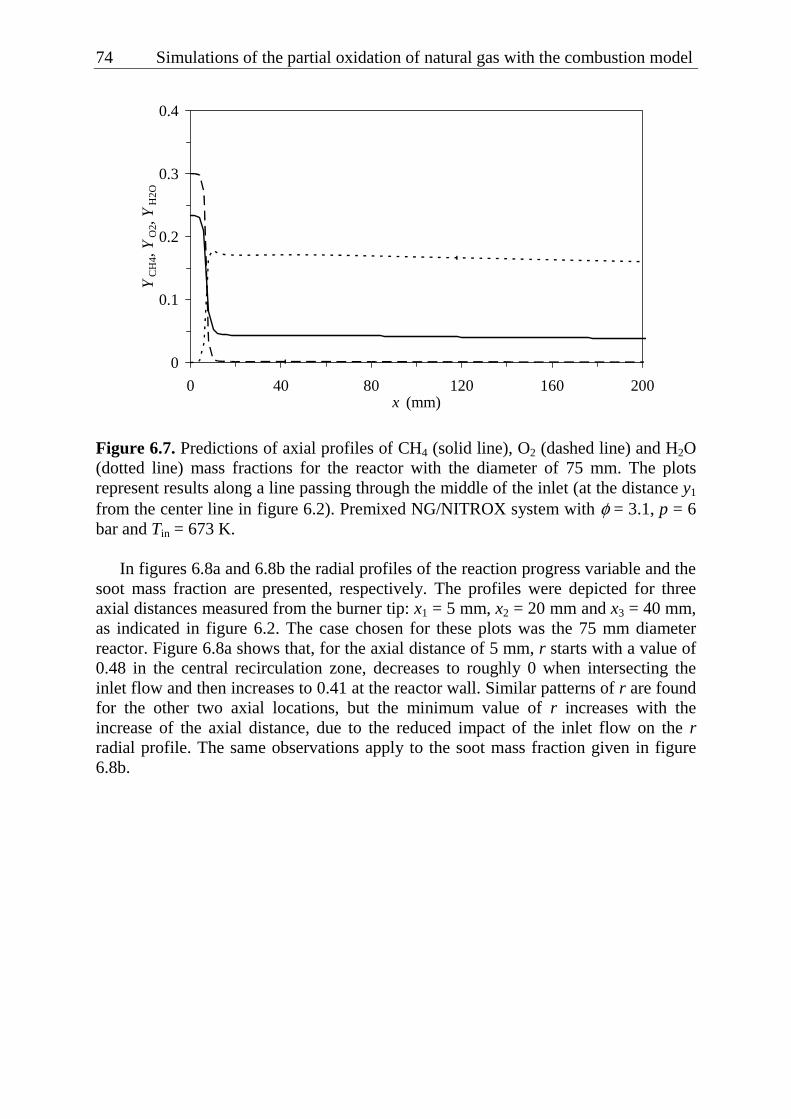
74 Simulations of the partial oxidation of natural gas with the combustion model
0
0.1
0.2
0.3
0.4
0 40 80 120 160 200x (mm)
YC
H4,
YO
2, Y
H2O
Figure 6.7. Predictions of axial profiles of CH4 (solid line), O2 (dashed line) and H2O (dotted line) mass fractions for the reactor with the diameter of 75 mm. The plots represent results along a line passing through the middle of the inlet (at the distance y1 from the center line in figure 6.2). Premixed NG/NITROX system with φ = 3.1, p = 6 bar and Tin = 673 K.
In figures 6.8a and 6.8b the radial profiles of the reaction progress variable and the soot mass fraction are presented, respectively. The profiles were depicted for three axial distances measured from the burner tip: x1 = 5 mm, x2 = 20 mm and x3 = 40 mm, as indicated in figure 6.2. The case chosen for these plots was the 75 mm diameter reactor. Figure 6.8a shows that, for the axial distance of 5 mm, r starts with a value of 0.48 in the central recirculation zone, decreases to roughly 0 when intersecting the inlet flow and then increases to 0.41 at the reactor wall. Similar patterns of r are found for the other two axial locations, but the minimum value of r increases with the increase of the axial distance, due to the reduced impact of the inlet flow on the r radial profile. The same observations apply to the soot mass fraction given in figure 6.8b.

6.5 Results 75
0
0.1
0.2
0.3
0.4
0.5
0.6
0 10 20 30 40y (mm)
r(a)
0
0.00025
0.0005
0.00075
0.001
0.00125
0 10 20 30 40y (mm)
YS
(b)
Figure 6.8. Predictions of radial profiles of the reaction progress variable r (a) and the soot mass fraction YS (b) for three axial distances: x1 = 5 mm (solid line), x2 = 20 mm (dashed line) and x3 = 40 mm (dotted line) (see also figure 6.2). Reactor diameter 75 mm. Premixed NG/NITROX system with φ = 3.1, p = 6 bar and Tin = 673 K. 6.5.2 Effect of methane and oxygen concentrations in the mixture The conversion efficiency of the partial oxidation process was also investigated for a second type of mixture, CH4/O2. The specifications of this mixture are given in table 6.2. The results of the simulations for the two types of mixtures, NG/NITROX and CH4/O2, are compared in figures 6.9a – e. The reactor diameter for both mixtures is 75

76 Simulations of the partial oxidation of natural gas with the combustion model
mm. In figure 6.9a the axial profile of the reaction progress variable r is depicted. The curves show a faster increase of the variable r along the length of the reactor for CH4/O2 mixture as compared to the NG/NITROX mixture. The explanation is that the CH4/O2 mixture has a higher top temperature, as shown in figure 6.9c, and is more reactive due to the lack of N2 dilution. The reactor outlet values of r are 0.75 for the CH4/O2 mixture and 0.61 for the NG/NITROX mixture. The corresponding values of the H2 and CO mass fractions are given in table 6.6. Examining the numbers from table 6.6, it can be noticed that both H2 and CO mass fractions are more then double for the CH4/O2 system as compared to NG/NITROX mixture. The side effect of the faster conversion of reactants to products is, as discussed in the previous section, the earlier onset of soot formation. Another factor which favors the formation and growth of soot in the case of CH4/O2 mixture is the higher mass fraction of acetylene, which is the soot precursor in the present model. This is also a consequence of the absence of N2 from the system. Thus, the mass fraction of soot for the CH4/O2 mixture is double (0.008) compared to the NG/NITROX system (0.004) at half the reactor length (500 mm). However, the difference at the reactor outlet becomes negligible due to the much slower increase of the YS in the second part of the reactor for the CH4/O2 mixture, as can be noticed in figure 6.9d. This is caused by the decrease of the temperature (see figure 6.9c) associated with a high heat loss from soot radiation and the lack of C2H2 species. The latter effect is explained by the fact that in the CH4/O2 system, the progress of the conversion of reactants to products is faster than in the NG/NITROX system, and as a result, the intermediates like C2H2 are exhausted earlier. Figure 6.9b shows the axial profile of the enthalpy loss variable. In spite of the higher soot mass fractions obtained for the CH4/O2 mixture, which lead to more important heat losses, the curve of i corresponding to the CH4/O2 mixture is lower than that plotted for the NG/NITROX mixture. This is justified by the normalization of the enthalpy loss through the adiabatic enthalpy when calculating the variable i (see definition (4.1), section 4.3.1). It should be noted that the CH4/O2 mixture has a much higher absolute value of the adiabatic enthalpy than the NG/NITROX system, due to the much higher content of CH4, which adds the main component to the total enthalpy of the mixture in form of its enthalpy of formation. Based on the arguments presented above, it can be concluded that the shape of i curves is more important than the values. Thus, i increases monotonically for the NG/NITROX mixture, while for CH4/O2 mixture, i reaches a maximum and then decreases slightly. The reason is that, for the NG/NITROX mixture, the soot mass fraction increases monotonically and the temperature is permanently higher than the reactor wall temperature (1,600 K), while for the CH4/O2 system, YS is almost constant in the last part of the reactor and the temperature becomes slightly lower then the wall temperature at the outlet of the reactor, as can be seen in figure 6.9c and 6.9d. In figure 6.9e, the soot particle number density was plotted, for the two types of mixture. The NS curves present an initial increase of the number of particles until NS reaches a maximum and then it decreases, due to the agglomeration of the soot particles in larger aggregates. By correlating the higher number of particles shown in figure 6.9e with the lower soot mass fraction revealed in figure 6.9d for the NG/NITROX mixture, we come to the conclusion that the NG/NITROX system produces less soot with a lower mean diameter than the CH4/O2 mixture.
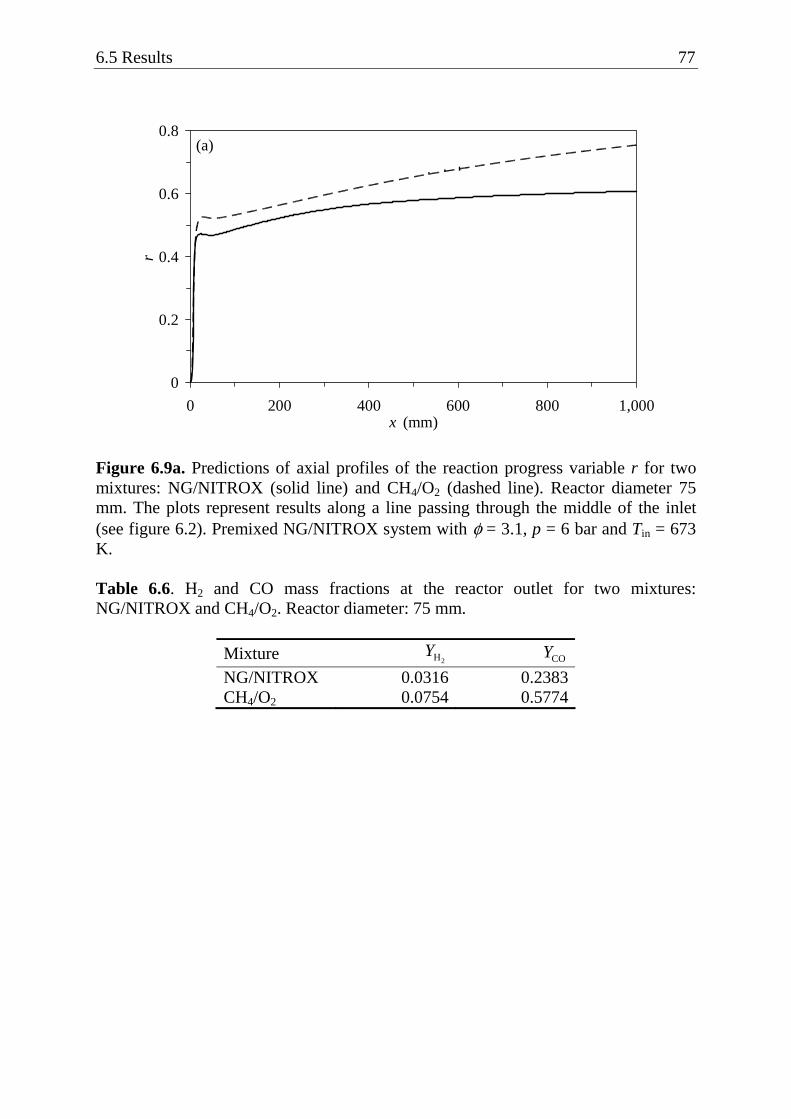
6.5 Results 77
0
0.2
0.4
0.6
0.8
0 200 400 600 800 1,000x (mm)
r(a)
Figure 6.9a. Predictions of axial profiles of the reaction progress variable r for two mixtures: NG/NITROX (solid line) and CH4/O2 (dashed line). Reactor diameter 75 mm. The plots represent results along a line passing through the middle of the inlet (see figure 6.2). Premixed NG/NITROX system with φ = 3.1, p = 6 bar and Tin = 673 K. Table 6.6. H2 and CO mass fractions at the reactor outlet for two mixtures: NG/NITROX and CH4/O2. Reactor diameter: 75 mm.
Mixture 2HY
COY
NG/NITROX 0.0316 0.2383 CH4/O2 0.0754 0.5774

78 Simulations of the partial oxidation of natural gas with the combustion model
0
0.1
0.2
0.3
0 200 400 600 800 1,000x (mm)
i(b)
600
800
1,000
1,200
1,400
1,600
1,800
2,000
0 200 400 600 800 1,000x (mm)
T (
K)
(c)
Figures 6.9b, c. Predictions of axial profiles of the enthalpy loss variable i (b) and the temperature T (c) for two mixtures: NG/NITROX (solid line) and CH4/O2 (dashed line). Reactor diameter 75 mm. The plots represent results along a line passing through the middle of the inlet (see figure 6.2). Premixed NG/NITROX system with φ = 3.1, p = 6 bar and Tin = 673 K.

6.5 Combustion regimes 79
0
0.0025
0.005
0.0075
0.01
0.0125
0 200 400 600 800 1,000x (mm)
YS
(d)
0.0E+00
4.0E+14
8.0E+14
1.2E+15
1.6E+15
2.0E+15
0 200 400 600 800 1,000x (mm)
NS
(par
ticle
s kg
-1)
(e)
Figures 6.9d, e. Predictions of axial profiles of the soot mass fraction YS (d) and the soot particle number density NS (e) for two mixtures: NG/NITROX (solid line) and CH4/O2 (dashed line). Reactor diameter 75 mm. The plots represent results along a line passing through the middle of the inlet (see figure 6.2). Premixed NG/NITROX system with φ = 3.1, p = 6 bar and Tin = 673 K.
6.6 Combustion regimes
In section 4.3.3, it was assumed that the investigated partial oxidation process takes place within the distributed reaction zone regime. The microstructure of the

80 Simulations of the partial oxidation of natural gas with the combustion model
distributed reaction zone was modeled as a spectrum of perfectly stirred reactors over a range of residence times and heat losses. Thus, the thermo-chemical databases used by the combustion model were based on PSR calculations. In order to validate this assumption, the Damköhler number was determined and the Borghi diagram was built, using the results of the CFD simulations of the NG/NITROX and CH4/O2 systems in the reactor with the diameter of 75 mm. The data correspond to the axial profiles (given in figures 6.5 (solid line), section 6.5.1), along a line passing through the middle of the inlet. The Damköhler number Da is defined as
ph
ch
=τ
Daτ
, (6.22)
where τph is the physical time scale and τch is the chemical time scale. The latter two are given by
ph =′
lτu
, (6.23)
ch =r
ρτS
. (6.24)
In equation (6.23), u′ is the turbulent intensity and l is the turbulent length scale. They are calculated with [47, 60]
0.5
2
3⎛ ⎞′ = ⎜ ⎟⎝ ⎠
u k , 3′
= ul
ε. (6.25)
In the last two equations, k is the turbulent kinetic energy and ε is the turbulent dissipation. In equation (6.24), ρ is the mixture density and Sr is the chemical source term of reaction progress variable r. Variables k, ε, ρ and Sr are taken from the simulation results. u′, l, τph τch and Da are calculated from Eqs. (6.22) – (6.25). The resulted Damköhler numbers for both NG/NITROX and CH4/O2 mixtures are plotted in figure 6.10 as functions of the axial distance in the reactor. The low values of Da in the beginning of the reactor are caused by the absence of the chemical reaction in the initial mixture. The following steep increase of Da to about 0.065 for the NG/NITROX system and 0.463 for the CH4/O2 system indicates the decrease of the chemical time scale. This corresponds to fast combustion reactions which take place in the first part of the reactor and correlates well with the fast raise of r showed in figure 6.9a, section 6.5.2. The significantly higher peak value of Da shown by CH4/O2 system in comparison with the NG/NITROX system (almost 8 times higher) is a result of faster combustion reactions taking place in the former system. This was observed also in relation with the source term of r for the two mixtures (see figure 6.1, section 6.3). After the peak, Da decreases continuously until the end of the reactor, as a result of the high chemical time scales characteristic to the reforming reactions which take

6.6 Combustion regimes 81
place in the last part of the reactor. In figure 6.10 only the first 200 mm of the reactor length was considered, because the trends of the Da curves continue in the rest of the reactor, with values of Da slightly higher for the CH4/O2 mixture than for the NG/NITROX mixture. The division of the partial oxidation process in a combustion zone and a reforming zone was discussed in section 4.3.3 in connection with figures 4.1a and 4.2 and in section 6.5.1 when referring to figure 6.7.
The low values of Da (much less than unity) shown in figure 6.10 indicate that the chemistry is always slower than the mixing for the partial oxidation process. The slow chemical time scales in the combustion model are caused by the mapping of the reaction mechanism on the mass fraction of a major species (H2). Since the time scale of H2 formation is slow, the fast time scales corresponding to the production and consumption of radicals (e.g. H) are not present in the chemical source term of r (Sr), but taken into account implicitly. Hence, the assumption of reactor microstructure modeling as a spectrum of perfectly stirred reactors is justified.
0
0.1
0.2
0.3
0.4
0.5
0 40 80 120 160 200x (mm)
Da
Figure 6.10. Damköhler numbers Da for NG/NITROX (solid line) and CH4/O2 (dashed line) mixtures. Da was plotted as a function of the axial distance in the reactor, for the first 200 mm of the reactor length.
To support the distributed reaction regime hypothesis, an additional step was also
undertaken. This was the construction of a Borghi diagram and the placing of simulations results in it. The laminar flame speeds of the mixtures used in the simulations discussed previously (NG/NITROX system, p = 6 bar, Tin = 673 K and CH4/O2 system, p = 20 bar and Tin = 673 K) were determined with the code PREMIX. The values obtained were NG/NITROX
Ls = 19.05 cm s-1 for the former and 4 2CH /OLs = 28.49
cm s-1 for the latter. Then, equal diffusivities for all reactive scalars and a Schmidt number Sc = ν/D of unity were assumed for each case (ν is the kinematic viscosity and D is the molecular diffusivity). The relations used in the following are taken from [47, 60]. The flame thickness lF and the flame time tF were defined as

82 Simulations of the partial oxidation of natural gas with the combustion model
FL
= Dl
s, F 2
L
= Dt
s. (6.26)
Using u′ and l introduced in equations (6.25), the turbulent Reynolds number ReT was calculated with
TL F
′= u l
Res l
(6.27)
and the Damköhler number with
L
F
=′
s lDa
u l. (6.28)
Furthermore, the Karlovitz number Ka is defined as
F=η
tKa
t, (6.29)
where tη is the Kolmogorov time, calculated with
0.5
⎛ ⎞= ⎜ ⎟⎝ ⎠
ην
tε
. (6.30)
The resulted Borghi diagrams for NG/NITROX and CH4/O2 mixtures are presented in figures 6.11a and b, respectively. The symbols represent the points taken from the simulations. Only the points corresponding to the combustion zone were plotted. The reason is that the laminar flame speed, flame thickness and flame time are relevant for the fast reactions of the combustion zone but not for the much slower reactions of the reforming zone. It can be noticed that the points are found above the line Da = 1 for the NG/NITROX system and between the lines Da = 1 and Ka = 1 for the CH4/O2 system. Thus, the combustion part of the partial oxidation process is located in the perfectly stirred reactor and the distributed reaction zone regimes for the NG/NITROX and CH4/O2 mixtures, respectively.

6.7 Conclusions 83
0.1
1
10
100
1000
10000
0.1 1 10 100 1000 10000l /l F
u'/s
LDa =1
Ka =1Re T=1
Wrinkled flamelets
Corrugated flamelets (Ka <1)
Distributed reaction zones(Da >1, Ka >1)
Perfectly stirred reactor(Da <1)
Laminar flames(Re T<1)
u '/s L=1
(a)
0.1
1
10
100
1000
10000
0.1 1 10 100 1000 10000l /l F
u'/s
L
Da =1
Ka =1Re T=1
Wrinkled flamelets
Corrugated flamelets (Ka <1)
Distributed reaction zones(Da >1, Ka >1)
Perfectly stirred reactor(Da <1)
Laminar flames(Re T<1)
u '/s L=1
(b)
Figure 6.11. Borghi diagrams for the combustion part of the partial oxidation process. (a) NG/NITROX mixture, (b) CH4/O2 mixture. The symbols indicate the points taken from the simulations.
6.7 Conclusions
The results show that the turbulent rich combustion model is able to calculate the velocity field, gaseous chemical reactions progress, soot formation and heat loss for the partial oxidation of natural gas. The simulations point out the predicted effects of the reactor diameter and concentrations of CH4 and O2 in the mixture on the

84 Simulations of the partial oxidation of natural gas with the combustion model
conversion efficiency and on the soot production in the partial oxidation process. However, the predictions of soot reported by the model have more a qualitative than a quantitative value. This is caused by the absence of the soot oxidation from the soot formation process, possibly leading to over predicted values of soot mass fraction.
Based on the simulations of the three diameters investigated, we can conclude that the reactor with the diameter of 75 mm gives the best conversion of CH4 to products (highest value of r, H2 and CO). This reactor shows also a large recirculation zone which insures flame stability. As far as the soot formation is concerned, it represents a compromise between the reactor with the diameter of 50 mm, characterized by a very low soot level and the 100 mm diameter reactor which gives a very high soot level.
When compared to the NG/NITROX mixture, the CH4/O2 mixture is characterized by a higher conversion of CH4 to products, shown by the superior values of the reaction progress variable r, which determines higher mass fractions of H2 and CO. The drawback is the increased soot formation for the CH4/O2 system, resulting in higher soot mass fraction in the mixture. This is accompanied by amplified heat loss to the reactor walls, which lowers the mixture temperature and thus slows down the conversion rate of CH4 to products.
The thermo-chemical databases used by the combustion model to simulate the partial oxidation process have been based on the assumption of a distributed reaction regime. This was checked by calculating Damköhler numbers and building Borghi diagrams for the cases investigated. It was found that the Damköhler number is lower than unity for both NG/NITROX and CH4/O2 mixtures, in all zones of the partial oxidation process (combustion and reforming). Hence, the assumption of a distributed reaction regime was correct. It was also shown in Borghi diagrams that the combustion part of the process is located in the perfectly stirred reactor and distributed reaction regime for the NG/NITROX and CH4/O2 mixtures, respectively.

Chapter 7
Conclusions and recommendations
7.1 Conclusions
In chapter 2, the partial oxidation gas turbine plant was introduced. This is the integrated plant of a partial oxidation reactor, a syngas turbine and an air separation unit. Natural gas is partially oxidized to hot syngas by oxygen in a reactor. The synthesis gas produced is expanded in the turbine which converts the syngas sensible heat to power. This is used to run the air separation unit. In the same chapter, the exergy analysis of the plant was presented as well. The analysis shows that the proposed process has a high exergetic efficiency (82.8 %). The investigation also proves that the plant is self-supporting (positive net output power). The plant produces syngas with a H2/CO molar ratio of about 2, which is optimal for the Fisher-Tropsch (FT) synthesis of high quality middle distillates. In view of the conclusions presented above, the proposed process is considered a competitive route for the conversion of natural gas to synthetic fuel with application to monetizing stranded natural gas. When compared to conventional processes for syngas production, the partial oxidation system presented here offers the advantages of energetic autonomy, compactness and high efficiency. It should be noticed that a gas turbine is about 10 – 100 times more compact than a steam boiler in a conventional POX, an ATR or a SMR unit.
In chapter 3, the partial oxidation process of natural gas has been simulated in freely propagating flames and perfectly stirred reactors (PSR). Different types of mixtures and operating conditions have been numerically investigated. The examination of the upper flammability limits (UFL) of CH4/O2, NG/NITROX and CH4/Air mixtures shows that all these mixtures are between the flammability limits for the conditions studied. These are equivalence ratios between 1 and 4, pressures greater than or equal to 6 bar and an initial temperature of 673 K. The freely propagating flames simulations indicate that ultra rich NG/NITROX mixtures at a pressure of 6 bar and with an initial temperature of 673 K have laminar flame speeds in the range 10 – 300 cm s-1. For all rich mixtures analyzed, the laminar flame speed is a function of the adiabatic flame temperature following an Arrhenius type expression. The activation temperature is about 20,000 K and has a minor dependence on the type of the mixture. The pre-exponential coefficient is a strong function of the type of the mixture. The expressions found are best fitted to ultra rich mixtures, with equivalence ratios in the range 2.5 – 4. The post flame zone of ultra rich flames is dominated by slow endothermic reforming reactions of CH4 with H2O. This is in contrast with stoichiometric flames, for which the post flame zone is in equilibrium. The PSR calculations show that, for CH4/O2 mixtures with equivalence ratios in the range 1 – 2.5 and NG/NITROX mixtures with equivalence ratios from 1 to 2, the products of the CH4 combustion/partial oxidation are in equilibrium. For ultra rich mixtures

86 Conclusions and recommendations
(equivalence ratio of 2.5 – 4 for CH4/O2 and 2 – 4 for NG/NITROX), the conversion efficiency of the partial oxidation process increases with increasing residence time and decreases with the equivalence ratio for practical residence times (50 − 1,000 ms). The latter effect manifests itself at lower equivalence ratios for the NG/NITROX mixtures than for CH4/O2 mixtures. The PSR results also point out that the residence time necessary to approach equilibrium in ultra rich mixtures, for best conversion of CH4 to H2 and CO, is very long, in excess of 1,000 ms. Another conclusion related to equilibrium mole fractions of H2 and CO is that the maximum production of these products is achieved at an equivalence ratio of 3.5. Regarding the pressure influence on the partial oxidation process, the conclusion is that, the conversion efficiency of CH4 to H2 and CO decreases with pressure, provided that chemical equilibrium is reached. For non-equilibrium conditions, however, it was found that the conversion efficiency in the partial oxidation process increases with pressure. As for C2H2, considered the soot precursor, it was shown that C2H2 is not present in partial oxidation mixtures at equilibrium and that the production of C2H2 in non-equilibrium conditions decreases with pressure.
In chapters 4 and 5, the turbulent rich combustion model is presented in parts. Thus, chapter 4 describes the gas phase model and in chapter 5 the soot model is given. The gas phase model uses the reaction progress variable (RPV) r and the enthalpy loss variable i to account for the progress of gaseous chemical reactions and the heat loss due to soot radiation, respectively. Soot formation is based on the empirical processes of nucleation, surface growth, agglomeration and oxidation and is quantified by two parameters. These are the soot mass fraction YS and the soot particle number density NS.
In chapter 6, the combustion model has been used to simulate the partial oxidation process. The CFD results show that the turbulent rich combustion model is an useful tool for predicting the velocity field, gaseous chemical reactions progress, soot formation and heat loss in specific partial oxidation reactor design. The simulations point out the effects of the reactor diameter and the concentrations of CH4 and O2 in the mixture on the conversion efficiency and the soot production in the partial oxidation process. Nevertheless, the predictions of soot reported by the model have more a qualitative than a quantitative value. This is caused by the absence of the soot oxidation from the soot formation process, leading to over predicted values of soot mass fraction. Based on the simulations of the three diameters investigated, we can conclude that the reactor with the diameter of 75 mm gives the best conversion of CH4 to products (highest value of the reaction progress variable r and subsequently of H2 and CO). This reactor shows also a large recirculation zone which insures flame stability. As far as the soot formation is concerned, it represents a compromise between the reactor with a diameter of 50 mm, characterized by a very low soot level and the 100 mm diameter reactor which gives a very high soot level. When compared to the NG/NITROX mixture, the CH4/O2 mixture is characterized by a higher conversion of CH4 to products, proved by the superior values of r, which determines higher mass fractions of H2 and CO. The drawback is the increased soot formation for the CH4/O2 system, resulting in higher soot mass fraction in the mixture. This is accompanied by amplified heat loss to the reactor walls, which lowers the mixture temperature and thus slows down the conversion rate of CH4 to products.

7.2 Recommendations for future research 87
In chapter 6, the combustion regimes in the partial oxidation process have been also analyzed. The thermo-chemical databases used by the combustion model to simulate partial oxidation processes have been based on the assumption of a distributed reaction regime. This was checked by calculating Damköhler numbers and building Borghi diagrams for the cases investigated. It was found that the Damköhler number is lower than unity for both NG/NITROX and CH4/O2 mixtures, in all zones of the partial oxidation process (combustion and reforming). It was also shown in Borghi diagrams that the combustion part of the process is located in the perfectly stirred reactor and distributed reaction regime for the NG/NITROX and CH4/O2 mixtures, respectively. Hence, the assumption of the distributed reaction regime for the partial oxidation process is justified.
7.2 Recommendations for future research In chapter 2, the partial oxidation gas turbine plant was investigated. The exergy analysis of the plant for a case study was given. This showed that the plant had high exergetic efficiency. However, the syngas exited the POGTP at 1 bar. Most applications require synthesis gas at elevated pressures. As a result, the syngas produced by the proposed plant has to be compressed. In section 2.3.3, it was mentioned that in case of using an air separation unit dedicated to the partial oxidation process, optimized for high pressure gaseous oxygen production, the work consumed by the ASU could be significantly reduced. The work saved was thought to be enough to run syngas compressors. From this discussion two optimization issues arise. First, an alternative ASU, with lower power consumption should replace the one used in the case study. Second, the expansion ratio of the turbine and the compression ratio of the syngas compressors should be optimized for the best efficiency of the plant and the most appropriate use of the syngas. In chapter 4, the gas phase model developed for the prediction of gaseous species and temperature in the partial oxidation process was described. The model uses a reaction progress variable in conjunction with a thermo-chemical database. The RPV monitors the progress of chemical reactions. The database prescribes the corresponding gaseous species concentrations and temperature. The construction of the database was based on the assumption that the microstructure of the partial oxidation reactor is a spectrum of perfectly stirred reactors over a range of residence times and heat losses. The model could benefit from the increase of the degrees of freedom of the chemical system by using two or three RPVs. This should be correlated with the construction of a more general database, by solving a system of equations consisting of element conservation equations, RPVs definition relations, steady-state species equations and enthalpy equation (see also section 4.3.3). The mapping of the chemical system on RPVs could be achieved with the computational singular perturbation (CSP) [34] or intrinsic low-dimensional manifolds (ILDM) [33] reduction techniques. Furthermore, the model could be applied also to non-homogeneous premixed, partially premixed or non-premixed partial oxidation by including an extra equation for mixture fraction. In section 4.3.2, it was pointed out that the turbulent rich combustion model uses single delta functions for the probability

88 Conclusions and recommendations
density functions (PDFs) of the RPV r and the enthalpy loss variable i, thus neglecting the effect of turbulent fluctuations on combustion chemistry. An issue of investigation might be the influence of these fluctuations, by involving beta functions for the PDFs of the combustion scalars (RPVs, enthalpy variable, mixture fraction). In this case, additional variance equations for all combustions scalars for which beta functions are used should be included in the model. In chapter 6, the results of the partial oxidation simulations have been presented. In the last part of section 6.2, it was shown that the soot oxidation was not taken into account for the simulations reported. The reason was that the soot oxidation rates were higher than the soot surface growth rates. The drawback was the high levels of soot obtained for some of the cases investigated (see figure 6.5d, section 6.5.1 and figure 6.9d, section 6.5.2). It is therefore recommended the validation of the numerical predictions with measurements made within the foreseen experiments at University of Twente. Based on the comparison of numerical and measured values for species concentrations, temperature and soot mass fraction, the reaction rates constants (especially for soot oxidation) could be adjusted to improve the model predictions. Once the predictions validated with experimental data, the model should be used to develop means of improving the conversion efficiency of natural gas to syngas and reducing the soot formation in the partial oxidation process. Finally, two summarizing conclusions may be formulated. First, the proposed partial oxidation process converts natural gas to syngas (H2 and CO) in a compact installation (POGTP) which has high exergetic efficiency and is independent of external sources of energy. This is accomplished with the use of a gas turbine (SGT) which expands the produced syngas to generate mechanical power. Second, the developed combustion model can be used for the numerical simulation of three-dimensional, non-adiabatic, turbulent, rich, premixed flames, as obtained by partial oxidation of natural gas. The model successfully couples the gas phase chemistry with the soot formation under fuel rich conditions. Therefore, the model can be employed as a CFD tool for design optimization of partial oxidation reactors.

Nomenclature Acronyms ASU air separation unit ATR autothermal reforming C oxygen compressor CFD computational fluid dynamics CSP computational singular perturbation DME di-methyl-ether FT Fischer-Tropsch GAN gaseous nitrogen GOX gaseous oxygen GTL gas-to-liquid HACA H abstraction C2H2 addition HE heat exchanger ILDM intrinsic low-dimensional manifolds LAR liquid argon LIN liquid nitrogen LOX liquid oxygen M oxygen mixer MTBE methyl tert-butyl ether NG natural gas NITROX mixture of nitrogen and oxygen PAH polycyclic aromatic hydrocarbons PDF probability density function POGTP partial oxidation gas turbine plant POR partial oxidation reactor POX partial oxidation PSR perfectly stirred reactor RANS Reynolds averaged Navier Stokes equations RMS root mean square RPV reaction progress variable SGT syngas turbine SMDS Shell middle distillate synthesis SMR steam methane reforming TEM transmission electron microscopy UFL upper flammability limit

90 Nomenclature
Latin A cross-sectional area m2 A pre-exponential factor of reaction rate constant K, kmole, m, s AS soot surface per unit volume m2 m-3 AL pre-exponential factor of laminar flame speed cm s-1 b temperature exponent of reaction rate constant − C carbon atom − CS,rad soot radiation constant m-1 K-1 CS,ap soot particle agglomeration constant − CHACA constant of HACA mechanism − Cn,soot n carbon atoms of soot − Csoot one carbon atom of soot − Csoot• soot radical − Csoot−H arm-chair site on soot particle − [Csoot−H] surface density of Csoot−H sites sites m-2 CH4 methane − C2H2 acetylene − C2H4 ethylene − CmHn hydrocarbon − CO carbon monoxide − CO2 carbon dioxide − Cµ, Cε1, Cε2 k-ε turbulence model constants − cp constant-pressure heat capacity of mixture kJ kg-1 K-1 cp,i constant-pressure heat capacity of species i kJ kg-1 K-1 Da Damköhler number − DΦ molecular diffusion coefficient of variable Φ m2 s-1 Di,m mixture averaged diffusion coefficient of
species i m2 s-1
d1 reactor diameter mm d2 burner inner diameter mm d3 burner tip diameter mm dann diameter of annular passage m dS mean soot particle diameter m E flow exergy kW Ea activation energy kJ kmol-1 e exergy kJ mol-1 F function in definition relation of r − F* function in transport equation of r − f function of general variable Φ − fS soot volume fraction − ∆Gi(T0,p0) variation of Gibbs free energy in combustion
reaction of species i kJ mol-1
g gravitational acceleration vector m s-2 gi(T0,p0) Gibbs free energy of formation of species i kJ mol-1

91
H hydrogen atom − H2 hydrogen − H2O water − h mixture enthalpy kJ kg-1 ∆h heat of reaction kJ mol-1 hi enthalpy of species i kJ kg-1 I irreversibility kW i enthalpy loss variable − Ji diffusion mass flux vector of species i kg m-2 s-1 Jq heat flux vector kJ m-2 s-1 Ka Karlovitz number − KS Plank mean absorption coefficient of soot m-1 k turbulent kinetic energy m2 s-2 kj reaction rate constant of reaction j K, kmole, m, s Lei Lewis number of species i − l turbulent length scale m l1 reactor length mm l2 reduced modeling domain position mm lF flame thickness m M number of reactions − Max axial thrust m5 s-2 Mtan axial flux of angular momentum m5 s-2 m number of carbon atoms in a hydrocarbon − m& mass flow rate kg s-1 N number of species − N2 nitrogen − NA Avogadro number atom kmol-1 NC,min minimum number of carbon atoms in incipient
soot particle −
Ni moles of species i mole NS soot particle number density soot particles kg-1 n number of hydrogen atoms in a hydrocarbon − ni normalized moles of species i produced
through moles of CH4 introduced −
np soot particle number soot particles m-3 O2 oxygen − OH hydroxyl radical − P probability density function − Pk shear production in k-ε model kg m-1 s-3 p pressure bar p* modified pressure in Favre-averaged
momentum equation bar
pi partial pressure of species i − qrad heat loss due to radiation kJ m-3 s-1 R universal gas constant kJ kmol-1 K-1

92 Nomenclature
ReT turbulent Reynolds number − r radius m r reaction progress variable − Sw swirl number − SΦ chemical source term of variable Φ kg m-3 s-1 or
soot particles m-3 s-1 ScΦ Schmidt number of variable Φ − sL laminar flame speed cm s-1 s entropy kJ mol-1 K-1 T temperature K Ta activation temperature K Tad adiabatic flame temperature K Twall reactor wall temperature K t time s tF flame time s tη Kolmogorov time s Ui diffusion velocity vector of species i m s-1 u mean velocity vector m s-1 u mixture velocity in x direction m s-1 u′ turbulent intensity m s-1 uax axial velocity m s-1 ui velocity vector of species i m s-1 utan tangential velocity m s-1 V volume of PSR m3 W mechanical work/power kW W average molecular weight (kg kmol-1) kg kmol-1 Wi molecular weight of species i kg kmol-1 wFW factor of soot surface growth reaction rate kg m-2 s-1 wnu soot nucleation rate kmol m-3 s-1 wox,i soot oxidation rate by species i kmol m-2 s-1 or
kg m-2 s-1 or s-1 wpa soot particle agglomeration rate particles m-3 s-1 wsg soot surface growth rate kg m-2 s-1 Xi mole fraction of species i − x spatial coordinate m x1, x2, x3 axial locations of radial plots mm Yi mass fraction of species i − YS soot mass fraction − y spatial coordinate m y1 radial location of axial plots mm

93
Greek
αΦ soot nucleation function of variable Φ kg m-3 s-1 or particles m-3 s-1
αFW empirical (steric) factor in HACA surface growth reaction rate
−
βΦ soot surface growth and oxidation or agglomeration function of variable Φ
kg soot1/3 kg particles -1/3 m-3 s-1 or kg2 kg soot-1/6
particles-5/6 m-3 s-1 δ unit tensor − ε turbulent dissipation m2 s-3 εi mass flux fractions of species i − Φ general variable − φ fuel equivalence ratio − ΓΦ diffusion coefficient of variable Φ kg m-1 s-1 γΦ soot oxidation function of variable Φ kg m-3 s-1 η Kolmogorov length scale m ηex exergetic efficiency − λ thermal conductivity of mixture W m-1 K-1 µ dynamic viscosity kg m-1 s-1 ν kinematic viscosity m2 s-1 νij stoichiometric coefficient of species i in
reaction j −
ρ mixture density kg m-3 ρS soot density kg m-3 σ Stefan-Boltzmann constant W m-2 K-4 σB Boltzmann constant J K-1 σk, σε k-ε turbulence model constants − τ viscous stress tensor kg m-1 s-2 τ residence time ms Ωi chemical symbol of species i − [Ωi] concentration of species i kmol m-3 s-1
iω& molar rate of production of species i kmol m-3 s-1
ζ bulk viscosity kg m-1 s-1 Subscripts and superscripts 0 environmental state or reference conditions ad adiabatic b backward ch chemical eff effective

94 Nomenclature
eq equilibrium FW refers to HACA mechanism of Frenklach and Wang f forward i species index in entering flow or inlet/initial conditions j reactions index m exponent of pressure mix mixture n n-th central moment of variable Φ out exiting flow ph physical T turbulent Operators and other symbols T transposed (vector/tensor) ∇ gradient/divergence ∂ partial differentiation D total differentiation ⊗ dyadic product (of vectors) : contraction (of tensors)
Reynolds mean ′ Reynolds fluctuation or reactants % Favre mean ″ Favre fluctuation or products

Appendix A
Chemical exergy of hydrogen and carbon monoxide
The stoichiometric combustion of hydrogen with oxygen is described by the reaction 2 2 2H 0.5O H O+ = . (A.1) The chemical exergy of hydrogen is given by
( ) 2
2 2
2
0.5O
ch,H H 0 0 0H O
, ln⎛ ⎞
= −∆ + ⎜ ⎟⎜ ⎟⎝ ⎠
Xe G T p RT
X, (A.2)
where the total variation of Gibbs free energy in the hydrogen combustion reaction,
( )2H 0 0,∆G T p , has the expression
2 2 2H 0 0 H O 0 0 O 0 0( , ) ( , ) 0.5 ( , )∆ = −G T p g T p g T p . (A.3)
In relation (A.3),
2H O 0 0( , )g T p and 2O 0 0( , )g T p are the Gibbs free energies of
formation for water and oxygen, respectively. The stoichiometric combustion of carbon monoxide with oxygen reads
2 2CO 0.5O CO+ = . (A.4) The chemical exergy of the carbon monoxide is
( ) 2
2
0.5O
ch,CO CO 0 0 0CO
, ln⎛ ⎞
= −∆ + ⎜ ⎟⎜ ⎟⎝ ⎠
Xe G T p RT
X, (A.5)
where the total variation of Gibbs free energy in the carbon monoxide combustion reaction, ( )CO 0 0,∆G T p , is given as
2 2CO 0 0 CO 0 0 O 0 0( , ) ( , ) 0.5 ( , )∆ = −G T p g T p g T p . (A.6)

96 Chemical exergy of hydrogen and carbon monoxide
In equation (A.6), 2CO 0 0( , )g T p is the carbon dioxide Gibbs free energy of formation.
A mention has to be made on the chemical exergies of H2 and CO in comparison with the chemical exergy of CH4. The chemical exergy of CH4, as given by equation (2.4), section 2.3.1, is slightly higher than its lower heating value (in fact, the exergy of any hydrocarbon, gas or liquid, is slightly higher than its lower heating value [1]). On the contrary, the chemical exergies of H2 and CO, determined with equations (A.2)and (A.5), respectively, are slightly lower than their lower heating values. As a result, the exergetic efficiency of the partial oxidation process based on the chemical exergies of CH4, H2 and CO is 2 − 3 % lower than an efficiency calculated using the lower heating values of CH4, H2 and CO.

Appendix B
Detailed results of the exergy analysis of the partial oxidation gas turbine plant
In tables B.1 – B.7, the exergy analysis results for the POGTP components are given. Table B.8 summarizes the data for the entire plant. The tables contain in columns the streams crossing the components boundary, the corresponding flows, the temperature and pressure and the exergy, expressed in kW and as percentages of the natural gas exergy at the entrance of the plant. The last row of the tables gives the irreversibility associated with the corresponding plant component. The irreversibility is calculated from the exergy balance (equation (2.9), section 2.3) and results from the difference between the exergies entering and the exergies exiting the plant component. In table B.1, the chemical exergy of the syngas is indicated in parenthesis. In table B.8, the exergetic efficiency of the POGTP is calculated with equation (2.11), section 2.3. Table B.1. Exergy analysis results for the partial oxidation reactor. POR Flow (kg s-1) T (K) p (bar) E (kW) E (%) Methanein 1.000 730 20.0 52,874 101.00 Oxygenin 1.300 540 20.0 544 1.04 Steamin 0.675 650 20.0 743 1.42 Syngasout 2.975 1,500 20.0 48,952 93.50 (41,350) (78.98) Irreversibility 5,209 9.96 Table B.2. Exergy analysis results for the syngas turbine. SGT Flow (kg s-1) T (K) p (bar) E (kW) E (%) Syngasin 2.975 1,500 20.0 48,952 93.50 Syngasout 2.975 828 1.0 43,381 82.86 Workout 5,302 10.13 Irreversibility 269 0.51

98 Detailed results of the exergy analysis of the partial oxidation gas turbine plant
Table B.3. Exergy analysis results for the oxygen compressor. C Flow (kg s-1) T (K) p (bar) E (kW) E (%) Oxygenin 1.300 204 1.5 221 0.42 Oxygenout 1.300 454 20.0 500 0.95 Workin 297 0.57 Irreversibility 18 0.04 Table B.4. Exergy analysis results for the natural gas heat exchanger. HENG Flow (kg s-1) T (K) p (bar) E (kW) E (%) Methanein 1.000 298 20.0 52,357 100.00 Syngasin 2.975 828 1.0 43,381 82.86 Methaneout 1.000 730 20.0 52,874 101.00 Syngasout 2.975 654 1.0 42,618 81.40 Irreversibility 246 0.46 Table B.5. Exergy analysis results for the oxygen heat exchanger. HEO2 Flow (kg s-1) T (K) p (bar) E (kW) E (%) Oxygenin 1.300 454 20.0 500 0.95 Syngasin 2.975 654 1.0 42,618 81.40 Oxygenout 1.300 540 20.0 544 1.04 Syngasout 2.975 642 1.0 42,571 81.30 Irreversibility 3 0.01 Table B.6. Exergy analysis results for the oxygen mixer. M Flow (kg s-1) T (K) p (bar) E (kW) E (%) GOXin 1.040 290 1.5 157 0.30 LOXin 0.260 95 1.7 190 0.36 Oxygenout 1.300 204 1.5 221 0.42 Irreversibility 126 0.24
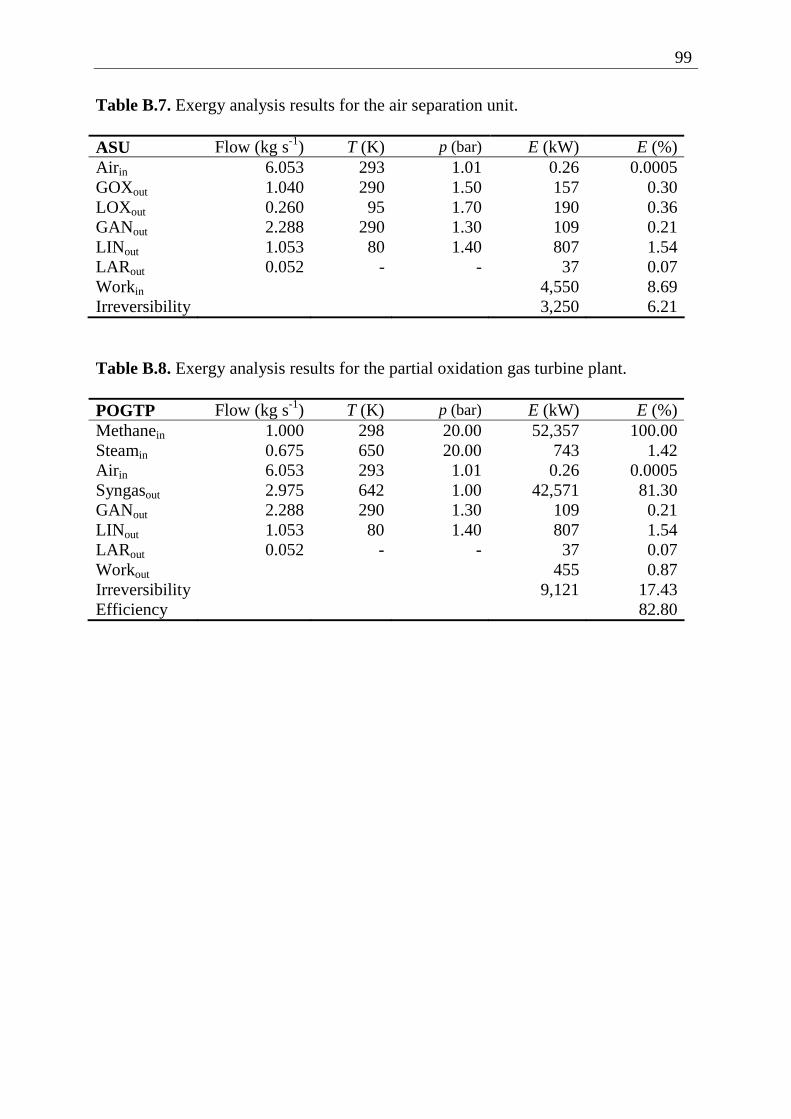
99
Table B.7. Exergy analysis results for the air separation unit. ASU Flow (kg s-1) T (K) p (bar) E (kW) E (%) Airin 6.053 293 1.01 0.26 0.0005 GOXout 1.040 290 1.50 157 0.30 LOXout 0.260 95 1.70 190 0.36 GANout 2.288 290 1.30 109 0.21 LINout 1.053 80 1.40 807 1.54 LARout 0.052 - - 37 0.07 Workin 4,550 8.69 Irreversibility 3,250 6.21 Table B.8. Exergy analysis results for the partial oxidation gas turbine plant. POGTP Flow (kg s-1) T (K) p (bar) E (kW) E (%) Methanein 1.000 298 20.00 52,357 100.00 Steamin 0.675 650 20.00 743 1.42 Airin 6.053 293 1.01 0.26 0.0005 Syngasout 2.975 642 1.00 42,571 81.30 GANout 2.288 290 1.30 109 0.21 LINout 1.053 80 1.40 807 1.54 LARout 0.052 - - 37 0.07 Workout 455 0.87 Irreversibility 9,121 17.43 Efficiency 82.80

100 Detailed results of the exergy analysis of the partial oxidation gas turbine plant

Appendix C
PREMIX and PSR codes
C.1 PREMIX code
PREMIX is a computer program for modeling steady, laminar, one-dimensional premixed flames. It computes species and temperature profiles in steady-state burner-stabilized flames and freely propagating premixed laminar flames.
The equations governing steady, isobaric, quasi-one-dimensional flame propagation are [6, 28] the continuity equation =m ρuA& , (C.1) the energy equation
p,1 1p p p
d 1 d d d0
d d d d= =
⎛ ⎞− + + =⎜ ⎟⎝ ⎠
∑ ∑N N
i i i i i ii i
T T A T Am λA ρYU c hωW
x c x x c x c& & (C.2)
and the equations of chemical species
( )d d0, 1, ,
d d+ − = =i
i i i i
Ym ρAYU AωW i N
x x& & K . (C.3)
The density of the mixture is given by the ideal gas law
=pWρRT
, (C.4)
the temperature is related to the enthalpy through the constitutive equation
0
,0 p, ( )d= + ∫T
i i i
T
h h c T T (C.5)
and the average molecular weight is given by
1
1
−
=
⎛ ⎞= ⎜ ⎟⎝ ⎠∑
Ni
i i
YW
W. (C.6)

102 PREMIX and PSR codes
In these equations, x denotes the spatial coordinate, m& the mass flow rate (independent of x), ρ the mass density, u the velocity of the fluid mixture in x direction, A the cross-sectional area of the stream tube encompassing the flame, T the temperature, cp the constant-pressure heat capacity of the mixture, λ the thermal conductivity of the mixture, N the number of species, Yi the mass fraction of the i-th species, Ui the diffusion velocity of the i-th species, cp,i the constant-pressure heat capacity of the i-th species, hi the specific enthalpy of the i-th species, iω& the molar rate of production of the i-th species per unit volume, Wi the molecular weight of the i-th species, p the pressure, W the mean molecular weight of the mixture and R the universal gas constant. The subscript 0 indicate quantities at reference conditions.
The governing equations of burner-stabilized and freely propagating premixed laminar flames are the same but the boundary conditions differ. For burner-stabilized flames, m& is a known constant, the temperature and the mass flux fractions,
i i i iε = Y + ρYU A m& , are specified at the cold boundary and vanishing gradients are imposed at the hot boundary. For freely propagating flames, m& is an eigenvalue and must be determined as part of the solution. Therefore, an additional boundary condition is required, or alternatively one degree of freedom must be removed from the problem. Here it was chosen to fix the location of the flame by specifying the temperature at one point. The code solves equations (C.1) − (C.3) for species mass fractions and temperature. The density is calculated from the ideal gas law (C.4) and the enthalpy is expressed as a function of temperature through the constitutive equation (C.5).
For freely propagating flames simulations, the input data are the reactants mass fractions, the pressure, the temperature profile and the intermediate species. The last two are used as initial guess. The solution of the code consists of species mass fractions, gas temperature, gas velocity and density in a number of grid points, covering the laminar flame length. The gas velocity of the first grid point is the laminar flame speed and the gas temperature of the last grid point is the adiabatic flame temperature. These two quantities are used to characterize a specific mixture under specific conditions of pressure and temperature.
C.2 PSR code The perfectly stirred reactor represents a reactor where perfect mixing of reactants
and products is assumed. It is characterized by spatial homogeneity and steady-state operation. The mixing is instantaneous and the conditions in the outlet of the reactor are equal to the conditions in the reactor. The characteristic time scale is the average residence time in the reactor.
The steady-state governing equations are [6, 22] the gas-phase species equations
( )in
10, 1, ,− + = =i i
i, i
ωWY Y i N
τ ρ&
K (C.7)

C.2 PSR code 103
and the gas energy equation
( ),in ,in1 1
0= =
− − =∑ ∑N N
i i i i i ii i
m Y h h V hωW& & . (C.8)
In equations (C.7) and (C.8), τ and V are the nominal residence time in the reactor and the reactor volume, respectively. The subscript in indicates inlet stream quantities. The significance of the other quantities was already given in the previous section. The nominal residence time in the reactor is given by
= ρVτm&
. (C.9)
The code solves the equations (C.7) and (C.8) for species mass fractions and
temperature. The density is calculated from the ideal gas law and the enthalpy is related to the temperature through the constitutive equation. These two relations were given in equations (C.4) and (C.5), respectively (see previous section). The residence time, the pressure and the inlet species mass fractions and temperature are the input data. For each combination of input data, the code produces a solution which is the species mass fractions and the temperature.

104 PREMIX and PSR codes

Appendix D
Mathematical description of chemically reacting flows
Abstract
In this appendix, the governing equations of laminar and turbulent reacting flows are presented. They are the conservation equations of mass, momentum, chemical species and energy. A general scalar convection-diffusion transport equation for the conservation of species and enthalpy is derived. Turbulent reactive flow modeling is introduced. The classical approach to model turbulent flows is described: Reynolds averaged Navier-Stokes equations (RANS) coupled with the k-ε turbulence model. The turbulent transport terms in the scalar equation are modeled using the gradient transport assumption.
D.1 Introduction
Chemically reacting flows are completely described at each point in space and time by specification of pressure, density, temperature, velocity and species concentrations. These properties can change due to the fluid flow (convection), chemical reaction, molecular transport (heat conduction, diffusion, viscous dissipation) and radiation. Some properties in reacting flows are conserved. Such conserved properties are the mass, the momentum and the energy. Summation over all the processes that change these properties leads to the conservation equations. The mathematical description of chemically reacting flows is based on the conservation equations.
D.2 Governing equations for laminar reacting flows
As mentioned in the introduction, chemically reacting flows are governed by conservation equations of mass, momentum and energy. In the present section these conservation equations are formulated. They are based on the derivations given in [2, 11, 63].
The conservation of mass is expressed by the continuity equation

106 Mathematical description of chemically reacting flows
( ) 0∂ + ∇ ⋅ =∂ρ ρt
u , (D.1)
where ρ is the fluid density, t is time and u is the velocity vector. The conservation of momentum is stated by the Navier-Stokes equations
( ) ( )∂
+ ∇ ⋅ ⊗ = −∇ + ∇ ⋅ +∂ρ
ρ p ρt
uu u τ g , (D.2)
where p is the pressure, τ is the viscous stress tensor and ρg represents forces due to buoyancy. The stress tensor is given by
( ) ( )( )T2
3⎛ ⎞= − ∇ ⋅ + ∇ + ∇⎜ ⎟⎝ ⎠ζ µ µτ u δ u u , (D.3)
where ζ is the bulk viscosity, µ is the molecular viscosity and δ is the unity tensor. The conservation of chemical species is represented by the following mass balance equations
( ) ( )∂
+ ∇ ⋅ + =∂
ii i i
ρYρ Y S
tu J , ( )1, ,=i NK , (D.4)
where Yi is the mass fraction of species i, u is the mass-average velocity of the mixture, Ji is the diffusion mass flux of species i relative to the mean flow, Si is the source term due to chemical reaction of species i and N is the number of species. The definition relation of Ji is ( )= − =i i i i iρY ρYJ u u U , (D.5)
where ui is the velocity of the i-th species and Ui is the diffusion velocity of species i. Usually in combustion situations Ji is modeled by Fick’s law of diffusion, with ,m= − ∇i i iρD YJ . (D.6)
In the last relation, Di,m is the mixture-averaged diffusion coefficient of species i. The chemical source term in the species equation (D.4) is the sum of the contributions of all reaction rates
l=
= ∑M
i i ij jj
S W ν w , (D.7)
where Wi is the molecular weight of species i, ′′ ′= −ij ij ijν ν ν is the overall stoichiometric
coefficient of species i in reaction j and wj is the reaction rate of the j-th reaction from a set of M general chemical reactions. Considering the following form of reaction j

D.2 Governing equations for laminar reacting flows 107
1 1= =
′ ′′=∑ ∑N N
ij i ij ii i
ν Ω ν Ω , (D.8)
where ′
ijν and ′′ijν are the stoichiometric coefficients for reactants and products,
respectively, and Ωi symbolizes the species i, the reaction rate is given by
,f ,b1 1
[ ] [ ]′ ′′
= == −∏ ∏ij ij
N Nν ν
j j i j ii i
w k Ω k Ω . (D.9)
In this relation, [Ωi] is the concentration of species i and kj,f and kj,b are the forward and backward reaction rate constants, which generally can be expressed in an Arrhenius form a /e−= E RTb
jk AT , (D.10)
where A is the pre-exponential factor, b is the temperature exponent, Ea is the activation energy, R is the universal gas constant and T is the temperature. The conservation of energy can be written in the form of the enthalpy balance equation
( ) ( )q rad
( ) D:
D
∂ + ∇ ⋅ = − ∇ ⋅ + ∇ +∂ρh pρ h qt t
u J τ u , (D.11)
where h is the specific enthalpy, Jq is the heat flux and qrad is the heat loss due to radiation. The enthalpy is defined as the sum of the species enthalpies hi
1=
=∑N
i ii
h hY (D.12)
and the heat flux vector is given by
q1=
= − ∇ +∑N
i ii
λ T hJ J , (D.13)
where λ is the thermal conductivity.
The system formed by the conservation equations is closed by the ideal gas law
= pWρRT
(D.14)
and the constitutive equation
108 Mathematical description of chemically reacting flows
0
0p, ( )d= + ∫
T
i i iT
h h c T T , (D.15)
where cp,i and 0
ih are the specific heat and the enthalpy of formation at the reference
temperature T0 for species i, respectively and W is the average molecular weight, which is given by
1
1
−
=
⎛ ⎞= ⎜ ⎟⎝ ⎠∑
Ni
i i
YW
W. (D.16)
Inserting (D.6), (D.12), (D.13) and (D.15) in (D.11), the enthalpy equation can be expressed as
rad1p p
( ) 1- 1
=
⎛ ⎞ ⎛ ⎞⎛ ⎞∂ + ∇ ⋅ ∇ = ∇ ⋅ − ∇ +⎜ ⎟ ⎜ ⎟⎜ ⎟⎜ ⎟ ⎜ ⎟∂ ⎝ ⎠⎝ ⎠ ⎝ ⎠∑
N
i ii i
ρh λ λρ h h h Y qt c c Le
u , (D.17)
where cp is the specific heat of the mixture, defined as
p p,1=
=∑N
i ii
c c Y (D.18)
and Lei is the Lewis number of species i, given by
,m p
=i
i
λLe
ρD c. (D.19)
In equation (D.17), the terms representing the change of pressure and the frictional heating were neglected. In case of Lewis numbers equal to 1, the terms involving ∇Yi drop out and both the enthalpy equation (D.17) and the species mass fraction equations (D.4) can be expressed as a scalar convection-diffusion transport equation
( )( )-
∂ + ∇ ⋅ ∇ =∂ Φ ΦρΦ ρ Φ Γ Φ St
u . (D.20)
Here, Φ stands for species mass fractions or enthalpy, ΓΦ is the scalar diffusion coefficient defined as =Φ ΦΓ ρD (D.21) and SΦ is the source term. For species mass fraction equations, SΦ is given by relation (D.7). As for enthalpy equation, the source term is the heat loss due to radiation, qrad and its expression must be provided.

D.3 Turbulent reactive flows 109
D.3 Turbulent reactive flows
In turbulent reactive flows the velocity, chemical species and temperature fluctuate in time and space. Though these flows are governed by the laminar equations discussed in section 4.2, it is generally not feasible to solve the equations to the required accuracy using current technology. We therefore resort to turbulence models, which solve transport equations for Reynolds-averaged rather than instantaneous values of variables. The Reynolds average of a variable Φ is defined as
( )d+∞
−∞
= ∫Φ ΦP Φ Φ , (D.22)
where P is the probability density function (PDF) of Φ, which gives the probability that the instantaneous value of the variable is between Φ and Φ + dΦ. Transport equations for averaged variables are obtained by decomposing the instantaneous variables Φ into their mean Φ and the fluctuations Φ′ ( ) ( ) ( ), ,′= +Φ t Φ Φ tx x x , (D.23)
where x is the position vector and t is time. The mean of the variable is also called the first moment of the PDF. Other important moments are the central moments. The n-th central moment is defined as
( ) ( )- d+∞
−∞
′ = ∫nnΦ Φ Φ P Φ Φ (D.24)
By definition, the first central moment is zero. The second central moment is called the variance. The square root of the variance determines the width of the PDF. The Reynolds average of a function f, depending on variables Φi, is given by
( ) ( ) ( )1 2 1 2 1 2 1 2, , , , , , d d+∞
−∞
= ∫f Φ Φ f Φ Φ P Φ Φ Φ ΦL L L L, (D.25)
where P is the joint PDF of variables Φi. In case of statistically independent variables, the joint PDF can be factorized as ( ) ( )1 2, , = ∏ i
i
P Φ Φ P ΦL , (D.26)
where P(Φi) is the PDF of variable Φi. In the momentum equations (D.2) as well as in the scalar transport equation (D.20), the convective terms contain products of the dependent variables and the density. In

110 Mathematical description of chemically reacting flows
order to simplify the formulation when averaging, a density-weighted averageΦ% , called the Favre average, is introduced by splitting Φ into Φ% and ′′Φ [47, 60] ( ) ( ) ( ), ,′′= +Φ t Φ Φ t%x x x . (D.27)
The Favre average is defined by
= ρΦΦρ
% (D.28)
and the fluctuation verifies the relation
0′′ =ρΦ . (D.29)
Applying Favre averaging to the continuity equation (D.1), the momentum equation (D.2) and the scalar transport equation (D.20), we obtain
( ) 0∂ + ∇ ⋅ =∂ρ ρt
%u , (D.30)
( ) ( ) ( )-
∂ ′′ ′′+ ∇ ⋅ ⊗ = −∇ + ∇ ⋅ ⊗ +∂ρ
ρ p ρ ρt
%% % %
uu u τ u u g , (D.31)
( ) ( )( )∂ ′′ ′′+ ∇ ⋅ = ∇ ⋅ ∇ − +∂ Φ ΦρΦ ρ Φ ρD Φ ρ Φ St
%% %%u u . (D.32)
While the Favre-averaged continuity equation is the same as the un-averaged one, the momentum and scalar transport equations contain turbulent flux terms, additional to the molecular diffusive fluxes. These are the Reynolds stress ′′ ′′⊗ρu u and the
Reynolds flux ′′ ′′ρ Φu and arise from the non-linear convective terms in the un-averaged equations. They represent the turbulent transport of the flow properties. These new terms generated in the averaging process are not explicitly known as functions of the dependent variables. Thus, there are more unknowns than equations (the closure problem). Turbulence models close equations (D.30) - (D.32) by providing models for the computation of turbulent flux terms. The eddy viscosity models introduce the eddy viscosity hypothesis that the Reynolds stresses and fluxes can be linearly related to the mean value of the property u and Φ, respectively
( ) ( )( )T
T T
2 2
3 3′′ ′′− ⊗ = − − ∇ ⋅ + ∇ + ∇ρ ρk µ µ% % % %u u δ u δ u u , (D.33)
,T- =′′ ′′ ∇Φρ Φ Γ Φ%u . (D.34)
D.3 Turbulent reactive flows 111
In these relations, ~
2
1~uu ′′⋅′′=k is the turbulent kinetic energy, µT is the eddy
(turbulent) viscosity and ΓΦ,T is the eddy diffusivity of variable Φ. The latter two are related by
T,T
,T
=ΦΦ
µΓSc
, (D.35)
where ScΦ,T is the turbulent Schmidt number of Φ, which is of the order of unity [2].
The most widely used turbulence model is the k-ε model [26]. This is an eddy viscosity model which gives the turbulent viscosity in the form
2
T = µkµ C ρε
%
%, (D.36)
where ε% is the turbulence dissipation rate and Cµ is a model constant.
The model solves two partial differential equations for the turbulent kinetic energy k% and for the turbulence dissipation rate ε% [11]
( ) T( ) ⎛ ⎞⎛ ⎞∂ + ∇ ⋅ − ∇ ⋅ + ∇ = −⎜ ⎟⎜ ⎟⎜ ⎟∂ ⎝ ⎠⎝ ⎠k
k
ρk µρ k µ k P ρεt σ
%% %% %u , (D.37)
( ) ( )T1 2
( ) ⎛ ⎞⎛ ⎞∂ + ∇ ⋅ − ∇ ⋅ + ∇ = −⎜ ⎟⎜ ⎟⎜ ⎟∂ ⎝ ⎠⎝ ⎠ε k ε
ε
ρε µ ερ ε µ ε C P C ρεt σ k
% %% % % %
%u , (D.38)
where Pk is the shear production defined as
( )( ) ( )T
T T
2
3= ∇ ⋅ ∇ + ∇ − ∇ ⋅ ∇ ⋅kP µ µ ρk%% % % % % +u u u u u (D.39)
and σk, σε, Cε1 and Cε2 are modeling constants. In equations (D.37) and (D.38) the production term due to buoyancy was omitted.
The transport equation for k (D.37) can be derived with few modeling assumptions quite systematically from the continuity and momentum equations. From this derivation follows the definition of the viscous dissipation in the form
( )T= + :⎡ ⎤′ ′ ′∇ ∇ ∇⎣ ⎦ε ν u u u , (D.40)
where ν is the kinematic viscosity. An exact equation for ε can be also rigorously derived, but the relation between the modeled equation (D.38) and the exact equation is rather tenuous [47, 62].
112 Mathematical description of chemically reacting flows
Subject to the eddy viscosity hypothesis, the Favre-averaged momentum and scalar transport equations become
( ) ( ) ( )( )( )T
eff
∂+ ∇ ⋅ ⊗ = −∇ ∗ +∇ ⋅ ∇ + ∇ +
∂ρ
ρ p µ ρt
%% % % %
uu u u u g , (D.41)
( ),eff
( )-
∂ + ∇ ⋅ ∇ =∂ Φ ΦρΦ ρ Φ Γ Φ St
%% %%u . (D.42)
In these equations, p* is a modified pressure, µeff is the effective viscosity and ΓΦ,eff is the effective diffusivity of the general variable Φ. They are defined by
eff
2 2= + + -
3 3⎛ ⎞∗ ∇ ⋅⎜ ⎟⎝ ⎠
p p ρk µ ζ% %u , (D.43)
eff T= +µ µ µ , (D.44) ,eff ,T= +Φ Φ ΦΓ Γ Γ . (D.45)
To solve the averaged conservation equations (D.30) − (D.32), one still has to
specify the averaged source term due to chemical reactions, ΦS . Following the
expressions (D.7) − (D.10), SΦ depends on (N+1) variables: N species concentrations and the temperature. Applying relation (D.25), the averaged source term is given by
( )1 2 1 1 2 1, , , d d d+∞
+ +−∞
= ∫Φ Φ N NS S P Φ Φ Φ Φ Φ ΦL L . (D.46)
In order to calculate ΦS , the joint PDF has to be known. The most accurate approach for obtaining the PDF is by solving a transport equation for it [49]. Due to the high computational cost of this procedure, the alternative approach of the assumed PDF shape is often preferred [40].

Appendix E
Evaluation of predicted soot parameters and oxidation rates
Due to the lack of experimental data from literature and the fact that the experiments at the University of Twente were in an early stage, the combustion model could not be validated against measurements. Instead, the results given by the simulation of the NG/NITROX mixture in the reactor with the diameter of 75 mm are compared with data taken from reference [64]. In [64], five atmospheric laminar premixed rich CH4/O2 flames with equivalence ratios in the range 2.20 – 2.60 have been experimentally investigated. Gas velocity, soot volume fraction, primary soot particle diameter, concentrations of major gas species and temperature were measured along the axis of the flames, in the region between the burner exit and the stabilizing plate (located 30 mm above the burner exit). Predictions of the flames investigated were performed with the code PREMIX. These were used for comparison with measurements and to estimate the H atom concentration needed to evaluate the soot growth by the HACA mechanism. Based on the measured soot volume fractions and particle diameters, the soot surface area AS, particle number np, surface growth rate wsg and nucleation rate wnu have been calculated. For the comparison made here, a flame with the fuel equivalence ratio of 2.5 was selected. The assessment is given in table E.1. The figures correspond to the reactor outlet (predictions) or the highest measuring position from the burner (measurements). In brackets, the maximum values of some variables are indicated. The measurement method is also given in the last column of table E.1.
In table E.2, the soot surface growth and oxidation rates predicted by the present combustion model are given. The figures correspond to the reactor outlet. Though the oxidation rates given in equations (5.9) − (5.13), section 5.2.4, have different units, here they have been expressed in the same units as the surface growth rate (kg m-2 s-1) for comparison. Examining the numbers, it appears that H2O and CO2 are the most important oxidizing species for soot, followed in order by O2, OH and H2, which have minor contributions to soot oxidation. It can be also noticed that the soot oxidation rate by CO2,
2ox,COw almost equals and by H2O, 2ox,H Ow exceeds the soot surface
growth rate, wsg. The over prediction of these soot oxidation rates is explained by the fact that the reaction rate coefficients used have been taken from reference [54], which is dedicated to pulverized-coal combustion and gasification (different carbon structures and operating conditions). It follows that the oxidation rate parameters have to be adjusted for the present application by correlating the simulations with experimental data. Since no such data was available, the simulations results presented

114 Evaluation of predicted soot parameters and oxidation rates
in this work were obtained without including the oxidation terms in the soot mass fraction transport equation.
Table E.1. Comparison of predictions given by the present model with data from the experimental work [64].
Experimental work Var. Present model Value Method
fS 4.0⋅10-6 0.3⋅10-6 Laser extinction dS 2.2⋅10-7 0.25⋅10-7 Thermophoretic sampling and TEM np 7.1⋅1014 (1.1⋅1015) 3.0⋅1016 6fS/(πdS
3) AS 108.7 70.0 πdS
2np wsg 8.6⋅10-4 (5.5⋅10-3) 2.0⋅10-3 (ρ/AS)d(ρSfS/ρ)/dt wnu 3.0⋅10-9 (1.2⋅10-8) 1.0⋅10-9 ρd(np/ρ)/dt XH2 3.0⋅10-1 3.0⋅10-1 XCO 1.6⋅10-1 3.0⋅10-1 XH2O 1.4⋅10-1 3.0⋅10-1 XCO2 2.5⋅10-2 4.5⋅10-2 XCH4 4.2⋅10-2 4.5⋅10-2 XC2H2 2.0⋅10-2 (3.9⋅10-2) 1.0⋅10-2
Isokinetic sampling and gas chromatography
XH 1.8⋅10-5 (9.7⋅10-5) 2.0⋅10-4 (8.0⋅10-3) Predicted with PREMIX T 1,630 (1,800) 1,500 (1,900) Multiline emission or thermocouples Table E.2. Comparison of predicted soot surface growth rate with soot oxidation rates.
Rate (kg m-2 s-1) Value
sgw 8.6⋅10-4
2ox,H Ow -3.3⋅10-3
2ox,COw -6.2⋅10-4
2ox,Ow -7.6⋅10-6
ox,OHw -3.0⋅10-7
2ox ,Hw -3.2⋅10-7

References [1] Bejan A., Advanced engineering thermodynamics, Wiley (1988). [2] Bird R.B., Stewart W.E. and Lightfoot E.N., Transport Phenomena, second
edition, John Wiley & Sons Inc. (2002). [3] Bockhorn, H., Soot formation and oxidation, in Pollutants from Combustion,
edited by C. Vovelle, pp. 205−239, Kluwer Academic Publishers, printed in The Netherlands (2000).
[4] Bockhorn H., editor, Soot Formation in Combustion, Springer-Verlag, Berlin Heidelberg New York (1994).
[5] Bockhorn H., A short introduction to the problem – structure of the following parts, in Soot Formation in Combustion, edited by H. Bockhorn, pp. 3–7, Springer-Verlag, Berlin Heidelberg New York (1994).
[6] Boersma J.M., Modeling of NOx Emission from Natural Gas Fired Gas Turbine Combustors, Ph.D. Thesis, University of Twente (1993).
[7] Bowman G., Frenklach M., Gardiner B., Smith G. and Serauskas B., GRI-Mech, Gas Research Institute, Chicago, Ilinois, USA, http://www.me.berkeley.edu/gri-mech/index.html.
[8] Brookes S.J. and Moss J.B, Predictions of soot and thermal radiation properties in confined turbulent jet diffusion flames, Combustion and Flame 116:486−503 (1999).
[9] v.d. Burgt M.J. and van Leeuwen C.J., The Shell Middle Distillate Synthesis Process, in Methane Conversion edited by D.M. Biddy, C.D. Chang, R.F. Howe and S. Yurchak, pp. 473–482, Elsevier Science Publishers B.V., Amsterdam (1988).
[10] CFX-5, http://www-waterloo.ansys.com/cfx/products/cfx-5/index.html. [11] CFX-5.6 flow solver manual, CFX Ltd., United Kingdom (2003). [12] Christensen T.S., Dybkjaer I., Hansen L. and Primdahl I.I., Design and
performance of secondary and autothermal reforming burners, AIChE Ammonia Safety Meeting, Vancouver, USA, paper No. 39, pp. 205−215, October 1994.
[13] Christensen T.S. and Primdahl I.I., Improve syngas production using autothermal reforming, Hydrocarbon Processing March 1994:39–46.
[14] Colket M.B. and Hall R.J., Successes and uncertainties in modeling soot formation in laminar, premixed flames, in Soot Formation in Combustion, edited by H. Bockhorn, pp. 442–468, Springer-Verlag, Berlin Heidelberg New York (1994).
[15] Cooper C.M. and Wiezevich P.J., Effects of temperature and pressure on the upper explosive limit of methane-oxygen mixtures, Industrial and Engineering Chemistry 21:1210–1214 (1929).

116 References
[16] Cornelissen R.L., Thermodynamics and Sustainable Development, Ph.D. Thesis, University of Twente (1997).
[17] Correa S.M. and Gulati A., Measurements and Modeling of a Bluff Body Stabilized Flame, Combustion and Flame 89:195−213 (1992).
[18] Derksen M.A.F., Kok J.B.W. and van der Meer Th.H., Modeling of turbulent combustion with reaction progress variables and CSP, in European Combustion Institute Meeting, Orleans France (2003).
[19] Fischer B.A. and Moss J.B., The influence of pressure on soot production and radiation in turbulent kerosine spray flames, Combust. Sci. and Tech. 138:43−61 (1998).
[20] Frenklach M. and Wang H., Detailed mechanism and modeling of soot particle formation, in Soot Formation in Combustion, edited by H. Bockhorn, pp. 165–190, Springer-Verlag, Berlin Heidelberg New York (1994).
[21] Geerssen T.M., Physical properties of natural gases, N.V. Nederlandse Gasunie (1988).
[22] Glarborg P., Kee R.J., Grcar J.F. and Miller J.A., PSR: A Fortran program for modeling well-stirred reactors, Technical Report SAND86-8209, Sandia National Laboratories (1986).
[23] Gupta A., Lilley D. and Syred N., Swirl Flows, Tunbridge Wells: Abacus (1984). [24] Hu I.Z. and Correa S.M., Calculations of turbulent flames using a PSR
microstructural library, in Twenty-Sixth Symposium (International) on Combustion, pp. 307−313, The Combustion Institute (1996).
[25] Janika J. and Kollmann W., The calculation of mean radical concentrations in turbulent diffusion flames, Combustion and Flame 44:319−336 (1982).
[26] Jones W.P. and Launder B.E., The prediction of laminarization with a two-equation model of turbulence, International Journal of Heat and Mass Transfer 15:301−314 (1972).
[27] van Kampen J., Grid independence of CFD simulations with CFX-5 of the DESIRE burner, Internal Report, Laboratory of Thermal Engineering, University of Twente 2004, http://www.thw.ctw.utwente.nl/.
[28] Kee R.J., Grcar J.F., Smooke M.D. and Miller J.A., A Fortran program for modeling steady laminar one-dimensional premixed flames, Technical Report SAND85-8240, Sandia National Laboratories (1985).
[29] Kee R.J., Rupley F.M. and Miller J.A., CHEMKIN-II: A Fortran chemical package for the analysis of gas-phase chemical kinetics, Technical Report SAND89-8009, Sandia National Laboratories (1989).
[30] Kennedy I.M., Models of soot formation and oxidation, Prog. Energy Combust. Sci. 23:95−132 (1997).
[31] Kerkhof F.P.J.M. and van Steenderen P., Integration of Gas Turbine and Air Separation Unit for IGCC Power Plants, Comprimo B.V., Amsterdam (1993).
[32] Kok J.B.W., Albrecht B.A., Dijkstra N. and van der Meer Th.H., Generation of synthesis gas and power by partial oxidation of natural gas in a gas turbine, Final Report, Laboratory of Thermal Engineering, University of Twente, 2004, http://www.thw.ctw.utwente.nl/.
[33] Kok J.B.W., Louis J.J.J. and Yu J.H., The IRST model for turbulent premixed non-adiabatic methane flames, Combust. Sci. and Tech. 149:225−247 (1999).

117
[34] Korobitsyn M.A., Enhancing direct-fired power plants performance by use of gas turbine technology, Journal of Propulsion and Power 16:568−571 (2000).
[35] Korobitsyn M.A., Analysis of cogeneration, combined and integrated cycles, Ph.D. Thesis, University of Twente (1998).
[36] Kronenburg A., Bilger R.W. and Kent J.H., Modeling soot formation in turbulent methane-air jet diffusion flames, Combustion and Flame 121:24−40 (2000).
[37] Lindstedt P.R., Simplified soot nucleation and surface growth steps for non-premixed flames, in Soot Formation in Combustion, edited by H. Bockhorn, pp.417–439, Springer-Verlag, Berlin Heidelberg New York (1994).
[38] Lindstedt P.R., A simple reaction mechanism for soot formation in non-premixed flames, in Aerothermodynamics in Combustors, IUTAM Symposium, Taipei Taiwan, 1991, edited by R.S.L. Lee, J.H. Whitelaw and T.S. Wung, pp. 145−156, Springer-Verlag, Berlin Heidelberg New York (1992).
[39] Linstrom P.J. and Mallard W.G., editors, NIST Chemistry WebBook, NIST Standard Reference Database Number 69, March 2003, National Institute of Standards and Technology, Gaithersburg MD, 20899, http://webbook.nist.gov.
[40] Louis J.J.J., On Turbulent Combustion of Coal Gas, Ph.D. Thesis, University of Twente (1997).
[41] Maas U. and Pope S.B., Simplifying chemical kinetics: intrinsic low-dimensional manifolds in composition space, Combustion and Flame 88:239−264 (1992).
[42] Massias A., Diamantis D., Mastorakis E. and Goussis D., An algorithm for the construction of global reduced mechanisms with CSP data, Combustion and Flame 117:685−708 (1999).
[43] Mayland B.J. and Hays G.E, Thermodynamic study of synthesis gas production from methane, Chemical Engineering Progress 45:452−458 (1949).
[44] Montgomery C.W., Weinberger E.B. and Hoffman D.S., Thermodynamics and stoichiometry of synthesis gas production, Industrial and Engineering Chemistry 40:601−607 (1948).
[45] Mungen R. and Kratzer M.B., Partial combustion of methane with oxygen, Industrial and Engineering Chemistry 43:2782−2787 (1951).
[46] Musick M., van Tiggelen P.J. and Vandooren J., Detailed mechanism of CH4/O2/Ar flames and modeling in fuel-rich conditions, Bull. Soc. Chim. Belg. 105:555−574(1996).
[47] Peters N., Turbulent Combustion, Cambridge University Press (2000). [48] Ploumen P.J. and Janssen F.J.J.G., Through exergy approach to more efficient
processes, in Proceedings of ECOS 2000 International Conference, edited by G.G. Hirs, pp. 1247−1258, University of Twente, The Netherlands (2000).
[49] Pope S.B., PDF methods for turbulent reactive flows, Prog. Energy Combust. Sci. 11:119−192 (1985).
[50] Rabovitser J.K., Khinkis M.J., Bannister R.L. and Miao F.Q., Evaluation of thermochemical recuperation and partial oxidation concepts for natural gas-fired advanced turbine systems, ASME 96-GT-290 (1996).
[51] Reed C.L. and Kuhre C.J., Make syngas by partial oxidation, Hydrocarbon Processing September 1979:191−194.

118 References
[52] Roditcheva O.V. and Bai X.S., Pressure effect on soot formation in turbulent diffusion flames, Chemosphere 42:811−821 (2001).
[53] Somers L.M.T., Modeling approaches to chemical and transport processes, in Course on Combustion, edited by K.R.A.M. Schreel, pp. 21−37, Eindhoven University of Technology (2001).
[54] Smoot L.D. and Pratt D.T., Pulverized-Coal Combustion and Gasification: Theory and Applications for Continuous Flow Processes, New York (1979).
[55] van Steenderen P. and Kerkhof F.P.J.M., Exergy analysis of industrial processes, Comprimo B.V., Amsterdam.
[56] Tindall B.M. and Crews M.A., Alternative technologies to steam-methane reforming, Hydrocarbon Processing November 1995:75−81.
[57] Ullmann's Encyclopedia of Industrial Chemistry, Gas Production, Wiley-VCH Verlag GmbH & Co. KGaA, 2002, http://www.wiley-vch.de/contents/ullmann/contents.html.
[58] Vanderstraeten B., Tuerlinckx D., Berghmans J., Vliegen S., Van’t Oost E. and Smit B., Experimental study of the pressure and temperature dependence on the upper flammability limit of methane/air mixtures, Journal of Hazardous Materials 56:237−246 (1997).
[59] Veynante D. and Vervisch L., Turbulent combustion modeling, Progress in Energy and Combustion Science 28:193−266 (2002).
[60] Warnatz J., Maas U. and Dibble R.W., Combustion, Springer-Verlag, Berlin Heidelberg (1996).
[61] Wen Z., Yun S., Thomson M.J. and Lightstone M.F., Modeling soot formation in turbulent kerosene/air jet diffusion flames, Combustion and Flame 135:323−340 (2003).
[62] Wilcox D.C., Turbulence Modeling for CFD, second edition, DCW Industries Inc. (2000).
[63] Williams F.A., Combustion Theory, Addison-Wesley Publishing Company, Redwood City (1985).
[64] Xu F., Lin K.C. and Faeth G.M., Soot formation in laminar premixed methane/oxygen flames at atmospheric pressure, Combustion and Flame 115:195−209 (1998).
[65] Xu F., Sunderland P.B. and Faeth G.M., Soot formation in laminar premixed ethylene/air flames at atmospheric pressure, Combustion and Flame 108:471−493 (1997).
[66] Yamamoto T., Furuhata T. and Arai N., Thermodynamic analysis and optimization of new concept combined cycle “Chemical Gas Turbine” system, in Proceedings of ECOS 2000 International Conference, edited by G.G. Hirs, pp. 447−455, University of Twente, The Netherlands (2000).
[67] Zimberg M.J., Frankel S.H., Gore J.P. and Sivathanu Y.R., A study of coupled turbulent mixing, soot chemistry, and radiation effects using the Linear Eddy Model, Combustion and Flame 113:454−469 (1998).

Summary
This thesis analyses a novel process of partial oxidation of natural gas and develops a numerical tool for the partial oxidation reactor modeling. The proposed process generates syngas in an integrated plant of a partial oxidation reactor, a syngas turbine and an air separation unit. This is called the partial oxidation gas turbine plant. The natural gas reacts with oxygen in the partial oxidation reactor. The syngas produced is expanded in the syngas turbine where the gas sensible heat is converted to power. This is used to run the air separation unit, which supplies the oxygen for the partial oxidation process. The exergy analysis of the integrated plant showed that the proposed process has a high exergetic efficiency and is independent of external sources of energy. The partial oxidation gas turbine plant is also very compact, as a result of using a gas turbine for syngas heat recovery.
As already mentioned, the present work also focuses on the partial oxidation reactor. The numerical investigation of the reactor takes place in two steps. In the first step, the effect of process parameters like residence time, pressure, equivalence ratio and type of oxidizer on the partial oxidation of natural gas, in model types of reactors was analyzed. The analysis tool was the CHEMKIN chemical kinetics simulation package. The partial oxidation reactor was investigated, modeling it either as a freely propagating flame or as a perfectly stirred reactor (PSR). The freely propagating flame gives information about the propagation properties of rich flames as occurring in the partial oxidation process. A correlation function of the laminar flame speed with the adiabatic flame temperature for rich mixtures was established. The perfectly stirred reactor shows the limits of improving natural gas conversion by enhancing the mixing of initial mixture with products. The PSR calculations indicated that the residence time necessary to approach equilibrium in ultra rich mixtures, for best conversion of natural gas to hydrogen and carbon monoxide, is very long, in excess of 1,000 ms.
In the second step, a combustion model for the computational fluid dynamics (CFD) investigation of the partial oxidation process was developed. Because the syngas is expanded in a gas turbine to produce power, the partial oxidation reactor must have a high power density. This is achieved by using a turbulent flow inside the reactor, similar to the gas turbines combustion chambers. The partial oxidation process is characterized by a high fuel to oxidizer ratio, far beyond the stoichiometric ratio. It follows that partial oxidation represents an ultra rich combustion process. Furthermore, in order to have a homogeneous mixture of natural gas and oxidizer inside the reactor, which is beneficial for the efficient conversion of natural gas to syngas, the flow is also premixed. Based on these arguments, the proposed partial oxidation process was modeled as a turbulent rich premixed combustion process. The combustion model is structured in two parts. The gas phase model predicts the gaseous chemical species and temperature. It uses a reaction progress variable and an

120 Summary
enthalpy loss variable to account for the progress of gaseous chemical reactions and the heat loss due to soot radiation, respectively. In the soot model, the soot formation is described with the empirical processes of nucleation, surface growth, agglomeration and oxidation and is quantified by two parameters. These are the soot mass fraction and the soot particle number density. The link between the two model parts is the concentration of acetylene, which is the soot precursor. The combustion model solves transport equations for the reaction progress variable, the enthalpy variable and the soot parameters. It is implemented in the CFX-5 flow solver with the standard k-ε turbulence model.
The turbulent rich combustion model was used to simulate the partial oxidation of natural gas process. The CFD results showed that the turbulent rich combustion model is an useful tool for predicting the velocity field, gaseous chemical reactions progress, soot formation and heat loss in specific partial oxidation reactor design. The simulations pointed out the effects of the reactor diameter and the concentrations of CH4 and O2 in the mixture on the conversion efficiency and the soot production in the partial oxidation process.
The mapping of the detailed chemical system on the reaction progress variable was made using the assumption of a distributed reaction regime in the partial oxidation process. This was checked by analyzing the combustion regimes. Both the calculated Damköhler numbers (lower than one) and the Borghi diagrams have shown that the partial oxidation process takes place in the distributed reaction zones, thus justifying the assumption.
Samenvatting
Dit proefschrift bestaat uit analyse van een nieuw proces, de partiële oxidatie van aardgas, en een formulering voor een numeriek model om de reactor in dit proces te beschrijven. De voorgestelde installatie produceert synthesegas in een geïntegreerd proces, bestaande uit een partiële oxidatie-reactor, een synthesegasturbine en een luchtscheidingseenheid. Dit tezamen wordt het partiële oxidatie gasturbine procédé genoemd. Aardgas reageert met zuurstof in de partiële oxidatie reactor. Het geproduceerde synthesegas expandeert vervolgens in de gasturbine, waar de warmte van het gas omgezet wordt in kracht. Hiermee wordt de luchtscheidingseenheid aangedreven, die weer zuurstof levert aan het partiële oxidatie proces. De exergie analyse van de installatie laat zien dat het voorgestelde proces een hoge exergetische efficiëntie bezit en onafhankelijk is van externe energiebronnen. De partiële oxidatie gasturbine installatie is tevens zeer compact, hetgeen het gevolg is van de toepassing van een gasturbine om de warmte uit het synthesegas terug te winnen.
Zoals al is genoemd, gaat dit proefschrift ook in op de partiële oxidatie-reactor. Het numerieke onderzoek van de reactor bestaat uit twee stappen. In de 1e stap werd het effect van procesparameters als verblijftijd, druk, brandstof/zuurstof verhouding en type oxidator op de partiële oxidatie van aardgas in modelreactoren onderzocht. Het hierbij gebruikte analysegereedschap was het CHEMKIN chemische kinitiek simulatie pakket. De partiële oxidatie reactor werd onderzocht in de configuratie van een vrij propagerende vlam en als een ideaal gemengde reactor. De vrij propagerende vlam geeft informatie over de propagatie-eigenschappen van rijke vlammen in het partiële oxidatie-proces. Met deze simulaties kon een correlatie functie van de laminaire verbrandingssnelheid met de adiabatische vlamtemperatuur worden opgesteld. De ideaal gemengde reactor laat de limieten van de omzetting van aardgas zien door verbetering van de menging van initiële reactanten met producten. De ideaal gemengde reactor berekeningen laten zien dat de noodzakelijke verblijftijd om evenwicht te bereiken in ultra rijke mengsels, voor optimale omzetting van aardgas in waterstof en koolstofmono-oxide, erg lang is. De verblijftijd overschrijdt dan 1,000 ms.
De tweede stap bestond uit de ontwikkeling van een verbrandingsmodel voor gebruik in een numeriek stromingsmodel (‘computational fluid dynamics’) van het partiële oxidatie-proces. Aangezien het synthesegas expandeert in een gasturbine om kracht op te wekken, moet er in de partiële oxidatie-reactor een hoge krachtsdichtheid gerealiseerd worden. Dit wordt bereikt door een turbulente stroming toe te passen in de reactor, overeenkomstig gasturbineverbrandingskamers. Het partiële oxidatie-proces wordt gekarakteriseerd door een hoge brandstof/oxidator verhouding, ver van de stoichiometrische verhouding. Hieruit volgt dat partiële oxidatie overeenkomt met ultra rijke verbranding. Om een homogeen mengsel van aardgas en oxidator te

122 Samenvatting
verkrijgen in de reactor, wordt de stroom van oxidator en aardgas voorgemengd. Dit bevordert een efficiënte omzetting van aardgas naar synthesegas. Gebaseerd op deze argumenten, is het voorgestelde partiële oxidatie-proces gemodelleerd als een turbulent, rijk, voorgemengd verbrandingsproces. Het verbrandingsmodel is in twee delen opgesplitst. Het gasfase model voorspelt de gasvormige chemische stoffen en temperatuur. Hierbij wordt gebruik gemaakt van een reactievoortgangsvariabele en een enthalpieverliesvariabele om respectievelijk de voortgang van de chemische reacties in de gasfase en het warmteverlies als gevolg van straling van roet te kunnen berekenen. In het roetmodel wordt de vorming van roet beschreven met empirische processen van nucleatie, oppervlaktegroei, agglomeratie en oxidatie, gevat in twee parameters. Deze zijn de roetmassafractie en de roetdeeltjesdichtheid. De verbinding tussen de twee onderdelen van het model wordt gegeven door de concentratie van de voorloper van roet, acythyleen. Het verbrandingssmodel lost transportvergelijkingen op voor de reactievoortgangsvariabele, de enhalpievariabele en de roetparameters. Het model is geïmplementeerd in het numerieke stromingsberekeningspakket CFX-5 met het standaard k-ε turbulentie model.
Het turbulente rijke verbrandingsmodel is gebruikt om het partiële oxidatie-proces van aardgas te simuleren. De numerieke stromingsberekeningen laten zien dat het turbulente rijke verbrandingsmodel een nuttig gereedschap is om het snelheidsveld, voortgang van de chemische reacties, roetvorming en warmteverlies te kunnen voorspellen in een bepaald partiële oxidatie-reactor ontwerp. De simulaties lieten het effect zien van de diameter van de reactor en de concentraties van methaan en zuurstof in het mengsel op de omzettingsefficiëntie en de roetproductie in het partiële oxidatie proces.
Het projecteren van het gedetailleerde chemische systeem op de reactievoortgangsvariabele is gedaan met als aanname dat het partiële oxidatie-proces valt in het regime van gedistribueerde reactiezones. Dit is gecontroleerd door de verbrandingsregimen te analyseren. Zowel de Damköhler getallen (kleiner dan één) als het Borghi diagram lieten zien dat het partiële oxidatie-proces plaatsvindt in het regime van gedistribueerde reactiezones, waarmee de aanname gerechtvaardigd is.

Curriculum Vitae
Bogdan Alexandru Albrecht was born in Bucharest, on July 3, 1973. In 1991, he graduated the Mathematics-Physics 4 High-school from Bucharest. From 1991 to 1996, he studied Thermal Machines at the University Politehnica of Bucharest. In 1996, he followed a six months stage at Politecnico di Torino. He graduated in the same year with a thesis on knock in spark ignition engines. In the period 1996 − 1997, he pursued the master courses at the University Politehnica of Bucharest. He graduated with a thesis on lean mixtures combustion in spark ignition engines.
From 1997 to 1999, Bogdan worked as a Junior Scientist at the University Politehnica of Bucharest. In 1999, he started to work as a Ph.D. student in the Laboratory of Thermal Engineering, at the University of Twente. The Ph.D. project concerned the development of a turbulent rich combustion model for the partial oxidation of natural gas process.
As of September 1, 2004, Bogdan Albrecht is working as postdoctoral researcher in the Combustion Technology group of prof.dr. L.P.H. de Goey. This research involves the implementation of existing and new turbulent combustion models in a commercial CFD code.
Journal publications following from this thesis [1] Albrecht, B.A., Kok, J.B.W. and van der Meer, Th.H., Co-production of syngas
and power by integration of partial oxidation reactor, gas turbine and air separation unit, Energy - The International Journal, submitted for publication.
[2] Albrecht, B.A., Kok, J.B.W. and van der Meer, Th.H., Effect of pressure, residence time, equivalence ratio and type of oxidizer on partial oxidation of natural gas, Combustion Science and Technology, to be submitted.
[3] Albrecht, B.A., Kok, J.B.W. and van der Meer, Th.H., Turbulent rich combustion model for partial oxidation of natural gas, Combustion and Flame, to be submitted.

124 Curriculum Vitae
Acknowledgments
This Ph.D. thesis is the result of the research I performed in the Laboratory of Thermal Engineering, at the University of Twente. During this research, I had the support of many people to whom I am very grateful. I would especially like to thank • My promoter, Theo van der Meer and my assistant promoter, Jim Kok, for
scientific guidance, encouragement and help given with organizing and writing the thesis.
• My early promoter, Gerard Hirs, for giving me the opportunity of working as a Ph.D. student in the Thermal Engineering group and for his support in the first part of my work.
• Mannes Wolters, for accepting to be a member of my graduation committee. • Eddy Bramer, for his assistance in professional and extra-professional matters,
every time when I needed it. • Dirk Massink and Jan Bossink, for helping me in the initial part of my stay in the
Netherlands. • Eise Veenstra for his support in computer-related issues. • My former colleague, Arij van Berkel, for the insightful scientific discussions and
his assistance in various occasions. • Bram de Jager, Jaap van Kampen and Marco Derksen, for their support and
contribution to my work. • Nutte Dijkstra, for the nice cooperation on the present project and for introducing
me in the world of rugby. • Ziad Abu El Rub, for his help in numerous situations. • Sally Kloost, for her prompt administrative assistance. • Gerrit Brem, Genie Stoffels, Sjoerd Pater, Melle Holthuis, Mark Landman and
Chris Bakker for the nice discussions over coffee breaks and lunches. • The members of the Laboratory of Thermal Engineering, as a whole, for creating
such a pleasant working environment. • Loredana and Szabolcs Deladi, Rita and Octavian Petre, Andreea and Victor Popa
and Irina and Irinel Faraon, for their friendship and help whenever needed.
I would like to thank all my family members, for their permanent support and encouragements. I am especially grateful to my father, Alexandru, who had an important contribution in my formation as a scientist and to my mother, Viorica, for the care and love she put in raising me.
Above all, I am thankful to my wife, Gratiela, for loving me and being always
next to me and my daughter Ana, who brought so much happiness in our life.


