Page 1
Reactor vessel materials surveillance program for a long-term operation of a BWR.
Rogelio Hernández C., A. Liliana Medina A., E. Francisco Robles P., F. Javier Merino C., Jesús Romero C., Tonatiuh Rivero G.
Departamento de Tecnología de Materiales, Instituto Nacional de Investigaciones Nucleares, Carretera México-Toluca s/n, La Marquesa, C.P. 52750, Estado de México, México.
E-mail: [email protected]
ABSTRACT: Irradiation embrittlement is a limiting condition for the long-term safety
operation of a nuclear reactor pressure vessel (RPV). The first BWR in Mexico is approaching
its initial licensing life of 40 years. In order to operate the reactor for another 10 years and
more, it should be demonstrated that the irradiation embrittlement of the reactor vessel
materials will be adequately managed by ensuring that the fracture toughness properties are
above a certain level of the required safety margin. Experimental measurements of the
cleavage fracture toughness (KJc) of specimens were used to apply the Master Curve (MC)
approach to a reference RPV steel A533B Cl.1 provided by the International Atomic Energy
Agency (IAEA) as part of the surveillance programs of two BWR Units. This investigation
focused on three practical issues: the specimen geometry effects on the master curve results,
the specimen reconstitution techniques in an existing surveillance program, and the index
temperatures of an irradiation embrittlement when compared with the conventional Charpy
data. An average value of T0 = -62°C was obtained experimentally in this study using Charpy
specimens. Moreover, applying the constraint correction to the same data set of KJC for PCCv
resulted in T0,1T,SSY = -51.5°C, which was approximately equal to T0 = -54°C obtained from
the CRP-5 project for 1T-C(T) specimens. This result also validated the use of the Beremin
model to correct To for the loss of constraint effect. The ASME Code Case N-629 was applied
to the ASME KIc-reference curve indexed to RTTo: the results showed that this method was
less conservative than the current method, decreasing the restrictions imposed by the
operating pressure-temperature (P-T) limiting curves of the RPV and increasing the ease of
operation; the adjusted reference temperature (ARTNDT) was also found to always be more
conservative than the ARTTo.
Page 2
1.Introduction
One of the main concerns during a long-term operation of nuclear reactors is the
susceptibility of the reactor pressure vessel (RPV) to an irradiation embrittlement. The
degradation of nuclear reactor pressure vessel steels is primarily caused by neutron irradiation
embrittlement. This time-dependent degradation mechanism may affect the operating
conditions and limit the life of nuclear power plants. These steels exhibit a characteristic
transition between low-temperature brittle behavior and high-temperature ductile behavior.
The regulations in U.S. NRC 10CFR50, Appendix G "Fracture Toughness Requirements"
[1] and Appendix H "Reactor Vessel Material Surveillance Program Requirements" [2]
require monitoring of the changes in the fracture toughness of the vessel materials caused by
neutron irradiation throughout the service life of the vessel. Appendix G requires pressure-
temperature (P-T) limits and establishes limits on Charpy upper shelf energy (USE); also
specifies that the fracture toughness for ferritic steels must meet the acceptance and
performance criteria of Section XI, Appendix G of the ASME Code [3]. The limits for
pressure and temperature are required by 10CFR50 Appendix G for three categories of
operation: (1) hydrostatic pressure tests and leak tests, (2) core not critical heatup/cooldown,
and (3) core critical operation.
The key parameters that characterize the fracture toughness of a material are the reference
temperature of the nil-ductility transition (RTNDT) and the Charpy upper shelf energy (USE).
The adjusted reference temperature (ART) of the limiting beltline material is used to adjust
the beltline P-T curves to account for irradiation effects. U.S. NRC Regulatory Guide 1.99
rev.2 [4] provides the methods for determining the ART and Charpy USE.
The reference nil-ductility transition temperature RTNDT(U) describes the behavior of the
fracture toughness of the vessel material in the ductile-brittle transition (DBT) region before
irradiation; this temperature can be calculated using the ASME Code, Section III, Paragraph
NB-2331 and can be measured from Charpy impact tests and Pellini drop weight tests. This
parameter is used to index two generic curves, which were developed in 1973 and are
included in the ASME Code. The KIc curve (defined by Eq. 1) describes the lower envelope of
a large set of KIc data, whereas the KIR curve (defined by Eq. 2) is the lower envelope for a
combined set of KIc and KId data (from dynamical tests) and KIa data (from crack arrest tests):
therefore, the KIR curve is more conservative than the KIc curve.
(1)
Page 3
(2)
The effect of irradiation on the fracture toughness curve is determined from Charpy
impact tests. The change in the static fracture toughness (KIC) curve is equated to the variation
in the dynamic Charpy impact curve, as exemplified by ΔT41J, i.e., ΔRTNDT = ΔT41J [1].
This method of evaluating the fracture toughness of irradiated material is empirical and
cannot be fully justified on theoretical grounds. There is no direct correspondence between
the Pellini/Charpy results and the fracture toughness under un-irradiated conditions. In
addition, the irradiation effect is obtained from impact data, whereas the fracture toughness
(KIC) is a quasi-static measurement.
The U.S. NRC Regulatory Guide 1.99 rev.2 [4] and Draft rev.3 [5] and ASTM E900 [6]
predict the neutron irradiation shift of the Charpy transition temperature impact curve indexed
to 41J for the reactor vessel even in the absence of credible surveillance data: this prediction
is made using an equation based on the chemical composition of the steel and the neutron
fluence received. A reliable alternative to this semi-empirical indirect methodology is the
Master Curve (MC), which is based on the direct characterization of fracture toughness in the
DBT region: the MC was originally proposed by Wallin [7,8] and has been standardized in
ASTM E 1921-12 [9].
Irradiation produces similar shifts in the Charpy impact and fracture toughness curves [1];
therefore, existing ∆T 41J curves can be used to estimate the transition temperature shift
indexed to T0 (ΔTTo). The following empirical relationships are obtained between the
irradiation-induced embrittlement, as measured by the Charpy impact energy, and the
cleavage fracture toughness: ΔTTo = 1.0xΔT41J for weld metals and ΔTTo = 1.16xΔT41J for
base metals [10, 11].
The statistical basis of the MC enables a tolerance bound to be determined that is
equivalent to the envelope of the ASME KIc fracture toughness reference curve; thus, in 1999,
Wallin [12] showed that the ASME KIc-reference curve corresponded approximately to the
5% tolerance bound on the MC failure probability.
In 1999, following advances in the MC methodology, ASME published Code Case N-
640, "Fracture Toughness Reference for Alternative Development of P-T Limit Curves",
Section XI, Division 1 [13], which allowed the ASME curve KIC (RTNDT) to be used as an
alternative to the KIR (RTNDT) curve, and Code Case N-629, "Use of fracture toughness test
data to establish the reference temperature for pressure retaining materials" [14], which
Page 4
allowed the RTTo reference temperature to be used as an alternative to the RTNDT to index the
ASME KIC- and KIR-reference curves. The following equation defines RTTo:
(3).
This new MC-based method can be compared to the 10CFR50 method, which is based on
the RTNDT, by using the RTNDT and RTTo values for a JRQ material under un-irradiated and
irradiated conditions. This approach could at a later stage be applied to the actual material of
Laguna Verde reactor pressure vessel (LV RPV). As an exercise, the experimental transition
temperature shifts, ΔTTo and ΔT41J [15, 16, 17, 18] (Table 3), can be used to apply the MC
approach to the LV RPV Unit 2 integrity assessment. It is understood that actual assessment is
to be performed on material data fully representative of LV RPV.
The LV RPV Unit 1 and 2 vessels were fabricated in 1974 by Chicago Bridge & Iron
(CB&I) under the 1971 Edition of the ASME Code. The plates were manufactured for CB&I
by Lukens Steel Company in 1974 [19]. All heats of plate material in the BWR/5 vessels were
from electric furnaces [19, 20, 21]. The vessels are similar to other BWR vessels fabricated by
CB&I (for example Duane Arnold Reactor Pressure Vessel (DA RPV) Unit 1 from USA) [22,
23].
The LV RPV Unit 1 and 2 are primarily constructed from low alloy, high strength steel
plate and forgings. Plates are ordered to ASME SA 533 Grade B Class 1, and forgings to
ASME SA 508, Class 2. These materials are melted to fine grain practice and are supplied in
the quenched and tempered condition. Further restrictions include requirements for vacuum
degassing to lower the hydrogen level and improve the cleanliness of the low alloy steels. The
shells and vessel heads are made from formed plates, and the flanges and nozzles from
forgings. Welding performed to join these vessel components was in accordance with
procedures qualified per ASME Section III and IX requirements. Submerged arc and manual
stick electrode welding processes are employed. Electroslag welding was not permitted [19].
As describe above the steel for LV RPV Unit 1 and 2 vessels was produced by the Basic
Oxygen Furnace (BOF, primary refining) and degassing and final refining (secondary refining
using electric furnaces) process. Then the plates for reactor pressure vessels of LV NPP Unit
1 and Unit 2 were produced by a similar process of JRQ plates [24]. Therefore the JRQ steel
might be representative of LV RPV. Since, as it will be seen further, in section 5 (Tables 1
and 2), the mechanical properties and chemical composition of JRQ steel are similar to LV
RPV.
Page 5
Three issues are considered in this study. a) The specimen geometry effect on the master
curve results. Cleavage fracture toughness data obtained from PCCv specimens are corrected
for the loss of constraint using the Beremin model [25,26]. The effect of the loading rate on
the MC reference temperature, T0, is investigated by analyzing data obtained for JRQ steel
over the 0.05 to 5 MPa√m/s range, showing the sensibility of T0 to variations in the loading
rate. The T0 results are also compared with an empirical relation, developed by Wallin [27],
between the load rate, dK/dt, and the increase in the reference temperature, ∆T 0. b). Specimen
reconstitution techniques in an existing surveillance program. c) The Master Curve is finally
obtained using the reference temperature T0 for the fracture toughness in the DBT region,
under both un-irradiated and irradiated conditions. The results using the classical
methodology based on the reference temperature RTNDT are compared with those based on the
directly measured reference temperature indexed to T0 (RTTo). In this way, the safety margin
of the conventional method can be properly analyzed.
2.Technical background for the evaluation methodology
2.1 Adjusted reference temperature ARTNDT from Charpy impact tests
The U.S. Regulatory Guide 1.99 rev.2 [4] and Draft rev.3 [5] models the effect of the
neutron fluence on the transition temperature as follows:
(4),
where ARTNDT denotes the adjusted reference temperature with irradiation effects; RTNDT(U) is
the nil-ductility reference temperature for the un-irradiated material, ΔRTNDT = ΔT41J, as
determined from irradiated Charpy impact test specimens; and M= , where σI is
the standard deviation in RTNDT and σΔ is the standard deviation in ΔRTNDT. The Regulatory
Guide 1.99 rev. 2 states that if the value of RTNDT(U) is determined experimentally, then σI =
0, otherwise σI = 9.4°C The value of σΔ is 4.7°C for plates and forgings and 7.8°C for welds if
the surveillance capsules are deemed credible, otherwise σΔ is 9.4ºC for plates and forgings
and 15.6°C for welds.
Page 6
A capsule is credible if ΔRTNDT (estimated) - ΔRTNDT (measured) ≤ 15.6°C for welds or 9.4ºC for
plates and forgings [4].
The Regulatory Guide 1.99 rev.2 establishes that , where CF
denotes the chemistry factor and is the fluence factor.
Another way to calculate ARTNDT is to use the Charpy data for ΔT41J to determine the
material specific chemistry factor from two or more sets of credible surveillance data from
one reactor, following [4]:
(5),
where n denotes the number of tested surveillance capsules and FF(i) is the fluence factor of
capsule (i).
2.2 Application of ASME Code Cases N-629 and N-631
ASME Code Case N-631 (Section III) defines RTTo for un-irradiated reactor vessel
materials, and ASME Code Case N-629 (Section XI) defines RTTo for un-irradiated and
irradiated reactor vessel materials.
Different methodologies can be used to estimate the ART at EOL and EOLE using the
RTTo and a suitable margin term. One methodology involves combining the alternative initial
reference temperature, RTTo(U), based on Code Case N-629, with the R.G. 1.99 rev.2
prediction for the Charpy shift or the Master Curve prediction for the shift [10, 11, 28]:
(6),
where M is a term that accounts for uncertainties in the initial value of RTTo (σI) and the
uncertainty in the shift (σ∆), and ∆RT represents the irradiation-induced shift of the Charpy or
fracture toughness [10, 11, 28]:
(7),
Page 7
where CF is the chemistry factor for the temperature shift at a Charpy energy of 41J, CFCVN,
or for the fracture toughness shift, CFTo; and f is the fluence at the inner surface (1019 n/cm2
(E>1 MeV)).
The margin M term includes the uncertainty σI associated with RTTo(U) and the uncertainty
σΔ [11, 28] associated with ΔRT. The uncertainty σI is the sum of the uncertainties in the
material variation from a Monte Carlo (σMC) analysis of different vessel steels [11] and the
uncertainty in the measurement of T0 (σTo):
(8).
The margin from Regulatory Guide 1.99 rev.2 and reference [11] is as follows:
(9).
Using the shift for the transition fracture toughness temperature at 100 MPa√m, ΔT 100
(ΔTTo), yields ARTTo = RTTo(U) + ∆RT To(Irr) + M, where , and FF is the
fluence factor and CFTo is the material specific chemistry factor for the fracture toughness
shift from Regulatory Guide 1.99 rev.2 and references [11, 28]:
(10),
where n denotes the number of tested surveillance capsules and FF(i) is the fluence factor for
capsule (i).
A second methodology involves directly measuring the irradiated RTTo. The form of the
ART within this direct measurement approach is similar to that in Equation 6, except the
measured RTTo(irr) is extrapolated to the EOL and EOLE fluences [11, 28]:
(11),
Page 8
where is the fluence factor, CFCVN is taken from the base metal table in
Regulatory Guide 1.99, rev.2, and ∆FF is the difference in FF at the irradiated point between
the EOL and EOLE fluences.
The margin term M is given as follows [11]:
(12).
From reference [11], the uncertainties affecting the irradiation changes in the fracture
toughness are σTo (irr) = 4.43°C, σφt = 4°C, σCu = 6°C, σNi = 4°C, σTirr = 2°C, and σProj = 0°C,
where σφt is the uncertainty in the neutron fluence, σTirr is the uncertainty in the irradiation
temperature, and σProj is the uncertainty from projection to higher fluences.
3. Effect of specimen geometry on the master curve (MC) reference temperature T0
One of the main issues in the field of a fracture toughness testing is the effect of specimen
size or geometry. In general, the measured fracture toughness would be higher in smaller
specimens due to loss of a crack tip constraint. These effects should be identified rationally
because the fracture behaviors of a large structure are predicted from smaller specimen tests.
A systematic difference between the MC reference temperatures, T0, obtained from
precracked Charpy single-edge notched bend (SE(B)) (PCCv) specimens and 1-inch thickness
Compact Tension (C(T)) specimens has been reported in the literature [15,16] and
acknowledged since version 2003 of the ASTM E1921 Standard [9]. This systematic “bias”
leads to higher T0s obtained from 1T-C(T) specimens than from PCCv specimens. This
difference is typically 15°C, but there can be large variations in the “bias” because of limited
statistics. The results for 1T-C(T) specimens are thus generally more conservative than those
for PCCv specimens. This phenomenon has been attributed to the difference in the constraint
conditions for these two geometries. This difference in the T0 reference temperature has often
been designated as a specimen “bias” effect, and has been mainly explained in terms of the
loss of constraint in PCCv specimens.
In determining T0, the “bias” between the PCCv and 1T-C(T) specimens has been
reported as 18°C by Brumovsky [16] and as 12°C by Server [16], which corresponds to an
average "bias" of 15°C for JRQ steel.
Page 9
The “local approach” to fracture (a model that is based on the physical micromechanisms
of the cleavage fracture process) can be used to correct the loss of constraint for fracture
toughness measurements of subsize specimens. One of the most commonly used models was
originally developed by Beremin [29] and developed further by several authors [30, 31]; this
statistical method is based on the concept of the Weibull stress. Dodds et al. modeled the
effect of the loss of constraint on the value of T0 by using a function g(M), given below,
coupled with a size correction from the MC [25]:
(13),
where KJC,1T,SSY denotes the cleavage fracture toughness with a size correction for a one-inch
thickness specimen under a high constraint small-scale yielding (SSY) condition; Kmin
denotes the minimum fracture toughness of 20 MPa√m; K JC denotes the fracture toughness
for a specimen with thickness B; g is the Gao non-dimensional constraint function; and M =
bσ0/J.
In this work, experimental data are obtained for a A533 Grade B Class 1 Reactor Pressure
Vessel (RPV) plate steel using standard and subsize specimens, such as compact tension
specimens (i.e., 1T-C(T), 0.4T-C(T), and 0.16T-C(T)) and precracked Charpy (PCCv)
specimens, under non-irradiated conditions; these data are analyzed within the MC approach
in the DBT region. As it has been said before, and it will be seen in section 5, JRQ steel has
been selected for this study since its chemical composition and mechanical properties are
similar to LV RPV.
The tests were performed following ASTM E1921-05 using a mechanical testing servo-
hydraulic machine. The displacement was measured along the load line ∆ LLD during testing;
for the C(T) specimens, a clip-on gage type extensometer was used to monitor the crack
mouth opening displacement (CMOD), whereas a linear variable differential transformer
(LVDT) meter, in the piston core of the servo-hydraulic actuator machine, was used for the
PCCv specimens. For the PCCv specimens, the measured displacements were corrected by
subtracting the elastic deformation of the load frame, the bend test fixture, and the extension
grips; in all tests, an extensometer was used for the PCCv specimen, in order to calibrate the
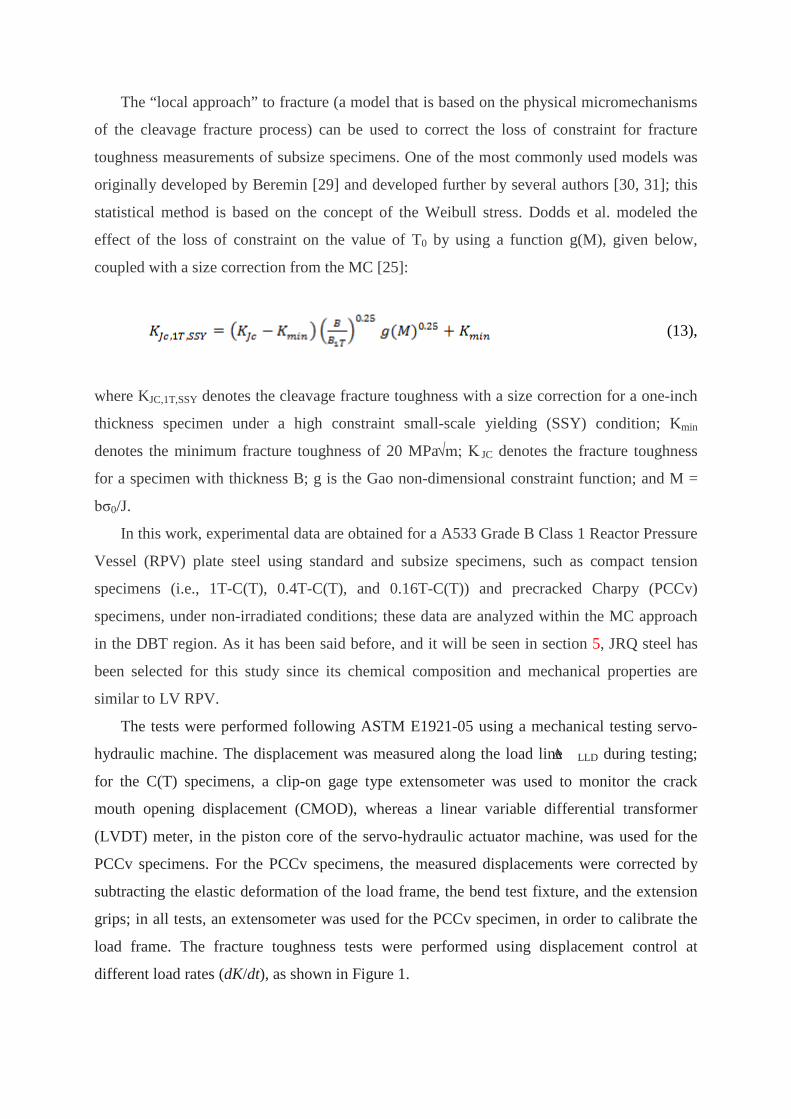
load frame. The fracture toughness tests were performed using displacement control at
different load rates (dK/dt), as shown in Figure 1.
Page 10
Figure 1. Fracture toughness tests under displacement control at different load rates
An environmental chamber operating in the temperature range from −110 to 250°C was
used. During the tests, the load and the displacements (i.e., the CMOD and the LVDT) were
recorded using a data logging system. The tests were performed at different temperatures. To
cool the chamber down, liquid nitrogen was injected in a controlled manner. A K-type
thermocouple was used to measure the temperature inside the specimen notch and to provide
feedback to the control unit. The system took 0.5 hour to stabilize to the test temperature prior
to testing at the nominal temperature of ±2°C.
The calculations and analysis of results were performed following ASTM E1921-05. The
reference temperature T0 was determined using the multi-temperature method.
The crack length was obtained following ASTM E1921-05, by averaging nine
measurements.
Figure 2 shows the values for the cleavage fracture toughness (KJC) as a function of T-T0
for the PCCv and C(T) specimens.
Page 11
Figure 2 Experimental data from tests for the cleavage fracture toughness (KJc(1T)) on PCCv
and C(T) specimens of JRQ steel
The difference between the T0 values obtained for the different subsize specimens, i.e.,
the precracked Charpy single-edge notched bend (SE(B)) (PCCv) specimens and the 1-inch
thick compact tension (C(T)) specimens, is known as "bias" (American nomenclature). This
difference in T0 is attributed to the differences in the specimen geometry and the applied load
mode.
The average “bias” value obtained experimentally was 12°C, and the average “bias” value
for the PCCv specimens from the Beremin model was 10.4°C, corresponding to a difference
of 1.6°C between the results of the two methods: therefore, the Beremin model can be used to
correct T0 to a good approximation because of the loss of constraint effect.
Applying the constraint correction to the PCCv KJc data set resulted in an average
T0,1T,SSY = -51.5°C, which was approximately equal to T0 = -54°C for the 1T-C(T) specimens
from the CRP-5 project [16]; therefore, the constraint correction to T0 [25,26] using the
Beremin model was a good approximation.
Figure 3 shows that the reference temperatures (the T0s) with the constraint correction for
the PCCv specimens were within ±2σTo standard deviations from the experimental results for
the C(T) specimens.
Page 12
0.01 0.1 1 10-80
-70
-60
-50
-40
-30
-20
C(T) PCCv Constraint correction Wallin
To (°
C)
dK/dt (MPam1/2/s)
±2σΤο
Figure 3 Comparison between the experimental data for the Master Curve reference
temperature T0 for A533B Cl.1 (JRQ) and Wallin’s empirical relation [27]
4. Specimen reconstitution from existing surveillance programs
The amount of irradiated material available is generally limited to broken Charpy
specimens from surveillance programs. There are several ways of using these broken halves
to determine the reference temperature T0 using the MC methodology. Reconstitution and
machining of subsize specimens are the two main ways of directly evaluating the fracture
toughness in a surveillance materials program for nuclear reactor pressure vessels. MC
methodologies have been developed at the National Nuclear Research Institute (ININ) in
Mexico using standard precracked Charpy single-edge notched bend (SE(B)) (PCCv)
specimens [32] and by reconstituting Charpy specimens by stud welding [33]. Using stud
welding for reconstitution [NORMA ASTM E1253] is time-consuming because of the
machining operations involved, and a large amount of broken Charpy specimens are still
required. An alternative is to use subsize 0.16T-C(T) specimens and to obtain four specimens
from a half-broken tested Charpy specimen [34]. In Mexico, a materials surveillance program
is currently being conducted for the two boiling water reactors (BWRs) at the Laguna Verde
NPP (LV NPP); the plant license extension is also in progress for Unit 1: therefore, the
remaining materials surveillance program using the broken Charpy specimens needs to be
reanalyzed within the licensing application framework for the operational license extension.
Instead of disposing of the tested materials, the specimens were reconstituted and returned to
the reactor for further irradiation. The advantage to reconstituting irradiated materials is that
the irradiation process can continue with only a one or two fuel cycle interruption. The new
Page 13
capsules placed into the vessels are therefore useful for the plant license extension purposes,
as it will essentially keep pace with the irradiation of the vessel and it could be available for
surveillance testing beyond 32 EFPY.
The qualification of welding process was conducted in accordance with ASTM Standard E
1253-99, and there are three principal qualification requirements: a). The temperature in the
central 1 cm3 of the insert must not exceed the irradiation temperature of the reactor (288°C)
at any time during welding; b). At least six Charpy specimens of new material will be used to
determine the ductile-brittle transition curve. One of the halves from the previous test will be
reconstituted and new Charpy specimens will be machined and tested at the same
temperature, direction, and orientation as the first test. Curves for the original and
reconstituted specimens and the transition temperatures must be similar; c). Reconstituted
specimens must not fracture in the reconstituted weldment.
Nine Charpy specimens were machined from JRQ, which is an ASTM A533 grade B Class 1
steel, similar to that of the reactor vessel. These specimens are the original specimens for
qualification. Impact testing was performed on the 9 JRQ steel Charpy specimens at different
temperatures in accordance with ASTM E23. The end tabs and insert were cleaned in an
ultrasound vat, using acetone as dissolvent. The reconstitution sequence is shown in Figure 4.
Figure 4. Weld reconstitution sequence of the Charpy broken halves
Page 14
In the welding process, a flat circular ceramic is used over the insert and another circular
ceramic over the end tab; the function of these ceramics is to hold the melt between them.
Helium was used as shielding gas as shown in Figure 5.
Figure5. Placement of ceramics and flow device
The three-point bend Charpy qualification testing was used to establish the rejection criteria
for a defect on the notch face of the specimen and for a defect on the specimen sides or back.
The acceptance criteria are as follow:
a).Up to a defect area of 8 mm2 for the same side of the notch surface is acceptable, and
neither defect area for the sides and back of the specimen.
b).Up to a defect area of 18 mm2 for the sides and back of the specimen is acceptable, and
neither defect area for the same side of the notch surface.
c).Up to a defect area of 6 mm2 for the same side of the notch surface and 13 mm2 if the
defect area is on the sides or back of the specimen, is acceptable
After the reconstitution welds for the 18 new Charpy specimens were completed and
specimens had been machined to qualification testing. Three-point bend Charpy testing were
performed as shown in Figures 6 and 7. The Figures 8 to 11 show the visual inspection of all
four faces of each arc stud welding indicated adequate fusion and penetration or lack of
penetration of weld. Visual examination of each welded assembly indicated that, in the main,
all faces appeared to be coplanar to each other.
Page 15
Figure 6. Three-point bend testing on reconstitution Charpy specimens of JRQ steel
Figure 7. Comparison of fracture resistance in the reconstituted weldment between different
defect area on Charpy with and without notch.
Page 16
Figure 8. Charpy reconstituted samples with different defect area and Charpy-v tested
Figure 9. Charpy reconstituted sample used to establish the rejection criteria
Figure 10. Charpy-v reconstituted sample used to establish the rejection criteria
Page 17
Figure 11. Charpy reconstituted sample without any defect area
Each reconstituted specimen was impact tested at the same test temperature as the respective
original Charpy-v specimen. Figure 12 shows the values for the impact energy as a function
temperature for the Charpy-v and reconstituted Charpy-v specimens.
Figure 12. Comparison of energy curves between original and reconstituted specimens for
Plate JRQ.
Page 18
5. Using Charpy data to assess irradiation embrittlement
The reactor pressure vessel (RPV) surveillance program consists of three surveillance
capsules at 30°, 120°, and 300° azimuths at the core midplane. The specimen capsules are
held against the RPV inside surface by a spring loaded specimen holder. The capsule
contained three Charpy packets and five tensile specimen tubes. Each Charpy packed
contained 12 or 8 specimens (either base, weld or HAZ material) and three wires (one each of
copper, nickel and iron). The five tensile tubes contained a total of 10 specimens. The Charpy
packets and tensile tubes maintained a sealed helium environment.
The Charpy specimens recovered from the surveillance capsule were impact tested at
temperatures selected to establish the toughness transition and upper shelf of the irradiated
RPV materials. Testing was conducted in accordance with ASTM E23.
The impact test machine was calibrated using NIST Standard Reference Material specimens.
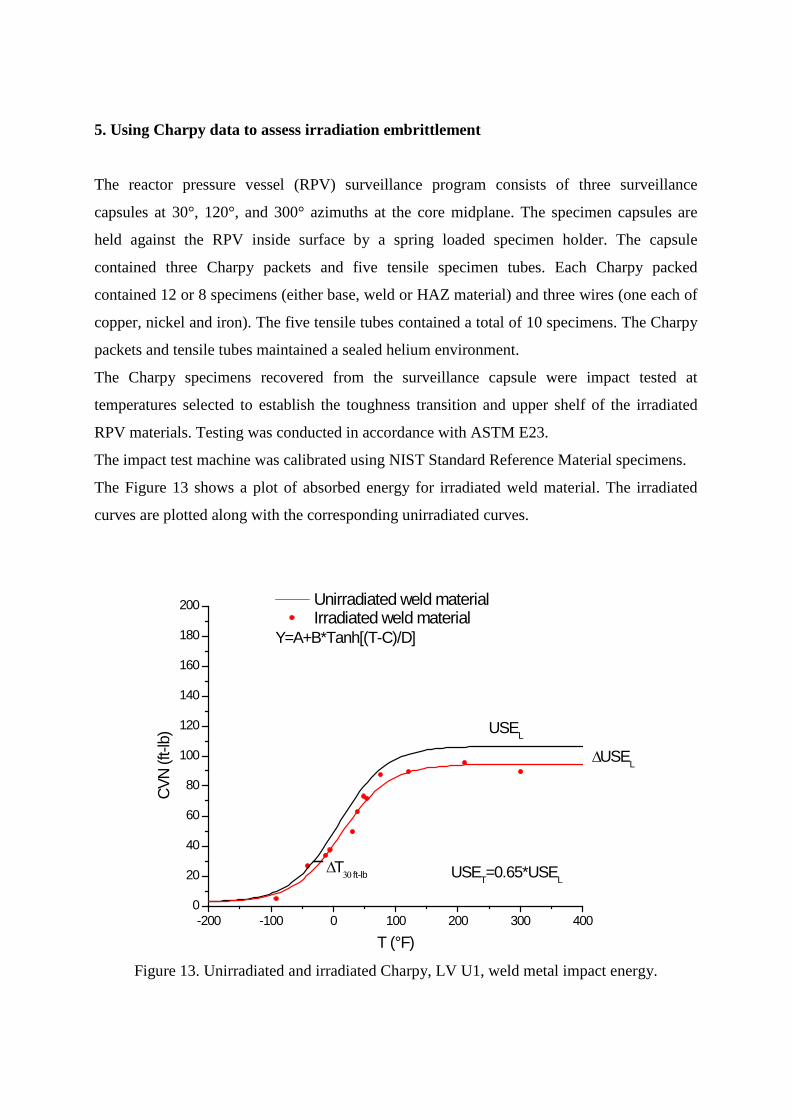
The Figure 13 shows a plot of absorbed energy for irradiated weld material. The irradiated
curves are plotted along with the corresponding unirradiated curves.
-200 -100 0 100 200 300 4000
20
40
60
80
100
120
140
160
180
200 Unirradiated weld material Irradiated weld material
CVN
(ft-lb
)
T (°F)
∆T30 ft-lb
USEL
∆USEL
USET=0.65*USEL
Y=A+B*Tanh[(T-C)/D]
Figure 13. Unirradiated and irradiated Charpy, LV U1, weld metal impact energy.
Page 19
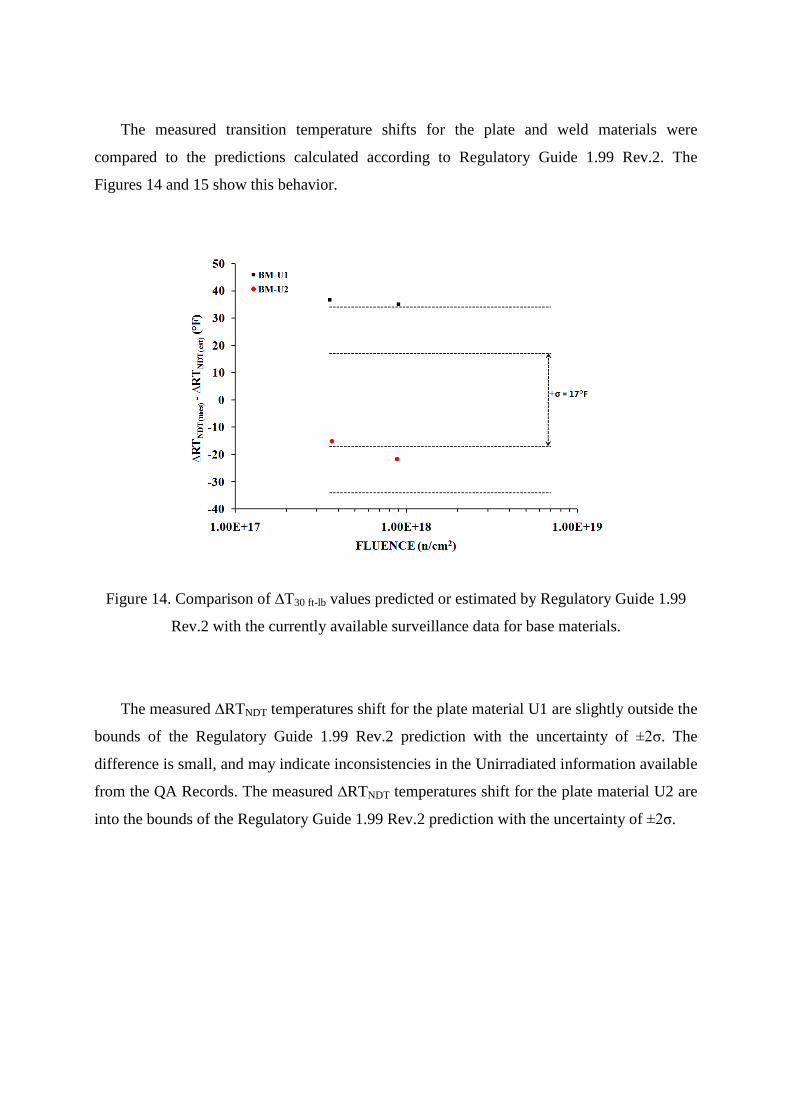
The measured transition temperature shifts for the plate and weld materials were
compared to the predictions calculated according to Regulatory Guide 1.99 Rev.2. The
Figures 14 and 15 show this behavior.
Figure 14. Comparison of ∆T30 ft-lb values predicted or estimated by Regulatory Guide 1.99
Rev.2 with the currently available surveillance data for base materials.
The measured ∆RTNDT temperatures shift for the plate material U1 are slightly outside the
bounds of the Regulatory Guide 1.99 Rev.2 prediction with the uncertainty of ±2σ. The
difference is small, and may indicate inconsistencies in the Unirradiated information available
from the QA Records. The measured ∆RTNDT temperatures shift for the plate material U2 are
into the bounds of the Regulatory Guide 1.99 Rev.2 prediction with the uncertainty of ±2σ.
Page 20
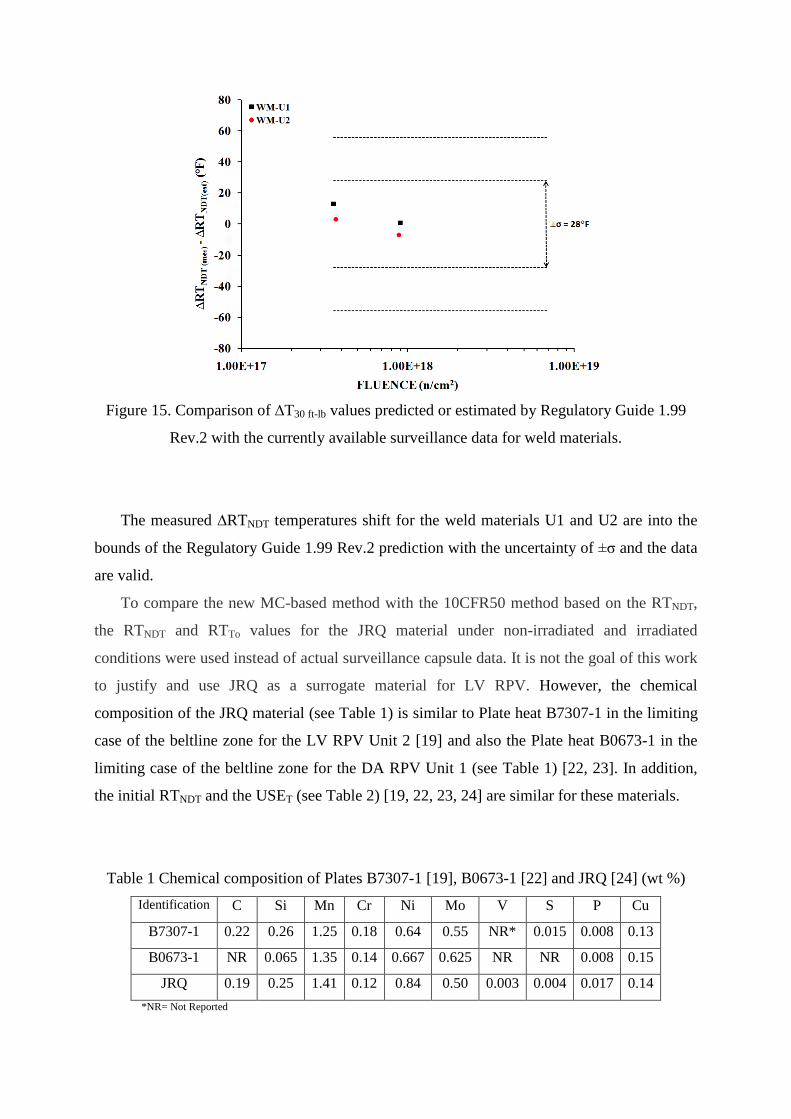
Figure 15. Comparison of ∆T30 ft-lb values predicted or estimated by Regulatory Guide 1.99
Rev.2 with the currently available surveillance data for weld materials.
The measured ∆RTNDT temperatures shift for the weld materials U1 and U2 are into the
bounds of the Regulatory Guide 1.99 Rev.2 prediction with the uncertainty of ±σ and the data
are valid.
To compare the new MC-based method with the 10CFR50 method based on the RTNDT,
the RTNDT and RTTo values for the JRQ material under non-irradiated and irradiated
conditions were used instead of actual surveillance capsule data. It is not the goal of this work
to justify and use JRQ as a surrogate material for LV RPV. However, the chemical
composition of the JRQ material (see Table 1) is similar to Plate heat B7307-1 in the limiting
case of the beltline zone for the LV RPV Unit 2 [19] and also the Plate heat B0673-1 in the
limiting case of the beltline zone for the DA RPV Unit 1 (see Table 1) [22, 23]. In addition,
the initial RTNDT and the USET (see Table 2) [19, 22, 23, 24] are similar for these materials.
Table 1 Chemical composition of Plates B7307-1 [19], B0673-1 [22] and JRQ [24] (wt %) Identification C Si Mn Cr Ni Mo V S P Cu
B7307-1 0.22 0.26 1.25 0.18 0.64 0.55 NR* 0.015 0.008 0.13
B0673-1 NR 0.065 1.35 0.14 0.667 0.625 NR NR 0.008 0.15
JRQ 0.19 0.25 1.41 0.12 0.84 0.50 0.003 0.004 0.017 0.14 *NR= Not Reported
Page 21
Table 2 Initial RTNDT and USET data for Plates B7307-1 [19], B0673-1 [22, 23] and JRQ [24]
Identification Cu (wt %)
Ni (wt %)
Initial
RTNDT °C(°F)
T0(U)
(°C)
Initial
RTTo(U)
(°C)
CF °C(°F) Initial USET
J(ft-lb)
Plate B7307-1 0.13 0.64 -18(0) --- --- 51(92) 91(67)(1)
Plate B0673-1 0.15 0.667 -12(10) --- --- --- 139.2(102.7)(3)
Plate JRQ 0.14 0.84 -15(5) -54 -34.6 58(105) 187.8(138.5)(2)
(1)-12°C Impact Energy (2)100°C Impact Energy (3)USET = 0.65USEL [35]
(1)Unfortunately, for some BWR/5 plants, CB&I only recorded the required qualification
Charpy data, typically at 10°F(-12°C) or 40°F(4.4°C), so initial USE data are not available for
these plants’ plates [19].
Therefore, the experimental transition temperature shifts ΔTTo and ΔT41J [15, 16, 17, 18]
(see Table 3) could be used as an exercise to apply the MC approach for the LV RPV Unit 2
integrity assessment.
Table 3 Experimental transition temperature shift indexed
to 41J and to T0 for a JRQ irradiated material [15, 16, 17, 18]
Fluence
(x1019n/cm2)
T0(Irr)
(°C)
∆T41J
(°C)
∆TTo
(°C)
(2)RTTo(Irr)
(°C)
0.36 -24 52 47 10.4
2.90 38 80 104 72.4
4.50 66 116 134 100.4
4.46 64(1) 76 110 83.4 (1)Constraint correction included
(2)Using Eq (3) and “bias” = 15°C for the irradiated material [15]
Page 22
Figure 16 Application of the ASME N-629 and N-631 Code Cases to the ASME KIc-reference
curve at a fluence of 3.6×10¹⁸ n/cm2
The N-629 and N-631 ASME Code Cases were applied to equation (1): the results are
plotted in Figure 16, showing that the ASME KIc-reference curve indexed to RTTo was less
conservative than the ASME KIc-reference curve indexed to RTNDT, which was further to the
left, i.e., the pressure-temperature (P-T) operating limit curves would become less restrictive
and easier to operate. The resulting difference of 21.4ºC for RTTo translates to several more
years of operation at full power.
Fitting the P-T curves to account for neutron embrittlement has the effect of restricting
the operation window for the vessel. Expanding the operating window in a BWR can reduce
the hydrostatic leak test temperature. A recirculation pump can be used with a BWR to raise
the leak test temperature. Under the current Appendix G criteria, many BWR plants are
required to perform the pressure test at temperatures over 212°F (100ºC). These high test
temperatures can result in several problems, such as pump cavitation, damage to the seals, and
the triggering of cooling systems: security leak detection is also difficult because the leak is
gaseous. Reducing the temperature of the leak test minimizes all of these problems [36].
Figures 17 and 18 show plots of ΔRT and ART versus the neutron fluence, as well as two
data points from Laguna Verde´s Unit 2 that reached 6.65 EFPY and 14.65 EFPY. Figures 17
and 18 compare the estimated reference temperature shift (ΔRT) and the adjusted reference
temperature (ART) with those determined from measurements as part of the materials
surveillance program for the BWR Unit 2. The fluence and the transition temperature shift
(ΔT41J) measurements were obtained from personal communication with researchers from the
Reactor Materials Surveillance Area. Figures 17 and 18 show that the two results are well
within the regulation requirements of ±2σ (9.4°C for plates) and are also below the predicted
or estimated curves.
Page 23
Figure 17 Estimated ΔRT41J-reference temperature shift curves, following RG1.99 rev.2 and
Draft rev.3 and ASTM E900, compared to experimental measurements of the Charpy impact
for Plate JRQ and Plate B7307-1 and the cleavage fracture toughness shifts for Plate JRQ
Figure 17 shows that using the Regulatory Guide 1.99 Draft rev.3 resulted in more
realistic predictions for the ΔRT curves than using R.G.1.99 rev.2 and ASTM E900 and fitted
the experimental Charpy data more accurately. In contrast, the experimental data for the
cleavage fracture toughness tests were higher than both the Charpy impact test data and the
predicted curves based on the Charpy impact test data.
Figure 18 Estimated ART-adjusted reference temperature curves, following RG1.99 rev.2 and
Draft rev.3 and ASTM E900, compared to the experimental Charpy impact data for Plates
JRQ and B7307-1, and the cleavage fracture toughness tests for Plate JRQ.
Page 24
Figure 18 shows that the adjusted reference temperature (the ARTNDT, which was
obtained from the Charpy impact tests) was always more conservative than the ARTTo (which
was obtained using Code Case N-631 with a material-specific chemistry factor). Thus, using
the RTT0 value results in an increase in the vessel lifetime. This figure also shows that using
the Regulatory Guide 1.99 Draft rev.3 produced an upper limit curve, i.e., all of the Charpy
impact and fracture toughness tests with non-irradiated and irradiated materials and the
estimated using R.G.1.99 rev.2 and ASTM E900 were below or within the range of
uncertainty of the curve predicted using R.G.1.99 Draft rev.3.
6. Upper-shelf energy (USE)
The requirements from 10 CFR Part 50 Appendix G “Fracture Toughness Requirements”
[1] for reactor vessel beltline materials are as follows: there must be a Charpy upper-shelf
energy (USE) in the transverse direction for base and heat-affected zone materials and along
the weld for weld material; and specifies that the USE must be no less than 75 ft-lb (102 J)
initially and should be maintained throughout the vessel life at no less than 50 ft-lb (68 J),
unless it is demonstrated that lower USE values will provide margins of safety against
fracture equivalent to those required by Appendix G of Section XI of the ASME Code.
The U.S. NRC Regulatory Guide 1.161 “Evaluation of reactor pressure vessels with
Charpy Upper-Shelf Energy less than 50 ft-lb” [37] specifies the general procedures for
demonstrating equivalence to the margins of safety in Appendix G of the ASME Code that
are acceptable to the NRC staff.
This guide provides comprehensive guidance on RPV evaluation acceptable to the NRC
staff when the Charpy upper-shelf energy falls below the 50 ft-lb limit specified by 10 CFR
Part 50, Appendix G. The analysis methods in the Regulatory Guide are based on methods
developed for the ASME Code, Section XI, Appendix K [38].
The MC can be used to define the transition fracture toughness values to assess the
fracture integrity of structures. However, when assessing the fracture integrity, the conditions
of interest cannot be assumed a priori to be in the transition fracture mode. When upper-shelf
conditions prevail at sufficiently high temperatures, the material fracture resistance can be
appropriately characterized using the JIc and the J-R curve.
Page 25
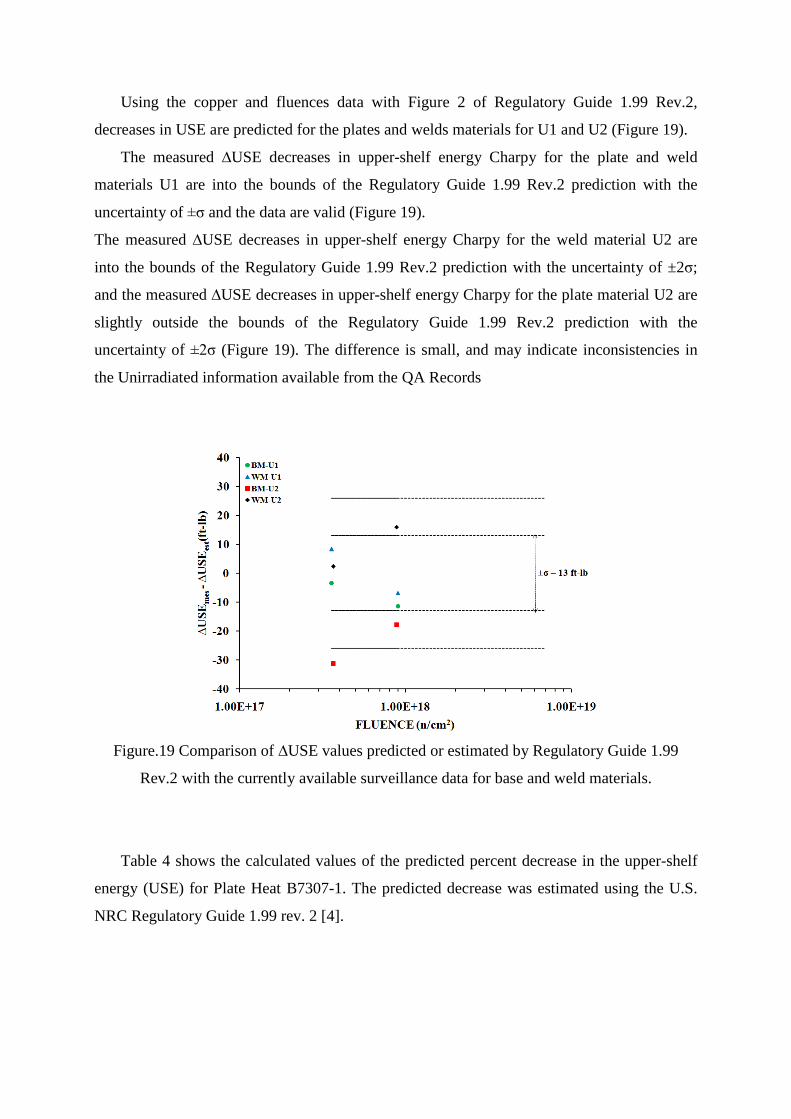
Using the copper and fluences data with Figure 2 of Regulatory Guide 1.99 Rev.2,
decreases in USE are predicted for the plates and welds materials for U1 and U2 (Figure 19).
The measured ∆USE decreases in upper-shelf energy Charpy for the plate and weld
materials U1 are into the bounds of the Regulatory Guide 1.99 Rev.2 prediction with the
uncertainty of ±σ and the data are valid (Figure 19).
The measured ∆USE decreases in upper-shelf energy Charpy for the weld material U2 are
into the bounds of the Regulatory Guide 1.99 Rev.2 prediction with the uncertainty of ±2σ;
and the measured ∆USE decreases in upper-shelf energy Charpy for the plate material U2 are
slightly outside the bounds of the Regulatory Guide 1.99 Rev.2 prediction with the
uncertainty of ±2σ (Figure 19). The difference is small, and may indicate inconsistencies in
the Unirradiated information available from the QA Records
Figure.19 Comparison of ∆USE values predicted or estimated by Regulatory Guide 1.99
Rev.2 with the currently available surveillance data for base and weld materials.
Table 4 shows the calculated values of the predicted percent decrease in the upper-shelf
energy (USE) for Plate Heat B7307-1. The predicted decrease was estimated using the U.S.
NRC Regulatory Guide 1.99 rev. 2 [4].
Page 26
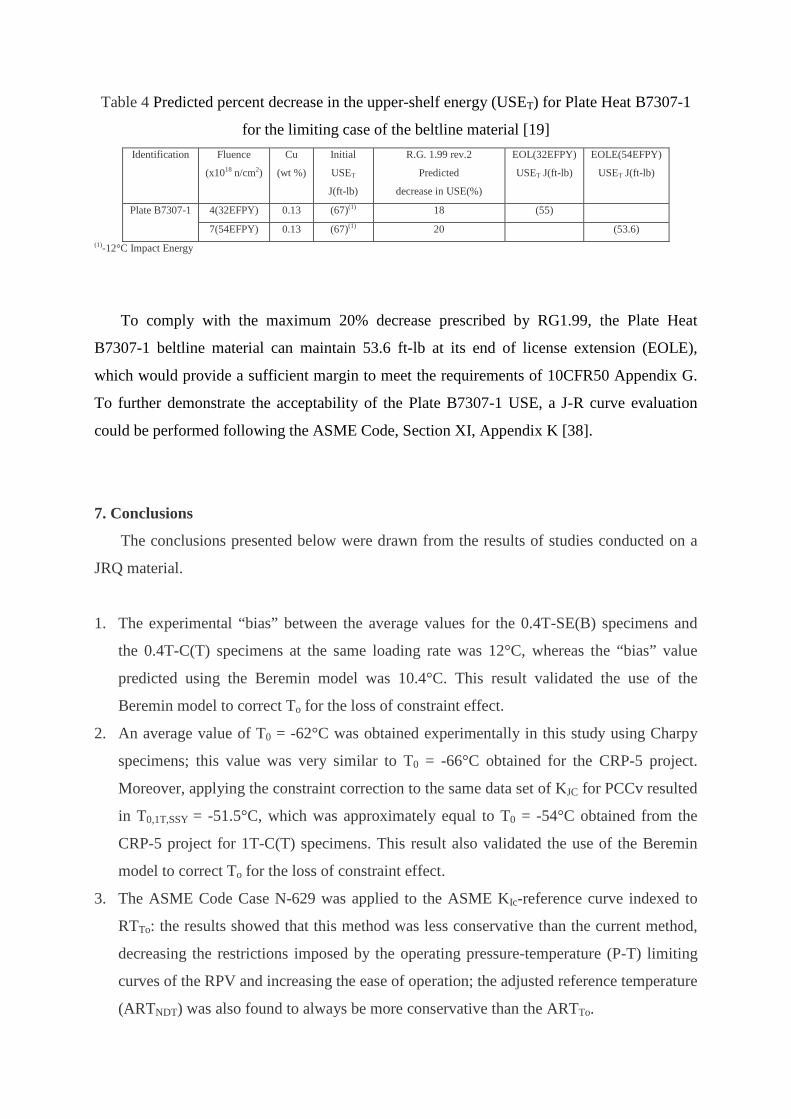
Table 4 Predicted percent decrease in the upper-shelf energy (USET) for Plate Heat B7307-1
for the limiting case of the beltline material [19] Identification Fluence
(x1018 n/cm2)
Cu
(wt %)
Initial
USET
J(ft-lb)
R.G. 1.99 rev.2
Predicted
decrease in USE(%)
EOL(32EFPY)
USET J(ft-lb)
EOLE(54EFPY)
USET J(ft-lb)
Plate B7307-1 4(32EFPY) 0.13 (67)(1) 18 (55)
7(54EFPY) 0.13 (67)(1) 20 (53.6) (1)-12°C Impact Energy
To comply with the maximum 20% decrease prescribed by RG1.99, the Plate Heat
B7307-1 beltline material can maintain 53.6 ft-lb at its end of license extension (EOLE),
which would provide a sufficient margin to meet the requirements of 10CFR50 Appendix G.
To further demonstrate the acceptability of the Plate B7307-1 USE, a J-R curve evaluation
could be performed following the ASME Code, Section XI, Appendix K [38].
7. Conclusions
The conclusions presented below were drawn from the results of studies conducted on a
JRQ material.
1. The experimental “bias” between the average values for the 0.4T-SE(B) specimens and
the 0.4T-C(T) specimens at the same loading rate was 12°C, whereas the “bias” value
predicted using the Beremin model was 10.4°C. This result validated the use of the
Beremin model to correct To for the loss of constraint effect.
2. An average value of T0 = -62°C was obtained experimentally in this study using Charpy
specimens; this value was very similar to T0 = -66°C obtained for the CRP-5 project.
Moreover, applying the constraint correction to the same data set of KJC for PCCv resulted
in T0,1T,SSY = -51.5°C, which was approximately equal to T0 = -54°C obtained from the
CRP-5 project for 1T-C(T) specimens. This result also validated the use of the Beremin
model to correct To for the loss of constraint effect.
3. The ASME Code Case N-629 was applied to the ASME KIc-reference curve indexed to
RTTo: the results showed that this method was less conservative than the current method,
decreasing the restrictions imposed by the operating pressure-temperature (P-T) limiting
curves of the RPV and increasing the ease of operation; the adjusted reference temperature
(ARTNDT) was also found to always be more conservative than the ARTTo.
Page 27
4. Conducting additional cleavage fracture toughness (KJC) tests using the MC methodology
is a viable option for NPPs that anticipate significant embrittlement at the end of their
license operation (32EFPY) or that require a license extension operation for RPVs (54
EFPY).
5. A welding system that allows the reconstitution of Charpy specimens halves by stud
welding without altering the mechanical properties of the material in a minimum volume
of one cm3 was developed.
6. The welding system, together with the procedures, specifications, and instructions,
ensures repeatability in the process.
Acknowledgments
This study was conducted under the auspices of a coordinated research project (CRP-8) on the
“Master Curve”, which was sponsored by the IAEA, CFE-CONACYT 48109 and ININ CA-
709. The authors wish to thank Ki-Sig Kang from IAEA in particular for his support and
active project coordination.
8. References
[1]. U.S. NRC 10 CFR 50 Appendix G; “Fracture Toughness Requirements”, January 2011.
[2]. U.S. NRC 10 CFR 50 Appendix H; “Reactor Vessel Material Surveillance Program
Requirements”.
[3]. ASME Code Section XI, App G, “Fracture Toughness Criteria for Protection Against
Failure”, Edition 2010.
[4]. U.S. NRC Regulatory Guide 1.99 Rev.2, “Radiation embrittlement of reactor vessel
materials”, May 1988.
[5]. Technical Basis for Revision of Regulatory Guide 1.99: “NRC Guidance on Methods to
Estimate the Effects of Radiation Embrittlement on the Charpy V-Notch Impact Toughness of
Reactor Vessel Materials”, October 1, 2007.
[6]. ASTM E900-02, Standard guide for “Predicting radiation-induced Transition
Temperature Shift in reactor vessel materials” Annual Book of ASTM Standards, Vol. 12.02,
ASTM International, West Conshohocken, PA. 2004.
[7]. Wallin K., “The Scatter in KIC Results”, Engineering Fracture Mechanics Vol. 19(6), pp.
1085-1093, (1984).
Page 28
[8]. Wallin K., “The Size Effect in KIC Results”, Engineering Fracture Mechanics Vol. 22(1),
pp. 149-163, (1985).
[9]. ASTM E1921-05, “Standard Test Method for Determination of Reference Temperature,
T0, for Ferritic Steels in the Transition Range,” Annual Book of ASTM Standards, Vol. 03.01,
ASTM International, West Conshohocken, PA. (2005).
[10]. Sokolov, M.A., and Nanstad, R.K., “Comparison of Irradiation Induced Shifts of KJC
and Charpy Impact Toughness for Reactor Pressure Vessel Steels,” ASTM STP-1325,
American Society of Testing and Materials, 1996.
[11]. IAEA TRS-429, Guidelines for Application of the Master Curve Approach to Reactor
Pressure Vessel Integrity in Nuclear Power Plants; March 2005.
[12]. Wallin, K., “Statistical Re-evaluation of the ASME KIC
and KIR
Fracture Toughness
Reference Curves”, Nuclear Eng. Design, Vol. 193(3), p. 317-326 (1999).
[13]. Code Case N-640, “Alternative Reference Fracture Toughness for Development of P-T
Limit Curves”, Section XI, ASME Code Section XI, Division 1, February 1999.
[14]. Code Case N-629, “Use of fracture toughness test data to establish reference temperature
for pressure retaining materials”, ASME Code Section XI, Division 1, May 1999.
[15]. Martha Serrano García, “Evaluación computacional del efecto de la pérdida de
constricción en la tenacidad de fractura de la vasija de reactores nucleares”, Tesis Doctoral,
Universidad Politécnica de Madrid, Escuela Técnica Superior de Ingenieros Industriales,
2007.
[16]. IAEA-TECDOC-1435, Application of surveillance programme results to reactor
pressure vessel integrity assessment; April 2005.
[17]. B.-S. Lee, J.-H. Honga, W.-J. Yangb, M.-Y. Huhb, S.-H. Chia, Master Curve
characterization of the fracture toughness in un-irradiated and irradiated RPV steels using
full- and 1/3-size pre-cracked Charpy specimens; International Journal of Pressure Vessels
and Piping, 77 (2000) pp:599–604.
[18]. M. Serrano, F.J. Perosanz, J. Lapeña, Determinación de la “master curve” de un acero de
vasija no-irradiado e irradiado mediante el ensayo de probetas pequeñas; anales de mecánica
de la fractura, Vol. 18, (2001).
[19]. Comisión Federal de Electricidad (CFE), 1979 (and amendments). Laguna Verde
Nuclear Power Station Units 1 & 2 Final Safety Analysis Report
[20].www.arcelormittalna.com/plateinformation/documents/en/Inlandflats/ProductBrochureA
RCELORMITTAL%20FINELINE.pdf. December 2010.
Page 29
[21]. ORNL-5238, “Assessment of materials technology for gasifier and reaction pressure
vessels and piping for second generation commercial coal conversion systems”, August 1978.
[22]. NUREG/CR-6551, “Improved embrittlement correlations for reactor pressure vessel
steels”, November 1998.
[23]. www.fpl.com/environment/nuclear/pdf/duanearnold.pdf. Duane Arnold NPP Licence
Renewal, September 2008.
[24]. Brumovsky, M., Davies, L. M., Kryukov, A., Lyssakov, V. N., and Nanstad, R. K.,
“Reference Manual on the IAEA JRQ Correlation Monitor Steel for Irradiation Damage
Studies,” Report No. IAEA-TECDOC-1230, International Atomic Energy Agency, Vienna,
Austria, July 2001.
[25]. Petti, J. P., and Dodds Jr., R. H., “Constraint comparisons for common fracture
specimens: C(T)s and SE(B)s”. Engineering Fracture Mechanics, Vol 71(18),pp. 2677-2683,
(2004).
[26]. Marc Scibetta, Eberhard Altstadt, Rogelio Hernández C., Bong-Sang Lee, Naoki Miura,
Kunio Onizawa, Elena Paffumi, Marta Serrano, Levente Tatar, Shengjun Yin. “Final Results
of an Analytical Round Robin Exercise to Support Constraint Effects”, ASME PVP Conf.
Proc./Year 2009/Volume 6: Materials and Fabrication, Parts A and B/Materials and
Fabrication/Mechanistic Modeling of Materials. July 26-30, 2009, Prague, Czech Republic.
[27]. Wallin, K., “Effect of Strain Rate on the Fracture Toughness Reference Temperature T0
for Ferritic Steels,” Recent Advances in Fracture, R. K. Mahidhara et al., Eds., The Minerals,
Metals and Materials Society, 1997, pp. 171–182.
[28]. Welding Research Council Bulletin 459, Fracture Toughness Master Curve
Development: Strategies for RPV Assessment, February 2001.
[29]. Beremin, F. M., "A Local Criterion for Cleavage Fracture of a Nuclear Pressure-Vessel
Steel", Metallurgical Transactions a- Physical Metallurgy and Materials Science, Vol.
14(11), pp. 2277-2287, (1983).
[30]. Gao, X., Ruggieri, C., and Dodds, R. H., "Calibration of Weibull stress parameters using
fracture toughness data", International Journal of Fracture, Vol. 92(2), pp. 175-200, (1998).
[31]. Gao, X., and Dodds, R. H., "Constraint effects on the ductile-to-brittle transition
temperature of ferritic steels: a Weibull stress model", International Journal of Fracture, Vol.
102(1), pp. 43-69, (2000).
[32]. Rogelio Hernández C.; Jesús Romero C.; Salvador Vázquez B.; Manuel Santillan V.;
and Marc Scibetta.; “Loading Rate Effect on the Master Curve Reference Temperature, T0,
Page 30
for the A533 B Material”, Journal of Testing and Evaluation, Vol. 38, No. 2, 2010, pp. 195-
202.
[33]. Jesús Romero, Rogelio Hernández, Filiberto Fernández, Fortino Mercado, Eric Van
Walle., Reconstitution process by stud welding for the surveillance program in México.,
Journal of Testing and Evaluation, Vol.35, No.5, 2007.
[34]. Marc Scibetta, Enrico Lucon and Eric Van Walle; Optimum use of broken specimens
from surveillance programs for the application of the master curve approach, International
Journal of Fracture 116: pp: 231-244, 2002.
[35]. U.S. NRC. Standard Review Plan. 5.3.2 Pressure-Temperature Limits. Branch Technical
Position MTEB 5-2 B 1.2 Fracture toughness Requirements. Pp: 5.3.2-14, Rev.1 July 1981.
NUREG-0800, July 1981.
[36]. Gary L. Stevens, Warren H. Bamford, Timothy J. Griesbach and Shah N. Malik;
Technical basis for revised P-T limit curve methodology, SIM-00-07, April 2000.
[37]. The Regulatory Guide 1.161 “Evaluation of reactor pressure vessels with Charpy Upper-
Shelf Energy (USE) less than 50 ft-lb”
[38]. ASME Code Section XI Appendix K, “Assessment of reactor vessels with low upper
shelf Charpy impact energy levels”, Edition 2010.