24
IBM Global Business Services Executive Report Operations and Supply Chain IBM Institute for Business Value Global Location Trends 2013 annual report
IBM Global Business ServicesExecutive Report
Operations and Supply Chain
IBM Institute for Business Value
Global Location Trends 2013 annual report
IBM Institute for Business Value IBM Global Business Services, through the IBM Institute for Business Value, develops fact-based strategic insights for senior executives around critical public and private sector issues. This executive report is based on an in-depth study by the Institute’s research team. It is part of an ongoing commitment by IBM Global Business Services to provide analysis and viewpoints that help companies realize business value. You may contact the authors or send an e-mail to [email protected] for more information. Additional studies from the IBM Institute for Business Value can be found at ibm.com/iibv
Introduction
By Jacob Dencik and Roel Spee
The global landscape for foreign direct investment is changing considerably, as companies are adapting their global footprints to rapidly changing operating conditions and new opportunities around the world. As a result, we are witnessing a marked reconfiguration of where foreign direct investment is going. While the United States is seeing greater near-shoring, China is experiencing a transformation of its role in the global economy, and other emerging economies are positioning themselves as new key investment destinations. In this context, companies need to embrace strategic footprint planning and structure their global operations into agile and integrated enterprises that are able to adapt to changing conditions and opportunities across the world.
In this report, we outline the key trends in corporate location selection and foreign investment. Using data from IBM’s Global Investment Locations Database (GILD), we demonstrate the latest changes in announced foreign investment decisions by companies and provide a unique insight into the internationalization of corporate activities around the world.
Companies continue their efforts to optimize footprints Companies are continuing to prepare for a more interdependent and complex world and are accelerating their adaptation to fundamental changes in operating conditions across regions and countries. Hence, emerging economies are rapidly altering the opportunities and risks offered to corporate investors, requiring companies to more carefully assess where to invest.
Meanwhile, Europe remains burdened by uncertainty over the sustainability of the public debt levels in individual countries, which in turn has led to questions being raised about the viability of the European area as a coherent economic region.
While such fears have subsided from their earlier peak, they maintained their grip on the minds of corporate executives throughout most of 2012, severely affecting their confidence in the continent as a region for investment.
In contrast, the United States has begun to show firmer signs of economic recovery, confirming many companies’ confidence in the country as a key market for doing business. This confidence was given a further boost by other improvements in operating conditions, not least the reduced costs and buoyancy associated with the first extractions of shale gas, potentially radically altering the country’s energy supply.
Shaped by these corporate considerations and global events, overall foreign direct investment volumes were fairly stable in 2012 compared to 2011, with a marginal decrease of 6 percent measured by number of new jobs created. Measured by number of projects, the investment levels fell by 10 percent.

2 Global Location Trends: 2013 annual report
Jobs 1,300,000
1,200,000
1,100,000
1,000,000
900,000
800,000
700,000
600,000
500,000
400,000
300,000
200,000
100,000
0 2003 2004 2005 2006 2007 2008 2009 2010 2011 2012
Source: Global Location Trends: 2013 annual report.
Projects 13,000
12,000
11,000
10,000
9,000
8,000
7,000
6,000
5,000
4,000
3,000
2,000
1,000
0
Figure 1: New foreign investment activity in 2003-2012, number of projects and job creation.
Global reconfiguration Europe saw its overall share of global foreign direct investment While overall levels of investment have remained stable, there (FDI) fall from 32 to 25 percent, while North America’s share have been dramatic changes in how investment is distributed grew from 10 to 13 percent and Asia increased its share from between regions and countries around the world, as companies 31 to 34 percent. Other regions’ shares remained fairly stable. seek to adapt their corporate footprints to new opportunities and operational risks emerging across the globe. In particular,
12012
12011
33 25 21 13 5 2
31 32 19 10 5 2
0% 20% 40% 60% 80% 100%
Asia Europe Latin America North America Africa Middle East Oceania & Caribbean
Source: Global Location Trends: 2013 annual report.
Figure 2: Regional distribution of estimated jobs created by foreign direct investment.

IBM Global Business Services 3
The United States is now the top destination country in the world, followed by India, China, Brazil and Mexico, with the gap between the four major emerging economies narrowing significantly. Thailand’s strong recovery from the fall in inward investment caused by the flooding in 2011 moved it up into sixth position, while the Philippines and Indonesia jumped to eighth and ninth respectively. The United Kingdom is the top European destination country and ranks seventh globally, while Russia experienced a significant drop in inward investment of 40 percent and ranks tenth.
When looking at jobs created from inward investment relative to population, Costa Rica is the top performing country and Ireland ranks second, highlighting the strong performance of
both these countries. Costa Rica has received considerably higher levels of foreign investment in business services and life sciences. Last year’s top location, Serbia, experienced a significant decline, but remains in the top three, indicating that the country is benefiting from a competitive offering in industrial sectors such as textiles, transport equipment and electrical equipment. Jamaica is fourth as a result of a large business process outsourcing (BPO) investment, while Singapore experienced a decline of more than 30 percent and is now sixth. The latter may well be an indication of a transformation taking place across the Asia-Pacific region, with companies widening their investment to a larger number of alternative investment destinations, resulting in Singapore experiencing decreases in several key segments such as financial services and electronics.
Rank 2012 (2011)
1 3) 2 (2) 3 (1) 4 (4) 5 (5) 6 (13) 7 (6) 8 (10) 9 (18) 10 (7) 11 (11) 12 (8) 13 (12) 14 (9) 15 (16) 16 (-) 17 (17) 18 (14) 19 (-) 20 (15)
United States India
China Brazil
Mexico Thailand
United Kingdom Philippines Indonesia
Russia France
Germany Spain
Romania Poland Turkey
Canada South Africa
Costa Rica Serbia
+31% +5%
-29% -3% +5%
+137% -8%
+54% +72% -40% -14% -34% -28% -42% -11% +21%
-5% -36% +28% -35%
0 20,000 40,000 60,000 80,000 100,000 120,000 140,000 2011 2012
Source: Global Location Trends: 2013 annual report.
Figure 3: Top ranking destination countries by estimated jobs - 2012 (11).

4 Global Location Trends: 2013 annual report
Rank 2012 (2011)
1 (2) 2 (4) 3 (1) 4 (10) 5 (8) 6 (3) 7 (5) 8 (13) 9 (18) 10 (-) 11 (6) 12 (-) 13 (7) 14 (9) 15 (17) 16 (19) 17 (-) 18 (-) 19 (-) 20 (15)
Costa Rica Ireland Serbia
Jamaica Slovakia
Singapore Estonia
United Arab Emirates Bulgaria Thailand Romania Uruguay Hungary
Czech Republic United Kingdom
Mexico Honduras
Portugal Bahrain
Nicaragua
0 500 1,000 1,500 2,000 2,500 3,000 2011 2012
Note: Countries with less than 1 million population were excluded from the analysis Source: Global Location Trends: 2013 annual report.
Figure 4: Top ranking destination countries by estimated jobs - per million inhabitants – 2012 (11).
Figure 4 provides the global overview of country performance in FDI job creation per capita, while regional rankings are included in the Annex.
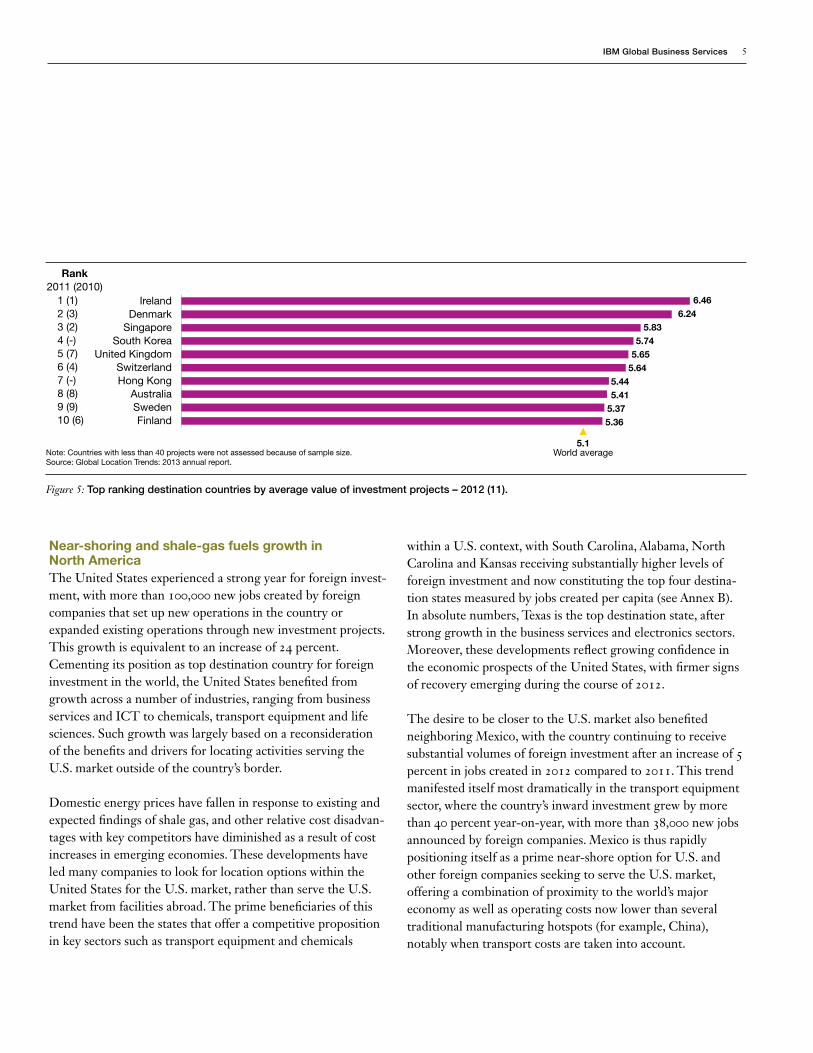
However, for most countries it is not just the number of jobs created that are of interest, but also the type of investment projects and their value to the economy. Comparing countries on what projects are attracted, and not just the number of jobs, is therefore an increasingly important metric for gauging inward investment performance. To this end, IBM-Plant Location International has developed an FDI value indicator that assigns a value to each investment project, depending on sector and type of business activity. This value indicator assesses the added value and knowledge intensity of the jobs created by the investment project.
On this measure, Ireland continues to be the top performer in the world, resulting from the country’s success in attracting research and development (R&D) activities in life sciences and information communication technology (ICT) coupled with high value investment in financial services. Denmark is second, as a result of investment concentrated in the life sciences and ICT sectors, while Singapore is third with a large proportion of R&D investment projects. South Korea returns to the top ten in fourth position. As in previous years, the top ten ranking is entirely made up of mature economies, highlighting that while emerging economies may attract investments that create many jobs, the mature economies continue to attract high value jobs. Hence, as locations mature, the overall volume of inward investment may start to decrease but is concentrated in higher value segments.
IBM Global Business Services 5
Rank 2011 (2010)
1 (1) Ireland 2 (3) Denmark 3 (2) Singapore 4 (-) South Korea 5 (7) United Kingdom 6 (4) Switzerland 7 (-) Hong Kong 8 (8) Australia 9 (9) Sweden 10 (6) Finland
6.46 6.24
5.83 5.74
5.65 5.64
5.44 5.41
5.37 5.36
5.1 Note: Countries with less than 40 projects were not assessed because of sample size. World average Source: Global Location Trends: 2013 annual report.
Figure 5: Top ranking destination countries by average value of investment projects – 2012 (11).
Near-shoring and shale-gas fuels growth in North America The United States experienced a strong year for foreign investment, with more than 100,000 new jobs created by foreign companies that set up new operations in the country or expanded existing operations through new investment projects. This growth is equivalent to an increase of 24 percent. Cementing its position as top destination country for foreign investment in the world, the United States benefited from growth across a number of industries, ranging from business services and ICT to chemicals, transport equipment and life sciences. Such growth was largely based on a reconsideration of the benefits and drivers for locating activities serving the U.S. market outside of the country’s border.
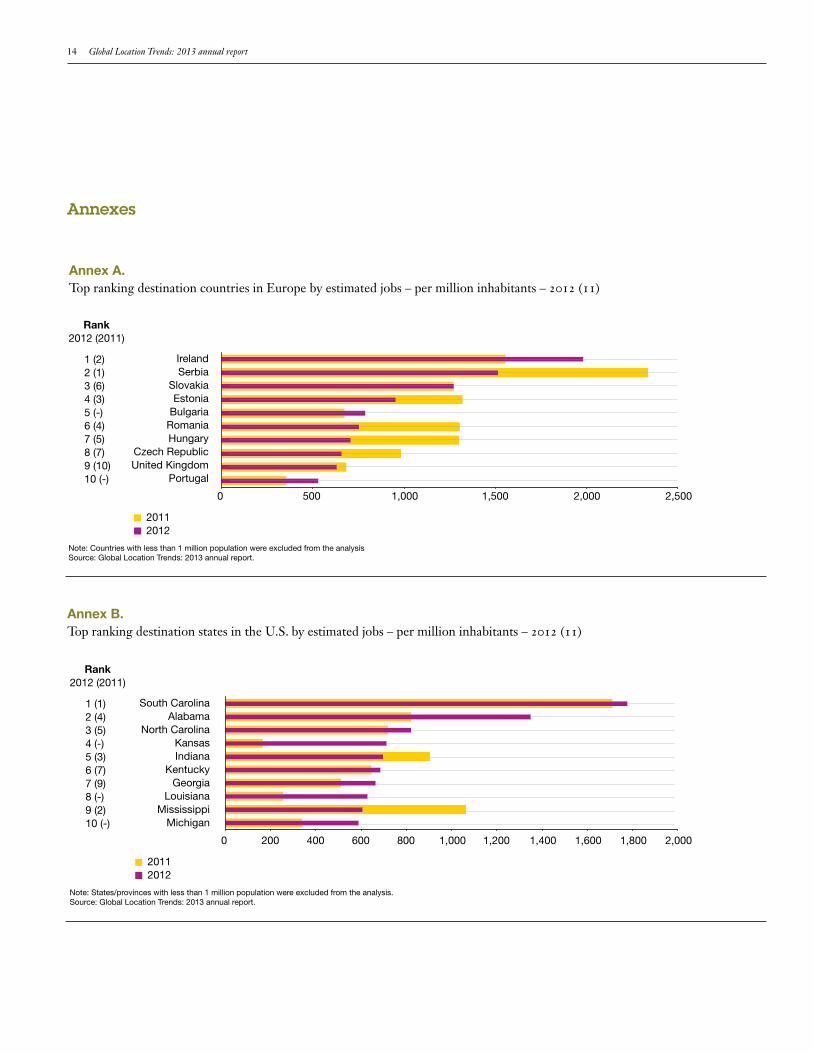
Domestic energy prices have fallen in response to existing and expected findings of shale gas, and other relative cost disadvantages with key competitors have diminished as a result of cost increases in emerging economies. These developments have led many companies to look for location options within the United States for the U.S. market, rather than serve the U.S. market from facilities abroad. The prime beneficiaries of this trend have been the states that offer a competitive proposition in key sectors such as transport equipment and chemicals
within a U.S. context, with South Carolina, Alabama, North Carolina and Kansas receiving substantially higher levels of foreign investment and now constituting the top four destination states measured by jobs created per capita (see Annex B). In absolute numbers, Texas is the top destination state, after strong growth in the business services and electronics sectors. Moreover, these developments reflect growing confidence in the economic prospects of the United States, with firmer signs of recovery emerging during the course of 2012.
The desire to be closer to the U.S. market also benefited neighboring Mexico, with the country continuing to receive substantial volumes of foreign investment after an increase of 5 percent in jobs created in 2012 compared to 2011. This trend manifested itself most dramatically in the transport equipment sector, where the country’s inward investment grew by more than 40 percent year-on-year, with more than 38,000 new jobs announced by foreign companies. Mexico is thus rapidly positioning itself as a prime near-shore option for U.S. and other foreign companies seeking to serve the U.S. market, offering a combination of proximity to the world’s major economy as well as operating costs now lower than several traditional manufacturing hotspots (for example, China), notably when transport costs are taken into account.
6 Global Location Trends: 2013 annual report
Reconfiguring corporate footprints in Asia-Pacific As a consequence of these developments and further concerns about changing operating conditions in several emerging economies, many of the traditional strong performers in the Asia-Pacific region saw considerable declines in inward investment levels. The number of new jobs created through foreign investment into China fell by almost 30 percent year-on-year, resulting in the country dropping in the global rankings from first to third position. Key sectors, such as electronics and ICT, saw declines of more than 75 percent in foreign investment, while transport equipment, industrial machinery and equipment and chemicals all fell by more than 30 percent. In contrast, investment in some of the more market driven sectors grew rapidly, with the logistics sector growing by more than 100 percent, financial services by more than 65 percent and food production by more than 35 percent. These findings are indicative of a dramatic transformation of China’s role in the global economy, with the country moving away from its primary role as a global export platform, with increasing labor, energy and transport costs making it less attractive as a location for production for international markets. Rather, China is now viewed as a prime market in its own right, with companies increasingly investing in China to take advantage of growing local market opportunities. However, with this change, overall levels of foreign investment are declining, reflecting a transition towards a status as a more mature FDI location.
In India, the picture is somewhat different, reflecting a different pace and nature of transition towards maturity. Accordingly, India experienced an overall increase in foreign investment of approximately 5 percent, notwithstanding the dominant ICT sector seeing foreign investment levels fall by 20 percent and foreign investment in business services seeing a dramatic decline of 75 percent measured by the number of jobs created. In contrast, foreign investment in the life sciences
sector grew by more than 300 percent and in the transport equipment sector by almost 35 percent. These trends are also indicative of a changing role for India in the global economy, moving away from its focus on ICT and business services and diversifying into other manufacturing based sectors with, for example, foreign investment in production activities growing by 30 percent in 2012 compared to the previous year.
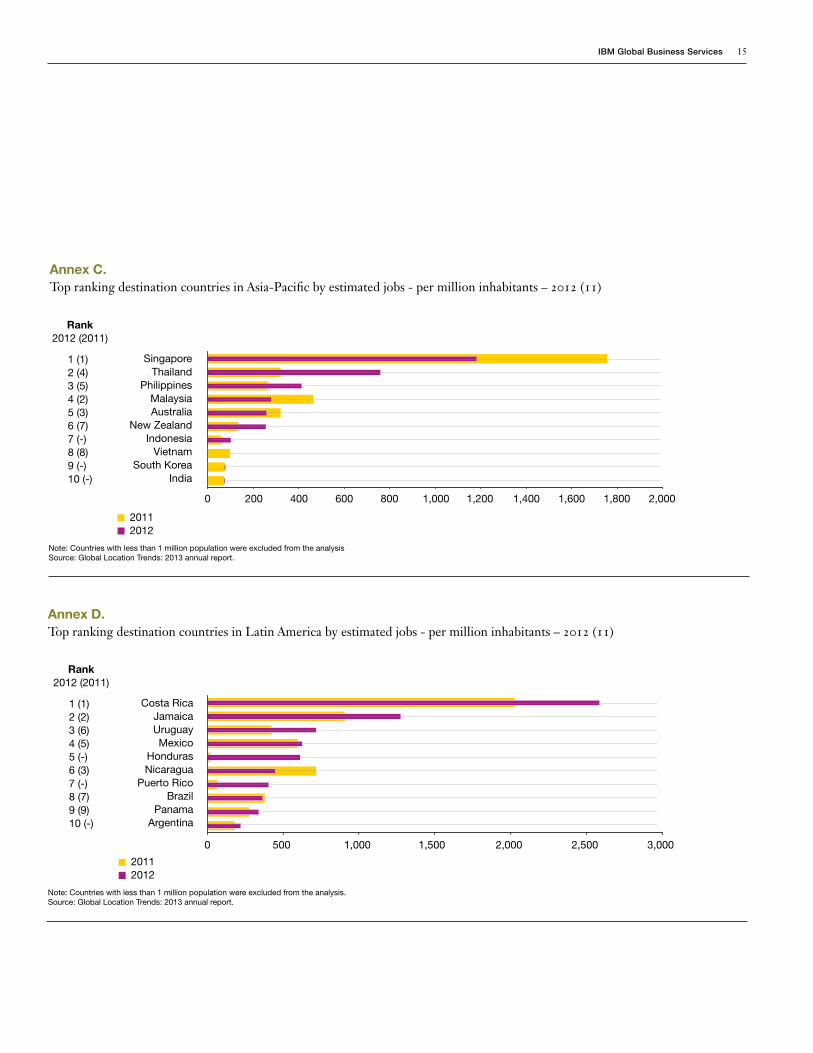
With a changing dynamic in the region’s two largest countries, other countries in Asia-Pacific are seeing considerable increases in investment, with Thailand, the Philippines and Indonesia registering growth of 137 percent, 80 percent and 37 percent respectively. While the large increase in Thailand partly reflects the low investment in 2011 when the country was hit by flooding,1 the results are also indicative of the fact that these countries are increasingly seen as attractive alternatives to the traditional hot-spots in China and India, offering improving business environments, lower operating costs and less competition for talent. This is perhaps particularly evident for investment in individual business functions rather than particular sectors. For example, in business support services (shared service centers and business process outsourcing centers), India saw its inward investment more than halve to less than 7,000 jobs while the Philippines saw inward investment in these activities more than double to almost 25,000 jobs.2 Similarly, in production facilities, China saw foreign investment reduced by more than 35 percent, while Thailand’s inward investment more than doubled and Indonesia saw growth of more than 30 percent. These developments reinforce some of the trends identified in last year’s report, with investors taking a much more critical and discerning view of the opportunities offered by different emerging economies, and adapting their global operations to new opportunities as well as operational risks.

IBM Global Business Services 7
Europe remains in the grip of fiscal malaise In Europe, the overall trend has been downward, with the continent’s overall foreign investment falling by approximately 25 percent from 2011 to 2012. Not only did most Western European countries, including major markets such as Germany, the United Kingdom and France, see declines, but many of the traditional hotspots for investment in Eastern Europe experienced dramatic drops in inward investment. For example, the Czech Republic and Hungary saw foreign investment levels fall by more than 30 percent and 45 percent respectively, compared to 2011. Similarly, the number of new jobs created from foreign investment in Romania, Lithuania and Latvia declined by more than 40 percent from 2011 to 2012, while foreign investment in Poland fell by 10 percent. These developments reflect greater uncertainty among corporate decision makers about the future prospects for the continent, with 2012 still being marred by concerns over unsustainable government debt levels and limited signs of economic recovery.
However, notwithstanding the overall downward trend for the continent as a whole, some individual countries managed to achieve substantial growth in inward investment. For example, Ireland continued its strong performance and experienced yet another high-level of foreign investment, with more than 9,000 jobs created in 2012 compared to just over 7,000 jobs in 2011. This was primarily the result of strong growth across three of its key sectors—ICT, life sciences and financial services—with the ICT sector growing jobs from inward investment in 2012 by 50 percent compared to the year earlier and foreign investment in financial services increasing by more than 80 percent. As such, the country continues to benefit from its highly competitive business environment and cluster strengths. As noted in previous years’ reports, Ireland’s strong FDI performance in the past few years is also evidence of the fact that domestic economic problems do not necessarily have a direct impact on the structural strengths of the local business environment underpinning the competitiveness for inward investment.
Furthermore, Portugal saw growth of more than 45 percent in inward investment levels in 2012, primarily as a result of large growth in the business services and ICT sectors. Meanwhile, Bulgaria and Turkey stood out among countries in Eastern Europe with growth of more than 15 percent and 20 percent in inward investment respectively, with both countries experiencing marked increases in the transport equipment sector. Bulgaria also saw growth in business services, while Turkey received substantially more investment in the chemicals sector.
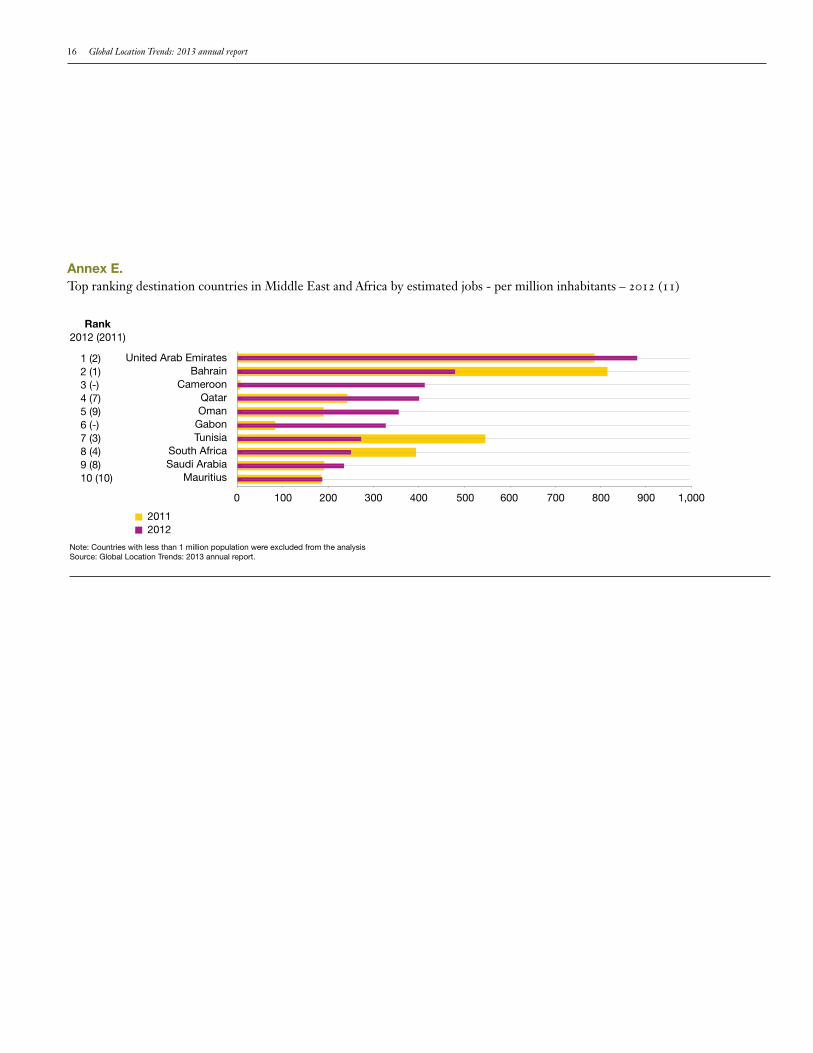
Africa full of growth opportunities, but also volatility In the Middle East and Africa, there was a mixed performance across countries. South Africa continues to be the top destination country measured by absolute number of jobs created, despite a considerable fall of more than 35 percent. The United Arab Emirates remains the region’s top performer when looking at jobs created relative to population, followed by Bahrain and Cameroon. The latter’s growth is mainly the result of one large project by Chinese investor Beigi Foton Motors building a new plant to produce trucks. Many countries in North Africa continue to see falling foreign investment levels, as the uncertainty over the future prospects following the Arab Spring remains. Consequently, countries that prior to the Arab Spring had experienced significant growth in foreign investment, notably Tunisia, Morocco and Egypt, experienced further declines of approximately 50 percent, 37 percent and 3 percent respectively. Looking at North Africa as a whole (Algeria, Egypt, Libya, Morocco and Tunisia) foreign investment is now a third of the levels reached at its peak in 2009. Companies may be awaiting clearer signs of progress and stability in the region before making decisions to invest there.
In sub-Saharan Africa foreign investment continues to be erratic and volatile, and remains at fairly low levels. While Nigeria and Ghana both experienced a doubling of foreign investment, Ethiopia, Kenya Tanzania and Angola all saw declines of more than 60 percent compared to 2011 levels. As a whole, foreign investment to the African continent declined by

8 Global Location Trends: 2013 annual report
approximately 10 percent, leaving it with a share of 5 percent of the global market for foreign investment (down from a peak of 7.5 percent in 2009).
Modest growth in Latin America and the Caribbean Latin America as a whole experienced marginal growth in foreign investment levels of 2 percent in 2012 compared to 2011 measured by the number of jobs created. The region’s largest economy, Brazil, saw a modest decline of 3 percent in inward investment compared to the year earlier. Dividing by sector, the country experienced growth in electronics, chemicals and food processing, while industrial machinery and equipment, metals, transport equipment, ICT and business services fell.
As already noted, Mexico saw modest growth, notably in the transport equipment, industrial machinery and equipment and energy, utilities and waste sectors. This was largely driven by growth in investment by Japanese and German companies looking to serve the North American market out of Mexico. In the wider Latin American and Caribbean region, Costa Rica, Argentina, Uruguay and Honduras all experienced substantial growth in inward investment, which may indicate that investors are taking a more nuanced view of opportunities in the region and looking beyond the major economies of Brazil and Mexico.
Transport equipment continues to be the top sector for foreign investment The global decrease was evident across most sectors, with a few exceptions. The transport equipment sector remains the most important sector for foreign investment globally and saw moderate growth of 3 percent. Tourism was another sector that showed strong
Rank 2012 (2011)
growth, driven by an increase in investment plans for large entertainment parks and the growth opportunities that many companies in the hotel industry see in emerging markets. The chemicals sector and business services remained fairly stable, whereas electronics, ICT and the industrial equipment industry experienced declines of around 20 percent.
1 (1) Transport equipment +3% 2 (5) Tourism +15% 3 (2) Chemicals -6% 4 (4) Business services +1% 5 (3) Electronics -22% -
6 (6) ICT -18% -
7 (7) Industrial machinery and equipment -18% -
8 (9) Food, Beverages and tobacco -4% 9 (8) Metal -18% -
10 (-) Pharma, medical and healthcare -12% -
0 40,000 80,000 120,000 160,000 200,000
2011 2012
Source: Global Location Trends: 2013 annual report.
Figure 6: Top ranking sectors by estimated jobs – 2012 (11).

IBM Global Business Services 9
Sources of investment Japanese companies increase their internationalization efforts While overall levels of foreign direct investment declined marginally, Japanese companies increased their overseas investment significantly by more than 20 percent. This resurgence of Japanese outward investment is in part explained by companies re-initiating projects that were put on hold as a result of natural disasters in the previous years, particularly in the Asia-Pacific region. However, the United States remains by far the most important source of foreign investment globally, with over 25 percent of new FDI jobs around the world created by U.S. companies. It is interesting to note that the outward investment activity of Chinese companies declined by 15 percent after several years of growth, primarily as a result of significant declines by companies in the natural resource driven sectors such as mining, minerals and metals. Chinese
companies in the industrial machinery and equipment and electronics sectors also reduced foreign investment. In contrast, Chinese outward investment in the transport equipment sector increased by more than 25 percent. These developments have particularly affected Chinese investment in emerging economies, which fell significantly, while the more market driven investment to more mature economies has remained stable.
Indian outward investment fell by more than 30 percent, with dramatic declines in the key sector of ICT, but also in transport equipment, chemicals and industrial machinery and equipment sectors. This particularly affected the traditional top destinations for Indian foreign investment, China and the United Kingdom, with Indian companies taking a more somber view of the Chinese and European market opportunities as a result of more uncertain economic outlooks.
Rank 2012 (2011)
1 (1) 2 (2) 3 (3) 4 (4) 5 (6) 6 (5) 7 (12) 8 (7) 9 (13) 10 (10) 11 (11) 12 (8) 13 (-) 14 (9) 15 (15) 16 (-) 17 (19) 18 (20) 19 (-) 20 (-)
United States Japan
Germany France
United Kingdom China
Switzerland Canada
Netherlands South Korea
Italy India
Taiwan Spain
Sweden Denmark
Ireland Hong Kong
Australia United Arab Emirates
+1% +22%
-7% -5%
-13% -15% +10% -23% -14% -24% -17% -34% -2%
-48% -8%
+54% -4% +5% +4%
+177%
0 50,000 100,000 150,000 200,000 250,000 300,000
2011 2012
Source: Global Location Trends: 2013 annual report.
Figure 7: Top ranking origin countries by estimated jobs – 2012 (11).
10 Global Location Trends: 2013 annual report
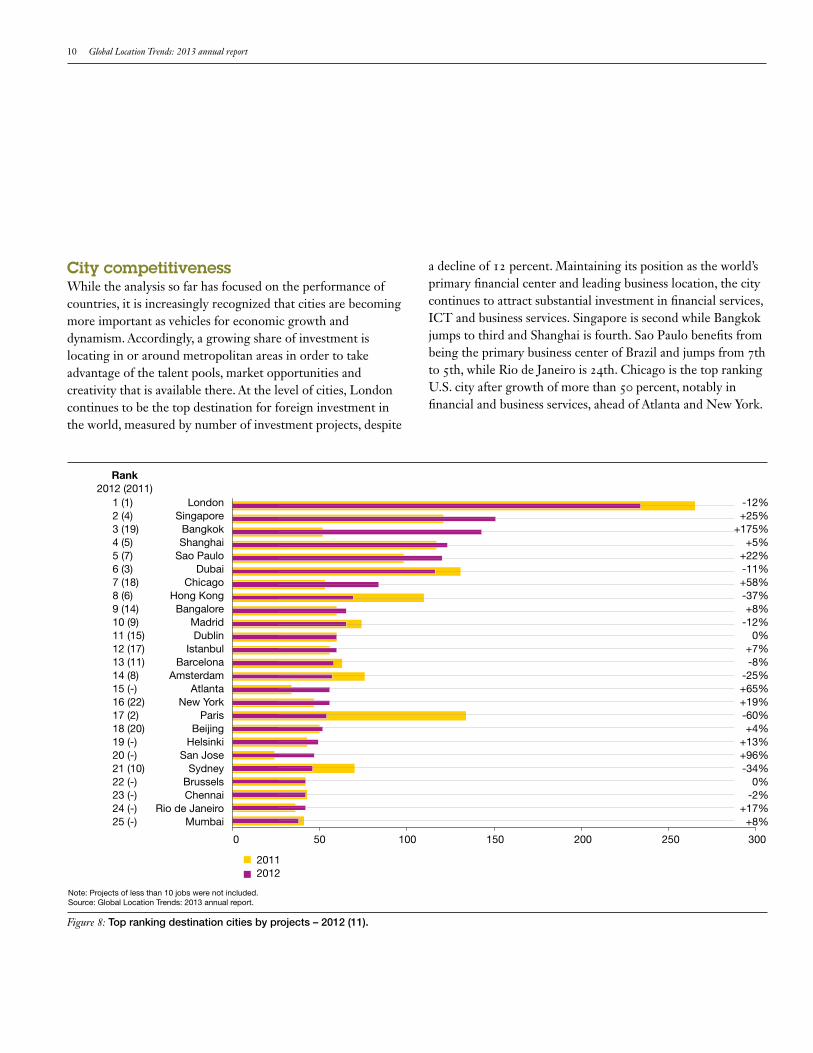
City competitiveness While the analysis so far has focused on the performance of countries, it is increasingly recognized that cities are becoming more important as vehicles for economic growth and dynamism. Accordingly, a growing share of investment is locating in or around metropolitan areas in order to take advantage of the talent pools, market opportunities and creativity that is available there. At the level of cities, London continues to be the top destination for foreign investment in the world, measured by number of investment projects, despite
a decline of 12 percent. Maintaining its position as the world’s primary financial center and leading business location, the city continues to attract substantial investment in financial services, ICT and business services. Singapore is second while Bangkok jumps to third and Shanghai is fourth. Sao Paulo benefits from being the primary business center of Brazil and jumps from 7th to 5th, while Rio de Janeiro is 24th. Chicago is the top ranking U.S. city after growth of more than 50 percent, notably in financial and business services, ahead of Atlanta and New York.
Rank 2012 (2011)
1 (1) 2 (4) 3 (19) 4 (5) 5 (7) 6 (3) 7 (18) 8 (6) 9 (14) 10 (9) 11 (15) 12 (17) 13 (11) 14 (8) 15 (-) 16 (22) 17 (2) 18 (20) 19 (-) 20 (-) 21 (10) 22 (-) 23 (-) 24 (-) 25 (-)
London Singapore
Bangkok Shanghai
Sao Paulo Dubai
Chicago Hong Kong Bangalore
Madrid Dublin
Istanbul Barcelona
Amsterdam Atlanta
New York Paris
Beijing Helsinki
San Jose Sydney
Brussels Chennai
Rio de Janeiro Mumbai
-12% +25%
+175% +5%
+22% -11% +58% -37% +8%
-12% 0%
+7% -8%
-25% +65% +19% -60% +4%
+13% +96% -34%
0% -2%
+17% +8%
0 50 100 150 200 250
2011 2012
Note: Projects of less than 10 jobs were not included. Source: Global Location Trends: 2013 annual report.
Figure 8: Top ranking destination cities by projects – 2012 (11).
300
IBM Global Business Services 11
Moving forward Understand your location’s value proposition from an investor’s point of view In a global environment shaped by rapidly changing business dynamics and greater complexity, policy makers seeking to ensure further investment and job creation for their constituencies are faced with considerable challenges. It is therefore becoming more important than ever for locations to understand and continually improve their value proposition to investors. In other words, the location must understand its competitive position from an investor’s point of view. This process begins by a location asking itself, “What is our “product” and who is this product compelling to?”
Accordingly, locations cannot assume that they will be competitive for everything, but must recognize that their location’s competitive position will vary by sector and activity. As highlighted in our recent publication “The World’s Most Competitive Cities,”3 cities like New York and London offer a compelling value proposition for companies in the financial services sector, while Dublin and Singapore are attractive locations for companies in the pharmaceuticals sector. Furthermore, the Asian cities of Kuala Lumpur and Manila offer competitive value propositions for shared service centers.
These different value propositions for particular sectors are shaped by how the locations compare along two principal dimensions: the quality of the operating environment (skills, infrastructure, regulatory environment and so on) and the financial attractiveness. Often, there is a clear trade-off between these two dimensions with less financially attractive locations (higher costs) offering higher quality operating
environments, while more financially attractive locations have weaker operating environments (see the following example). A location’s trade-off in terms of financial attractiveness and quality determines what type of location solution (or “product”) it has in the eyes of potential investors. The strategic objectives of a company determine what type of trade-off between quality and financial attractiveness, and thus location solution, they are seeking, so understanding the trade-off is critical for understanding the location’s competitive position for foreign direct investment.
A snapshot of how a location is positioned compared with key competitor cities can be seen in a combined cost and quality assessment—an analytical method developed by IBM-PLI— that provides a tailored assessment of the relative attractiveness of locations for particular business activities with respect to the quality of the business environment and cost attractiveness. A location’s position in this “cost-quality map” indicates the cost-quality trade-off available to the investor for their particular project. In the following illustrative example, it is evident that investors have very distinct location solutions available to them, with most locations situated along a wide diagonal line in the map. Some locations offer higher quality but at higher cost, while others offer lower cost (greater financial attractiveness) but with greater operational risks and difficulties in terms of the quality of the business environment.
While many companies use this approach to identify the type of “location solutions” that best meet their strategic needs, cities should adopt this corporate site selection thinking to identify the different value propositions that they may have for different types of companies.

12 Global Location Trends: 2013 annual report
Center of Excellence options
Urgent need for strategic review
Cost index
Qua
lity
ind
ex
Best value proposition
Cost indexExisting locations
New greenfield locations
Optimized operations in line with strategy
Cost optimization solutions
Figure 9: Illustrative example of a cost-quality map.
Align talent and business for growth In a world that is becoming increasingly knowledge driven, a location’s value proposition is often tied to the availability of talent and competencies. To improve competitiveness, it is critical that locations align their inward investment strategies closely with efforts to develop talent through education and training as well as make concerted efforts for the attraction and retention of talented people. Successful locations will be those that manage to combine creation, attraction and retention of both businesses and talent. Enabling these actors to create value and leverage technology as an accelerator for growth, is key to a location’s economic development efforts.
Many countries, regions and cities are thus developing new ways in which to achieve a better match between the skill supply and the needs of companies. In Germany, a system of dual education which combines internships and formal education is an increasingly adopted way to align graduate skills with labor market needs. For example, the Berufsakademie Dresden combines university-level formal education with a range of practical and professional experiences. Within this system, regional industry associations play a key role in improving curricula and in providing learning opportunities for students. Accordingly, this dual educational model, combined with the industry involvement, leads to an overall improved skill alignment between supply and demand.
IBM Global Business Services 13
Adopt a smarter approach to economic development Governments are faced with new opportunities for improvement enabled by technology in ways that constitute a paradigmatic shift in economic development. From how we manage infrastructure and utilities, to how education, health and social services are delivered to better meet the needs of citizens and business, we are witnessing a dramatic shift in how economic development can be achieved. Ushered in by a convergence of technologies that leverage the power of data, we are now able to improve our communities, cities, regions and countries in a smarter way.
This new approach is underpinned by a growing digital infrastructure that connects people, organizations and objects in a web of information flows that was previously impossible. The ability to capture, connect and leverage data and information through a web of people, organizations and an “Internet of Things” is leading to completely new business models and approaches to service delivery and government, focused on partnerships, citizen engagement, new revenue streams and funding models. Supported by technology that provides actors with new improved insight and analytics for effective collaboration and action, government can empower citizens, communities and businesses to play an active role in shaping and improving service delivery rather than treating them as passive recipients. By placing the end-users (citizens, businesses and other stakeholders) at the center of how cities, regions and countries are shaped, smart solutions radically alter the ability of governments to realize their economic, social and environmental objectives.
Implement strategic footprint planning As corporate executives are aiming to navigate a more complex world economy, they need to think and plan strategically about how they structure and adapt their international operations. More specifically, many larger companies will find themselves continuously confronted with the need to reassess their global footprint and make location decisions, whether it will be resulting from expansions, consolidations, mergers or acquisitions. As they do so, they need to think carefully about what type of location solution is required for different types of activities, and what location options are most suitable given their particular requirements.
Given the rapidly changing dynamics and operating conditions in different locations, companies must regularly monitor both existing locations as well as alternative locations that may offer a better location solution for them, in order to identify potential emerging risks or opportunities. This strategic footprint planning also allows companies to accelerate site selection decisions once there is a specific need for expansion or consolidation, since the process provides a continuous understanding of most suitable location options for specific components of the enterprise.
In support of this strategic footprint planning effort, companies now have at their disposal access to unprecedented levels of data and information giving better insight into operational strengths, weaknesses, risks and opportunities. Leveraging this vast and continuously growing resource—data—and turning it into insight for action will be a key element of managing and integrating global enterprises in the future. Successful companies will increasingly be those that are able to mine and leverage this data, analytics and insight for competitive advantage. Within IBM we have captured these opportunities in the concept of the Smarter Enterprise, which encapsulates a paradigmatic shift in how companies optimize their global operations and supply chains, enter and compete in markets, approach and deal with customers and manage talent. Build around the opportunities offered by big data, Smarter Enterprises harness data (on supply chain, talent, markets, customers) and apply analytics to help them assess risks and make decisions that are based on insight.
14 Global Location Trends: 2013 annual report
Annexes
Annex A. Top ranking destination countries in Europe by estimated jobs – per million inhabitants – 2012 (11)
Rank 2012 (2011)
1 (2) 2 (1) 3 (6) 4 (3) 5 (-) 6 (4) 7 (5) 8 (7) 9 (10) 10 (-)
Ireland Serbia
Slovakia Estonia
Bulgaria Romania Hungary
Czech Republic United Kingdom
Portugal
0 500 1,000 1,500 2,000 2,500
2011 2012
Note: Countries with less than 1 million population were excluded from the analysis Source: Global Location Trends: 2013 annual report.
Annex B. Top ranking destination states in the U.S. by estimated jobs – per million inhabitants – 2012 (11)
Rank 2012 (2011)
1 (1) 2 (4) 3 (5) 4 (-) 5 (3) 6 (7) 7 (9) 8 (-) 9 (2) 10 (-)
South Carolina Alabama
North Carolina Kansas Indiana
Kentucky Georgia
Louisiana Mississippi
Michigan
0 200 400 600 800 1,000 1,200 1,400 1,600 1,800 2,000
2011 2012
Note: States/provinces with less than 1 million population were excluded from the analysis. Source: Global Location Trends: 2013 annual report.
IBM Global Business Services 15
Annex C. Top ranking destination countries in Asia-Pacific by estimated jobs - per million inhabitants – 2012 (11)
Rank 2012 (2011)
1 (1) 2 (4) 3 (5) 4 (2) 5 (3) 6 (7) 7 (-) 8 (8) 9 (-) 10 (-)
Singapore Thailand
Philippines Malaysia Australia
New Zealand Indonesia
Vietnam South Korea
India
0 200 400 600 800 1,000 1,200 1,400 1,600 1,800 2,000
2011 2012
Note: Countries with less than 1 million population were excluded from the analysis Source: Global Location Trends: 2013 annual report.
Annex D. Top ranking destination countries in Latin America by estimated jobs - per million inhabitants – 2012 (11)
Rank 2012 (2011)
1 (1) Costa Rica 2 (2) Jamaica 3 (6) Uruguay 4 (5) Mexico 5 (-) Honduras 6 (3) Nicaragua 7 (-) Puerto Rico 8 (7) Brazil 9 (9) Panama 10 (-) Argentina
0 500 1,000 1,500 2,000 2,500 3,000
2011 2012
Note: Countries with less than 1 million population were excluded from the analysis. Source: Global Location Trends: 2013 annual report.
16 Global Location Trends: 2013 annual report
Annex E. Top ranking destination countries in Middle East and Africa by estimated jobs - per million inhabitants – 2012 (11)
Rank 2012 (2011)
1 (2) United Arab Emirates 2 (1) Bahrain 3 (-) Cameroon 4 (7) Qatar 5 (9) Oman 6 (-) Gabon 7 (3) Tunisia 8 (4) South Africa 9 (8) Saudi Arabia 10 (10) Mauritius
0 100 200 300 400 500 600 700 800 900 1,000
2011 2012
Note: Countries with less than 1 million population were excluded from the analysis Source: Global Location Trends: 2013 annual report.
IBM Global Business Services 17
About the authors Jacob Dencik is a Senior Managing Consultant with IBM-Plant Location International, with extensive experience advising companies around the world on their global operations and location strategies. He has also advised many regional, national and international government organizations as an expert and economist on competitiveness, foreign direct investment, sector/cluster analysis and innovation. Jacob is a co-author and contributing author of two recent books about innovation. He can be reached at [email protected].
Roel Spee is the Global Leader of IBM-Plant Location International (IBM-PLI), the IBM Global Business Services global center of excellence for corporate location strategies and economic development services. He has 27 years of experience as a location strategy and economic development consultant and has advised international companies on location choices for a broad range of industries and investment projects. He has assisted corporate executives from international companies around the world with strategic location choices for over 300 projects, including manufacturing plants, distribution centers, headquarters, R&D operations, shared services centers and data centers across a variety of industries. Roel can be reached at [email protected].
Contributors David Zaharchuk, Research Lead, IBM Institute for Business Value, [email protected].
Patsy Van Hove, Senior Managing Consultant – IBM-Plant Location International, IBM Global Business Services, patsy. [email protected].
Koen Gijpers, Managing Consultant – IBM-Plant Location International, IBM Global Business Services, koen.gijpers@be. ibm.com.
Additional support for the 2013 Global Location Trends report was provided by Katrien Castelain (Coordinator Global Investment Locations Database), Peter Chovanec, Agung Darmawan, Axel Debry, Ulfat Hajiyev, Lorena Estevez, Meiyu Helene Jiang, Patrick Serge Jiogo, Fabio Maffioli, Paolo Sandri, Natalia Sosnovska, Thomas Strybol, and Alessandro Zauli.
About IBM Global Business Services With business experts in more than 160 countries, IBM Global Business Services provides clients with deep business process and industry expertise across 17 industries, using innovation to identify, create and deliver value faster. We draw on the full breadth of IBM capabilities, standing behind our advice to help clients implement solutions designed to deliver business outcomes with far-reaching impact and sustainable results. IBM Global Business Services offers one of the largest strategy and transformation practices in the world. Strategy and transformation fuses business strategy with technology insight to help organizations develop and align their business vision across four strategic dimensions—business strategy, operations strategy, organization change strategy and technology strategy—to drive innovation and growth.
About IBM-Plant Location International IBM-Plant Location International (IBM-PLI) is a global service of IBM Global Business Services Strategy & Transformation practice, specialized in corporate location and economic development strategies. Operating as a fully globally integrated service with a global center of excellence in Brussels, Belgium, supported by industry and functional subject matter experts in key markets around the world, IBM-PLI provides expert services to corporate clients for analyzing international business locations for expanding or consolidating companies to select the optimal location (country/city). IBM-PLI also advises economic development organizations on improving their areas’ competitiveness, strategic marketing, developing value propositions, and marketing tools.

18 Global Location Trends: 2013 annual report
IBM’s GILD database monitors global location trends through new foreign investment For many years, the only available data for analyzing foreign investment trends around the world were the capital investment data as published by the United Nations. These data measure the capital flows through various forms of FDI, including mergers and acquisitions (M&A). Often these FDI flows are used to measure the success of geographical entities (countries, states and even cities) in attracting foreign investment. However, this can lead to misleading conclusions on the capacity of the locations to attract foreign companies. M&As are driven mostly by an interest from the investor in a target company with the objective to gain market share, acquire technology, and so on. The business location of the target company is typically not the main driver for the investment and a location decision is rarely part of M&A investment decisions.
A better approach to measure the success of individual countries in attracting foreign investment is, therefore, to focus on those investment projects for which a clear decision on the investment location has been made. This is the case for vast majority of so-called “greenfield” investment projects as well as
for new expansions of existing operations owned by foreign enterprises (as such expansions often can be realized in different locations owned by the company). For this reason, IBM-PLI has started to develop the Global Investment Locations Database (GILD) in 2002. GILD tracks announced decisions of companies to locate new operations in regions outside of their HQ region/country on an ongoing basis.
IBM-PLI’s analysis of volumes of foreign investment focuses on job creation. From an economic development perspective, job creation is the best indicator of the local economic impact of the investment. Job positions created through the investment are typically filled by employees in the local labor market (or staff who relocate to that market) and consequently generate income and welfare in the region around the investment location.
The investment capital, however, often ends up in other regions or countries, as a result of the acquisition of plant or machinery, contracting of construction and engineering work outside the investment location. Therefore, the investment capital regularly is an overestimate of the economic impact of foreign investment in a specific location, particularly in the case of smaller regions or individual cities.

IBM Global Business Services 19
Interested in further detail? More Facts & Figures are available In 2011, we started the production of a separate “Global Location Trends. Facts & Figures” report in response to requests for detailed data and analysis underpinning the trends described in the annual Global Location Trends reports. The objective of the report is to provide more comprehensive overviews of foreign investments in various parts of the world, as well as the detailed numbers for the various investment rankings.
The Facts & Figures report provides detailed data and rankings on:
• Foreign investment by sector and sub-sector • Foreign investment for key activities (production, R&D,
shared services/BPO) • Foreign investment by origin country • Foreign investment by destination country • Top destination countries and cities by average investment
project value • Top origin countries and cities by average investment project
value • Individual one page profiles for selected individual countries
The Facts & Figures report is for purchase. If you are interested in ordering copy of the 2013 Facts & Figures report, or wish to receive an overview of the Table of Content first, please contact Katrien Castelain at [email protected].
To learn more about this IBM Institute for Business Value study, please contact us at [email protected]. For a full catalog of our research, visit:
ibm.com/iibv
Subscribe to IdeaWatch, our monthly e-newsletter featuring the latest executive reports based on IBM Institute for Business Value research.
ibm.com/gbs/ideawatch/subscribe
Access IBM Institute for Business Value executive reports on your tablet by downloading the free “IBM IBV” app for iPad or Android.
References 1. It is worth noting that the ramifications for foreign direct
investment of natural disasters, such as the flooding in Thailand, are not confined to the affected country, but can lead to global disruptions in supply chains, which in turn affect overall investment levels in particular sectors.
2. Interestingly, the United States experienced an increase in foreign investment in shared service centers and BPO and is now receiving more foreign investment in this activity than India.
3. “The World’s Most Competitive Cities,” Site Selection Magazine, in cooperation with IBM Global Business Services. November 2013.


© Copyright IBM Corporation 2013
IBM Global Services Route 100 Somers, NY 10589 U.S.A.
Produced in the United States of America December 2013 All Rights Reserved
IBM, the IBM logo and ibm.com are trademarks or registered trademarks of International Business Machines Corporation in the United States, other countries, or both. If these and other IBM trademarked terms are marked on their first occurrence in this information with a trademark symbol (® or ™), these symbols indicate U.S. registered or common law trademarks owned by IBM at the time this information was published. Such trademarks may also be registered or common law trademarks in other countries. A current list of IBM trademarks is available on the Web at “Copyright and trademark information” at ibm.com/legal/copytrade.shtml
Other company, product and service names may be trademarks or service marks of others.
References in this publication to IBM products and services do not imply that IBM intends to make them available in all countries in which IBM operates.
This report is intended for general guidance only. It is not intended to be a substitute for detailed research or the exercise of professional judgment. IBM shall not be responsible for any loss whatsoever sustained by any organization or person who relies on this publication.
The data used in this report may be derived from third-party sources and IBM does not independently verify, validate or audit such data. The results from the use of such data are provided on an “as is” basis and IBM makes no representations or warranties, express or implied.
Please Recycle
GBE05832-USEN-00


