Human resources in Healthcare
A Note on Workforce in Health Care Sector in India 1
Quantity and Quality of Human Resources : Shortage of Health Workers in India
Shakeel Ahmad, Venkatanarayana Motkuri and T. Sundara Vardhan≠
Background
Advancements in health care across countries in the globe are far better than it was before.
Nevertheless, it is still remained insufficient and inadequate in meeting the growing demand or
otherwise the requirement. Inadequate infrastructure including the health care facilities and
human resources along with health finances still remain one of the most important constraints in
the health care sector across the globe especially the poor and developing countries. Health care
is one of those most labour-intensive sectors where human resources are so critical. In this
respect global community as well policy makers in fact are concerned with addressing these
challenges.
A decade ago, the World Health Organisation (WHO) made a clarion call in respect of critical
factor of human resources (i.e. health professionals and workers) in health care sector (WHO,
2006). While assessing the crisis in the human resources for health, it observed a serious issue of
shortage of workforce in health care sector across the globe. According to WHO (2006) report,
there is a shortage of about 4.3 million doctors, midwives, nurses and support workers
worldwide. It proposed a strategy for addressing the challenge.
In continuum, recently in May 2014 the WHO made a Declaration on Human Resources for
Health (HRH). It is a renewed commitment towards universal health coverage (UHC).
Subsequently, the WHO has consolidated the evidence, contributed by many domain experts
who have been working in this area of research across countries, around a comprehensive health
labour market framework for universal health coverage (UHC). Consequent synthesis paper
followed by consultations resulted in framing of a global strategy in this regard (see WHO,
2016).
One of the significant benchmark that emerged is identification of a minimum threshold of
health workers numerical requirement in achieving certain health outcomes targeted particularly
that are part of the Sustainable Development Goals1 (SDGs) that global community is concerned
with (WHO, 2016). Accordingly, it arrived at threshold level requirement of skilled health
professionals and workers. Based on a threshold of 4.45 skilled health professionals per 1000
population, the WHO has estimated that the needs-based shortage of health-care workers
globally would be about 17.4 million of which almost 2.6 million are doctors and over 9 million
are nurses and midwives (see WHO, 2016). It observed that the largest needs-based shortages
are in countries of South East Asian and African regions. In this backdrop, an attempt is made
here to understand the situation of human resources for health in India.
≠ Dr Shakleel Ahmad is Pro Vice Chancellor at the Maulana Azad National Urdu University(MANUU),
Hyderabad.Venkatanarayana Motkuri is a Senior Research Analyst and T. Sundara Vardhan is Research Analyst
at Commission of Inquiry on Conditions of Muslims, Government of Telangana, Hyderabad. 1 The SDGs indicates renewed commitment of the global community from the Millennium Development Goals that
targeted year 2015 towards ensuring basic welfare of the people across globe.
Human resources in Healthcare
A Note on Workforce in Health Care Sector in India 2
Investing in Health: Word Development Report
The World Bank2 had first looked at gains from investing in Health nearly 25 years ago in 1993.
It had argued then that investing in health is one means of accelerating development.
rate of countries.
developing world has risen and child mortality has decreased, sometimes dramatically.
However, the progress is not enough. The toll from childhood and tropical diseases remains high
even as new problems - including AIDS and the diseases of aging populations - appear on the
scene. All countries are struggling with the problems of controlling health expenditures and
making health care accessible to the broad population. This WDR of 1993 then examined
controversial questions surrounding health care and health policy. It advocated then a threefold
approach to health policy for governments in developing countries and in the formerly socialist
countries.
First, to foster an economic environment that will enable households to improve their own
health. Policies for economic growth that ensure income gains for the poor are essential. So, too,
is expanded investment in schooling, particularly for girls.
Second, redirect government spending away from specialized care and toward such low-cost and
highly effective activities such as immunization, programs to combat micronutrient deficiencies,
and control and treatment of infectious diseases. By adopting the packages of public health
measures and essential clinical care described in the report, developing countries could reduce
their burden of disease by 25 percent.
Third, encourage greater diversity and competition in the provision of health services by
decentralizing government services, promoting competitive procurement practices, fostering
greater involvement by nongovernmental and other private organizations, and regulating
insurance markets. These reforms could translate into longer, healthier, and more productive
lives for people around the world, and especially for the poor.
Investing in services outside the health sector
The International Monetary Fund in 2004, had asserted the following
2 World Bank. 1993. World Development Report 1993: Investing in Health. New York: Oxford
University Press. © World Bank. https://openknowledge.worldbank.org/handle/10986/5976 License: CC BY 3.0 IGO.
Human resources in Healthcare
A Note on Workforce in Health Care Sector in India 3
roving health outcomes is linked not only to the provision of health services, but also to
interventions outside the health sector. Access to clean water and education for mothers are both
key determinants of infant and child mortality rates.
sharp declines in maternal mortality requires behavioral changes in prenatal care
and delivery and an improved road network, in addition to improved hospital care.
s a
number of fields. These include
public sector management policies that provide adequate incentives to health care providers;
procurement and distribution policies for pharmaceuticals so that these are available in
sufficient quantities in the right places;
public health measures to protect the population; and
suitable regulation and quality control of private providers, who often deliver more health
services than public providers.
The European Commission in its document on Investing in Health of February 2013 states
categorically that average levels of health have been improving across the EU, data hides major
inequalities. Poorer and disadvantaged people die younger and suffer more often from disability
and disease. The Commission argued that
cost- efficiency and reconciling fiscal consolidation targets with the continued provision of
sufficient levels of public services.
man capital helps improve the health of the population in
general and reinforces employability, thus making active employment policies more
effective, helping to secure adequate livelihoods and contributing to growth.
ities contributes to social cohesion and breaks the
vicious spiral of poor health contributing to, and resulting from, poverty and exclusion.
Health and GDP per capita
In GDP discussions, one latest inclusion is the full income approach that adds life expectancy to
the growth calculations. This approach combines growth in national income (GDP) with the
value people place on increased life expectancy—that is, the value of their additional life years
[VLYs]. Global Health 2035 estimates that 24% of the growth in full income in low- and
middle-income countries between 2000 and 2011 resulted from health improvements.
Does health influence per capita GDP? How does it do so?
e productive than comparable others who suffer from poor health.
schemes and pension accounts raise large resources in countries with high life expectancy
Human resources in Healthcare
A Note on Workforce in Health Care Sector in India 4
attracted to environments where labour is not vulnerable to heavy disease burdens.
In the US alone, Nordhaus at Yale concludes that half the growth in full income in the first half
of the twentieth century had resulted form mortality declines, and slightly less than half in the
second half. Real income in the US went up six times and life expectancy went up by 25 years
during this period. Clearly, the impact of health on GDP is substantial—an extra year of life
expectancy is estimated to raise a country’s per capita GDP by about 4 percent, for example.[
The intrinsic value of mortality changes, measured in terms of the value of a statistical life, or
VSL, is even more substantial.]
Chile[ Health, Wealth, and Welfare, New evidence and a wider perspective suggest sizable
economic returns to better health David E. Bloom, David Canning, and Dean T. Jamison
] and Gautemala are considered great examples of the success of investing in health.
78 (only 2 years shorter than that in the United States).
less than one in fifty.
-aged people, death rates are also now far lower: today’s Chilean female is far less
likely to die as a young adult from tuberculosis or childbearing or in middle age from cancer.
women’s fertility has dropped to 2.3 (barely above replacement). She suffers fewer infections
and has greater strength and stature and a quicker mind. Her life is not only much longer; it is
much healthier as well.
Human Resources for Health in India: Health Care Professionals and Workers
There is indeed a dearth of information on the total size or strength of human resources (health
care professional or workers) in Indian health care system (public and private). Rather we have
information on number of health professionals or workers of various categories registered with
concerned authorities, for instance, doctors registered with Medical Councils. The discontinued
government publication3 of the Health Information of India, used to carry periodically updated
information of number of registered doctors, dental surgeons and other paramedics. There was
considerable time lag between the publication date and information reference point of time.
While discontinuing that publication in 2005, the Government of India has in continuum began
the publication of National Health Profile, annually.
According to an earlier study (Motkuri and Naik, 2010) that referred to the Health Information
of India 2005, there were about 0.77 million doctors and 0.055 million dental surgeons
(allopathy) serving a little above one billion population in India. Additionally, there were 0.86
and 0.5 millions of general and auxiliary nursing midwives respectively and 0.05 million of
health visitors and health supervisors. Together, there were 2.2 million workforce engaged in the
health care sector in India. As the study derived it, there was on an average one doctor per
3 That is by Central Bureau of Health Intelligence, Directorate General of Health Services, Ministry of Health and
Family Welfare, Government of India, New Delhi
Human resources in Healthcare
A Note on Workforce in Health Care Sector in India 5
14,000 persons and one dental surgeon per four lakh population; 79 general nurse-midwives and
46 auxiliary nurse midwives per lakh population (see Motkuri and Naik, 2010). In total
(including doctors, nurses and other health workers) there were 209 health personnel, working at
different levels, per lakh population in India.
As per the information based on the Government of India’s recent National Health Profile
2017 report, about one million is the total number of Doctors possessing recognised medical
qualifications (under Indian Medical Council Act) and registered with any of the State Medical
Councils in India and / or with Medical Council of India (as on 2016). Also about 0.2 million
are the dental surgeons registered with either any of the State Dental Councils or Dental
Council of India (as on 2016). Besides, 0.8 millions are the number of doctors registered as
AYUSH practitioners in the country. In respect of the paramedics in India, the registered
number of auxiliary nurse mid-wives (ANMs) in 2015 were 0.82 million, number of nurses and
mid-wives were 1.9 million, and the other female health assistants (i.e. LHVs) were 0.06
million. Together, there were 5.49 million health professionals and workers registered in India.
However, one has to note that the registered number of any category of health professionals or
workers does not indicate that all they are alive and actively rendering their services in the
Indian health care system, irrespective of the type of management (public or private). It is an
accumulated number over a period ever since the concerned authorities have been set up for the
purpose. There is a lower chance of any deletion of those registrations of who are not physically
present and / or those who have not been actively rendering their services. Although a majority
of those registered health professionals may be serving in India, some of those might have
moved out of country to serve elsewhere in the globe (migration); some of them might have died
due to old age, medical contingencies or accidents (mortality); some of them might have aborted
abruptly rendering their services due to their physical inability to continue for different reasons
particularly that caused to medical contingencies or accidents (disability); and some of them
might have stopped their services as they become too old to render their services (aging).
Besides, there are chances of one health professional or skilled health worker making multiple
registrations in different state councils or in a state council and the Indian council (duplication
or multiplicity).
Table 1: Number of Health Professional / Workers of various categories
available in India, 2016
Sno Details Ref.
Year
Absolute
Number
Number
in
Millions
No of HW
Per lakh
Population
Average
population
per HW
1 2 3 4 5 6 7
1 Registered Doctors 2016 1005281 1.01 76 1320
2 Registered Dental Surgeons 2016 197732 0.20 15 6710
3 Registered AYUSH Doctors 2016 771468 0.77 58 1720
4 Registered ANMs 2015 821147 0.82 62 1616
5 Registered Nurses and Midwives 2015 1900837 1.90 143 698
6 Registered LHVs 2015 56264 0.06 4 23582
7 Registered Pharmacists 2016 741548 0.74 56 1789
8 Govt. Allopathy Doctors 2017 113328 0.11 9 11708
Human resources in Healthcare
A Note on Workforce in Health Care Sector in India 6
9 Govt. Dental Surgeons 2017 6328 0.01 5* 209671
Noted: 1. HW – Health Professional or Workers; AYUSH – includes Ayurveda, Unani, Sidda and
Homeopathy; ANM – Auxiliary Nurse Mid-wife; LHV – Lady Health Visitor; 2. * per 10 lakhs.
Source: 1. GOI (2017); 2. Authors’ calculations.
While taking note of the above caveat, if we standardize the registered health professionals
across categories to population it is supposed to serve, one can better understand adequacy or
inadequacy of the health professionals in the country. According to the United Nation’s
population projections, the total population of India (as of June 2016) was 1326.8 million. Using
this information what one can derive showing that the number of (registered) health
professionals or workers per lakh population is as follows: 76 doctors, 15 dental surgeons and 58
AYUSH practitioners (see Table 1). The number of registered paramedics per lakh population is:
62 ANMs, 143 nurses and midwives, 4 LHVs, and 56 pharmacists. If at all, all they are active in
service then their probable coverage (health professional/worker – population ratio) would be
derived as: one doctor per 1320 persons, one dental surgeon per 6710 persons, and one AYUSH
doctor / practitioner per 1720 persons. Similarly, the ratio of paramedics to population would be:
one ANM per 1616 persons, one nurse/midwife per 698 persons, one LHV per 23582 persons
and one pharmacist per 1789 persons (see Table 1).
The cross-country comparisons based on WHO’s data shows that while India has the density of
doctors (i.e. number of doctors available per 1000 persons) less than one, developed countries
have such density of doctors at three to four (see Figure 1; also see WHO, 2016). It indicates
that the density of doctors in India is 3 to 4 times lesser than that of developed countries. Similar
is the case of density of the other health professionals and workers for which too India has been
lagging behind (see WHO, 2016).
Figure 1: Density of Doctors (Physicians) across Selected Countries, 2011
Note: Density – Number of Doctors per 1000 population.
Source: WHO.
6.2
3
4.8
2
3.8
7
3.8
6
3.8
3
3.6
2
3.3
5
3.2
9
3.1
6
3.1
3
2.9
2
2.7
5
2.6
3
2.4
8
2.3
0
1.7
9
1.4
9
0.7
4
0.00
1.00
2.00
3.00
4.00
5.00
6.00
7.00
Gre
ece
Austria
Germ
an
y
Italy
Sw
itzerla
nd
Denm
ark
Isra
el
Austra
lia
Fra
nce
Neth
erla
nds
Belg
ium
UK
Irelan
d
Canad
a
Jap
an
Bra
zil
Ch
ina
Ind
ia
Human resources in Healthcare
A Note on Workforce in Health Care Sector in India 7
If we apply the WHO’s standardized threshold of 4.45 skilled health professionals per 1000
population, India needs about 6.0 million health professionals and workers given its 1326.8
million population in 2016. As per the registration data of concerned authorities, the total
number of health professionals or workers registered in India is about 5.49 million. It still
indicates the shortage of more than 0.5 million (or 50 lakhs) health professional and workers
in the country. If we take note of the caveat mentioned above, the shortage would shoot up
depending on the size (or proportion) of those who are not actively rendering their service
among the registered health professionals and workers.
According to the National Health Profile’s information, there were about 0.11 million allopathic
doctors and 0.01 million dental surgeons working in the Government sector, in 2016 (see Table
1). This number definitely indicates the actual availability and would be reliable. The
government sector includes rural health centres (PHCs and CHCs), area and district hospitals,
and any other government hospitals. Their availability is 9 doctors per lakh population and 5
dental surgeons per ten lakh population. In terms of coverage of population, it is about 12
thousand population for each doctor to serve and more than two lakh population for each dental
surgeon. It presents a partial picture of the strength of human resources for health in the Indian
health care system.
However, we do not have such definite and reliable information on size and strength of human
resources engaged in private health care system in India. The private health care system in India
has witnessed remarkable growth during the last two decades especially during the post-reform
period. It ranges from petty health clinics and nursing homes to multi-speciality hospitals in a
large scale and managed under the corporate structure of governances. Given the cost advantage
of Indian health care sector at international market prices, the corporate sector in this respect is
attracting even the international patients and facilitating health tourism. For instance, Apollo
Hospitals’ recent annual report claims that it has patients from 120 countries around the globe
(see Apollo, 2016). There has not been any effort in respect of assessing the size and strength of
the private health care system. The Apollo Hospitals’ recent annual report claims that it has
more than 9 thousands beds capacity and nearly 60,000 dedicated health care providing staff
(including doctors and other paramedics) in its group of hospitals across cities in the country
(see Apollo, 2016). There are many such corporate and non-corporate multi-speciality hospitals
in India along with clinics and nursing homes.
Therefore, one of the major drawbacks of the published information in official documents /
reports on health care system in India is that the data most reflects the public sector health care
(Motkuri and Naik, 2010). There is no information on the human resources engaged in the
private sector health care in India. In this regard, a study that made an estimation based on NSS
61st (2004-05) round Employment and Unemployment survey which followed the National
Industrial Classification 1998 methodology, shows that at all India level, there were 3.4 million
health workers actively rendering their services in the country and covering its more than one
billion population. They were forming around 0.73 per cent of the total workforce of the country
(Motkuri and Naik, 2010). It includes both the private and public health care sectors.
Human resources in Healthcare
A Note on Workforce in Health Care Sector in India 8
The standardised availability of health professionals and workers per lakh population indicated
that there were 343 health workers per lakh population in India. At the state level, as the study
observed Kerala (527) has the highest number of health workers per lakh population followed by
Delhi (513), Maharashtra (482), Tamil Nadu (405), Himachal Pradesh (400) while Orissa (161),
Assam (158) and Bihar (140) having the lowest figures. In terms of rural-urban distribution, the
study observed that health workers constituted 0.37 percent of the total workforce in rural areas
and 1.8 percent in urban areas. In absolute terms, urban areas had 62 per cent of the total health
workers indicating the locational disadvantage of the rural population in accessing the services
of health workers concentrated in the urban areas (ibid).
Despite such sporadic attempts, there have not been many efforts in respect of understanding the
size and strength of the health care system in India particularly in terms of its human resources
(health professional or workers serving in India). As mentioned above, the dearth of information
continued to persist.
Is it due to Shortage of the Qualified / Trained Personnel: Intake of Medical Education
However, the problem of shortage of human resources required in health care sector in India or
elsewhere must be seen in terms of shortage of human resources in terms of the non-availability
of qualified persons as such and the shortage of services of the qualified persons available. The
latter one involves the under-employment and unemployment of available graduates or qualified
persons in medical sciences along with the absenteeism and shirking of duties of the employed
persons in the service. As we have observed above, there is a shortage of human resources as
such that is the availability qualified persons in India. The shortage of services particularly that
is due to absenteeism and shirking away from performing duties is discussed in the following
section.
The shortage of human resources that is non-availability of the qualified persons is something a
problem associated with the education and training system of the country. Medical education
system is to train the qualified students and finally produce sufficiently qualified persons to
handle the health care needs of the society / country. Under-Graduation level is the entry point
for the courses associated with medical sciences and / or health care services in India. This is the
only feeder channel for the further higher level of tertiary level courses (Post-graduation)
associated with medical sciences and / or health care services. Enrolment at the under-graduate
level to a large extent reflects the intake capacity of the medical education system.
The information on enrolment called out from the All India Survey on Higher Education (see
GOI, 2016) indicate that during the last five years between 2011-12 and 2015-16 there is a
considerable increase in enrolment in under-graduate courses related to medical sciences and
those related to health care services, in the country (see Table 2). Such an increase is remarkable
particularly between 2011-12 and 2012-13. At all India level, the enrolment in General Medicine
and Surgery (i.e. MBBS) increased from nearly one lakh in 2011-12 to 1.9 lakh in 2015-16
while that in dentistry (Dental Surgeon – BDS) increased from 0.54 lakh to 0.9 lakh in the same
period. The enrolment in nursing has increased from 1.27 lakhs to 2.08 lakh during the same
period. In the courses of Indian system of medicine (AYUSH – includes Ayurveda, Unani, Sidda
and Homeopathy), the enrolment increased from nearly 0.5 lakh to 1.06 lakh during the last five
Human resources in Healthcare
A Note on Workforce in Health Care Sector in India 9
years period. Similarly, one can observe the considerable increase in enrolment in the other
courses related to health care services. A large part of the increase in enrolment is owing to
emerging private sector in the field of education including that of medical sciences.
Table 2: Enrolment in Under-Graduate Courses associated with
Medical Sciences or Health Care: All India
Sno Discipline/subjects 2015-16 2014-15 2013-14 2012-13 2011-12
1 Nursing 208882 193238 184194 157768 127980
2 General Medicine & General Surgery 191847 168686 149902 132671 99587
3 Dentistry 89910 82763 73178 62808 54052
4 Medical Sciences and Ophthalmology 45067 36990 19002 8049 15487
5 AYUSH 106174 92055 77230 69246 49817
6 Pharmacy & Pathology 208603 194459 174899 138540 123513
7 Physiotherapy & Occupational Therapy 45701 38095 30089 24623 16641
8 Medical Management & Hospital Admn. 3580 4987 4054 3312 2224
Total 899764 811273 712548 597017 489301
Note: AYUSH – includes Ayurveda, Unani, Sidda and Homeopathy.
Source: GOI (2016) All India Survey of Higher Education.
This enrolment may not directly translate into or reflect the qualified health care professionals
and workers available in India. One has to take note that this enrolment figures is a accumulated
number over the course cycle. For example, the enrolment in general medicine (MBBS) consists
of full course cycle of five years (4+1 years), and that for nursing it is a cycle of three years. The
enrolment at entry level (i.e. first year of the course) is nearly one-fifth of the total enrolment in
the course cycle for MBBS and one-third for Nursing. Based on the recent discourse on National
Eligibility Entrance Test (NEET), it is observed that the total number of seats available for the
under-graduate course of medicine (MBBS) in institutions of medical sciences across states in
India are around sixty two thousands. As one could observe that there has been a year to year
increment in the number of seats available (i.e. intake capacity) owing to growing number of
institutions or increase seats of existing institutions, the number of seats available now are
higher than the year before and so on.
There is a considerable gestation period ranging from five to ten or fifteen years by the time they
finish their graduation and training in medical sciences and getting into health care services.
Definitely certain proportion of graduates from under-graduation course would go for higher
studies and research. One has to account for certain attrition rate owing to dropouts and / or
stagnation in the under-graduation level courses as well as in the post-graduation levels. Among
the out-turns / passouts, given the diverse career options such a teaching, research and
development, health insurance sector and emigration finally how many of them would enter
directly into the health care service providing industry (public or private sector) in India. It needs
an in-depth longitudinal analysis probing into proportions of a cohort that entered into medical
courses at a point of time and finally after due gestation period entered into medical profession
or health care service. It gives a minimum annual production of qualified persons in medical
sciences available in the country.
Human resources in Healthcare
A Note on Workforce in Health Care Sector in India 10
Rural Health Care: Public Health System, Staffing Pattern, Norms and Shortages
Health care in rural areas has been a cause of concern for a long time. Most of the private sector
health care in India is concentrated in its urban areas (towns and cities) and rural population does
not have any option but they have to depend on public health care facilities. The inadequacy in
availability of public health facilities in rural areas and their ineffective and inefficient
functioning of the existing facilities as well became cause of concern in India. There is not only
shortage of health facilities required but also lacunae in utilizing the potential capacities of
existing facilities in a most effective and efficient manner.
Only solace for rural areas in terms of health care is availability of local Private or Registered
Medical Practitioners (PMPs / RMPs). In most of the cases they (P/RMPs) are unqualified and
unregistered medical practitioners (see Narayana, 2006). They are so predominant in rural India
that as a research study has shown while enumerating them, there were about 3000 such P/RMPs
in a district4 consisting of nearly 3000 villages. It shows there were at least one P/RMP per
village (see Narayana, 2006). According to another estimate for India, there were more than five
lakh such P/RMPs in the countryside (see Narayana, 2004). The rural India consists of more the
6.0 lakh villages of various sizes, of which more than 2.0 lakh villages have population less than
500 (Census 2011). Most of the remote and tribal areas / villages may not have even such type
of health care providing agents.
Under the Minimum Needs Programme (MNP)/ Basic Minimum Services (BMS) programme,
certain health facilities have to be established and maintained by the State, mostly the Provincial
or State governments in a federal structure (GOI, 2015). As per the Indian Public Health
Standards (IPHS), there should be one sub-centre health facility for every 5000 population in
plain areas and 3000 population in hilly areas. Similarly, there should be one primary health
centre (PHC) for every 30000 (Plain) / 20000 (Hilly) population, one community health centre
(CHC) for every 120000 (Plain) / 80000 (Hilly) population. It is altogether a different issue if
the norm set up long ago (four decades ago) serves in the contemporary situation of growing
demand for health with increasing awareness and complexity of health problems. These norms
too do not ensure any health facility in the neighbhourhood or nearest (walkable) distance. The
increasing communication facilities with expanding road and transport facilities made easy the
reaching out to the nearest among the distant health care facilities. But the transaction costs
involved with transport costs, travelling time and waiting time due to overcrowding at the
facilities could not be avoided. Such transaction costs must be due to inadequacy of health care
facilities.
Table 3: Rural Population (in Millions) of India
Sno Population 2011 2016*
1 Total Population 1210.8 1326.8
2 Rural Population (incl. STs) 833.7 891.6
3 Rural Tribal (ST) Population 94.1 100.6**
4 Population of Census Towns 52.8 60.9***
4 That is of Khammam district located in Telangana state. When the study was undergoing the district was part of
undivided state of Andhra Pradesh.
Human resources in Healthcare
A Note on Workforce in Health Care Sector in India 11
Note: 1. The above figures are in millions, as on 1st
March 2011 and June. 2016; 2. *
Projections based on UN (2015); 3. ** based on the projection taking into consideration
the percentage of STs in rural India would be 11 per cent of the rural population; 4. ***
based on the percentage of CTs considered as 14 per cent of the urban population.
Source: 1.Census of India; 2. UN (2015).
Even by those IPHS norms the existing public health care facilities are insufficient. According to
the United Nation’s population projections, the total population of India as of June 2016 was
1326.8 million and 32.8 per cent of them were living in urban areas (see UN, 2015). From this
one can derive that the rural population would be 891.6 million accounting for 67.2 per cent of
the country population. Given the size of rural population, following the norms of IPHS there
should be a minimum of 1.78 lakh sub-centres, around 30 thousand PHCs and more than seven
thousand CHCs in serving the rural population of the country. If we take into account the norm
referred for tribal areas, the requirement of health centres would be even more (see Table 4). The
IPHS norm for tribal and hilly areas is little different and hence it has to be taken into
consideration that norm as well while conducting an exercise on requirement of rural health
facilities for the country.
Further, one has to consider the population of Census Towns which have been usually ignored in
both the rural and urban development programmes and schemes. Urban areas are usually
differentiated by their administration categories. The Statutory Towns are administered by the
Statutory Urban Local Bodies (SULB) and the Census Town (CTs) which are still administered
by gram panchayats (Pradhan, 2013, Mukhopadhyay et al., 2016). The latter category of urban
areas (i.e. CTs) are so by definition based on the criteria consisting of three indicators (size of
population, density and occupation distribution) and identified so during decennial Census
operation of the Registrar General of India. Any of the urban development programmes or
schemes have not been extended to these second order urban areas i.e. Census Towns. Except, a
few Census Towns which become part of Out-Growth (OG) centres while being located adjacent
to a statutory city or town, most of the Census Towns are away from statutory urban local
bodies. They do not have access to any of the urban provisions. The CTs account for 14 per cent
of the total urban population5 of the country in 2011 (Pradhan, 2013, Mukhopadhyay et al.,
2016). In this respect as the population of Census Town is usually and eventually served by the
rural health facilities one has to consider them in rural planning at least until they are provided
with provision ensured to other urban local bodies which are by nature statutory (SLBCs).
Therefore, if we take into account accordingly the population of Census Towns, the requirement
of rural health centres would further shoot up (see Table 4). For deriving the population of CTs
in 2016, we have considered the 14 per cent of the urban population.
Table 4: An Estimate of Required number of Rural Health Centres in India, 2015
Sno Details Sub-Centres PHCs CHCs
1 2 3 4 5
5 There were about 38946 Census Towns in 2011. There is a surge in the number of CTs and its population during
the last decade (2001-11) (see Kundu, 2011, Bhagat, 2012, Pradhan, 2013, Mukhopadhyay et al., 2016). It is
observed that the emerging Census Towns account for nearly 40 per cent of the growth in the urban population
during the last decade (Bhagat, 2012). As a result their (CTs) contribution to the total urban population of the
country doubled from 7 to 14 per cent during the period 2001-11 (Pradhan, 2013, Mukhopadhyay et al., 2016).
Human resources in Healthcare
A Note on Workforce in Health Care Sector in India 12
1 Norm*: Population per Centre (Plain / Hilly area) 5000/3000 30000/20000 120000/80000
2 Total Number of Rural Health Centres required for
usual rural population (a minimum)
178322 29720 7430
3 Total Number of Rural Health Centres required for
non-ST Rural & ST Rural population (a medium)
191740 31398 7849
4 Total Number of Rural Health Centres required for
non-ST Rural, ST Rural population and Population
of Census Towns (a maximum)
203925 66428 8357
5 Existing (actual) Centres (as on 31st
March 2015) 153655 25308 5396
Minimum Shortage: Difference (2-5) 24667 4412 2034
Medium Shortage: Difference (3-5) 38085 6090 2453
Maximum Shortage: Difference (4-5) 50270 8120 2961
Note: 1. *Indian Public Health Standards (IPHS); 2. Based on projected population (see Table 3).
Source: GOI (2015) and Authors’ calculations.
Against such requirement considered above, the Rural Health Statistics information related to
existing number of centres, however, shows that there are 1.53 lakhs sub-centres, twenty five
thousand PHCs and little more than five thousand CHCs in India in 2015 (see GOI, 2015). The
coverage of population and areas by the existing health facilities in rural areas shows that on an
average a Sub Centre covers 5426 persons, a PHC covers 32944 persons and a CHC covers
154512 persons in 2015. The average rural area (Sq. Km) covered by a Sub Centre is 20.27 Sq.
Kms., a PHC is 123.09 SqKms and a CHC 577.32 SqKms. The average radial distance (Km)
covered by a Sub Centre is 2.54, PHC is 6.26, and CHC is 13.55. Average number of villages
covered by a Sub Centre is 4, a PHC is 25, and a CHC is 119 (see GOI, 2015).
When we compare the requirement as per the population norms of IPHS and the existing number
of health centres in India, it indicates a considerable level of shortage in terms of availability of
health facilities in rural areas (see Table 4).
Shortage of Human Resources in Rural Health Centres
The shortage is not only in terms of required number of facilities but also it is even more in
terms of human resources for health. On the one hand inadequate health facilities reflect the
shortage of human resources required (no facility no staff). On the other, the existing facilities
too fall short of required strength of health professional and workers.
The staffing structure as per the norms of the Indian Public Health Standards (IPHS) indicates
that each Sub Centre is required to be manned by at least one female health worker / Auxiliary
Nurse Mid-wife (ANM) and one male health worker (GOI, 2015). Besides, under National Rural
Health Mission (NRHM), there is a provision for one additional (second) ANM on contract
basis. One lady health visitor (LHV) is entrusted with the task of supervision of six Sub Centres.
Being the first contact point, a Sub Centres is expected to build interpersonal communication in
order to bring about behavioral change and provide services in relation to maternal and child
health, family welfare, nutrition, immunization, diarrhoea control and control of communicable
diseases programmes (see GOI, 2015). The ANMs are critical human resource at the sub-centre
level. Also, at the village level under the NRHM Plan of Action relating to Infrastructure and
Manpower Strengthening, one of the components was to have a village level health volunteer -
Human resources in Healthcare
A Note on Workforce in Health Care Sector in India 13
the Accredited Social Health Activists (ASHA). Every village/large habitation will have a
female ASHA chosen by and accountable to the Panchayat and she is to act as the interface
between the community and the public health system. States were asked to choose State specific
models in this regard (see GOI, 2015).
A PHC is to be manned by a Medical Officer supported by 14 paramedical and other staff.
Among them are the one Auxiliary Nurse Mid-wife (ANM) / female health worker and one
Nurse Mid-wife / staff nurse. In addition, under NRHM, there is a provision for two additional
staff nurses at PHCs on contract basis. A PHC acts as a referral unit for 6 Sub Centres and has 4
to 6 beds for patients (GOI, 2015). The PHCs are to provide curative, preventive, promotive
health care and family welfare services. Similarly, a CHC is required to be manned by four
medical specialists i.e. surgeon, physician, gynecologist and pediatrician supported by 21
paramedical and other staff. It has to be equipped with 30 beds in-patient care and with one
operation theatre (OT), X-ray, labour room and laboratory facilities. It serves as a referral centre
for 4 PHCs and also provides facilities for obstetric care and specialist consultations (GOI,
2015).
Inadequacy in availability of sufficient staff as per the IPHS norms in the existing centre has
been remained a constraint in the rural health care system in India. As per the existing staff
information, on an average a female health worker (ANM) at a Sub-Centre was serving about
3929 persons in rural areas and a male health worker was serving 14980 persons (GOI, 2015). In
indicates that their catchment population / area has been growing beyond the capacity of the
health workers. Further, given the existing number of sub-centres and PHCs, the total Female
Health Workers (ANMs) in position in 2015 were 212185. As per the Rural Health Statistics
information still more than twenty thousand posts are remained vacant when compared to
sanctioned positions (see GOI, 2015). Similarly is the case with the shortage of staff nurses in
PHCs and CHCs. In PHCs, about 34750 positions for doctor were sanctioned but the doctors in
position in these centres in India were 27421 and the rest remained vacant. There is a
considerable gap in the requirement and the staff in action.
Notwithstanding that if we apply the staff requirement per centre to total number of rural health
centres required as presented in Table 3, one can derive the total requirement of the health
professionals. For instance, if we consider the requirement of two ANMs per sub-centre (one
regular and one on contract) and one ANM in PHC, the total ANMs required in the Sub-Centres
and PHCs would be requiring a total of more than four lakh ANMs for rural India. If we add the
attrition rate at five per cent, the requirement of these ANMs further shoots up to more than 4.5
lakhs at a maximum (see Table 5). Accordingly the approximate requirement estimation for
various categories of health professionals or workers required at rural health centres at various
levels are presented in the Table 5 (a detailed one is presented Table 1A in Appendix).
If we see the requirement against the number of ANMs in position (available), it indicates that
the country has shortage of more than two lakhs of female health workers / ANMs to be served
in Sub-centres and PHCs. Similarly, the requirement of doctors or medical officers at PHCs and
specialists at CHCs for the required rural health centres is between sixty to seventy thousands.
The number of these doctors in position at the existing centres (PHCs and CHCs) is little above
Human resources in Healthcare
A Note on Workforce in Health Care Sector in India 14
thirty thousand. It indicates that availability is less than half of the requirement and there is a
shortage of more than thirty thousand doctors for PHCs and CHCs in India. In case of Staff
Nurses, the shortage is more than one lakh and there is a shortage of twenty thousand LHVs.
The shortage in male health assistants and workers in sub-centres and PHCs is more than
one-and-half lakhs. In this way one can find the shortage in pharmacists, radiographers and
laboratory technicians. The acute shortage is obvious across the category of health professional
required for the rural health centres.
Table 5: Requirement of various categories of Health Professional
and / or Workers in Rural Health Centres in India, 2016
Sno Health Professionals
Existing
Staff
Staff Requirement
Minimum Medium Maximum
1 2 3 4 5 6
1 Medical Officers / Doctors – PHCs & CHCs 31499 62413 65935 70200
2 Health Worker (Female)/ANM – SCs & PHCs 212185 405682 435622 463343
3 Nurse Mid-wife (Staff Nurse) - PHCs & CHCs 65039 148230 156595 166725
4 Health Assistant (Female)/LHV – PHCs 16480* 31206 32967 35100
5 Health Worker & Assts. (Male) – SCs & PHCs 69090* 218444 234295 249222
6 Pharmacists - PHCs & CHCs 23131 39008 41209 43875
7 Laboratory Technicians - PHCs & CHCs 17154 39008 41209 43875
8 Radiographers - CHCs 2150 7802 8242 8775
Notes: 1. Existing Staff is as on 1st
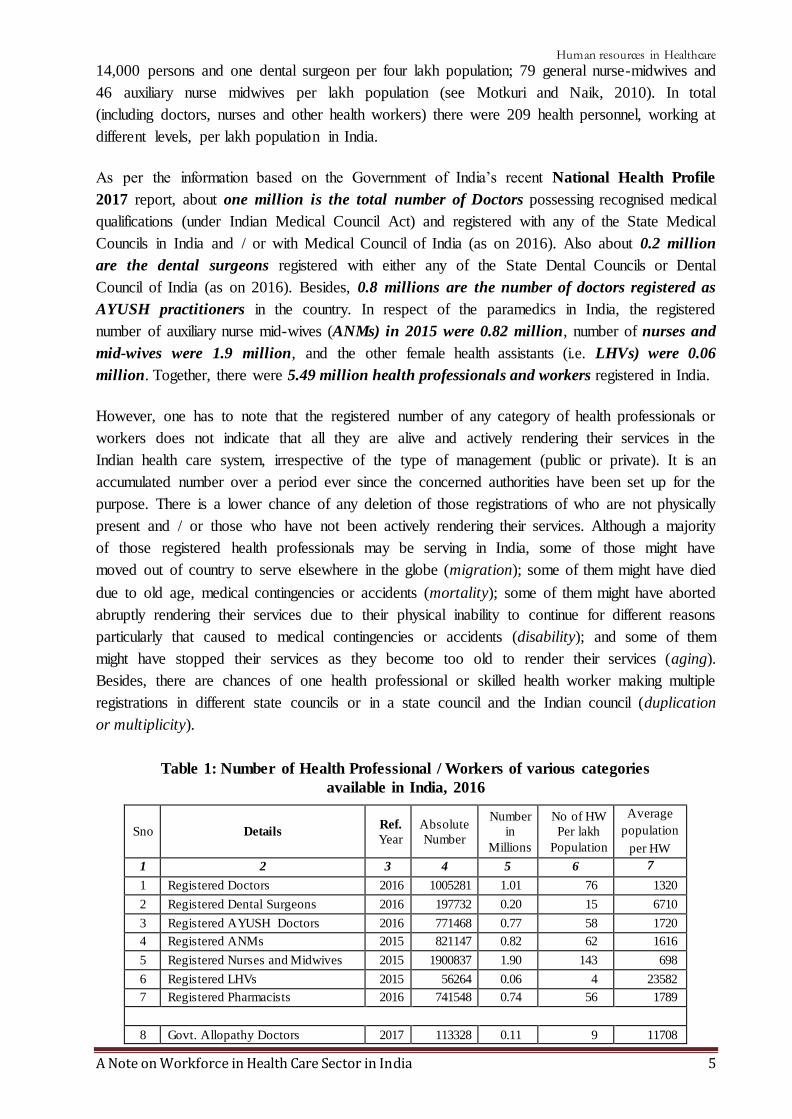
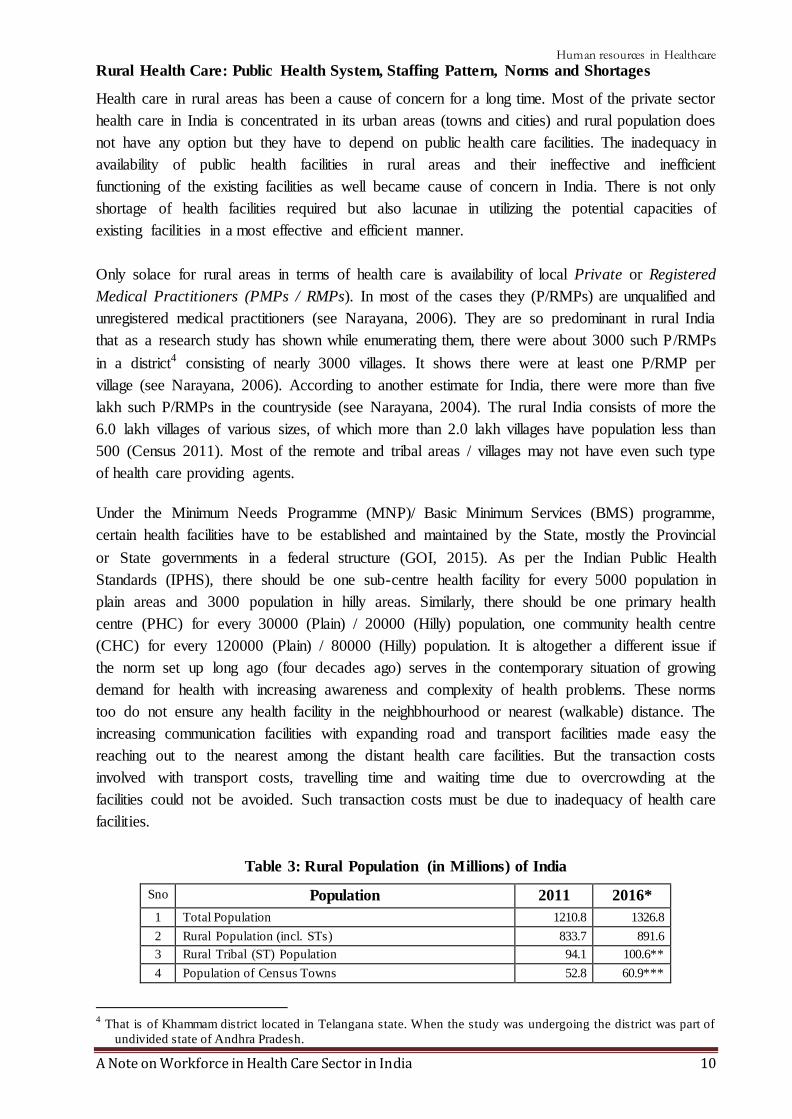
March 2015 based on Rural Health Statistics of Government of India
(GOI, 2015; 2017); 2. * information is for the reference year 2015; 3. The Staff Requirement
includes the attrition rate at 5 per cent level.
Source: 1. GOI (2015) and GOI (2017); 2. Authors’ Estimates.
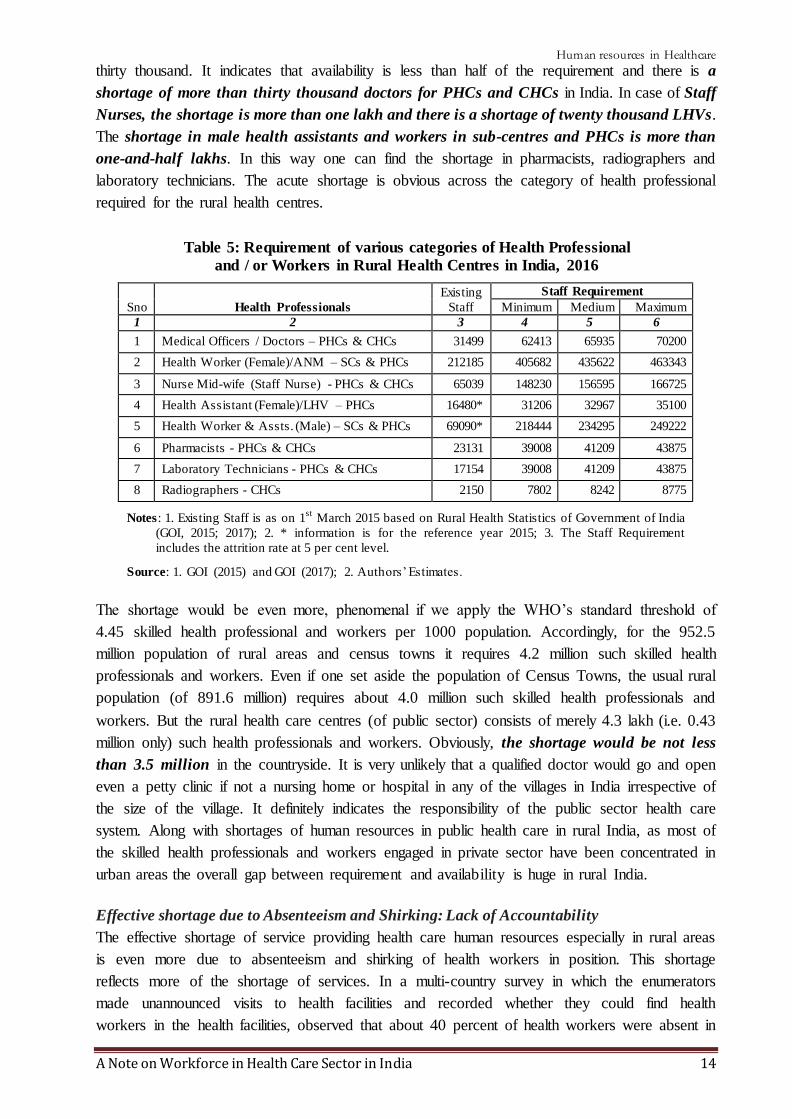
The shortage would be even more, phenomenal if we apply the WHO’s standard threshold of
4.45 skilled health professional and workers per 1000 population. Accordingly, for the 952.5
million population of rural areas and census towns it requires 4.2 million such skilled health
professionals and workers. Even if one set aside the population of Census Towns, the usual rural
population (of 891.6 million) requires about 4.0 million such skilled health professionals and
workers. But the rural health care centres (of public sector) consists of merely 4.3 lakh (i.e. 0.43
million only) such health professionals and workers. Obviously, the shortage would be not less
than 3.5 million in the countryside. It is very unlikely that a qualified doctor would go and open
even a petty clinic if not a nursing home or hospital in any of the villages in India irrespective of
the size of the village. It definitely indicates the responsibility of the public sector health care
system. Along with shortages of human resources in public health care in rural India, as most of
the skilled health professionals and workers engaged in private sector have been concentrated in
urban areas the overall gap between requirement and availability is huge in rural India.
Effective shortage due to Absenteeism and Shirking: Lack of Accountability
The effective shortage of service providing health care human resources especially in rural areas
is even more due to absenteeism and shirking of health workers in position. This shortage
reflects more of the shortage of services. In a multi-country survey in which the enumerators
made unannounced visits to health facilities and recorded whether they could find health
workers in the health facilities, observed that about 40 percent of health workers were absent in
Human resources in Healthcare
A Note on Workforce in Health Care Sector in India 15
India (see Chaudhary et al., 2006, Kremar et al., 2005). Although the focus of the survey was on
whether providers were present in their facilities, it also observed that many providers who were
at their facilities were not working. In India, one-quarter of government health workers were
absent from facility, but only about one-half of the health workers were actually working when
enumerators arrived at the facility. It is found that absence rates are generally higher in poorer
regions and absence is typically fairly widespread, rather than being concentrated on a small
number of workers. Higher-ranking and more powerful providers, such as doctors, are absent
more often than lower-ranking ones, men are absent more often than women and health workers
from the local area are absent less often (ibid).
Quality of Health Workers: Skills, Empathy and Accountability
The quality of health workers in health care sector encompassing skills, empathy, accountability,
professionalism, ethos, values and so on has become cause of concern as well. Besides, it also
matters for the quality of health professionals and workers the facilities and provisions for their
pre-service and in-service training and orientation programmes. Although the quality of health
care would be influenced by many other factors as well but the quality of health worker
definitely improves and hence one of the critical factors in the quality of health care.
The WHO (2006) suggested six dimension of quality health care namely, effective, efficient,
accessible, acceptable / patient-centered, equitable, and safe. While translating these six
dimensions into reality, though the role of technology is not discounted, ultimately, the human
resources become very critical. It is pertinent to note that health care is labour intensive6 and the
success and quality of health care system is determined by the deployment of well-trained and
sufficient health personnel providing services. Dussault (1999) identified five sub-dimensions to
assess the quality of performance of human resources in health sector. They are: coverage,
productivity, technical quality, socio-cultural quality and organizational stability. These five
sub-dimensions are in turn influenced by three main processes namely, the development of
competencies (here comes the knowledge, skills and attitudes required), the deployment of
workforce between the priority sectors in various regions and sub-regions of the country and
finally, the management of workforce (see Dussault, 1999).
The Policy Concern
As it is observed above, there is a huge shortage of health professionals and workers of various
categories in the Indian health care system. The policy concern must be addressing these
challenges. One of concern in this regards in supplying the required skilled health professionals
and / or workers. The other one is motivating and making the frontline service providing agents
to work especially those engaged in the health care system of public sector. It really is concerned
against the observation of lack of accountability and absenteeism and shirking of duties by the
health workers in the public sector.
Supplying the skilled health professionals and / or workers: Education and Training Systems
6 “Health care is a highly labour intensive service with labour accounting for 50-75% of total costs. Any change in
the structure, delivery organization and finance impact directly on the workforce and vice versa. Conseque ntly,
it would be too simplistic to consider the workforce just as an important cost factor” (Ullrich 1998).
Human resources in Healthcare
A Note on Workforce in Health Care Sector in India 16
As the WHO’s cross-country comparison data shows that the density of doctors (Physicians) is
less than one and it is very low when compared to that of China and other developed countries
(see Figure 1). Density of doctors here is the number of doctor available for 1000 population.
The density of doctors in India is less than half of that of China. If we compare with any one of
developed country with a moderate density of doctors available, one would observe that India
has 4 to 5 times lesser density. Unlike the other labour markets wherein demand side problems
usually prevail, here in health care sectors there is a supply problem as well. There is a shortage
of supply of qualified and skilled health professionals in India.
For supplying the required skilled health professionals and workers while meeting the needs of
growing population, the education and training system that particularly relates to medicine and
/or health is crucial and a critical factor. In order to serve or handle the medical care needs of
the population, the country needs to train the medical personnel through medical education
system (Thomas, 2017). In this regard, the medical education and training system of the country
has to be tailored in the lines of growing population and its emerging health care needs. Indeed
the Bhore Committee in 1946 on the eve of independence followed by post-independence
Mudaliar Committee in 1962, Shrivastav Committee in 1975, Bajaj Committee in 1986, and the
very recent High Level Expert Group on Universal Health Coverage in 2011 all they have
examined the challenges of medical education (Thomas, 2017). However, the recent WHO
report observed that the chronic under-investment in education and training of health workers
and the mismatch between education strategies in relation to health systems and population
needs are resulting in continuous shortages (WHO, 2016). As it is said medical education is the
beginning of a process to produce a cadre of personnel who need to be deployed rationally to
achieve the health goals of the country (Thomas, 2017).
Along with individual health care (in or outpatient) associated with hospitals are health care
centre, there is a desperate requirement for the Public Health or Community Health /
Medicine, which deals with the preventive medicines and promoting health. Besides,
Emergency Health / Medical Services (EHS / EMS) is an emerging area of health care
industry where it provided pre-hospital emergency services and inter-facility patient transfers
involving care and transportation. It is responsible for providing emergency and
primary health care to patients outside of hospital. As one would observe, there is a growing
number of 108 emergency medical services meant for the purpose in India irrespective of the
management (public or private). Despite the growth of such services, still there is a considerable
shortage in this arena as well.
Education and training in respect public health is meagre in India. Till date, as it is observed that
there are 23 institutions in India offering courses in this respect, i.e. master of public health
(MPH) degrees (Rai and Tulchinsky, 2017), along with little more than 900 medical
postgraduate seats in community medicine, as well as 90 seats for a diploma, which offers a
comprehensive postgraduate training in public health that is however recognised by the Medical
Council of India (MCI) (Keshri, 2017). The Bhore Committee long back in 1946 had
recommended to introduce preventive medicine as one subject of medical undergraduate training
Human resources in Healthcare
A Note on Workforce in Health Care Sector in India 17
(Rai and Tulchinsky, 2017; Keshri, 2017). However, such a concern has not been adequately
given attention in the policy making since independence.
Motivating and Making the Frontline Service Providing Agents to Work: Incentives and
Monitoring Mechanism
The deployment of human resources, their distribution across areas particularly in rural and
remote areas, and their retention along with motivation and accountability are critical factors in
any health care system. The concern is what motivates the regiment of grassroots level service
providers of health services i.e. all categories of health workers/professionals. The World
Development Report 2004 provided a practical framework for making the services that
contribute to human development work for poor people (see World Bank, 2004). It considered
the crucial aspects of by enabling the poor to monitor and discipline service providers, by
amplifying their voice in policy making, and by strengthening the incentives for providers to
serve the poor (ibid).
* * *
References
Apollo (2016). Annual Report 2015-16: Valuing Life, Appollo Hospitals, Chennai.
Bhagat, R B (2011): “Emerging Pattern of Urbanisation in India”, Economic and Political Weekly, Vol. 46 (34), pp: 10-12.
Chaudhury, N.; J. Hammer, M. Kremer, K. Muralidharan, and F. H. Rogers (2006). “Missing in action: Teacher and
Health Workers absence in developing countries”, Journal of Economic Perspective, Winter, Vol. 20(1),
pp: 91-116.
Dussault, Gilles (1999), Human Resources Development: The Challenge of Health Sector Reform, The World Bank, Washington DC.
Denis, Eric and Kamala Marius-Gnanou (2011). “Toward a Better Appraisal of Urbanisation in India”, Cybergeo: European Journal of Geography, Vol. 569. Available at: DOI: 10.4000/cybergeo.24798.
Denis, Eric, Partha Mukhopadhyay and Marie-Hélène Zérah (2012). “Subaltern Urbanisation in India”, Economic
and Political Weekly, Vol. 47(30), pp: 52-62.
Fernandes, Edmond (2017). “Why Community Medicine (Public Health) is the sexiest profession of the 21st
century”, July 3, 2017, Global Health Focus, Lifestyle, Times of India (TOI). Accessed on 12/09/2017 at
https://blogs.timesofindia.indiatimes.com/global-health-focus/why-community-medicine-public-health-is-
the-sexiest-profession-of-the-21st-century/
Franco, L. M.; S. Bennett and F. Kanfer (2002). “Health sector reform and public sector health worker motivation:
A Conceptual Framework”, Social Science Medicine, Vol. 54, pp: 1255-1266. DOI: 10.1016/S0277-9536(01)00094-6.
GOI (2006). Health Information of India 2005, Central Bureau of Health Intelligence, Directorate General of
Health Services, Ministry of Health and Family Welfare, Government of India, New Delhi.
GOI (2015). Rural Health Statistics 2014-15, Statistics Division, Ministry of Health and Family Welfare,
Government of India, New Delhi.
Government of India (2016). All India Survey on Higher Education 2015-16, Department of Higher Education,
Ministry of Human Resource Development (MHRD), Government of India, New Delhi.
GOI (2017). National Health Profile 2017, Central Bureau of Health Intelligence, Directorate General of Health
Services, Ministry of Health and Family Welfare, Government of India, New Delhi.
HPEC (2011). “Report on Indian Urban Infrastructure and Services”, National Institute of Urban Affairs, April, available at http://www.niua.org/projects/hpec/finalreport-hpec.pdf
Jeffrey, David (2016). “Empathy, sympathy and compassion in healthcare: Is there a problem? Is there a difference?
Does it matter?”, Journal of the Royal Society of Medicine, Vol. 109 (12), December 6, 2016, pp. 446-
452.
Keshri, Vikash R (2017). “Public Health Education”, Letter, Economic and Political Weekly, Vol. 52 (36),
September 9.
Kundu, Amitabh (2011a). “Politics and Economics of Urban Growth”, Economic and Political Weekly, Vol. 46 (20), pp: 10-12.
Human resources in Healthcare
A Note on Workforce in Health Care Sector in India 18
Kundu, Amitabh (2011b). “Method in Madness: Urban Data from 2011 Census”, Economic and Political Weekly, Vol. 46 (40), pp: 13-16.
Misra, Rajiv, Rachel Chatterjee, Sujatha Rao (2003). India Health Report, OUP, New Delhi.
Motkur, Venkatanarayana and Suresh V. Naik (2010). “Workforce in Indian Health Care Sector”, The Asian
Economic Review, Vol. 52 (2), August, Hyderabad.
Motkuri, Venkatanarayana (2011). “Access to Health Care in Andhra Pradesh: Availability of Manpower”, MPRA Paper No. 47932. Accessed at http://mpra.ub.uni-muenchen.de/47932/
Mukhopadhyay, Partha; Marie-Helene Zerah; Gopa Samantha and Augustin Maria (2016). “Understanding India’s
Urban Frontier: What is behind the emergence of Census Towns in India?”, Policy Research Working
Paper No. WPS 7923, The World Bank, Washington DC.
Narayana, J. P. (2004). Ensuring a Healthy Future, Loksutta, Hyderabad. Accessed on 12/08/2009 at
http:www.loksutta.org.
Narayana, K. V. (2006). “The Unqualified Medical Practitioners: Methods of Practice and Nexus with the Qualified Doctors”, Working Paper No. 70, Centre for Economic and Social Studies, Hyderabad.
Pradhan, K. C. (2013). “Unacknowledged Urbanisation”, Economic and Political Weekly, Vol. 48 (36), 07
September.
Rai, Rajesh Kumar and Theodore Herzl Tulchinsky (2017). “India badly needs Public Health Education”, Economic and Political Weekly, Vol. Xx, 8 July 2017.
Sundararaman, Thiagarajan and Garima Gupta (2011). “Indian approaches to retaining skilled health workers in rural areas”, Bulletin of the World Health Organization, Vol. 89, pp:73-77. doi: 10.2471/BLT.09.070862
Thomas, George (2017). “A Case for Universal Medical Care: The Opposition to NEET is a Smokescreen to hide
Inequalities and Exploitation”, Op.Ed, page 8, September 7 (Thursday), 2017, The Hindu.
UN (2015). World Population Prospects: The 2015 Revision (Medium Fertility Variant), Population Division,
Department of Economic and Social Affairs, United Nations (UN), Geneva.
WHO (2006). The World Health Report 2006: Working Together for Health, World Health Organisation (WHO),
Geneva.
WHO (2016). Global strategy on human resources for health: Workforce 2030 , World Health Organisation
(WHO), Geneva.
WHO (2016b), “Health workforce requirements for universal health coverage and the Sustainable Development
Goals”, Background paper No. 1 to the Global Strategy on Human Resources for Health, Human Resources for Health Observer 17, Issue 1.
World Bank (1993). World Development Report 1993: Investing in Health, OUP, New York.
World Bank (2001). India: Raising the Sight – Better Health Systems for India’s Poor, Report No. 22304, May
28, Health, Nutrition and Population Sector Unit, India, south Asia Region.
World Bank (2004). World Development Report 2004: Making Services Work for Poor People , The World Bank,
Washington DC.
Appendix
Table 1A: A Minimum Norm of Staffing Pattern
(Number of Posts) in Rural Health Centres in India
Sno Centres and Posts Details Norm of
Staff per
Centre*
Required
staff for
existing
Centres
Required
Staff for
required
Centres
A SUB - CENTRE
1 Health Worker (Female)/ANM 1 153655 203925
2 Additional Second ANM (on contract) 1 153655 203925
3 Health Worker (Male) 1 153655 203925
4 Voluntary Worker (Paid @ Rs.100/- p.m. as honorarium) 1 153655 203925
Total (excluding contractual staff) 3 460965 611776
B PRIMARY HEALTH CENTRE (PHCs)
1 Medical Officer 1 25308 33428
2 Pharmacist 1 25308 33428
3 Nurse Mid-wife (Staff Nurse) 1 25308 33428
4
Nurse Mid-wife (Staff Nurse) : 2 additional Staff Nurses
on contract 2 50616 66857
5 Health Worker (Female)/ANM 1 25308 33428
Human resources in Healthcare
A Note on Workforce in Health Care Sector in India 19
6 Health Educator 1 25308 33428
7 Health Assistant (Male) 1 25308 33428
8 Health Assistant (Female)/LHV 1 25308 33428
9 Upper Division Clerk 1 25308 33428
10 Lower Division Clerk 1 25308 33428
11 Laboratory Technician 1 25308 33428
12 Driver (Subject to availability of Vehicle) 1 25308 33428
13 Class IV 4 101232 133714
Total (Excl. Contractual staff) 15 379620 501427
C COMMUNITY HEALTH CENTRE (CHC)
1 Medical Officer# 4 21584 33428
2 Nurse Mid– Wife(staff Nurse) 7 37772 58500
3 Dresser 1 5396 8357
4 Pharmacist/Compounder 1 5396 8357
5 Laboratory Technician 1 5396 8357
6 Radiographer 1 5396 8357
7 Ward Boys 2 10792 16714
8 Dhobi 1 5396 8357
9 Sweepers 3 16188 25071
10 Mali 1 5396 8357
11 Chowkidar 1 5396 8357
12 Aya 1 5396 8357
13 Peon 1 5396 8357
Total 25 134900 208928
Notes: 1. # - Either qualified or specially trained to work as Surgeon, Obstetrician, Physician and
Pediatrician. One of the existing Medical Officers similarly should be either qualified or
specially trained in Public Health); 2. The above is the minimum norm for staffing pattern.
However, additional staff has been prescribed under IPHS.
Source: GOI (2015) and Author’s calculations.