30
Reading Recovery™ annual report for UCL Institute of Education: 2017-18

Reading Recovery™ annual report for UCL Institute of Education: 2017-18
Page | 2
Reading Recovery Europe International Literacy Centre
UCL Institute of Education
University College London 20 Bedford Way
London WC1H 0AL Tel: 020 7612 6585
Email: [email protected] Web: http://www.ucl.ac.uk/reading-recovery-europe
Produced by the International Literacy Centre, using software licensed from the International Data Evaluation Center at The Ohio State University.
The name Reading Recovery is a registered trademark of the UCL Institute of Education, University
College London.
Page | 3
Contents
Reading Recovery UCL Institute of Education report summary page for academic year 2017-18
Introduction
Questions for evaluation
1: How many children were supported by the Reading Recovery teacher and which children
were they?
a) Size of implementation b) Characteristics of the cohort
2: What were the programme outcomes for Reading Recovery children?
a) Programme outcomes
b) Disaggregated outcomes c) Length of programmes
3: What were the literacy levels of children in the Reading Recovery programme?
a) Average scores at entry and exit b) Children discontinuing in different year groups
4: Where were Reading Recovery children placed in a register of Special Educational Need and Disability (SEND) at the beginning of their programme, and following their programme?
5: What progress did children make after Reading Recovery?
a) Accelerated progress (discontinued) b) Progress (referred)
6: What were the results of National Assessments for Reading Recovery children?
a) National assessments at entry to and exit from Reading Recovery b) Outcomes of the phonics screening check
c) Key Stage 1 National Assessments d) Key Stage 2 National Assessments
7: What was the efficiency of the Reading Recovery implementation?
a) Experience b) Teacher responsibilities
c) Days worked and missed d) Outcomes
Supplementary table
Appendix A: Progress in Reading Recovery

Page | 4
Reading Recovery UCL Institute of Education report summary page for academic year 2017-18 How many children received literacy support through Reading Recovery teachers?
Number of children served in Reading Recovery (including those with incomplete or on-going
programmes and those who left): 5519
Number of children served in other interventions:
BRP: 1380
Fischer Family Trust Wave 3: 430
Talking Partners: 54
Early Literacy Support: 4
Other: 851
RR-led Intervention: 370
Switch-on: 22
Total number of children reported having had support: 8630
Reading Recovery teaching
Number of schools in the implementation: 723
Number of Reading Recovery teachers:828 in training:130 experienced: 698 Make-up of the cohort
Year 1: 3426 Year 2: 2006 Year 3: 73 Boys: 3125 Girls: 2394
Percentage of children reported as disadvantaged: 50.2% Percentage of children reported as speaking EAL: 20.7%
Percentage of children reported as in special groups, such as Looked After Children (LAC): 5.8%
Outcomes
Percentage of all children served with completed Reading Recovery programmes: 71.9% Percentage of children with discontinued programmes: 80.9%
Percentage of children referred for longer term support: 19.1% Percentage of children whose programmes are ongoing: 23.4% Progress made during Reading Recovery
Average Book Level at entry to Reading Recovery: 2.1
Average Book Level on exit for discontinued children: 17.7 Average Book Level on exit for referred children: 10.1
Average BAS Word Reading Age at entry to Reading Recovery: 5:4 Average BAS Word Reading Age on exit for discontinued children: 6:4
Average BAS Word Reading Age on exit for referred children: 5:10

Page | 5
Progress made after Reading Recovery
At three month follow-up: Average Book Level:17.4 Average Word Reading Age:6:4 At six month follow-up: Average Book Level:19.0 Average Word Reading Age:6:7
National Assessments Complete programmes Discontinued programmes
Key Stage 1 Key Stage 2 Key Stage 1 Key Stage 2
Reading
w orking at the expected standard 44.6% 48.5% 54.1% 53.1%
w orking at greater depth 3.1% 5.5% 3.8% 6.3%
Writing
w orking at the expected standard 33.8% 48.4% 41.1% 54.1%
w orking at greater depth 1.1% 2.9% 1.4% 3.4%

Page | 6
Introduction
Reading Recovery™ is a short-term intervention for children who have the lowest achievement in literacy learning in their first years at school. Children are taught individually by a specially trained
teacher for 30 minutes each day for 12-20 weeks. The goal is for children to become effective and efficient readers and writers able to work within an average range of classroom performance.
Reading Recovery is an early intervention because proficient readers and writers develop early. Once children begin to fail, opportunities for them to regain normal progress among their peers
become more difficult and more costly to achieve. There is strong evidence that school failure leads to lack of self-esteem, diminished confidence, school dropout, and other negative outcomes, creating an educational, financial and moral imperative to direct resources to the prevention of
reading failure. Reading Recovery has a strong track record and substantial independent research evidence as an efficient and effective means of overcoming literacy difficulties for many children,
especially those most at risk of failure, such as children in poverty, children with limited English language and those who have made the least progress in language and literacy during their pre-school and early school experience.
The key to the successful implementation of Reading Recovery is in the model of training. Three
levels of professional staffing provide a stable training structure: university based trainers who train and support teacher leaders; local level teacher leaders working with groups of schools to train and support teachers; and school-based teachers who work with the hardest-to-teach children.
The initial Reading Recovery teacher professional development programme is part-time, for one
academic year, during which the teacher works with low attaining children in their school. Teachers become sensitive observers of children’s reading and writing behaviours and expert in making moment-by-moment teaching decisions based on a deep understanding of how children think and
learn about reading and writing, and how to overcome the barriers to their learning.
Following the initial year of training, teachers continue to participate in regular professional development. They continue to teach for their colleagues and to discuss their professional decision making. Continuing professional development sessions provide collaborative opportunities for
teachers to remain responsive to individual children, to increase the effectiveness of their practices, to get help from peers for children with particularly complex needs, and to consider how new
research and developments in theory might influence their practice. Reading Recovery is not an isolated phenomenon in schools, it has a carefully designed plan for
implementation into existing systems. The success of any intervention such as Reading Recovery is influenced by the quality of the decisions made about implementation. For more information about
implementation see ‘Standards and Guidelines for Reading Recovery’ (International Literacy Centre, 2011).
Reading Recovery benefits the whole school population. Every Child a Reader (ECaR) is one example of using Reading Recovery to support pupils more widely. It is a school-wide strategy for
raising attainment specifically in Key Stage 1, through a layered approach to intervention, with Reading Recovery at its core. Schools are able to capitalise on the professional development provided to Reading Recovery teachers, to advise, mentor and support others in the school with
responsibilities for children's literacy, including class teachers, teaching assistants and parents through lighter touch interventions.
Reading Recovery is one of the most carefully monitored initiatives in education today. Since 1994, routine annual monitoring has documented outcomes for all children served in Reading Recovery.
Consistent outcomes are seen for children across the United Kingdom and the Republic of Ireland

Page | 7
with a large majority of children who completed the programme reaching age appropriate levels of literacy. This is supported by independent research evidence which also indicates that the effects of
Reading Recovery are long lasting (http://www.ucl.ac.uk/international-literacy/reading-recovery/research/continued-progress).
This report represents an examination of Reading Recovery pupil outcomes for the United Kingdom, reporting outcomes from England, Wales, Jersey and Guernsey. The report accounts for
all children served by Reading Recovery within the site during the 2017-18 school year. In addition, attention is given to implementation factors that may be supporting or hindering the success of the
intervention within the site. The information was collected as a part of the International Literacy Centre annual monitoring procedure. Further information about Reading Recovery is available; please visit http://ilc.ucl.ac.uk or email [email protected] .

Page | 8
Questions for evaluation
1. How many children were supported by the Reading Recovery teacher and which children were they?
a) Size of implementation b) Characteristics of the cohort
2. What were the programme outcomes for Reading Recovery children? a) Programme outcomes
b) Programme length
3. What were the literacy levels of children in the Reading Recovery programme?
a) Average scores at entry and exit b) Children discontinuing in different year groups
4. Where were Reading Recovery children placed in a register of Special Educational Need and
Disability (SEND) at the beginning of their programme, and following their programme?
5. What progress did children make after Reading Recovery?
a) Children who made accelerated progress (discontinued) b) Children who made progress (referred)
6. What were the results of National Assessments for Reading Recovery children? a) National assessments at entry and exit from Reading Recovery
b) Outcomes of the phonics screening check c) Key Stage 1 National Assessments d) Key Stage 2 National Assessments
7. What was the efficiency of the Reading Recovery implementation?
a) Experience b) Teacher responsibilities c) Days worked and missed
d) Outcomes
Page | 9
1: How many children were supported by the Reading Recovery teacher and which children were they? Reading Recovery is designed to meet the needs of the lowest attaining children in literacy. The expertise of the Reading Recovery teacher can also be utilised to support lighter touch interventions
for children with less complex literacy difficulties. Table 1.1 shows the number of children supported by the Reading Recovery teacher through Reading Recovery or other interventions.
a) Size of implementation
Table 1.1 - Number of Children Served, UCL Institute of Education, 2017-18. Programme / Intervention Name number
Reading Recovery 5519
BRP 1380
Fischer Family Trust Wave 3 430
Talking Partners 54
Early Literacy Support 4
Other 851
RR-led Intervention 370
Sw itch-on 22
Total 8630
SOURCE: International Literacy Centre: Annual Data Collection, 2017-18
b) Characteristics of the cohort
Year group
Children are normally identified for Reading Recovery between the ages of five years nine months and six years three months, after a full year of literacy tuition at school. Local conditions, e.g.
admission policies or national assessments, may influence the targeting of resources towards the first or second year (after reception) and account is taken of date of birth to ensure that summer
born children are not excluded. Gender
Children are identified for Reading Recovery by literacy levels in a series of assessments (Clay 2013) with the lowest attaining given the first priority. Nationally, a slightly higher proportion is
selected of boys than girls for Reading Recovery. This suggests that factors which affect boys’ literacy, causing them to be more likely to get into difficulties, emerge early.
Ethnicity
Data on children's ethnicity is based on the UK national census. These categories have changed
slightly in response to national demographic changes, for example to monitor support for increasing numbers of children from Eastern European backgrounds. First language
Approximately 5% of the entire primary school population speaks English as an additional
language. Among Reading Recovery children, this statistic varies considerably from place to place and the extent of their control of English language is also very variable.

Page | 10
Disadvantage (pupil premium or other disadvantage indicator)
Research has shown persistent links between economic deprivation and literacy difficulties. In
English schools, approximately 17%1 of children aged between 5 and 10 are known to be entitled to and claiming free school meals. In England, schools receive additional funding (currently £1,320 per
primary schools pupil)2 for children eligible for Pupil Premium. This is one of the means by which schools in England fund intervention. In the Republic of Ireland, schools are assessed for relative concentrations of social deprivation and ranked accordingly in order to target school support
funding under the DEIS (Delivering Equality of Opportunity in Schools) plan. Special cohort group
Certain groups of children have been shown to be vulnerable to academic underachievement, including children in the ethnic group Travellers, children of asylum seekers or refugees, and
'looked after' children (children in the care of the local authorities). Season of birth
Concerns have been expressed nationally about the lower attainment of children born in the summer, and that these children remain disadvantaged throughout their subsequent schooling.
For the purpose of this report, season has been designated in line with school terms:
Autumn: September to December inclusive
Spring: January to April inclusive
Summer: May to August inclusive
1 Source: DfE (2015) Schools, pupils and their characteristics: January 2015, pub June 2015
2 Source: DfE (2017) https://www.gov.uk/guidance/pupil-premium-information-for-schools-and-alternative-provision-
settings#funding-for-financial-year-2016-to-2017

Page | 11
Table 1.2 - Characteristics of children participating in Reading Recovery at entry to the programme: By programme completion, UCL Institute of Education, 2017-18. Description All Programmes Completed Programmes
number percent number percent
All Children 5519 100 3968 100
Year Group
Not recorded 8 0.1 4 0.1
Age 6-7 2006 36.3 1840 46.4
Age 7-8 73 1.3 67 1.7
Age 5-6 3432 62.2 2057 51.8
Programme Started
This year 4494 81.4 2986 75.3
Last year 989 17.9 951 24
Not Recorded 36 0.7 31 0.8
Gender
Boys 3125 56.6 2229 56.2
Girls 2394 43.4 1739 43.8
Poverty - pupil premium/other indicator
Yes 2771 50.2 1947 49.1
No 2538 46 1869 47.1
Not know n 210 3.8 152 3.8
First Language
English 4368 79.1 3095 78
Not English 1143 20.7 867 21.8
Not Recorded 8 0.1 6 0.2
Special Cohort Group
Asylum seeker or refugee child 21 0.4 17 0.4
'Looked after' child 63 1.1 46 1.2
No 5150 93.3 3717 93.7
Not Appropriate / Unknow n 48 0.9 26 0.7
Other special group 42 0.8 37 0.9
Special teaching unit 1 0 0 0
Traveller child 194 3.5 125 3.2
Ethnicity
White 4450 80.6 3160 79.6
White British 1781 32.3 1329 33.5
Irish 2081 37.7 1399 35.3
Eastern European 421 7.6 303 7.6
Any Other White background 167 3 129 3.3
Mixed 248 4.5 176 4.4
White and Black Caribbean 92 1.7 70 1.8
White and Black African 43 0.8 29 0.7
White and Asian 36 0.7 26 0.7
Any Other Mixed background 77 1.4 51 1.3
Asian 408 7.4 318 8
Indian 72 1.3 53 1.3
Pakistani 113 2 89 2.2
Bangladeshi 111 2 93 2.3
Any Other Asian background 112 2 83 2.1
Black 293 5.3 220 5.5
Caribbean 43 0.8 34 0.9
African 202 3.7 150 3.8
Any Other Black background 48 0.9 36 0.9
Chinese 21 0.4 16 0.4
Other Ethnic Group 70 1.3 58 1.5
Not Appropriate / Unknown 29 0.5 20 0.5

Page | 12
Table 1.2 - Characteristics of children participating in Reading Recovery at entry to the programme: By programme completion, UCL Institute of Education, 2017-18. Description All Programmes Completed Programmes
number percent number percent
Season of Birth
Autumn 1908 34.6 1432 36.1
Spring 1836 33.3 1257 31.7
Summer 1773 32.1 1279 32.2
Not Recorded 2 0 0 0
NOTE: “All Programmes” includes every child served by Reading Recovery in 2017-18. “Completed Programmes” are only those children w hose programmes w ere actually completed during 2017-18.
SOURCE: International Literacy Centre: Annual Data Collection, 2017-18
2: What were the programme outcomes for Reading Recovery children?
a) Programme outcomes
There were five possible outcomes for children who received Reading Recovery. Every child who received Reading Recovery within the year is recorded here.
1. Accelerated Progress (Discontinued): These children have made sufficient progress in literacy learning, within the time available, to catch up with the average band for their class, and have
been judged to be likely to continue learning at the same rate as their peers, without the need for further special support.
2. Progress (Referred): The children have made progress, but have not reached the average band
in literacy and will continue to need additional support. 3. Ongoing: These children started the programme late in the school year, and have not yet
completed it, but will do so in the new school year. 4. Left: These children left the school part way through their programme. 5. Incomplete: These children were part way through their series of lessons when the programme
had to be suspended (e.g., because of funding withdrawal, the teacher left etc.)
Table 2.1 - Programme outcomes for children receiving Reading Recovery: By programme
completion, UCL Institute of Education, 2017-18. Outcome All Programmes Completed Programmes
Number Percent Number Percent
Accelerated progress (discontinued) 3211 58.2 3211 80.9
Progress (referred) 757 13.7 757 19.1
Ongoing 1290 23.4 0 0
Incomplete 194 3.5 0 0
Left 67 1.2 0 0
NOTE: “All Programmes” includes every child entering Reading Recovery in 2017-18. “Completed Programmes” are only those children w hose programmes w ere actually completed during 2017-18. Children w ho did not complete in 2017-18 are expected to do so in 2018-19.
SOURCE: International Literacy Centre: Annual Data Collection, 2017-18

Page | 13
b) Disaggregated outcomes
Table 2.2 - Background characteristics, programme participation and outcomes of children who completed the programme, UCL Institute of Education, 2017-18.
Characteristic Book Level
No. of
children
% No. of
Lessons
Entry Exit
Gain
Exit to 3
Months Gain
Exit to 6
Months Gain
% Accelerated
progress

Page | 14
All Children 3968 100% 72.8 2.1 14.1 1.1 2.8 80.9%
Year Group
Age 5-6 2057 51.8% 70.6 1.6 13.6 1.1 3.2 80.1%
Age 6-7 1840 46.4% 75.7 2.6 14.6 1.2 2.6 81.4%
Age 7-8 67 1.7% 64.4 3.7 14.5 1.3 3.2 92.5%
Not know n 4 0.1% 54.8 5.0 11.8 -1.0 0.0 100%
Gender
Female 1739 43.8% 72.3 2.3 14.1 1.1 2.7 83.1%
Male 2229 56.2% 73.2 2.0 14.1 1.2 2.8 79.2%
First Language
English 3095 78% 73.5 2.1 14.0 1.1 2.6 80.5%
Other 867 21.8% 70.4 2.2 14.3 1.3 3.2 82.7%
Not know n 6 0.2% 77.0 1.3 15.2 4.0 4.0 66.7%
Poverty - Pupil premium/other poverty indicator
Yes 1947 49.1% 73.9 1.9 14.1 1.1 2.7 79.9%
No 1869 47.1% 72.1 2.2 14.1 1.1 2.8 81.8%
Not know n 152 3.8% 68.1 3.4 13.4 1.5 3.3 83.6%
Special Cohort Group
No 3717 93.7% 72.5 2.2 14.1 1.1 2.8 81.4%
'Looked after' child 46 1.2% 75.7 2.0 14.1 1.2 3.1 82.6%
Traveller child 125 3.2% 78.0 1.3 12.9 1.3 2.3 66.4%
Asylum seeker or refugee child 17 0.4% 72.9 1.7 13.8 0.7 0.0 82.4%
Other special group 37 0.9% 78.8 1.9 13.6 0.6 2.9 75.7%
Not Appropriate / Unknow n 26 0.7% 74.1 2.3 14.5 0.6 -0.8 88.5%
Season of Birth
Autumn 1432 36.1% 73.9 1.8 14.0 1.3 3.0 80.7%
Spring 1257 31.7% 72.1 2.2 14.3 1.1 2.6 82.3%
Summer 1279 32.2% 72.4 2.4 14.0 1.0 2.8 79.9%
Ethnicity
White 3160 79.6% 73.4 2.1 14.0 1.1 2.7 80.1%
White British 1329 33.5% 71.0 2.0 13.5 1.1 2.7 75.8%
Irish 1399 35.3% 76.2 2.2 14.5 1.1 2.6 83.5%
Eastern European 303 7.6% 72.1 2.1 14.6 1.4 3.2 81.5%
Any Other White background 129 3.3% 69.4 2.8 13.4 1.1 4.0 84.5%
Mixed 176 4.4% 72.1 1.9 13.9 1.2 2.7 80.1%
White and Black Caribbean 70 1.8% 70.9 1.5 13.8 1.1 2.9 77.1%
White and Black African 29 0.7% 75.4 2.1 13.6 0.7 2.0 75.9%
White and Asian 26 0.7% 68.9 2.6 14.7 1.6 4.0 92.3%
Any Other Mixed background 51 1.3% 73.5 2.1 13.6 1.2 2.1 80.4%
Asian 318 8% 69.7 2.0 14.4 1.1 2.9 84.9%
Indian 53 1.3% 68.7 2.0 13.3 0.5 2.3 77.4%
Pakistani 89 2.2% 71.8 1.8 14.3 0.7 2.6 78.7%
Bangladeshi 93 2.3% 67.0 2.0 15.1 1.3 3.1 93.5%
Any Other Asian background 83 2.1% 71.2 2.4 14.3 1.9 3.3 86.7%
Black 220 5.5% 70.8 2.3 14.5 1.2 2.8 85%
Caribbean 34 0.9% 69.5 2.8 14.1 1.2 1.8 91.2%
African 150 3.8% 72.0 2.3 14.4 1.2 3.1 82.7%
Any Other Black background 36 0.9% 67.0 2.1 15.3 1.1 2.7 88.9%
Chinese 16 0.4% 66.1 1.8 14.9 2.0 5.5 93.8%
Other Ethnic Group 58 1.5% 71.3 1.8 14.5 1.5 3.0 82.8%
Not Appropriate / Unknown 20 0.5% 75.4 1.9 15.3 0.7 3.7 90%
SOURCE: International Literacy Centre: Annual Data Collection, 2017-18

Page | 15
c) Length of programmes
Reading Recovery is a short term intervention, and there is an imperative for teachers to work
briskly. There is no prescribed length to children’s programmes although economics dictate that programmes should be as short as possible, commensurate with robust outcomes. Teachers tend to take a little longer to achieve their goals during the year of training and children
who start with very little in place may take longer to get under way. Table 2.3 - Weeks and lessons of children completing Reading Recovery programmes: By programme outcome, UCL Institute of Education, 2017-18. Outcome/Time Total pupils Mean SD Minimum Maximum
Accelerated progress (discontinued)
Weeks 3196 18.7 5.3 1 35
Lessons 3201 71.5 19.5 1 152
Lost lessons 3196 22 15.5 -32 125
Progress (referred)
Weeks 751 20.7 4.9 5 35
Lessons 752 78.5 19 18 150
Lost lessons 751 25.1 17.7 -4 120
NOTE: “Lost lessons” is the difference between the ideal number of lessons (total w eeks × 5 lessons per w eek) and the actual number of lessons. NOTE: This table excludes children taught by Teacher Leaders
SOURCE: International Literacy Centre: Annual Data Collection, 2017-18
3: What were the literacy levels of children in the Reading Recovery programme? Children selected for Reading Recovery are the lowest achieving in their class on six measures of
early literacy which together comprise the Observation Survey (Clay, 2002). These measures are Book Level (captured by running record of text reading), Letter Identification, Concepts about Print,
Word Reading Test, Writing Vocabulary and Hearing and Recording Sounds in Words. In addition, the British Abilities Scale Word Reading assessment is administered to provide an external standardised assessment.
The programme is discontinued when children are judged to have an efficient reading and writing
process in place and to be operating within the average band for their class and age. Children who do not achieve the accelerated progress required for the programme to be discontinued are referred back to the school for longer-term support.
a) Average scores at entry and exit
Table 3.1 - Scores on Observation Survey tasks of children with completed Reading Recovery programmes: At entry to and exit from the programme, UCL Institute of Education, 2017-18.
Assessment
Total
Book
Level
Letter
Identification
Concepts
about Print
Word
Test
Writing
Vocabulary
HRSIW
BAS
Reading Age
PhAb
Standard Score Point Pupils Mean SD Mean SD Mean SD Mean SD Mean SD Mean SD Mean Mean Entry 3968 2.1 2.6 43.6 9.7 12.1 3.8 9.2 6.2 11.9 9.8 23.3 9.8 5:4 92
At
discontinuing (accelerated progress)
3211 17.7 2.6 52.7 2.4 20.2 2.7 22 1.7 40.8 15.6 35.5 2.4 6:4 104
At referral (progress)
757 10.1 3.6 49.1 6.7 17 3.3 17.3 4.9 25 12.3 30.9 6.5 5:10 96
All completed programmes
3968 16.2 4.1 52 3.9 19.6 3.1 21.1 3.2 37.8 16.3 34.6 4 6:4 102
NOTE: “HRSIW” is the Hearing and Recording Sounds in Words task.
NOTE: PhAb is optional and not required data SOURCE: International Literacy Centre: Annual Data Collection, 2017-18
Page | 16
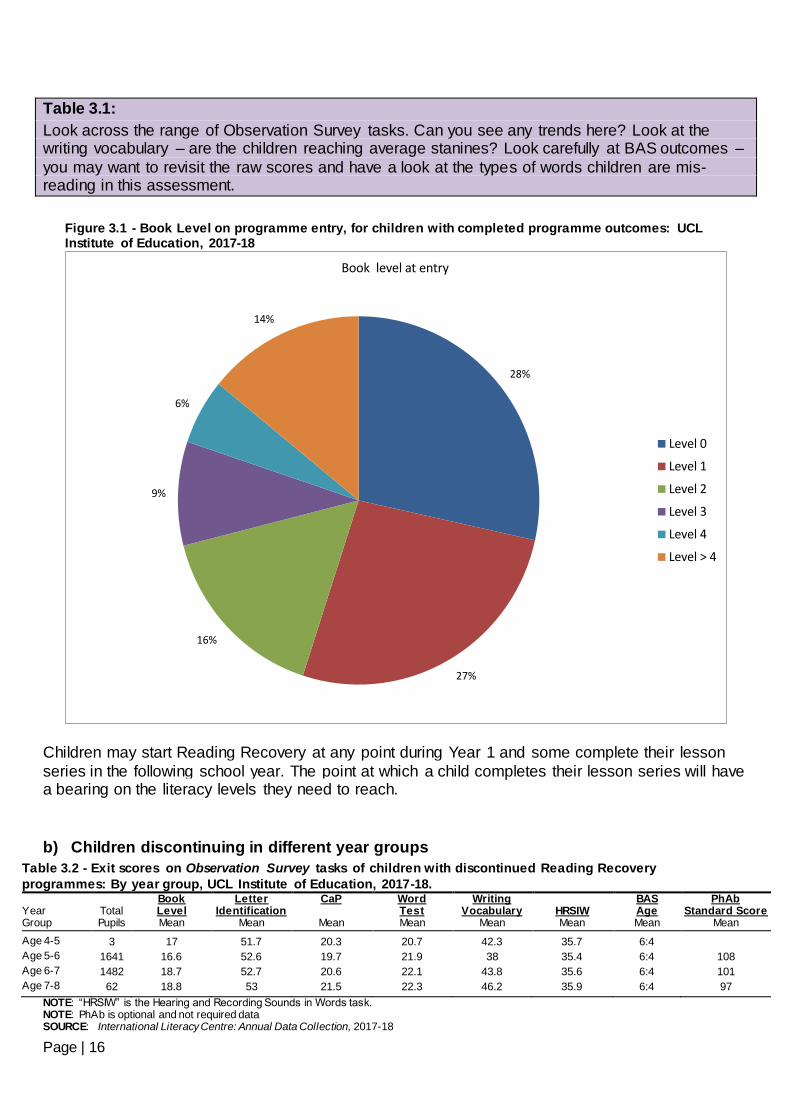
Table 3.1:
Look across the range of Observation Survey tasks. Can you see any trends here? Look at the writing vocabulary – are the children reaching average stanines? Look carefully at BAS outcomes –
you may want to revisit the raw scores and have a look at the types of words children are mis-reading in this assessment.
Figure 3.1 - Book Level on programme entry, for children with completed programme outcomes: UCL Institute of Education, 2017-18
Children may start Reading Recovery at any point during Year 1 and some complete their lesson
series in the following school year. The point at which a child completes their lesson series will have a bearing on the literacy levels they need to reach.
b) Children discontinuing in different year groups
Table 3.2 - Exit scores on Observation Survey tasks of children with discontinued Reading Recovery
programmes: By year group, UCL Institute of Education, 2017-18.
Year
Total
Book Level
Letter Identification
CaP Word Test
Writing Vocabulary
HRSIW
BAS Age
PhAb Standard Score
Group Pupils Mean Mean Mean Mean Mean Mean Mean Mean
Age 4-5 3 17 51.7 20.3 20.7 42.3 35.7 6:4
Age 5-6 1641 16.6 52.6 19.7 21.9 38 35.4 6:4 108
Age 6-7 1482 18.7 52.7 20.6 22.1 43.8 35.6 6:4 101
Age 7-8 62 18.8 53 21.5 22.3 46.2 35.9 6:4 97
NOTE: “HRSIW” is the Hearing and Recording Sounds in Words task. NOTE: PhAb is optional and not required data SOURCE: International Literacy Centre: Annual Data Collection, 2017-18
28%
27%
16%
9%
6%
14%
Book level at entry
Level 0
Level 1
Level 2
Level 3
Level 4
Level > 4

Page | 17
5: What progress did children make after Reading Recovery? After the completion of their programme, children are carefully monitored as they adjust to the
withdrawal of daily intensive support. Some children may find their progress temporarily checked as they make this adjustment.
a) Accelerated progress (discontinued)
Table 5.1 - Follow-up scores on Observation Survey tasks of children with discontinued Reading Recovery
programmes: UCL Institute of Education, 2017-18. Assessment Total Book Level Writing Vocabulary BAS Reading Age PhAb
Point Pupils Mean SD Mean SD Mean Mean
At discontinuing 6145 17.6 2.5 40.1 14.7 6:4 105.9
3 month follow up 4087 18.8 3.2 44.4 15.9 6:7 107
6 month follow up 2771 20.4 3.4 49.3 17.3 6:10 106.7
NOTE: This group includes all children w ho had follow -up only testing in 2017-18. (i.e. those w ho completed their programmes in 2016-17 and had testing this academic year, and those w ho completed early this year, allow ing for follow -up testing to also take place this year). NOTE: PhAb is optional and not required data
SOURCE: International Literacy Centre: Annual Data Collection, 2017-18
b) Progress (referred)
Table 5.2 - Follow-up scores on Observation Survey tasks of children referred after Reading Recovery programmes: UCL Institute of Education, 2017-18 Assessment Total Book Level Writing Vocabulary BAS Reading Age PhAb
Point Pupils Mean SD Mean SD Mean Mean
At referral 1367 10.1 3.7 24.6 11.9 5:10 97.3
3 month follow up 806 10.5 4.2 27.3 13.2 5:10 97.6
6 month follow up 553 11.8 4.8 30 14.8 6:1 99.2
NOTE: This group includes all children w ho had follow -up only testing in 2017-18. (i.e. those w ho completed their programmes in 2016-17 and had testing this academic year, and those w ho completed early this year, allow ing for follow -up testing to also take place this year).
NOTE: PhAb is optional and not required data SOURCE: International Literacy Centre: Annual Data Collection, 2017-18

Page | 18
6: What were the results of National Assessments for Reading Recovery children?
a) National assessments at entry to and exit from Reading Recovery
As well as programme entry scores and outcomes, Reading Recovery teachers record details of
ongoing school-based data collected by the class teacher. These data afford Reading Recovery teachers opportunity to compare how the children they support are achieving relative to national age-related expectations and alongside their peers.
Table 6.1 - Teacher assessments at entry to and exit from Reading Recovery for all completed programmes:
UCL Institute of Education, 2017-18. Assessment point At entry At exit
reading writing reading writing
National Assessment Level number percent number percent t number percent number percent
Accelerated progress (discontinued)
Working below expected standard 1020 81.8% 1000 80.2% 47 3.8% 96 7.8%
Working tow ards expected standard 210 16.8% 223 17.9% 467 38.2% 703 57.4%
Working at expected standard 17 1.4% 24 1.9% 689 56.3% 414 33.8%
Working at greater depth w ithin expected standard 0 0.0% 0 0.0% 21 1.7% 11 0.9%
All completed programmes
Working below expected standard 1360 84.5% 1339 83.2% 200 12.7% 268 17%
Working tow ards expected standard 232 14.4% 243 15.1% 653 41.4% 872 55.3%
Working at expected standard 18 1.1% 27 1.7% 703 44.6% 426 27%
Working at greater depth w ithin expected standard 0 0.0% 0 0.0% 21 1.3% 11 0.7%
SOURCE: International Literacy Centre: Annual Data Collection, 2017-18
b) Outcomes of the phonics screening check
The phonics screening check in England is designed as a short, light-tough assessment to confirm whether individual children have learnt phonic decoding to a national agreed standard. It aims to identify children who need extra help in working with phonics. The screening check is for all Year 1
pupils in maintained schools, academies and Free Schools – and children in Year 2 who previously did not meet the standard of the check in Year 1.
Table 6.2 - Y1 and Y2 scores and percent passed on phonics check, UCL Institute of Education, 2017-18.
Y1 Children Phonics check in current year Number Score %Passed
All programmes 1596 28.3 59.7%
Discontinued 925 33.4 81.3%
Not yet complete 463 21.9 32.8%
Y2 Children Phonics check retest Number Score % passed
Still in RR at time of test 53 30.5 62.3%
Discontinued in Y2 267 33.4 78.7%
Discontinued in Y1 and failed check f irst time 176 33.8 84.1%

Page | 19
c) Key Stage 1 National Assessments
Children in England undergo continuing teacher assessment reading and writing during their time in Key Stage 1. At the end of their second year of formal schooling (age 7) the assessments are
collated and reported locally and nationally. Teachers follow a framework for assessment (currently an interim framework) which outlines the standards children are expected to meet by age 7. Children identified for Reading Recovery are the lowest achieving in their class, and would be not
be predicted to achieve at the expected standard without intervention.
Table 6.3 shows the impact for all children who received the programme, including those who did not achieve the goals. Table 6.3 – End of Key Stage 1 Outcomes of National Assessment for Reading Recovery children: By programme outcome, UCL Institute of Education, 2017-18. Programme Outcome/ Key Stage 1 Reading Key Stage 1 Writing
National Assessment Level number percent number percent
Accelerated progress (discontinued)
Working below expected standard 64 4.5% 102 7.2%
Working tow ards expected standard 530 37.5% 709 50.2%
Working at expected standard 764 54.1% 581 41.1%
Working at greater depth w ithin expected standard 54 3.8% 20 1.4%
All completed programmes
Working below expected standard 227 12.9% 278 15.8%
Working tow ards expected standard 695 39.5% 868 49.3%
Working at expected standard 785 44.6% 595 33.8%
Working at greater depth w ithin expected standard 54 3.1% 20 1.1%
SOURCE: International Literacy Centre: Annual Data Collection, 2017-18.

Page | 20
Figure 6.3A - End of Key Stage 1 National Curriculum Assessments Reading levels of
Reading Recovery children with completed Reading Recovery programmes: UCL Institute of Education, 2017-18.
13%
39%
45%
3%
working below expected standard
working towards the expectedstandard
working at the expected standard
working at a greater depth withinthe expected standard

Page | 21
Figure 6.3B - End of Key Stage 1 National Curriculum Assessments Writing levels of Reading Recovery children with completed Reading Recovery programmes: UCL Institute
of Education, 2017-18.
16%
49%
34%
1%
working below expected standard
working towards the expectedstandard
working at the expected standard
working at a greater depth withinthe expected standard
Page | 22
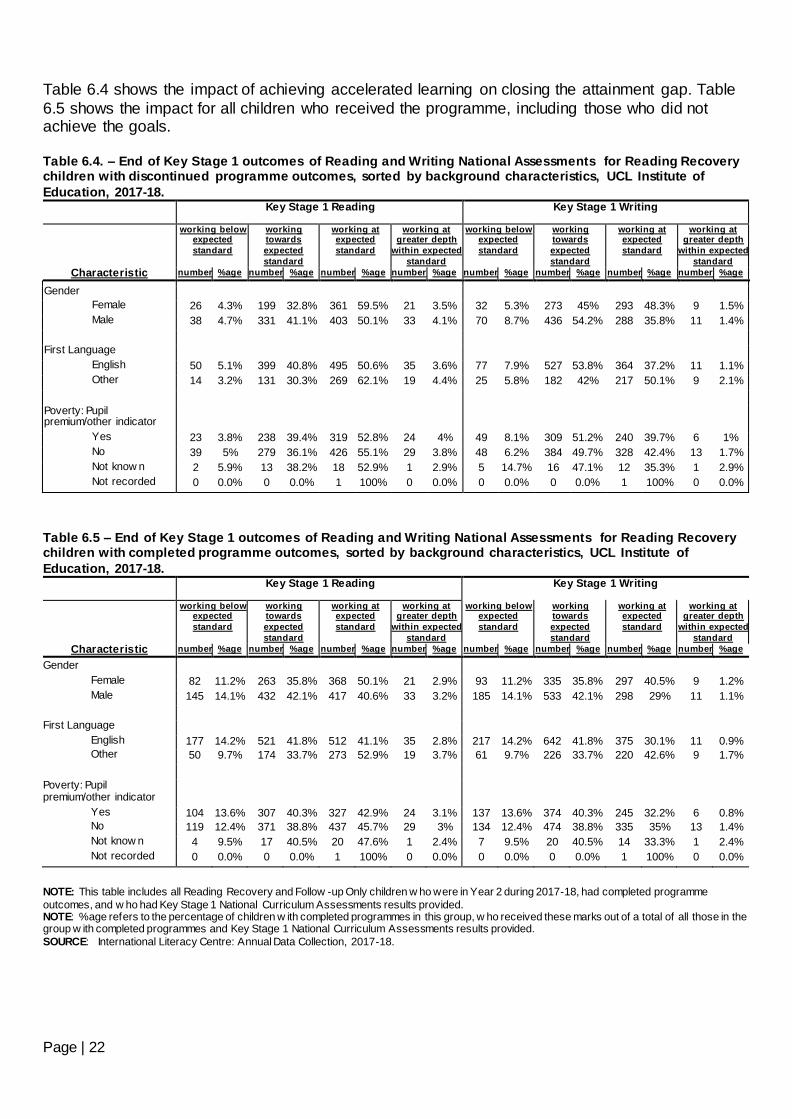
Table 6.4 shows the impact of achieving accelerated learning on closing the attainment gap. Table
6.5 shows the impact for all children who received the programme, including those who did not achieve the goals.
Table 6.4. – End of Key Stage 1 outcomes of Reading and Writing National Assessments for Reading Recovery children with discontinued programme outcomes, sorted by background characteristics, UCL Institute of
Education, 2017-18.
Key Stage 1 Reading Key Stage 1 Writing
working below expected
standard
working towards
expected
standard
working at expected
standard
working at greater depth
within expected
standard
working below expected
standard
working towards
expected
standard
working at expected
standard
working at greater depth
within expected
standard
Characteristic number %age number %age number %age number %age number %age number %age number %age number %age
Gender
Female 26 4.3% 199 32.8% 361 59.5% 21 3.5% 32 5.3% 273 45% 293 48.3% 9 1.5%
Male 38 4.7% 331 41.1% 403 50.1% 33 4.1% 70 8.7% 436 54.2% 288 35.8% 11 1.4%
First Language
English 50 5.1% 399 40.8% 495 50.6% 35 3.6% 77 7.9% 527 53.8% 364 37.2% 11 1.1%
Other 14 3.2% 131 30.3% 269 62.1% 19 4.4% 25 5.8% 182 42% 217 50.1% 9 2.1%
Poverty: Pupil premium/other indicator
Yes 23 3.8% 238 39.4% 319 52.8% 24 4% 49 8.1% 309 51.2% 240 39.7% 6 1%
No 39 5% 279 36.1% 426 55.1% 29 3.8% 48 6.2% 384 49.7% 328 42.4% 13 1.7%
Not know n 2 5.9% 13 38.2% 18 52.9% 1 2.9% 5 14.7% 16 47.1% 12 35.3% 1 2.9%
Not recorded 0 0.0% 0 0.0% 1 100% 0 0.0% 0 0.0% 0 0.0% 1 100% 0 0.0%
Table 6.5 – End of Key Stage 1 outcomes of Reading and Writing National Assessments for Reading Recovery children with completed programme outcomes, sorted by background characteristics, UCL Institute of
Education, 2017-18.
Key Stage 1 Reading Key Stage 1 Writing
working below expected
standard
working towards
expected
standard
working at expected
standard
working at greater depth
within expected
standard
working below expected
standard
working towards
expected
standard
working at expected
standard
working at greater depth
within expected
standard
Characteristic number %age number %age number %age number %age number %age number %age number %age number %age
Gender
Female 82 11.2% 263 35.8% 368 50.1% 21 2.9% 93 11.2% 335 35.8% 297 40.5% 9 1.2%
Male 145 14.1% 432 42.1% 417 40.6% 33 3.2% 185 14.1% 533 42.1% 298 29% 11 1.1%
First Language
English 177 14.2% 521 41.8% 512 41.1% 35 2.8% 217 14.2% 642 41.8% 375 30.1% 11 0.9%
Other 50 9.7% 174 33.7% 273 52.9% 19 3.7% 61 9.7% 226 33.7% 220 42.6% 9 1.7%
Poverty: Pupil premium/other indicator
Yes 104 13.6% 307 40.3% 327 42.9% 24 3.1% 137 13.6% 374 40.3% 245 32.2% 6 0.8%
No 119 12.4% 371 38.8% 437 45.7% 29 3% 134 12.4% 474 38.8% 335 35% 13 1.4%
Not know n 4 9.5% 17 40.5% 20 47.6% 1 2.4% 7 9.5% 20 40.5% 14 33.3% 1 2.4%
Not recorded 0 0.0% 0 0.0% 1 100% 0 0.0% 0 0.0% 0 0.0% 1 100% 0 0.0%
NOTE: This table includes all Reading Recovery and Follow -up Only children w ho were in Year 2 during 2017-18, had completed programme
outcomes, and w ho had Key Stage 1 National Curriculum Assessments results provided. NOTE: %age refers to the percentage of children w ith completed programmes in this group, w ho received these marks out of a total of all those in the group w ith completed programmes and Key Stage 1 National Curriculum Assessments results provided.
SOURCE: International Literacy Centre: Annual Data Collection, 2017-18.
Page | 23
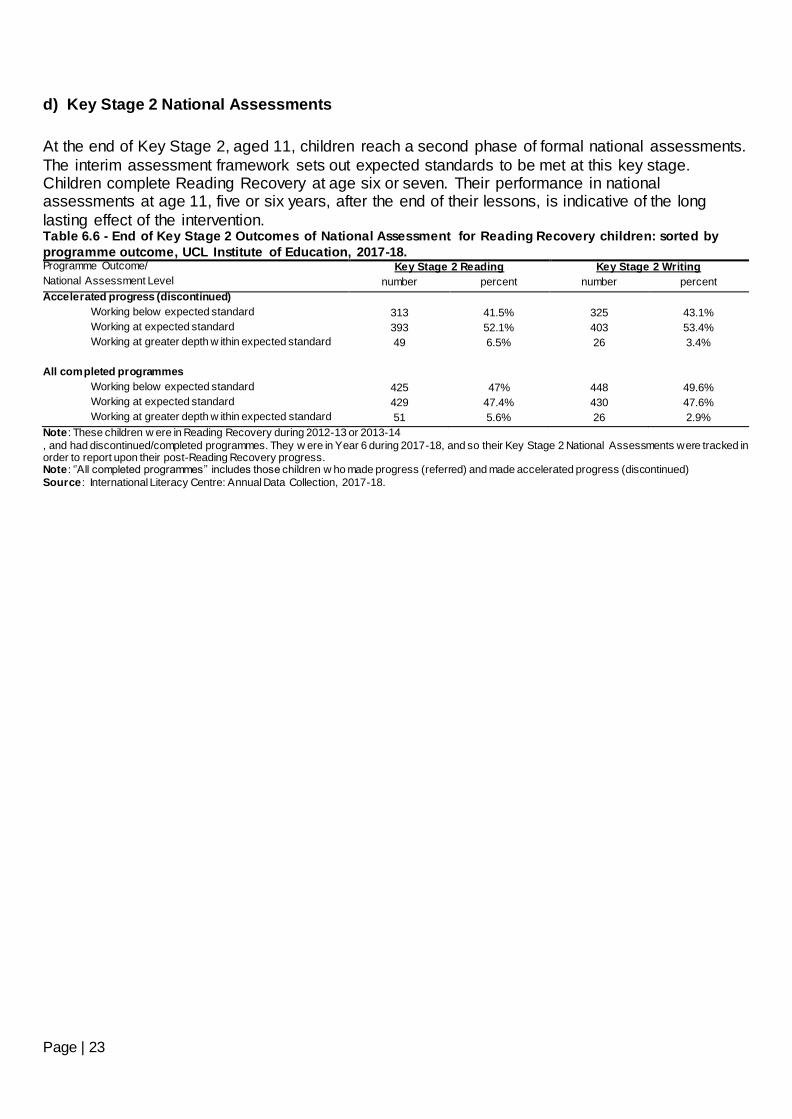
d) Key Stage 2 National Assessments
At the end of Key Stage 2, aged 11, children reach a second phase of formal national assessments.
The interim assessment framework sets out expected standards to be met at this key stage. Children complete Reading Recovery at age six or seven. Their performance in national assessments at age 11, five or six years, after the end of their lessons, is indicative of the long
lasting effect of the intervention. Table 6.6 - End of Key Stage 2 Outcomes of National Assessment for Reading Recovery children: sorted by
programme outcome, UCL Institute of Education, 2017-18. Programme Outcome/ Key Stage 2 Reading Key Stage 2 Writing
National Assessment Level number percent number percent
Accelerated progress (discontinued)
Working below expected standard 313 41.5% 325 43.1%
Working at expected standard 393 52.1% 403 53.4%
Working at greater depth w ithin expected standard 49 6.5% 26 3.4%
All completed programmes
Working below expected standard 425 47% 448 49.6%
Working at expected standard 429 47.4% 430 47.6%
Working at greater depth w ithin expected standard 51 5.6% 26 2.9%
Note : These children w ere in Reading Recovery during 2012-13 or 2013-14 , and had discontinued/completed programmes. They w ere in Year 6 during 2017-18, and so their Key Stage 2 National Assessments were tracked in order to report upon their post-Reading Recovery progress. Note : ‘’All completed programmes’’ includes those children w ho made progress (referred) and made accelerated progress (discontinued)
Source : International Literacy Centre: Annual Data Collection, 2017-18.

Page | 24
Figure 6.6A - End of Key Stage 2 National Curriculum Assessments Reading levels of
Reading Recovery children with completed Reading Recovery programmes: UCL Institute of Education, 2017-18.
46%
48%
6% 0%
working below expected standard
working at the expected standard
working at a greater depth withinthe expected standard
working at a greater depth withinthe expected standard

Page | 25
Figure 6.6B – End of Key Stage 2 National Curriculum Assessments Writing levels of Reading Recovery children with completed Reading Recovery programmes: UCL Institute
of Education, 2017-18.
49%
48%
3% 0%
working below expected standard
working at the expected standard
working at a greater depth withinthe expected standard
working at a greater depth withinthe expected standard

Page | 26
Table 6.7 and Table 6.8 show the power of Reading Recovery to close the attainment gap between
particular cohort groups, notable boys and children in poverty. Table 6.7 shows the impact of all children who achieved accelerated progress at five or six years. Table 6.8 shows the impact on the
cohort as a whole, including those who did not reach age related expectations at the end of the programme. Table 6.7. - End of Key Stage 2 outcomes of Reading and Writing National Assessments for Reading Recovery children with discontinued programme outcomes, sorted by background characteristics, UCL Institute of Education, 2017-18.
Key Stage 2 Reading Key Stage 2 Writing
working below
expected standard
working at
expected standard
working at greater
depth within expected standard
working below
expected standard
working at
expected standard
working at greater
depth within expected standard
Characteristic number %age number %age number %age number %age number %age number %age
Gender
Female 122 39.6% 166 53.9% 20 6.5% 118 38.4% 172 56% 17 5.5%
Male 191 42.7% 227 50.8% 29 6.5% 207 46.3% 231 51.7% 9 2%
First Language
English 247 43% 292 50.8% 36 6.3% 275 47.8% 284 49.4% 16 2.8%
Other 66 36.7% 101 56.1% 13 7.2% 50 27.9% 119 66.5% 10 5.6%
Poverty: Pupil premium/other indicator
Yes 133 43.5% 158 51.6% 15 4.9% 141 46.1% 158 51.6% 7 2.3%
No 146 39.2% 197 53% 29 7.8% 150 40.4% 205 55.3% 16 4.3%
Not know n 30 44.8% 34 50.7% 3 4.5% 30 44.8% 35 52.2% 2 3%
Not recorded 4 40% 4 40% 2 20% 4 40% 5 50% 1 10%
Note : These children w ere in Reading Recovery during 2012-13 or 2013-14 , and had discontinued/completed programmes. They w ere in Year 6 during 2017-18, and so their Key Stage 2 National Assessments were tracked in
order to report upon their post-Reading Recovery progress. Note : ‘’All completed programmes’’ includes those children w ho made progress (referred) and made accelerated progress (discontinued) Source : International Literacy Centre: Annual Data Collection, 2017-18.
Table 6.8. – End of Key Stage 2 outcomes of Reading and Writing National Assessment s for Reading Recovery children with completed programme outcomes, sorted by background characteristics, UCL Institute of
Education, 2017-18.
Key Stage 2 Reading Key Stage 2 Writing
working below expected standard
working at expected standard
working at greater depth within
expected standard
working below expected standard
working at expected standard
working at greater depth within
expected standard Characteristic number %age number %age number %age number %age number %age number %age
Gender
Female 160 44.4% 179 49.7% 21 5.8% 157 43.7% 185 51.5% 17 4.7%
Male 265 48.6% 250 45.9% 30 5.5% 291 53.4% 245 45% 9 1.7%
First Language
English 340 48.5% 323 46.1% 38 5.4% 379 54.1% 306 43.7% 16 2.3%
Other 85 41.7% 106 52% 13 6.4% 69 34% 124 61.1% 10 4.9%
Poverty: Pupil premium/other indicator
Yes 190 50% 174 45.8% 16 4.2% 203 53.4% 170 44.7% 7 1.8%
No 185 43.4% 212 49.8% 29 6.8% 191 44.9% 218 51.3% 16 3.8%
Not know n 44 51.8% 38 44.7% 3 3.5% 47 55.3% 36 42.4% 2 2.4%
Not recorded 6 42.9% 5 35.7% 3 21.4% 7 50% 6 42.9% 1 7.1%
Note : These children w ere in Reading Recovery during 2012-13 or 2013-14 , and had discontinued/completed programmes. They w ere in Year 6 during 2017-18, and so their Key Stage 2 National Assessments were tracked in order to report upon their post-Reading Recovery progress.
Note : ‘’All completed programmes’’ includes those children w ho made progress (referred) and made accelerated progress (discontinued) Source : International Literacy Centre: Annual Data Collection, 2017-18.

Page | 27
7: What was the efficiency of the Reading Recovery implementation? The training course for Reading Recovery teachers is one year long and is a part time, accredited professional development (PD) programme. Over the course of the year, already experienced
teachers gradually learn the complex techniques, fine grained observation and sound professional judgment required to accelerate the learning of the most difficult to teach children. During this time the teachers will be teaching children in Reading Recovery, concurrent with attending PD sessions
taught by a qualified teacher leader. After this initial year, Reading Recovery teachers continue to participate in ongoing PD under the support and guidance of their teacher leader, in order to
maintain their accredited status.
a) Experience
Table 7.1 - Experience of Reading Recovery teachers: UCL Institute of Education, 2017-18. Years of experience number percent
In training this year 130 15.7
2-3 years after training 169 20.4
4-5 years after training 139 16.8
More than f ive years 390 47.1
SOURCE: International Literacy Centre: Annual Data Collection, 2017-18
b) Teacher responsibilities
Trained Reading Recovery teachers can be a valuable professional resource in schools, able to
provide advice and guidance to colleagues for the support of children who do not receive Reading Recovery. Those who combine Reading Recovery with class teaching are often able to demonstrate the application of Reading Recovery principles in the classroom. However, the
demands made upon a Reading Recovery teacher’s time can interrupt daily lessons and undermine the effectiveness of the intervention. Part time teachers, on the other hand, whose sole
responsibility is Reading Recovery, can risk being marginalised, and their potential contribution to wider school standards, can be lost. Table 7.2 - Days taught and days missed by Reading Recovery teachers: By teacher role, UCL Institute of
Education, 2017-18. Total Days taught Days missed
Training role Teachers Mean SD Mean SD
RR Teacher Only 150 172.4 24.6 9.6 12.8
Class Teacher + RR 37 156.4 34.8 22.8 17.2
RR + Support 619 156.6 29.4 14.9 18.7
Other 22 149.1 45 25.9 21.7
NOTE: This table excludes teacher leaders. NOTE: The difference in the total number of teachers is due to some teachers failing to enter data on their teacher role, or on days taught and
missed. NOTE: ‘Other’ teachers are those w ith additional responsibilities, such as deputy head teachers. SOURCE: International Literacy Centre: Annual Data Collection, 2017-18
Page | 28
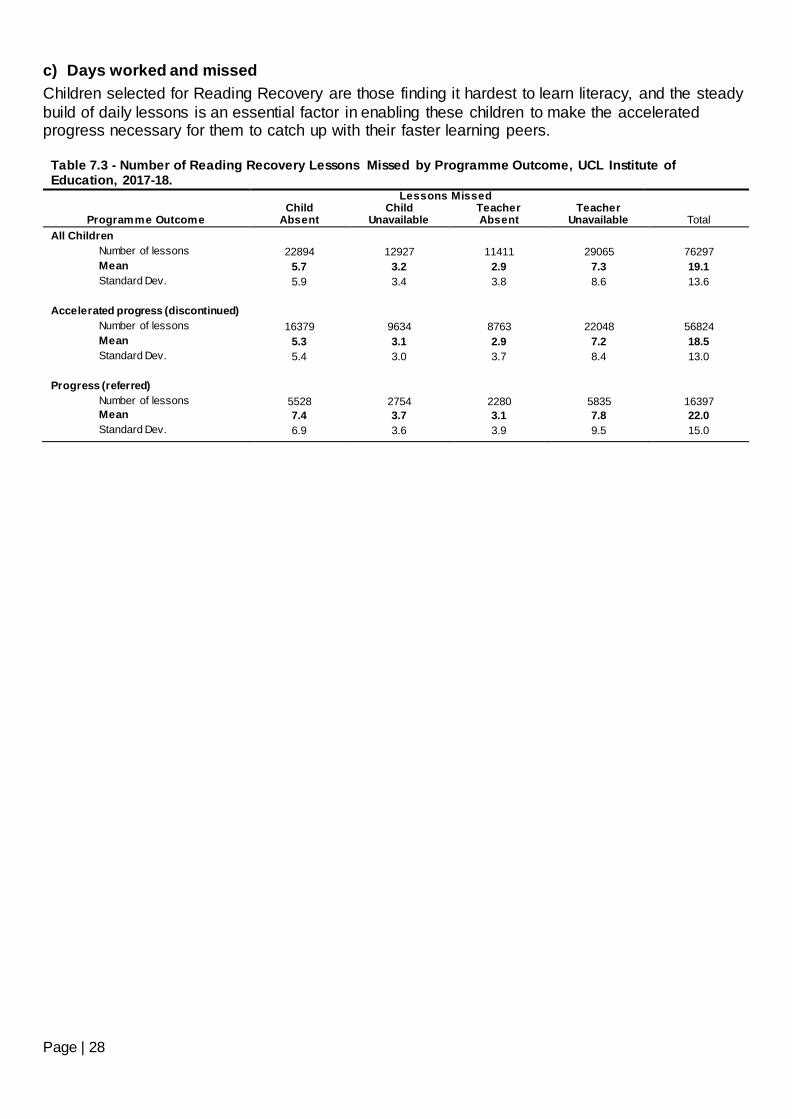
c) Days worked and missed
Children selected for Reading Recovery are those finding it hardest to learn literacy, and the steady
build of daily lessons is an essential factor in enabling these children to make the accelerated progress necessary for them to catch up with their faster learning peers.
Table 7.3 - Number of Reading Recovery Lessons Missed by Programme Outcome, UCL Institute of Education, 2017-18.
Lessons Missed
Programme Outcome Child
Absent Child
Unavailable Teacher Absent
Teacher Unavailable Total
All Children
Number of lessons 22894 12927 11411 29065 76297
Mean 5.7 3.2 2.9 7.3 19.1
Standard Dev. 5.9 3.4 3.8 8.6 13.6
Accelerated progress (discontinued)
Number of lessons 16379 9634 8763 22048 56824
Mean 5.3 3.1 2.9 7.2 18.5
Standard Dev. 5.4 3.0 3.7 8.4 13.0
Progress (referred)
Number of lessons 5528 2754 2280 5835 16397
Mean 7.4 3.7 3.1 7.8 22.0
Standard Dev. 6.9 3.6 3.9 9.5 15.0

Page | 29
d) Outcomes
Table 7.4 - Pupils served and programme lengths: By teacher training status, UCL Institute of Education, 2017-
18. Teacher training status/ Pupils Served Programme Length
Programme outcome number percent Mean SD
Teachers in training
Accelerated progress (discontinued) 419 77.4 20.0 5.4
Progress (referred) 122 22.6 22.7 5.1
Experienced teachers
Accelerated progress (discontinued) 2788 81.4 18.5 5.2
Progress (referred) 635 18.6 20.3 4.7
SOURCE: International Literacy Centre: Annual Data Collection, 2017-18
Reading Recovery is a short-term intervention, and there is an imperative for teachers to work
briskly. There is no set length to children’s programmes; teachers tend to take a little longer to achieve their goals during the year of training and children who start with very little in place may
take longer to get under way.

Page | 30
Appendix A: Progress in Reading Recovery Typical text at Reading Recovery level 1
Typical text at Reading Recovery level 8
Typical text at Reading Recovery level 17


