1 REAL OPTIONS: EXAMPLES AND PRINCIPLES OF VALUATION AND STRATEGY Han T.J. Smit Department of Finance Erasmus University Rotterdam and NIAS The Netherlands Fax 011-31-10-4526399 Email: [email protected]and Lenos Trigeorgis Department of Business University of Cyprus and NIAS Email: [email protected]
Transcript
1
REAL OPTIONS: EXAMPLES AND PRINCIPLES OF VALUATION AND STRATEGY
Han T.J. Smit Department of Finance
Erasmus University Rotterdam and NIAS The Netherlands
REAL OPTIONS: EXAMPLES AND PRINCIPLES OF VALUATION AND STRATEGY
Abstract The paper illustrates the use of real options and game theory principles to value prototypical investment projects and capture important competitive/strategic dimensions in a step-by-step analysis of investment decisions (options) under uncertainty. It first illustrates the application of real options principles to a mining concession and to an R&D program. It then provides examples from innovation cases and uses basic game theory principles to discuss other strategic and competitive aspects, especially applicable to oligopolistic industries like consumer electronics. The issue of whether (and when) it is optimal to compete independently or coordinate/collaborate (e.g., via joint R&D ventures or strategic alliances) is given particular attention.
3
REAL OPTIONS: EXAMPLES AND PRINCIPLES OF VALUATION AND STRATEGY
1. INTRODUCTION
This paper provides an overview of the basic principles of quantifying the
value of corporate real options and of capturing important strategic dimensions, which
are at the core of strategic planning and investing under uncertainty. In the current,
highly volatile and competitive landscape, the horizon over which cash flows can be
estimated confidently is shrinking, making it essential for firms to be flexible in their
investment programs. The future is uncertain and as the dynamic investment path
unfolds the firm’s management learns, adapts and revises investment decisions in
response to unexpected market developments. An analysis of projects in a dynamic
environment is often more complex than the standard (DCF) approaches may suggest,
since they implicitly assume a static view of investment decisions and projected cash
flow scenarios.1 The real options approach is more dynamic than the traditional
approaches since it is capable of incorporating not only the value of flexibility and
growth opportunities but also of competitive strategies in an uncertain environment. 2
It is well accepted by now that the value of many strategic investments does not
derive so much from direct cash inflows, as it does from the options to invest in future
growth. Indeed, strategic plans often encompass projects which, if measured by cash
flows alone, typically appear to have a negative net present value (NPV), when in fact
they may have a positive total strategic value. An early investment in research and
1 The standard NPV methodology has obvious shortcomings in analyzing investment opportunities whose value derives from future growth options. NPV implicitly assumes such investment decisions are a “now or never” proposition; it does not take into account the value to “wait and see” and alter planned investment decisions as uncertainty gets resolved over time. 2 A number of papers have addressed the importance of managerial flexibility. Baldwin (1982) examines sequential investment strategies and interdependencies with future investment opportunities. She observes that if firms with market power wish to compensate for the loss in the value of future opportunities that result from undertaking a project now, they must require a positive premium over NPV. Myers (1987) suggests considering strategic investment opportunities as growth options, while Kester (1984) discusses qualitatively strategic and competitive aspects of growth opportunities. Dixit and Pindyck (1994), Trigeorgis (1988, 1995, 1996a), Kemna (1988), Sick (1989), Smit (1996), and others, discuss many corporate options and provide various expositions of the real options approach to investment.
4
development (R&D), for instance, may seem unattractive if its direct measurable cash
flows are considered in isolation. However, the potential profits from commercialization
that may result from the research (and related spin-off applications) must be properly
captured by determining the value of the underlying research program. Such a strategic
R&D investment should not be seen as a one-time investment at the outset; proper
analysis requires explicit consideration of its follow-on commercial options (i.e., to
commercialize the end product of the R&D program) and related applications. The
option perspective suggests that, as information over the success of R&D is revealed,
management has flexibility to proceed with, terminate or otherwise alter its future
investment plans.
The new view of investment that treats opportunities as corporate real options
has enriched modern corporate resource allocation and planning. The opportunity to
invest can be seen as a call option, involving the right to acquire an asset for a
specified price (investment outlay) at some future time. The underlying asset may be
a package consisting of the project plus the value of other embedded corporate real
options (e.g., to later expand production scale, abandon the project for its salvage
value etc.). The techniques derived from option pricing can help quantify
management’s ability to adapt its future plans to capitalize on favorable investment
opportunities or to respond to undesirable developments in a dynamic environment by
cutting losses.
“Wait-and-see” flexibility is clearly important in the evaluation of many
investment opportunities under uncertainty. By delaying an investment decision, new
information can be revealed that might affect the desirability of the investment, while
management has the option to discontinue the project if market conditions turn out to
be unfavorable. From this perspective, management should wait until a project is
clearly desirable, requiring a premium over the zero-NPV value, reflecting the option
value of deferment. Of course, from a strategic perspective it is not always advisable
to defer investment. Besides the learning advantages of postponement, waiting may
involve serious disadvantages. For example, management could lose early operating
cash inflows when a fixed-life project is delayed, or miss out on a competitive first-
mover advantage. An earlier (or heavier) strategic investment (say, to develop a new
technology) may confer upon the pioneer firm a cost or timing advantage and
influence the competitor’s behavior and the resulting equilibrium in a way that
5
strengthens the pioneer’s competitive position and long-term value. In other words,
early investment commitment may have strategic benefits that must be weighted
against the lost flexibility value component. These benefits and the resulting
implications for competitive strategy can be captured with the help of basic game
theory principles in combination with option valuation.
In the organization of this paper we find it instructive to follow a step-by-step
exposition. To introduce different aspects into the analysis one at a time we start with
examples of proprietary investment decisions (options) under uncertainty, and later
introduce the strategic dimension of competitive reactions. The next section uses two
basic numerical examples to illustrate the application of real options valuation
principles to mining and to R&D programs. Section 3 extends the analysis using basic
game theory principles to discuss other strategic and competitive aspects, especially
applicable to oligopolistic, innovative (high-tech) industries like consumer
electronics. Section 4 examines the issue of competition vs.
coordination/collaboration. Section 5 concludes.
2. BASIC VALUATION EXAMPLES: MINING AND R&D
This section presents two prototypical applications. The first example
considers the valuation of a gold mine concession, where the current project value can
be estimated using a traded financial instrument (gold futures) whose probabilistic
behavior is close to that of a producing mine. The valuation of a license to develop the
mine is treated analogous to the valuation of a simple call option. In the second
example, we consider whether to invest in R&D and subsequent stages of
commercialization. The multi-stage R&D investment decision can be viewed as a
compound option (or option on an option).
2.1 VALUING A MINE CONCESSION (LICENSE)
Following Brennan and Schwartz (1985), consider a firm that must decide
whether to invest in a gold mine. The decision to develop the mine is irreversible, in
that after development management cannot disinvest and recover the expenditure. To
keep matters simple, suppose that development and extraction can be started
immediately, requiring an investment outlay, I, of $4.5 million (m). There are no
variable extraction costs. The gold reserves and the production profile, Qt, over time t,
6
is known ahead of time: production in year 1, Q1, is expected to be 4,000 ounces, and
production in year 2, Q2, 10,000 ounces.
Uncertainty over the value of the project is closely related to the dynamics in
gold prices. Currently, gold is priced at $300 per troy ounce; next year, the price will
change. For simplicity, we assume two possible end-of-period prices after one period:
price increasing (with a multiplicative factor u = 1.5) to S+ = $450, or price
decreasing (with a multiplicative factor d = 0.67) to a value of S- = $200. Both prices
are equally likely. In the subsequent year (t = 2), prices may rise or decrease again,
and the same multiplicative factors will apply. Table 1 summarizes the possible gold
prices (S), extraction quantities (Q), and the resulting operating cash flows, CF =
Q.S.3 Suppose further that the risk-free interest rate r is 4% per year.
TABLE 1. Quantities, Prices and Operating Cash Inflows of a Mine in Various States Period State Probability Gold price Quantity Cash inflow (Q.S) (Nature) q per ounce, S Q CF (m) 0 current $300 1 high 0.5 $450 4,000 $1.80 1 low 0.5 $200 4,000 $0.80 2 high, high 0.25 $675 10,000 $6.75 2 high, low / low, high 0.5 $300 10,000 $3.00 2 low, low 0.25 $133 10,000 $1.33
Given the value of the investment outlay, the current gold price, and the dynamics in
gold prices, is this a good investment? Should management invest now, or should it
wait and see how the gold prices will develop? For an immediate investment decision,
we need to determine the opportunity cost of capital and the net present value (NPV).
The required return can be estimated from a traded financial instrument (gold) whose
probabilistic behavior is close to that of the completed project. With a spot gold price
of $300, the implied market-required return, k, for this risk can be derived from the
expected gold prices over the next one-year period, or it can be derived from the
expected gold prices over a two-year period:
2)1(133$25.0300$5.0675$25.0
1200$5.0450$5.0300
kk +×+×+×
=+
×+×=
3 Some of the numbers in Table 1 are rounded.
7
The expectation of future gold prices presented above has an implied required rate of
return equal to k = 8.33%. The NPV computation below shows that the present value
of the expected cash inflows equals $4.2m. The NPV of the gold mine is $4.2m -
$4.5m = -$0.3m; therefore, management would not invest in such a value-destructive
project.
NPV m m m m m m
m m m
=× + ×
+× + × + ×
−
= − = −
0 5 1 80 0 5 0 801 0833
0 25 6 75 0 5 3 00 0 25 1 331 0833
4 5
4 2 4 5 0 3
2
. $ . . $ ..
. $ . . $ . . .( . )
$ .
$ . $ . $ .
Another approach to valuing the mine is to replicate the cash flows with an
equivalent “twin” security rather than estimating the twin security’s required return.
Consider the position of the company that owns the producing mine. The company’s
position is long in gold. The company could offset this position and realize the value
of the field today if management could sell short gold futures that exactly match the
mine’s production over time. This particular project is lucrative for the corporation’s
shareholders if the value of the covered position exceeds the investment outlay
required for the project.
Consider, for instance, the dollar revenue of the mine at t = 2 equal to the
production times the market price over two years, 10,000S2. The company can offset
the price risk of this cash flow by selling future contracts short for 10,000 ounces of
gold, with a futures price 0F2 and a dollar revenue (10,000)0F2 at t = 2. Since it can
offset the risk of gold prices, this hedged position, Q2(0F2), can be seen as a certainty
equivalent, CEQ2, of the uncertain operating cash flow at t = 2. In Equation (3) the
present value of the certainty-equivalent cash flows is calculated using the risk-free
rate, r, as the appropriate discount-rate:
NPV Q Fr
Q Fr
I=+
++
−1 1 2 221 1( )
(3)
What is the price of long-term contracts if they are traded in an arbitrage-free
financial market? In arbitrage-free markets the expected future price, 0FT, equals the
current spot price of gold, S0, plus the interest accrued until maturity T of this
8
position, i.e., 0FT = (1 + r)T-0 S0.4 Equations (4) and (5) calculate the present value of
the certainty-equivalent cash flows using the theoretical futures prices, tFT = (1 + r)T-t
St, where T - t is the time to maturity of the contract.
NPVQ S r
rQ S r
rI=
++
++
+−1 0 2 0
2
2
11
11
( ) ( )( )
(4)
= + − = × − = −( ) , $300 $4. $0.Q Q S I m m1 2 0 14 000 5 3 (5)
Equation (5) illustrates that we can replicate the cash flows of the mine with a
gold “cash-and-carry” strategy. In other words, owning the mine is equivalent to
owning a portfolio of gold. We are able to replicate the cash flows directly if we buy
14,000 ounces of gold (the total amount of the reserves) today and sell 4,000 ounces
at t = 1 and 10,000 ounces at t = 2. The current market value of this strategy and the
value of the mine, therefore, equals 14,000($300) = $4.2m, and the NPV of the mine
equals $4.2m - $4.5m = -$0.3m.
Not surprisingly, the NPV and the certainty-equivalent valuation approaches
both result in the same answer (-$0.3m). In the NPV method, the risk adjustment was
carried out in the denominator through an appropriate risk-adjusted discount rate, k. In
the certainty-equivalent method, the adjustment for risk is in the numerator, allowing
the certainty-equivalent cash inflows to be discounted at the risk-free rate, r. Equation
(4) reflects this relation.
As a third variation, we could also calculate an (artificial) risk-neutral
probability, p, of possible gold price up (and down) movements, which would allow
us to calculate the CEQ from the possible gold prices.5 The risk-neutral probability is
the one that would prevail if the underlying asset (in a risk-neutral world) were
expected to earn the risk-free return (pS+ + (1 - p)S- = (1 + r)S). The risk-neutral
probability, p, differs from the actual (true) probability, q. The risk-neutral probability
4 This assumes no convenience or dividend-like yield. Suppose that this relation does not hold and that the futures price is higher. Should this happen, a “cash-and-carry” arbitrage opportunity is available if traders short the contract and simultaneously buy the gold. At maturity, the gold is delivered, covering the short position in the futures contract. Hence, traders are unlikely to be willing to serve this “free lunch” for the company by selling futures. 5 Because of the ability to replicate the mine with a specific gold position, its value is independent of investor risk attitudes and hence it is the same if investors were risk neutral.
9
is given by Equation (7) (see Trigeorgis and Mason, 1987), where S+ and S- are the
possible gold prices in the up and down states next period, and r is the risk-free
interest rate.
r
CEQr
SpSpk
SqSqS+
=+
−+×=
+−+×
=−+−+
11)1(
1)1(
(6)
where:
( )−+
−
−−+
≡SS
SSrp 1 (7)
In the computation below we apply the risk-neutral valuation of Equation (6) to the
above mine, using the risk neutral probability from (7):
( ) 45.0200450
20030004.01=
−−+
=p
The resulting valuation again gives the same project value of -$0.3m:
NPV m m
m m m m
m m m
=× + − ×
+
× + × + − ×−
= − = −
0 45 1 80 1 0 45 0 801 04
0 45 6 75 2 0 45 0 55 3 00 1 0 45 1 331 04
4 5
4 2 4 5 0 3
2 2
2
. $ . ( . ) $ ..
. $ . ( . . )$ . ( . ) $ ..
$ .
$ . $ . $ .
So far, replication of cash flows or properly discounting them at the required
return has resulted in the same answer. We next examine situations in which NPV
does not give the right answer. Capital investments are not usually a “now or never”
proposition. Suppose that management can buy a one-year license that enables it to
wait for a year and see how gold prices develop before making an investment in the
project. If gold prices drop and the value of the mine declines below the required
investment outlay, management can allow the license to expire. Figure 1 illustrates
how this option to defer alters the shape (distribution) of the value of the mine. At a
high gold price, the value of the mine equals $6.3m (Q x S = 14,000 x $450). At that
value, management would invest $4.5m and the NPV would equal $6.3 m - $4.5m =
$1.8m. At a low price, management would decide not to invest, as the value of the
10
project would be only $2.8m (< $4.5m). In this case, management would allow the
license to expire and the value would be truncated to zero.
FIGURE 1. Asymmetry in the Distribution of Project Value due to Flexibility
V = 6.3 m
V = 2.8 m
C = MAX[ 6.3 -4.5, 0] = 1.8 m
C = MAX[ 2.8 - 4.5, 0] = 0
A:
B:
INVEST
ABANDON
?
The standard NPV framework, which determines the present value of the
expected cash inflows and the present value of expected outlays, does not give the
right answer in this case. Under uncertainty, management has the flexibility to revise
the investment decision as uncertainty over the value of the project gets resolved. The
future investment decision is based on future gold prices, information that is not yet
known. Decision tree analysis (DTA) can in principle capture this decision flexibility
that cannot be handled well by static NPV. However, to find the appropriate discount
rate (cost of capital) along each branch (gold price state) is not an easy task. As in a
call option, the risk of the license changes each time its underlying value changes; the
risk of the license is reduced if the price of gold --and the value of the mine--
increases. An option-based approach uses decision nodes (rather than passive event
nodes) in modeling flexibility, with risk-neutral valuation capturing changes in risk in
an appropriate manner. As with DTA, the valuation problem can be solved
recursively, starting with future values and working backward along the tree. The
resulting “certainty-equivalent” values can then be consistently discounted at the risk-
free rate, r. The value of the license in this way can be seen to equal:
mm
rCpCpV 78.0$
04.10)45.01(8.1$45.0
1)1(
0 =×−+×
=+
−+×=
−+
(8)
11
where C + and C - denote the values of the option in the up (+) and down (-) states
next period. Based on the expanded NPV criterion, the value of the license to invest
has the following components:
Expanded NPV = (static) NPV + flexibility (or option) value
$0.78m = -$0.3m + $1.08m
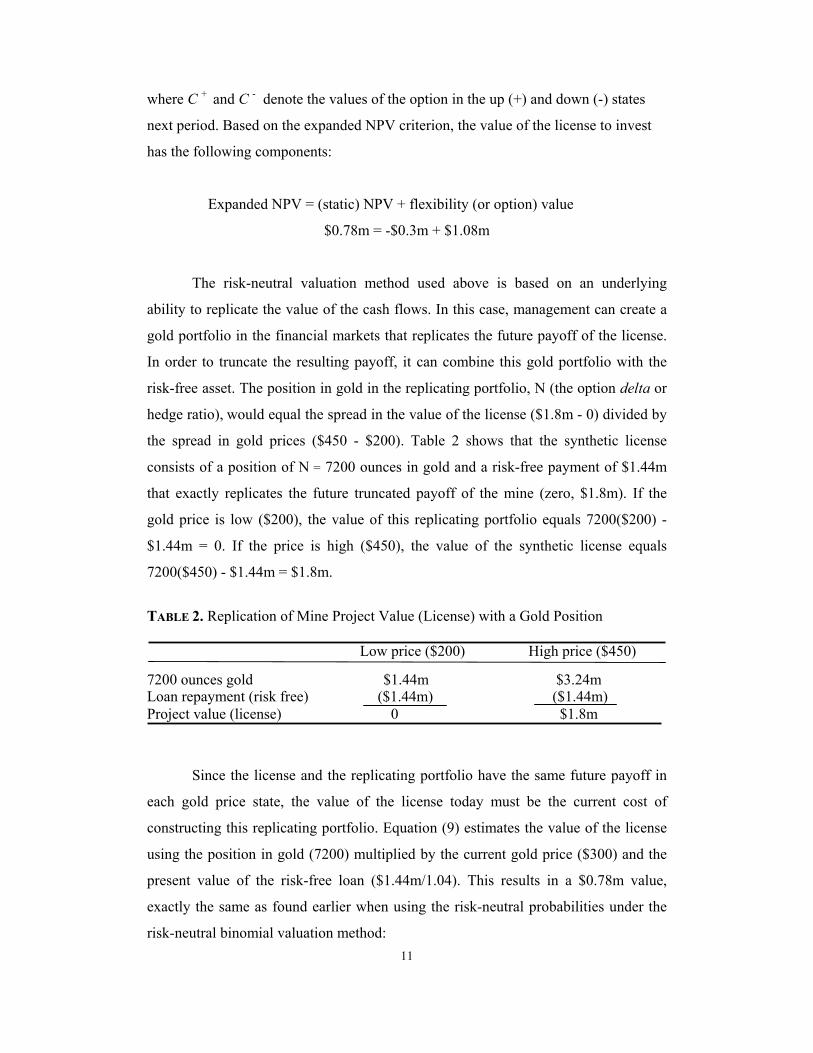
The risk-neutral valuation method used above is based on an underlying
ability to replicate the value of the cash flows. In this case, management can create a
gold portfolio in the financial markets that replicates the future payoff of the license.
In order to truncate the resulting payoff, it can combine this gold portfolio with the
risk-free asset. The position in gold in the replicating portfolio, N (the option delta or
hedge ratio), would equal the spread in the value of the license ($1.8m - 0) divided by
the spread in gold prices ($450 - $200). Table 2 shows that the synthetic license
consists of a position of N = 7200 ounces in gold and a risk-free payment of $1.44m
that exactly replicates the future truncated payoff of the mine (zero, $1.8m). If the
gold price is low ($200), the value of this replicating portfolio equals 7200($200) -
$1.44m = 0. If the price is high ($450), the value of the synthetic license equals
7200($450) - $1.44m = $1.8m.
TABLE 2. Replication of Mine Project Value (License) with a Gold Position Low price ($200) High price ($450) 7200 ounces gold $1.44m $3.24m Loan repayment (risk free) ($1.44m) ($1.44m) Project value (license) 0 $1.8m
Since the license and the replicating portfolio have the same future payoff in
each gold price state, the value of the license today must be the current cost of
constructing this replicating portfolio. Equation (9) estimates the value of the license
using the position in gold (7200) multiplied by the current gold price ($300) and the
present value of the risk-free loan ($1.44m/1.04). This results in a $0.78m value,
exactly the same as found earlier when using the risk-neutral probabilities under the
risk-neutral binomial valuation method:
12
N S0 + B = 7200 x $300 - $1.38m = $0.78m (9)
It is worth noting that in the valuation of the above gold mine we can use
directly the principle of replicating future project cash flows. In R&D, however, an
implementation problem with carrying out the replication argument of standard option
pricing arises because a correlated financial instrument is non-existent. Nevertheless,
the methodology can still be applied for valuing the contingent claim (investment
opportunity) provided there is a corresponding valuation for the underlying asset
(relative valuation). In this case the issue is to determine the market value of the
project to a firm if it were traded in the financial markets, which is a standard
assumption in traditional capital budgeting (see Mason and Merton, 1985).
2.2 VALUING RESEARCH & DEVELOPMENT
Our second example concerns how to analyze an R&D program available to a
high-tech company, and which technology strategy to pursue. As noted, R&D programs
involve multiple contingent stages and thus should not be treated as isolated projects. The
value of potential profits from follow-on commercial projects that may result from the
research stage must be properly captured in determining the value of the underlying
research program. Hence, the analysis requires explicit consideration of the project’s
various stages: research & product development, and future commercialization.
Figure 2 shows the estimated cash flows of an R&D project available to a high-
technology company. Suppose the project involves a two-year upfront R&D phase,
followed by expected cash inflows over a four-year period of commercialization. The
R&D phase requires an immediate capital outlay of $15m, and an outlay of $50m as of
year 1. The follow-on commercial project has expected cash inflows over the four-year
period of CF3 = $200m, CF4 = $500m, CF5 = $700m and CF6 = $200m, and requires an
outlay of I2 = $1,200m as of year 2. Even though the program appears to have a low
return on investment, it may be profitable to develop the new technology to enhance the
company’s future market position.
13
FIGURE 2. Capital Outlays (↓) and Expected Cash Inflows (↑) for the R&D Project to
Develop a New Technology, and the Potential Follow-on Commercial Project
What is the value of the R&D program if management were to commit to both
stages immediately? Its value at the beginning of commercial phase, V2, discounted at an
opportunity cost of capital k = 15%, is $1127m, and its NPV2 therefore equals $1127m -
$1200m = -$73m. Based on the expected scenario of a static NPV analysis, the
commercialization project itself does not appear to be profitable. Calculating the present
value as of t = 0, using an opportunity cost of 15%, results in a $852m value for the
technology. The present value of the (certain) investment outlays for the entire program,
discounted at the risk-free rate of 4%, equals $1109m for the commercial stage and $63m
for the R&D stage. Thus, if the firm were to commit to both stages of the program right
now, the total expected net value loss would amount to NPV = V0 - I0 = $852m -
($1109m + $63m) = -$320m.
However, the firm does not have to commit to both stages immediately. Investing
in R&D derives strategic value from generating the opportunity to commercialize later
on, but implies no obligation to invest in the future commercial project. In other words,
R&D is analogous to an option, in the sense that it creates a valuable future opportunity
without committing the company to making the full investment.
R&D
50
0 1 2 3 4 5 6
Commercial Project
1200
200 200
500
700
15
14
Is this technology strategy worth pursuing? To answer this question, we must
consider two decisions: Should the R&D be undertaken, and if so, should the technology
be implemented after R&D results are known?6 The opportunity to invest in the
commercialization is like a call option with time to maturity of t = 2 years, and an
exercise price of $1,200m. The underlying asset is the current (time zero) value of a
claim on the commercial project’s expected future cash inflows of $852m. Suppose that
uncertainty during the R&D phase results in a yearly increase or decline with
multiplicative up and down factors, u = 1.5 or d = 0.67. The dynamics in the time
series of commercial project values (V) are illustrated in the event tree of Figure 3
below.
FIGURE 3. Dynamics in the Value of the Commercial Project (in millions)
As with decision tree analysis (DTA), we can value the option at the end of the
tree, starting at year 2 and working backward, using risk-neutral binomial option
valuation. At the end of the R&D phase, management must decide whether to
implement the technology. Consequently, the worst possible outcome for the
implementation stage will be zero if the new technology is not used. Thus, at year two,
the value of the option equals the highest of: The NPV of commercialization (V++ -
$1,200m); or abandoning the technology (zero). As of year two this results in a net
commercialization value of $717m [= 1917 – 1200] in the case events turn out better
than expected, or a zero net value in the case of abandonment of the program (see the
6 See Kolbe et al. (1991).
852
1278
852
568
1917
379
Better than expected
Worse than expected
15
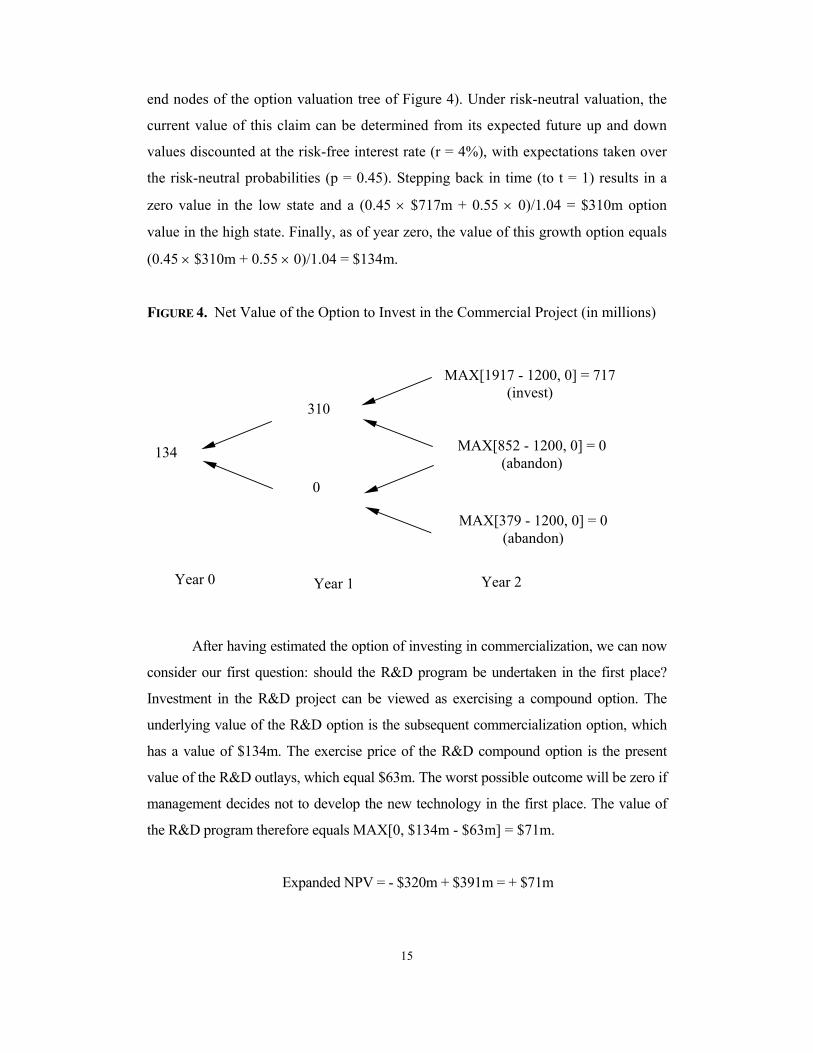
end nodes of the option valuation tree of Figure 4). Under risk-neutral valuation, the
current value of this claim can be determined from its expected future up and down
values discounted at the risk-free interest rate (r = 4%), with expectations taken over
the risk-neutral probabilities (p = 0.45). Stepping back in time (to t = 1) results in a
zero value in the low state and a (0.45 × $717m + 0.55 × 0)/1.04 = $310m option
value in the high state. Finally, as of year zero, the value of this growth option equals
(0.45 × $310m + 0.55 × 0)/1.04 = $134m.
FIGURE 4. Net Value of the Option to Invest in the Commercial Project (in millions)
After having estimated the option of investing in commercialization, we can now
consider our first question: should the R&D program be undertaken in the first place?
Investment in the R&D project can be viewed as exercising a compound option. The
underlying value of the R&D option is the subsequent commercialization option, which
has a value of $134m. The exercise price of the R&D compound option is the present
value of the R&D outlays, which equal $63m. The worst possible outcome will be zero if
management decides not to develop the new technology in the first place. The value of
the R&D program therefore equals MAX[0, $134m - $63m] = $71m.
Expanded NPV = - $320m + $391m = + $71m
134
310
MAX[852 - 1200, 0] = 0 (abandon)
0
MAX[1917 - 1200, 0] = 717 (invest)
MAX[379 - 1200, 0] = 0 (abandon)
Year 0
Year 1 Year 2
16
In this case, management is justified to invest in R&D to prove the new
technology and position itself to take advantage of a future growth option, despite the
negative NPV of its expected cash flows (-$320m). Management should recognize that a
wider range of possible outcomes would in fact increase the option value of
commercialization.
Both of the above examples where analyzed assuming the project is
proprietary and its value is essentially unaffected by competitive moves. The next
section considers situations prevailing in oligopolistic markets where a strategic
investment by a firm has a direct impact on (and/or is affected by) competitors’
behavior. An expanded or strategic analysis (often relying on game theory principles)
is then called for.
3. STRATEGIC (EXPANDED-NPV) ANALYSIS
As noted, a strategic investment entails “commitment value” by virtue of
influencing the investment decisions of competitors (e.g., see Dixit (1979, 1980)).
Consider a pioneer firm that invests early and aggressively on a large scale in a new
geographic market. Competitors may view this strategic investment as a threat to their
future profit base in this market, and in certain states (e.g., low demand) may choose
to stay out altogether or enter later at a reduced scale to avoid a market-share battle.
By reducing the likelihood of competitive intrusion, the strategic project can lead to
higher long-term profits for the pioneer firm.
Shared investment opportunities in oligopolistic markets are exercised with
the explicit recognition that they may invite competitive reaction, which in turn can
impact the value of the investment opportunity for the incumbent. Under such
conditions, a strategic investment no longer represents an internal value-optimization
problem under uncertainty (i.e., against nature) as in standard option models that
assume an exclusive opportunity. Rather, the shared investment now involves a
strategic game against both nature and competition. Such a strategic investment plan
should be based on an expanded or strategic NPV criterion that incorporates not only
the passive (or direct) NPV of expected cash flows from investing immediately and
the flexibility value from active management (of the firm’s portfolio of operating real
17
options), but also the strategic (game-theoretic) value from competitive interactions.
That is,
Expanded (strategic) NPV = direct (passive) NPV + strategic (commitment) value +
flexibility value (10)
The box insert (Table 3) exhibits the strategic contexts of these basic game metaphors
with an illustration using investment examples. In the classic “prisoner’s dilemma
context,” firms have an incentive to invest immediately to avoid being pre-empted,
which results in an erosion of flexibility value. The payoff of this competitive game
may be positive, but less than had they followed a coordinated wait-and–see strategy.
A similar strategic context can be found in the “Grab the Dollar” game, but here firms
obtain a negative payoff when they end up investing simultaneously. The “grab the
dollar” game illustrates the situation where the current market prospects are only
favorable if one of the players invests but simultaneous investment results in a battle
with a expected negative payoff. Only the first player captures the dollar (e.g., patent),
but when they both enter the market, they both end up loosing in a battle. A dominant
firm has an advantage to win this simultaneous game. The “burning the bridges” game
explains that a firm can use the threat of a battle if it has a first-mover advantage and
can make the first investment commitment to capture a large portion of the market. Of
course, instead of fighting for a leading position in the market, firms may sometimes
find it beneficial to follow an accommodating strategy to avoid a market battle. The
“battle of the sexes” game shows that in certain cases firms have an incentive to align
their strategies and cooperate.
18
TABLE 3. Taxonomy of Game-theory Metaphors and Investment Applications
“Prisoners’ Dilemma” (Figure 5) Two people are arrested as suspects for a crime. The police puts the suspects in different cells to avoid communication. Each suspect is to be released if he testifies against the other. If neither confesses, both will get a lower punishment. The paradox is that the equilibrium outcome where both confess is worse for both prisoners, compared to the situation where neither confesses.
Innovation Race Each of two innovative firms (players) faces two possible actions: invest early or wait. Competitive pressure to be the first (e.g., to acquire a patent) induces firms to invest early; each firm has a dominant strategy to invest due to the high value of commitment, triggering a situation where both firms invest receiving their second-worst payoff. If the two firms could coordinate their investment strategy they could share the flexibility benefits of the wait-and-see option, avoiding the inferior panic equilibrium where they rush to invest prematurely.
In high-tech industries like consumer electronics, we often see firms getting into innovation races, even forming strategic partnerships to acquire a first-mover or time-to-market advantage that erode the value of wait-and-see flexibility from deferring investment. A noted example is the intensely competitive race in memory chip development. In February 1997 Hitachi, Mitsubishi Electric and Texas Instruments announced they would jointly develop a one-gigabyte DRAM. NEC, which has been co-operating loosely with ATT-spin-off Lucent Technologies and Samsung, announced in June 1997 that it had developed a 4-Gb DRAM.
“Grab the Dollar” (Figure 6)Each of two players has two possible actions: grab the dollar or wait. In the complete information (symmetric) version of the game, a player wins the dollar if he is the only one who grabs, but loses if both players try to grab the dollar. The pay off of this Grab the Dollar variant is similar to the Prisoner’s dilemma game, but both players recognize that they have negative pay off if they both play tough.
Innovation Race In the strategic context the market prospects are only favorable if one of the players invests, whereas simultaneous investment results in a battle with a negative expected payoff. Either one player captures the dollar (market) or the other, but when they both enter, they both loose in the resulting battle. In many emerging, high growth industries, the possibility of each firm pursuing independent R&D activities to capture the product standard may trigger a simultaneous similar investment by competitors that results in such a market battle.
Under competitive pressure to be the first (e.g., in a patent race) competitors may rush to make parallel innovation investments simultaneously, with one or both sides potentially getting hurt. For instance, Novell got hurt due to competition in networking products, Apple lost its lead as a user-friendly computer with the development of Microsoft’s Windows, while in the 1980’s Philips got hurt from losing the race against Matsushita over the VCR standard.
“Burning the Bridge” (Figure 7) Two opposing armies are asked to occupy an island in-between their countries, connected by bridges to both. Each army would prefer to let the island go to its opponent than fight. Army 1, who moves first, occupies the island and burns the bridge behind it (signaling
Product Standard/Preemption Each firm (player) has two possible actions: high irreversible investment commitment or more flexible, low-effort investment. The value of early/heavy commitment is that it may set the product standard or signal to competing firms about the reduced future profitability of their options in this market. Consider a
Being the first in the market enables a firm to capture a larger share of the market and put followers on a strategic disadvantage. For instance, in cellular phones the early introduction of new models of a relatively small company like NOKIA, preempted a significant market share (compared to larger competitors). Competitors like Philips (who formed a partnership with Lucent Technologies) could not catch up and left this market. In an extreme case, the pioneer can
19
its commitment to fight). Thus army 2 has no option but let Army 1 keep the island, because it knows that Army 1 has no choice but fight back if they attack. The paradox of commitment is winning the game by reducing your options (burning the bridge).
pioneer firm that makes an early, large-scale irreversible R&D investment in a new market. The firm’s competitors could view this as a threat to their future profit base in the market, thus deciding to stay out or entering the market later on a reduced scale to avoid a market share battle.
capture the product standard early on. For instance, Intel preempted 80% of the microprocessor market with its Pentium microchip that became the product standard, forcing competitors like Digital to retreat from the market, even though Digital’s Alpha chip was three to four times as powerful as the Pentium chip at a fraction of the cost.
“Battle of the Sexes” (Figure 8) A couple must choose between going to a movie or to a play. The couple prefers going somewhere together that separately, one prefers the movie and the other the play. The couple would be better of to collaborate, sometimes going to a movie and other times to a play.
Standardization Game Two (alliances of) firms must choose between standard A or standard B. Everyone would be better off with one standard (avoiding a “war of attrition”), but for one firm standard A would be the best, while for the other firm it is standard B.
In the standardization game of the high density disk, on one side was an alliance between Toshiba and Time Warner who had jointly developed a super density disk (SDD); on the other side was an alliance among Philips and Sony with their multimedia compact disk (MMCD). In this high-density CD battle, both sides recognized that the launch of more than one system would result in confusion and major capital waste, particularly for the losing company as well as the consumers. A standardization agreement resulted in increased productivity and expanded markets for both.
The following sections illustrate these ideas with a series of examples, ranging from a
symmetric decision to launch an R&D project (faced by two comparable
competitors), to an asymmetric game involving different degrees of R&D effort and
the possibility of complete preemption, to a game of R&D competition versus
collaboration via joint R&D ventures or strategic alliances.7
7 See Dixit and Nalebuff (1993) for various applications of games.
20
3.1 TIME TO LAUNCH UNDER COMPETITION (SYMMETRIC INNOVATION RACE)
Consider first the example of an innovation race involving a shared R&D
option among two consumer electronics firms, P (Philips) and S (Sony).8 Both firms
plan to develop an interactive CD technology and expect subsequent
commercialization applications. The total market value (NPV-pie) from immediate
investment (whether by a single firm or shared equally among the two firms) is
$400m. The additional value of the flexibility to “wait and see” under demand
uncertainty (had there been no competition) is $200m. This results in a total (shared)
opportunity value (option pie or expanded-NPV) of $600m if the two firms could
fully appropriate the flexibility value of waiting.
The 2 x 2 table in Figure 5 summarizes the payoffs (firm P, firm S) in four
investment-timing scenarios: (i) when both firms invest immediately (simultaneously)
they share equally the total NPV (½ × 400), resulting in a (200, 200) value payoff for
each firm; (ii)/(iii) when one firm (P or S) invests first while the other waits it
preempts its competitor and captures the full NPV value (400) for itself, resulting in a
payoff of (400, 0) or (0, 400), respectively; and (iv) when both firms decide to wait
they share equally the value of the investment option (½ × 600), resulting in a (300,
300) payoff.
FIGURE 5. Innovation Race: Competitive Pressure to be First Induces Firms to Invest
Prematurely, even though they Could Both be Better off to Wait (“Prisoners’
Dilemma”)
Note: Payoff in each cell is for (firm P, firm S). Strategies of firm P: wait (upper row) or invest (lower row) Strategies of firm S: wait (left column) or invest (right column)
8 This prototypical example uses hypothetical numbers.
Invest
Wait
Firm P
Firm SWait Invest
(300, 300)
(200, 200)*(400, 0)
(0, 400)
21
The above value-payoff structure results in a Nash-equilibrium outcome where
both firms invest (200, 200). Firm P’s payoff from immediate investment (lower row)
exceeds its payoff from a wait-and-see strategy (upper row), regardless of which
strategy firm S chooses (400 > 300 in left “wait” column, 200 > 0 in right “invest”
column); that is, firm P has a dominant strategy to invest, regardless of the timing
decision of its competitor. Firm S also has a dominant strategy to invest regardless of
P’s decision, resulting in a Nash equilibrium (*) outcome in the lower right cell, from
which neither firm can improve by making a unilateral move; thus, both firms receive
their second-worst payoff of (200, 200), an example of the well-known prisoners’
dilemma.9 Obviously, here both firms would be better off to collaborate or
coordinate and fully appropriate the option value of waiting (300, 300).
3.2 ASYMMETRIC INNOVATION RACE AND PREEMPTION
Let us revisit the above innovation race among the two firms, P and S, but in
another strategic context. If both firms invest they end up in a market share battle
with a negative payoff. Suppose now that firm P has an edge in developing the
technology, although it has limited (financial or other necessary) recourses at the
time. Competitor S may take advantage of this resource weakness and try to win the
race to the market. Following Dixit and Nalebuff (1993), each firm can choose how
intense an effort to make in developing this innovative technology. Less effort is
consistent with a (technological) follower strategy involving lower development costs
but is more flexible (safe) in case of unfavorable developments. More effort
corresponds to a (technological) leader strategy involving higher development costs
that could result in earlier product launch and a first-mover cost advantage.
Figure 6 illustrates the payoffs resulting if the competitors follow a
(technological) leader or follower strategy (high or low R&D effort) when they are in
an asymmetric power position. In this payoff table, both sides regard a high-effort
R&D battle as their worst scenario: for firm S because it is likely to loose an all-out
9 In the classic prisoners’ dilemma, two prisoners accused of a crime would be worse off if they both confess (200, 200) than if they do not (300, 300), but the fear of the other prisoner confessing (0, 400) puts pressure for both to do so even though not confessing would have been preferable for both.
22
race, and for firm P because it would incur large costs. Suppose that this situation
results in a (-$100m, -$100m) payoff.
The next-worst scenario for each competitor is to exert low effort while its
competitor chooses a high-effort R&D strategy. This entails spending money with
little chance of success, resulting in a payoff of only $10m. Under firm S’s
technological leader strategy, it develops its interactive CD technology by exerting
high effort ($200m), while firm P follows with a low-effort follower strategy. In the
best scenario for firm P, both firms avoid an intense innovation race and make a low-
effort investment, with firm P more likely to win due to its technological edge and
lower cost (resulting in a payoff of $200m for P, $100m for S).
FIGURE 6. (Simultaneous) Innovation Race with High vs. Low R&D Effort
(Asymmetric “Grab the Dollar” Game)
Note: Payoff in each cell is for (firm P, firm S). Strategies of firm P: low-effort R&D (upper row) or high-effort R&D (lower row) Strategies of firm S: low-effort R&D (left column) or high-effort R&D (right column)
Consider the equilibrium implications of an asymmetric payoff structure as
that of the “Grab the Dollar” game in Figure 6 above.10 Firm P’s payoff for pursuing a
low-effort R&D strategy (upper row) exceeds the payoff of a high-effort strategy
10 This is an asymmetrical variant of the “Grab the Dollar” game, in that both firms have a negative payoff if they both make a high R&D effort, and there is a positive payoff if only one of them follows a high-effort strategy. Only Firm S has a dominant position in playing this game, reflected in its higher pay off.
High
Low
Firm P
Firm S
Low High
($200m, $100m)
(-$100m, -$100m)($100m, $10m)
($10m, $200m)*
23
(lower row), no matter which strategy firm S chooses ($200m > $100m and $10m > -
$100m). Thus, firm P has a dominant strategy to pursue low-effort R&D. Given this,
firm S will pursue a high-effort R&D strategy (since $200m > $100m). The Nash
equilibrium (*) outcome of this R&D rivalry game is given by the top right cell ($10,
$200), where P receives its second worst payoff. P would follow a flexible, low-effort
strategy, while S would follow the high-effort R&D strategy.
Consider next a similar situation (as the simultaneous innovation race of
Figure 6 above), but with the difference that firm P can make the R&D investment
before firm S can decide which strategy to follow. Which R&D strategy should firm P
follow? Management must now recognize that its investment decisions will directly
influence competitive reaction, as illustrated in the sequential game of Figure 7. The
threat of a market battle could actually work in firm P’s favor.
FIGURE 7. Sequential Investment Game with High vs. Low R&D Effort (“Burning the
Bridges”)
If firm P pursues a flexible low-effort strategy (making a small R&D
investment), firm S will respond with high effort, and firm P’s payoff will be $10m.
However, if P pursues a high-effort R&D strategy, firm S can be expected to respond
with low effort (since $10m > -$100m), in which case P’s payoff will be $100m.
Therefore, firm P would invest heavily in R&D, signaling a credible commitment to
Low effort
Low effort
S
Low effort
High effort
High effort
High effort
S
P
($200m, $100m)
(-$100m, -$100m)
($100m, $10m)*
($10m, $200m)
24
the high-effort R&D strategy (with the competitor responding with a low-effort
strategy). With such a strategic timing move, the equilibrium results in a more
desirable payoff for firm P ($100m) than that of the earlier (simultaneous) game
($10m).
This strategy represents an early exercise of a shared multistage R&D option
and it explicitly influences both competitive behavior and the firms’ future profit
base. In our strategic (expanded-NPV) framework, an immediate high-effort R&D
strategy (technological leadership) has two main effects on value, with opposite sign:
(i) A standard option-value or flexibility effect. This reflects management's
ability to wait to invest in the business under uncertain conditions. The large (early)
investment implicit in the high-effort R&D strategy, although enhancing the value of
future growth opportunities, sacrifices this flexibility value compared to a more
flexible low-effort strategy.
(ii) A strategic commitment effect. A large (early) R&D investment consistent
with technological leadership and a high-effort strategy can influence competitors’
investment decisions and the equilibrium outcome favorably for the pioneer firm (P),
giving it an asymmetric competitive edge. This must be weighted against the loss of
flexibility value.
In certain cases, however, efforts to create asymmetric power positions vis-à-
vis a competitor must be given up in favor of more fully appropriating the option
value of a coordinated wait-and-see strategy under demand uncertainty.
4. COMPETITION VS. COORDINATION/ STRATEGIC ALLIANCES
In an oligopolistic industry, firms can make prior investments in R&D to
increase their ability to capture the growth opportunities in the industry. This section
considers the issue of whether (and when) it is optimal to compete independently or
coordinate (e.g., via standardization agreements) and otherwise collaborate (e.g., via
joint R&D ventures or strategic alliances) in the innovation phase, to increase the
total value of growth opportunities in the industry under uncertainty. Section 4.1
examines the competition vs. coordination (standardization) game in the high-density
disk market, while section 4.2 discusses learning and across-time evolution in a given
25
industry (consumer electronics) from a competitive mode (in VCRs) to one of
strategic alliances (in the launch of the CD).
4.1 STANDARDIZATION IN THE HIGH-DENSITY DISK
Consider the innovation battle for the development of the high-density disk.
Initially, it might seem as if this effort would end up in a technological war. Instead, it
ended up in a coordination game. On one side was an alliance between Toshiba and
Time Warner who had jointly developed a super density disk (SDD). On the other
side were Philips and Sony with their multimedia compact disk (MMCD). The storage
capacity of the old CD (70 minutes for a movie) had become insufficient; with new
compression techniques and the use of two layers, the storage capabilities of the new-
generation disk could increase ten times to 7.4 gigabytes, and even more for the
Toshiba disk.11 The new technology was expected to result in valuable growth
opportunities in audio CD, CD-ROM (information storage), digital video disc (DVD),
and other CD applications.
Both sides claimed victory in advance, hoping to enhance the “commitment
value” of their technology by influencing competitive behavior. For instance, both
firms made strategic moves by making advance announcements of the launch of their
high density players and disk, listing the computer producers who had chosen their
systems, emphasizing the success of their R&D efforts, even providing misleading
information about the capabilities of each other’s systems.12
The game below describes the strategic context of the dilemma faced by the
two parties (alliances). Each side would prefer to launch their own standard but
clearly would be better off to avoid a market battle. Figure 8 describes the four
outcomes in a 2 × 2 game. The worst payoffs for both parties, (2, 1) and (1, 2), are for
the situation in which both pursue exclusionary (adversarial) technological strategies
and develop competing product standards. This would result in intense competition,
but eventually uncertainty will get resolved over which one will be the winning
system. The two parties would clearly be better off with a single standard to avoid a
11 Toshiba’s disk, however, had the disadvantage of being double sided. 12 For example, Toshiba announced that its competitor, Philips, would not develop a rewritable CD version. Philips called this untrue: “Of course we are working on that. However, we have to protect the copyright first before we launch the product.” In this aggressive strategic context, the competitor’s managers made threatening statements at that time, e.g., “We are in a state of war” (NRC 5-7-95).
26
war of attrition, but each alliance would prefer their own standard to prevail. This
results in payoffs of (3, 4) or (4, 3) when both choose a standard based on SSD or on
MMCD, respectively.
FIGURE 8. The 2 × 2 Competition vs. Coordination Game (“Battle of the Sexes”)
By recognizing the above strategic context, however, both firms will have an
incentive to coordinate their product strategy to avoid a market battle. Standardization
agreements may result in increased productivity and expanded markets for both. In
the high-density CD battle, both sides recognized that the launch of more than one
system would result in confusion and major capital waste, particularly for the losing
company and the consumers. A “technical working group” representing the leading
firms in the computer industry investigated the competing systems and found that
both the MMCD of Philips and Sony as well as the SDCD of Toshiba fulfilled the
requirements. The computer industry, which would benefit if the two alliances would
agree on one standard, encouraged the two sides to negotiate and coordinate.13
4.2 LEARNING: FROM COMPETITION IN VCRS TO STRATEGIC ALLIANCES IN THE
LAUNCH OF CDS
13 Subsequently, the strategic moves of these firms (as reported in the press) changed from tough to accommodating. The vice president of Philips made accommodating statements about coming to one standard. The outcome would be a new standard for the next twenty years. The expectations were that over five years 200 million pieces of CD-carrying equipment would be sold yearly. Multimedia sales would represent 10% of total sales.
Standard based on SDD
Standard based on MMCD
Standard based on SDD
(4, 3)
Philips
Competition
(2, 1)
(3, 4)
(1, 2)
Standard based on MMCD
27
In consumer electronics, firms like Philips, Sony, Matsushita, and Toshiba have
a history of competing in the development of technologically innovative products,
such as CD players, CDi, walkman, 100 Hz TV, and the high density disk. Innovative
strategies are often accompanied by high commercial and technological risk. Such
strategies may also require close contact with customers and careful monitoring of
competition. It is possible that firms may compete in one product and cooperate on
another. As noted, strategic alliances with some competitors that use mutual
standardization agreements can help win the battle in the competition between
different systems.
Consider the battle for developing a technology standard in the video recorder
market. In the late seventies, the introduction of three types of video recorders
resulted in intense rivalry. Philips launched the V2000 system to compete with Sony’s
Betamax and JVC’s VHS system. Instead of following a single standard, Philips
decided to make the V2000 system incompatible with VHS tapes, claiming that the
advantage of reversible tapes and better slow-motion pictures was sufficient to win
adequate market share. The aggressive position by these companies resulted in an
intense market share battle in the video recorder market.
28
launch
decisionnature moves
JVC
Sony
Philips
market share
market share
defer
defer
defer
launch
launch
lose
win
lose
win
launch
defer
market share
market share
lose
win
lose
win
launch
defer
market share
market share
lose
win
lose
win
launch
defer
market share
market share
lose
win
lose
win
launch
defer
Philips
JVC
Philips
Philips
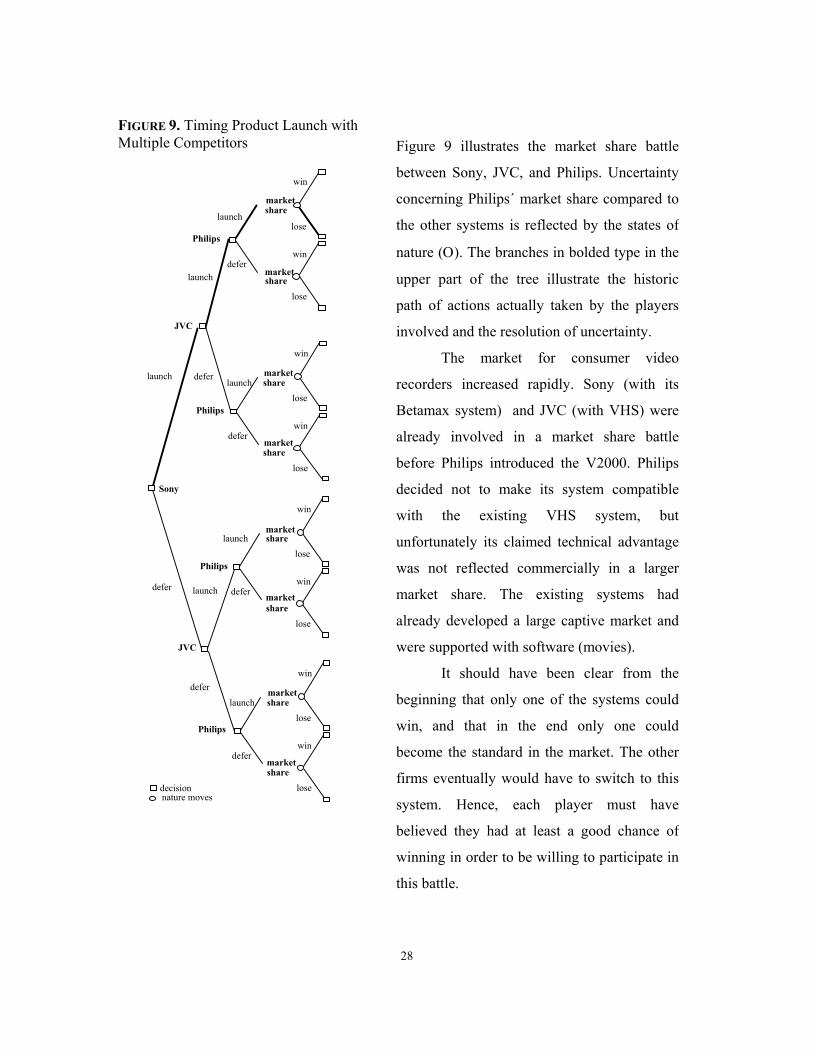
Figure 9 illustrates the market share battle
between Sony, JVC, and Philips. Uncertainty
concerning Philips´ market share compared to
the other systems is reflected by the states of
nature (Ο). The branches in bolded type in the
upper part of the tree illustrate the historic
path of actions actually taken by the players
involved and the resolution of uncertainty.
The market for consumer video
recorders increased rapidly. Sony (with its
Betamax system) and JVC (with VHS) were
already involved in a market share battle
before Philips introduced the V2000. Philips
decided not to make its system compatible
with the existing VHS system, but
unfortunately its claimed technical advantage
was not reflected commercially in a larger
market share. The existing systems had
already developed a large captive market and
were supported with software (movies).
It should have been clear from the
beginning that only one of the systems could
win, and that in the end only one could
become the standard in the market. The other
firms eventually would have to switch to this
system. Hence, each player must have
believed they had at least a good chance of
winning in order to be willing to participate in
this battle.
FIGURE 9. Timing Product Launch with Multiple Competitors
29
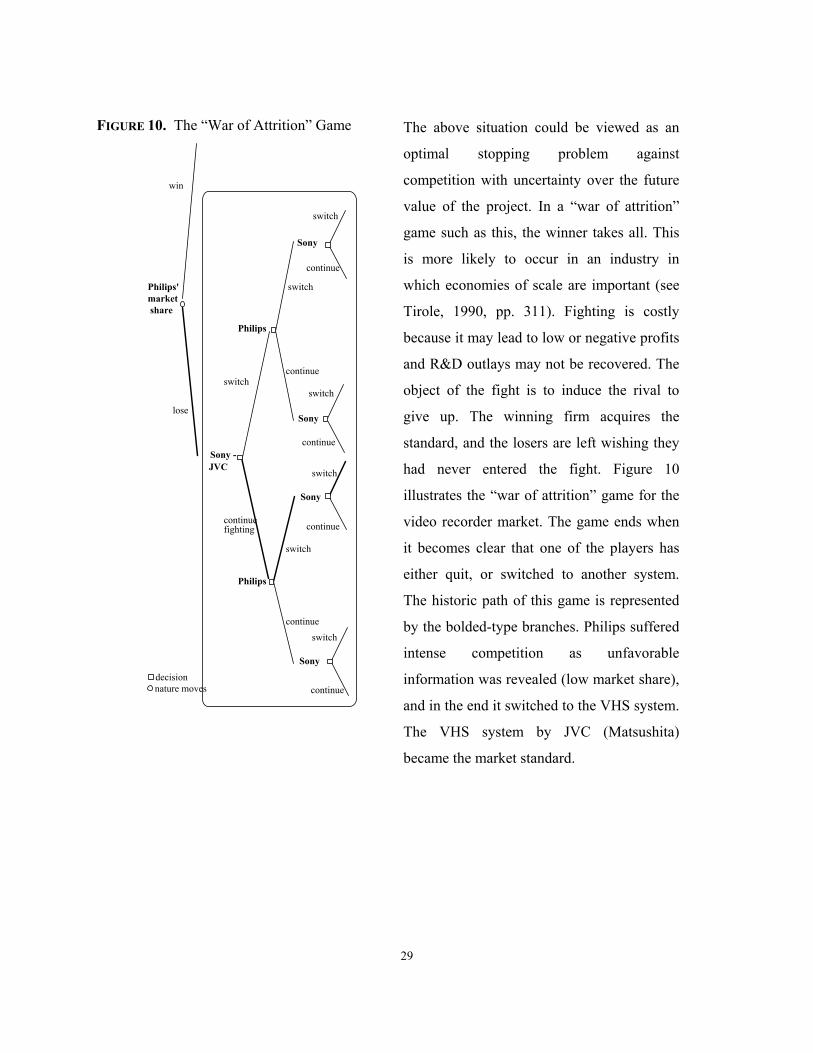
FIGURE 10. The “War of Attrition” Game
decisionnature moves
continue
Sony
JVC
switch
fighting
continue
switch
Philips
continue
switch
lose
win
market share
Philips'
Philips
Sony -
Sony
Sony
Sony
continue
switch
switch
switch
switch
continue
continue
continue
The above situation could be viewed as an
optimal stopping problem against
competition with uncertainty over the future
value of the project. In a “war of attrition”
game such as this, the winner takes all. This
is more likely to occur in an industry in
which economies of scale are important (see
Tirole, 1990, pp. 311). Fighting is costly
because it may lead to low or negative profits
and R&D outlays may not be recovered. The
object of the fight is to induce the rival to
give up. The winning firm acquires the
standard, and the losers are left wishing they
had never entered the fight. Figure 10
illustrates the “war of attrition” game for the
video recorder market. The game ends when
it becomes clear that one of the players has
either quit, or switched to another system.
The historic path of this game is represented
by the bolded-type branches. Philips suffered
intense competition as unfavorable
information was revealed (low market share),
and in the end it switched to the VHS system.
The VHS system by JVC (Matsushita)
became the market standard.
30
By contrast, in the subsequent development of the CD technology, Philips
recognized that the CD player would be a success only if other firms would be willing
to produce CDs and CD players. Philips and Sony exchanged licenses to acquire an
install-base for the CD player. The joint development of the CD turned out to be a
success, resulting in a range of subsequent growth opportunities.14
The above examples from the launching of video recorders and the
development of the CD technology clearly illustrate the potential use of options
concepts and game theory principles in understanding competitive behavior under
uncertainty in such oligopolistic markets. The commitment value of a firm’s strategy
can be enhanced by outsmarting competition under conditions of asymmetrical
information or power, as well as and of technical and commercial uncertainty. Under
other circumstances, however, market characteristics, demand uncertainty and
competitive moves may change a firm’s aggressive strategy to a collaborative one.
5. IMPLICATIONS AND CONCLUSIONS
This paper has reviewed some basic valuation principles involving real
options and competitive strategy analysis. Numerical examples from valuation of a
license on a mine concession and an R&D program illustrated the shortcomings of
traditional NPV when management has flexibility to adapt its future contingent
decisions based on the evolution of major uncertainties. In oligopolistic industries, we
discussed (using basic game theory) a number of examples involving innovation races
and other competitive games where the impact of a firm’s decision on competitors is
important in determining equilibrium outcomes and competitive strategies. A number
of insights and implementation issues are summarized below.
We have shown why risk-neutral option valuation or a certainty equivalent-
based approach is superior to traditional DCF or decision tree analysis, since it
combines the use of decision nodes (rather than passive event nodes) to model
14 A couple of decades later, it appears that the development of the CD has been a far greater success
than initially expected. In 1995, total sales for the entire market using this technology came to about
$50 billion. Three billion CD’s and about 110 million pieces of CD-carrying equipment have been sold
annually.
31
flexibility choices while being more careful to price risk correctly in each branch
(state) of the tree. In the implementation in natural resources, management can use
directly the concept of replicating future cash flows. The estimated value of a
producing field can be directly linked to oil futures. An insufficient set of market
quotes of a correlated financial instrument (e.g., futures or forward contracts) is a
general implementation problem of the option pricing methodology (and it is non-
existent in the valuation of R&D programs). However, the methodology can still be
applied provided there exists a corresponding valuation for the underlying asset.
The combined options and game theory perspective is particularly relevant for
oligopolistic and innovative industries (e.g., pharmaceuticals or consumer electronics)
facing high research and development costs in several phases in a technologically
uncertain and competitive setting. The war of attrition in video systems, the
coordination game of the CD technology, and the adversarial and accommodating
strategies for the high density disk are just a few examples of games that corporations
face in real life. Firms can make prior investments in R&D to improve their
competitive position and their ability to capture the growth opportunities in the
industry. Patents and proprietary use of information can prevent the creation of
valuable opportunities for competition. In cases of differentiated products under
contrarian, quantity-type competition (e.g., in pharmaceuticals), opposition is more
likely to retreat. However, it not always wise to compete aggressively. An important
aspect in corporate strategy is knowing when to coordinate strategies with
competition and support rivals. When the product is homogeneous and competitive
response is reciprocating, as in price competition (e.g., in the airline, the tobacco or
the food industries), adversarial strategies may result in price wars and erosion of
profit margins for all sides.15
While adversarial strategies and a lack of coordination may result in shrinking
markets, the gains from sharing information and the benefits of innovation may result
in higher productivity and profits for all under certain circumstances. With an
accommodating strategy, firms can work closely together (e.g., appropriating the
option value of waiting more fully as well as sharing costs) and may achieve more
innovation and growth. Firms often co-operate in R&D via standardization
32
agreements, joint R&D ventures or create other forms of strategic alliances. Philips
formed several joint ventures, such as with Matsushita Electronics. A potential
downside is that while these ventures may strengthen the firm’s position, they may
also be helping build up new competitors.
The combined option pricing and game theory approach, when properly
applied, can be a valuable tool of analysis in support of the overall corporate strategy.
These quantitative tools are meant to complement the strategic thinking process and
executive intuition and experience, not to replace them. Overly complicated methods are
not easily adopted and face managerial resistance. Complex real-life investment
problems often have to be simplified to their basic components to make the analysis more
feasible. Real options valuation helps do that. To make the model easier to understand, it
is more useful to use a discrete-time binomial process. Working backward in the option-
game tree, decision-makers can trace the equilibrium project values and intuit from the
model the relative magnitude of values in the different project phases. To use the model
as a practical aid to corporate planners, appropriate user-friendly software will be useful.
Real options concepts and tools are being increasingly used by consulting firms and
leading corporations around the world in a variety of industries. The practical use of
real option analysis looks quite promising.
15 As a result firms may try to differentiate their products with marketing expenses to avoid pure competition in prices.
33
REFERENCES BALDWIN, C. (1982). "Optimal Sequential Investment When Capital is Not Readily Reversible," Journal of Finance 37, 3 (June), pp. 763-782. BALDWIN, C. (1987). "Preemption vs. Flexibility in New Product Introduction," working paper, Harvard Business School. BJERKSUND, P., and S. EKERN (1990). "Managing Investment Opportunities Under Price Uncertainty: From "Last Chance" to "Wait and See" Strategies," Financial Management 19, 3 (Autumn), pp. 65-83. BLACK, F., and M. SCHOLES (1973). "The Pricing of Options and Corporate Liabilities," Journal of Political Economy 81, (May/June), pp. 637- 659. BRANDENBURGER, A. M. AND B. J. NALEBUFF (1995). "The Right Game: Use Game Theory to Shape Strategy," Harvard Business Review, (July-August), pp. 57-71. BRENNAN, M., and E. SCHWARTZ (1985). "Evaluating Natural Resource Investments," Journal of Business 58, 2 (April), pp. 135-157. DIXIT, A. (1980). "The Role of Investment in Entry Deterrence," Economic Journal 90, (March), pp. 95-106. DIXIT, A. and B. J. NALEBUFF (1991). Thinking Strategically (Norton Press). DIXIT, A. and R. PINDYCK (1994). Investment under Uncertainty (Princeton University Press). GRENADIER, S.R., and A.M. WEISS (1995). "Investment in Technological Innovations: An Options Pricing Approach," Journal of Financial Economics 44, pp. 397-416. KEMNA, A. (1993). "Case Studies on Real Options," Financial Management 22, 3 (Autumn), pp. 259-270. KESTER, W. C. (1984). "Today's Options for Tomorrow's Growth," Harvard Business Review 62, 2 (March-April), pp. 153-160. KOGUT, B., and N. KULATILAKA (1994). "Operating Flexibility, Global Manufacturing, and the Option Value of a Multinational Network," Management Science 40, 1 (January), pp. 123-139. KOLBE, A. L., P. A. MORRIS, and E. O. TEISBERG (1991). "When Choosing R & D Projects, Go with Long Shots," Research-Technology Management, (January-February), pp. 35-40. KULATILAKA, N., and E. PEROTTI (1998). "Strategic Growth Options," Management Science 44, 8, pp. 1021-1031.
34
LUEHRMAN, T (1998). “Strategy as a Portfolio of Real Options.” Harvard Business Review (Sept.-Oct.), pp. 89-99. MCDONALD, R., and D. SIEGEL (1985). "Investment and the Valuation of Firms When There is an Option to Shut Down," International Economic Review 26, 2 (June), pp. 331-349. MASON, S., and R. MERTON (1985). "The Role of Contingent Claims Analysis in Corporate Finance," In Recent Advances in Corporate Finance, E. Altman and M. Subrahmanyam. Homewood, IL: Richard D Irwin. MCDONALD, R., and D. SIEGEL (1986). "The Value of Waiting to Invest," Quarterly Journal of Economics 101, 4 (November), pp. 707-727. MCGAHAN, A. (1994). "The Incentive Not to Invest: Capacity Commitments in the Compact Disc Introduction," in Rosenbloom and Burgelman (eds.), Research on Technical Innovation, Management and Policy (JAI press). MYERS, S. C. (1987). "Finance Theory and Financial Strategy," Midland Corporate Finance Journal 5, 1 (Spring), pp. 6-13. MYERS, S. C., and S. MAJD (1990). "Abandonment Value and Project Life," Advances in Futures and Options Research 4, pp. 1-21. NICHOLS, N.A. (1994). "Scientific Management at Merck," Harvard Business Review, (January - February), pp. 88-99. PADDOCK, J., D. SIEGEL, and J. SMITH (1988). "Option Valuation of Claims on Physical Assets: The Case of Offshore Petroleum Leases," Quarterly Journal of Economics 103, (August), pp. 479-508. PINDYCK, R. (1988). "Irreversible Investment, Capacity Choice, and the Value of the Firm," American Economic Review 78, 5 (December), pp. 969-985. PORTER, M. E. (1980). Competitive Strategy (Macmillan). REINGANUM, J. (1983). "Uncertain Innovation and the Persistence of Monopoly," American Economic Review 73, 4 (September), pp. 741-748. ROBERTS, K., and M. WEITZMAN (1981). "Funding Criteria for Research, Development, and Exploration Projects," Econometrica 49, 5 (September), pp. 1261-1288. SICK, G. (1989). Capital Budgeting With Real Options, Salomon Brothers Center, New York University. SMIT, J. T. J., and L. A. ANKUM (1993). "A Real Options and Game-Theoretic Approach to Corporate Investment Strategy Under Competition," Financial Management 22, 3 (Autumn), pp. 241-250.
35
SMIT, J. T. J. and L. TRIGEORGIS, (1993)."Flexibility and Commitment in Strategic Investment”, Working Paper TI 95 -74, Boston University and Tinbergen Institute. SMIT, J. T. J. and L. TRIGEORGIS (1995). "R&D Option Strategies," Working Paper, Erasmus University. SMIT, J. T. J. (1996) "The Valuation of Offshore Concessions in the Netherlands," Financial Management 26, 2, pp. 5-17. SMIT, J. T. J. (1996) "Growth Options and Strategy Analysis," Dissertation, University of Amsterdam. SMITH, K. W., and A. TRIANTIS (1994). "The Value of Options in Strategic Acquisitions," in L. Trigeorgis (ed.), Real Options in Capital Investment: Models, Strategies, and Applications (Praeger). SMITH, M. J. (1974). "The Theory of Games and the Evolution of Animal Conflicts," Journal of Theoretical Biology 47, pp. 209-221. SPATT, C. S. AND F. P. STERBENZ (1985). "Learning, Preemption, and the Degree of Rivalry," Rand Journal of Economics 16, 1 (Spring), pp. 84 - 92. SPENCE, M. (1979). "Investment Strategy and Growth in a New Market," Bell Journal of Economics 10, (Spring), pp. 1-19. THAKOR, A. V. (1991). "Game Theory in Finance," Financial Management 22, 1 (Spring), pp. 71-94. TIROLE, J. (1990). The Theory of Industrial Organization (MIT Press). TRIGEORGIS, L. (1988). "A Conceptual Options Framework for Capital Budgeting," Advances in Futures and Options Research 3, pp. 145-167. TRIGEORGIS, L. (1991a). "Anticipated Competitive Entry and Early Preemptive Investment in Deferrable Projects," Journal of Economics and Business 43, 2 (May), pp. 143-156. TRIGEORGIS, L. (1993a). "The Nature of Option Interactions and the Valuation of Investments with Multiple Real Options," Journal of Financial and Quantitative Analysis 28,1 (March), pp. 1-20. TRIGEORGIS, L. (1993b). "Real Options and Interactions with Financial Flexibility," Financial Management 22, 3 (Autumn), pp. 202-224. TRIGEORGIS, L. (1995). Real Options in Capital Investment: Models, Strategies, and Applications (Praeger).
36
TRIGEORGIS, L. (1996). Real Options: Managerial Flexibility and Strategy in Resource Allocation (MIT Press). TRIGEORGIS, L., and S. P. MASON (1987). "Valuing Managerial Flexibility," Midland Corporate Finance Journal 5, 1 (Spring), pp. 14-21.