44
April 4-7, 2016 | Silicon Valley Manvender Rawat, NVIDIA Jason K. Lee, NVIDIA Uday Kurkure, VMware Inc. REAL PERFORMANCE RESULTS WITH VMWARE HORIZON AND VIEWPLANNER
| Date post: | 11-Sep-2018 |
| Category: |
Documents |
| Upload: | truongnguyet |
| View: | 216 times |
| Download: | 0 times |
April 4-7, 2016 | Silicon Valley
Manvender Rawat, NVIDIA
Jason K. Lee, NVIDIA
Uday Kurkure, VMware Inc.
REAL PERFORMANCE RESULTS WITH VMWARE HORIZON AND VIEWPLANNER
2
AGENDA
Overview of VMware Horizon 7 and NVIDIA GRID 2.0
Overview of VMware View Planner
Blast Protocol
Performance and Scaling Results with Knowledge Worker Workloads
Blast Extreme (GPU) vs. Blast Extreme (CPU ) vs PCoIP

3
INTRODUCTION

4
VMWARE HORIZON WITH NVIDIA GRID

5
Server
Hypervisor
Virtual
PC
Virtual
Workstation
Virtual
PC
Virtual
Workstation
HOW DOES NVIDIA GRID WORK? Virtual
PC
NVIDIA
GPU
H.264 Encode
Virtual
Workstation
NVIDIA Graphics
Driver
NVIDIA Quadro
Driver
NVIDIA GRID vGPU manager
NVIDIA Graphics
Driver
NVIDIA Graphics
Driver
NVIDIA Quadro
Driver
NVIDIA Quadro
Driver
vGPU vGPU vGPU vGPU vGPU vGPU
CPUs NVIDIA
GPU
Hard
ware
Vir
tualizati
on L
ayer
6
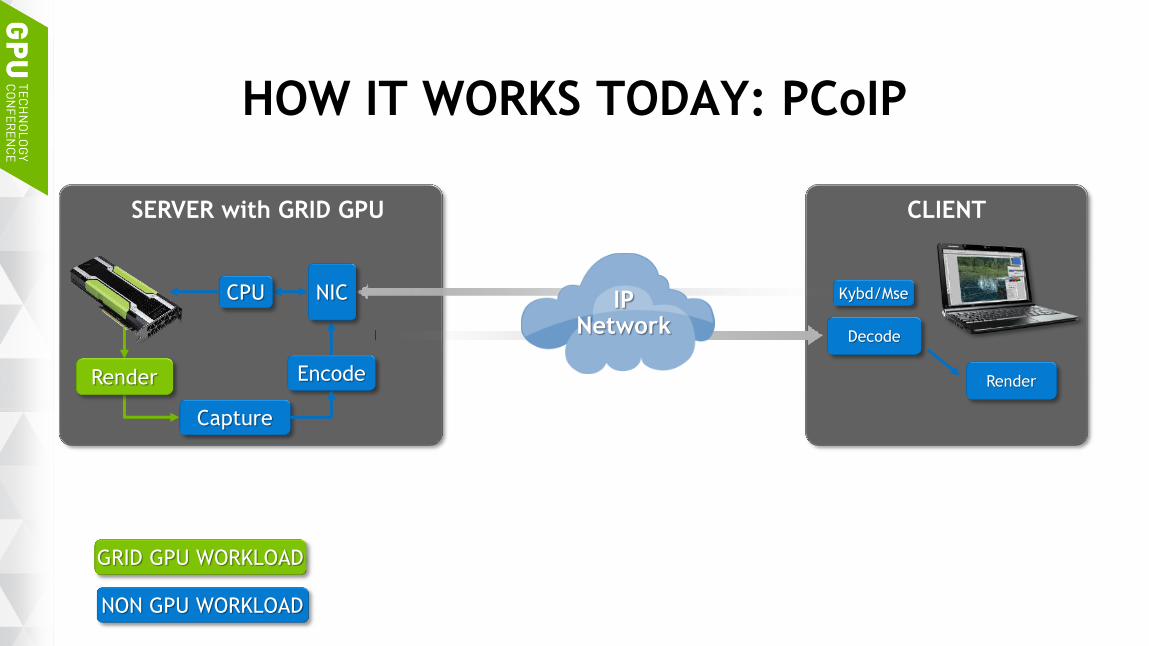
HOW IT WORKS TODAY: PCoIP
CLIENT
Render
Kybd/Mse
SERVER with GRID GPU
Capture
Encode
IP Network
CPU NIC
GRID GPU WORKLOAD
NON GPU WORKLOAD
Decode
Render

7
NVIDIA BLAST EXTREME ACCELERATION
CLIENT
Render
Kybd/Mse
SERVER with GRID GPU
Capture
Encode
IP Network
CPU NIC
GRID GPU WORKLOAD
NON GPU WORKLOAD
Decode
Render
8
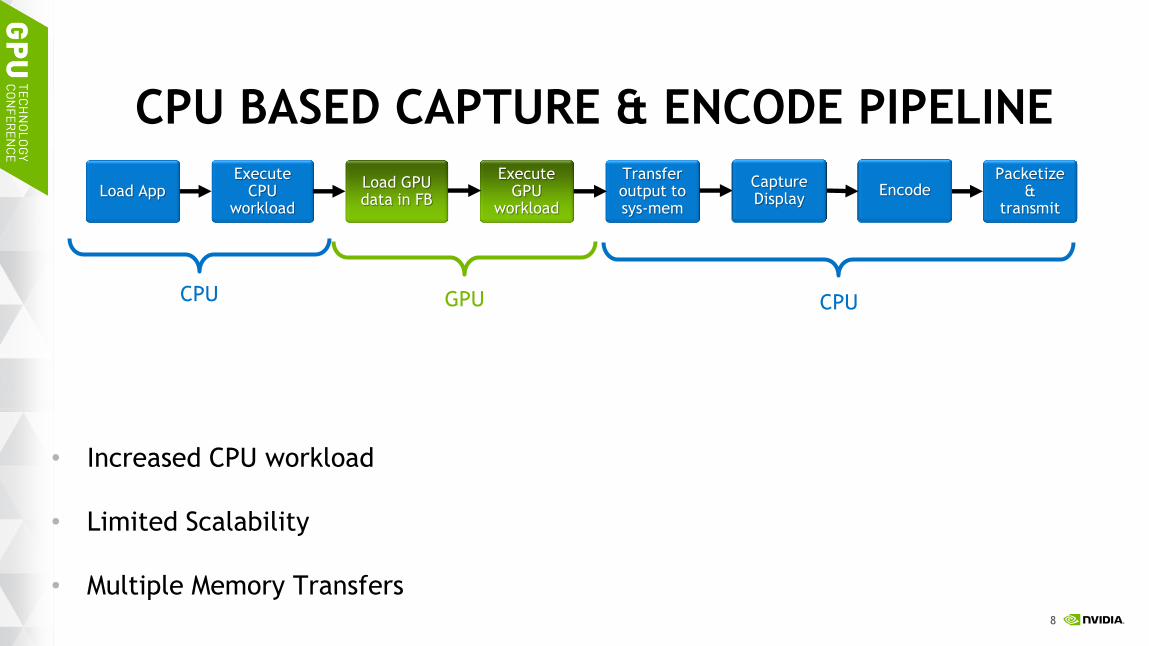
CPU BASED CAPTURE & ENCODE PIPELINE
Load App Execute
CPU workload
Load GPU data in FB
Execute GPU
workload
Transfer output to sys-mem
Transfer image to sys-mem
Encode Packetize
& transmit
CPU GPU CPU
Capture Display
Encode
• Increased CPU workload
• Limited Scalability
• Multiple Memory Transfers
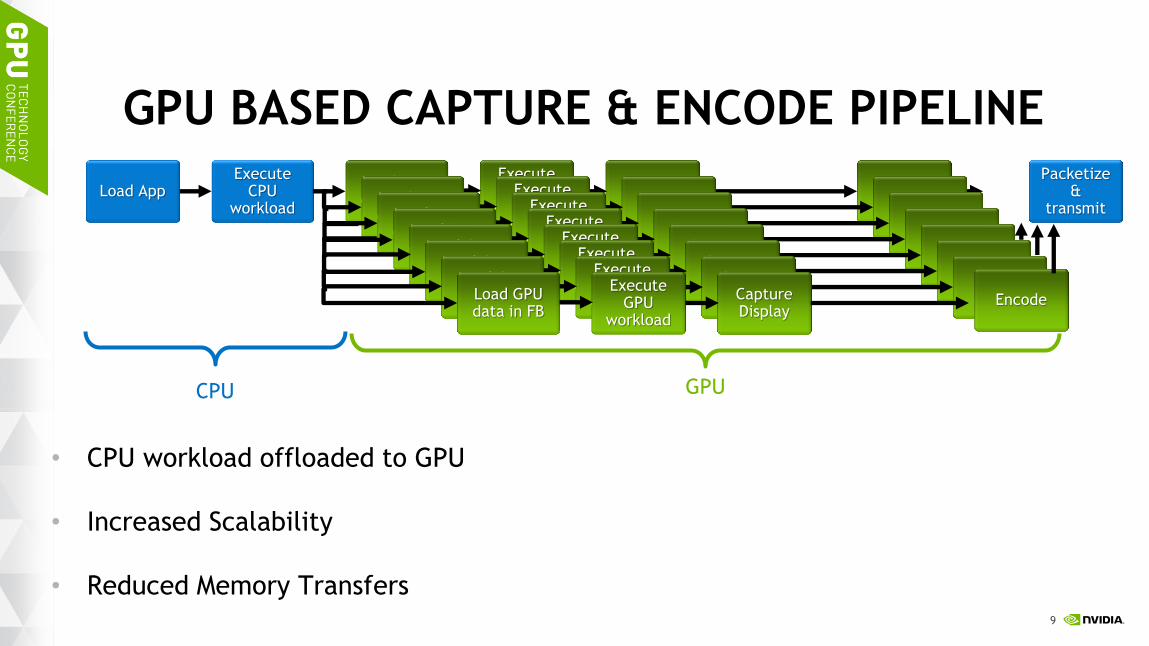
9
Load App
GPU BASED CAPTURE & ENCODE PIPELINE Execute
CPU workload
Load GPU data in FB
Execute GPU
workload
Capture Display
Packetize &
transmit Encode Encode Load GPU
data in FB
Execute GPU
workload
Capture Display
Encode Encode Load GPU data in FB
Execute GPU
workload
Capture Display
Encode Encode Load GPU data in FB
Execute GPU
workload
Capture Display
Encode Encode Load GPU data in FB
Execute GPU
workload
Capture Display
Encode Encode Load GPU data in FB
Execute GPU
workload
Capture Display
Encode Encode Load GPU data in FB
Execute GPU
workload
Capture Display
Encode Encode Load GPU data in FB
Execute GPU
workload
Capture Display
Encode
• CPU workload offloaded to GPU
• Increased Scalability
• Reduced Memory Transfers
CPU GPU
10
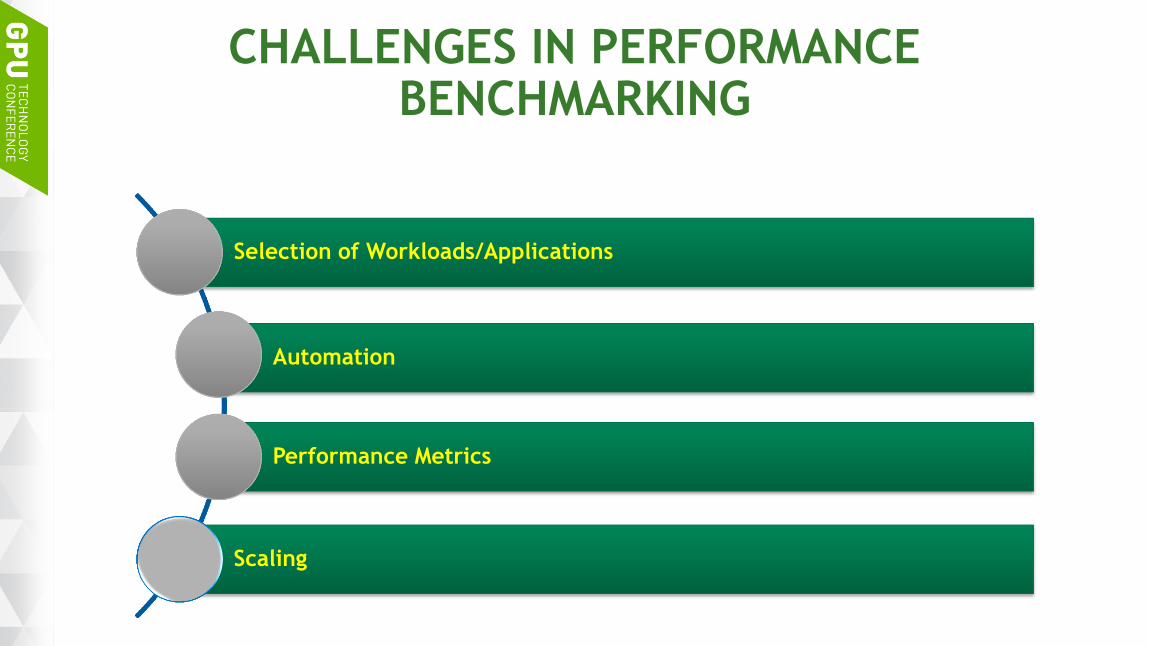
CHALLENGES IN PERFORMANCE BENCHMARKING
Selection of Workloads/Applications
Automation
Performance Metrics
Scaling
11
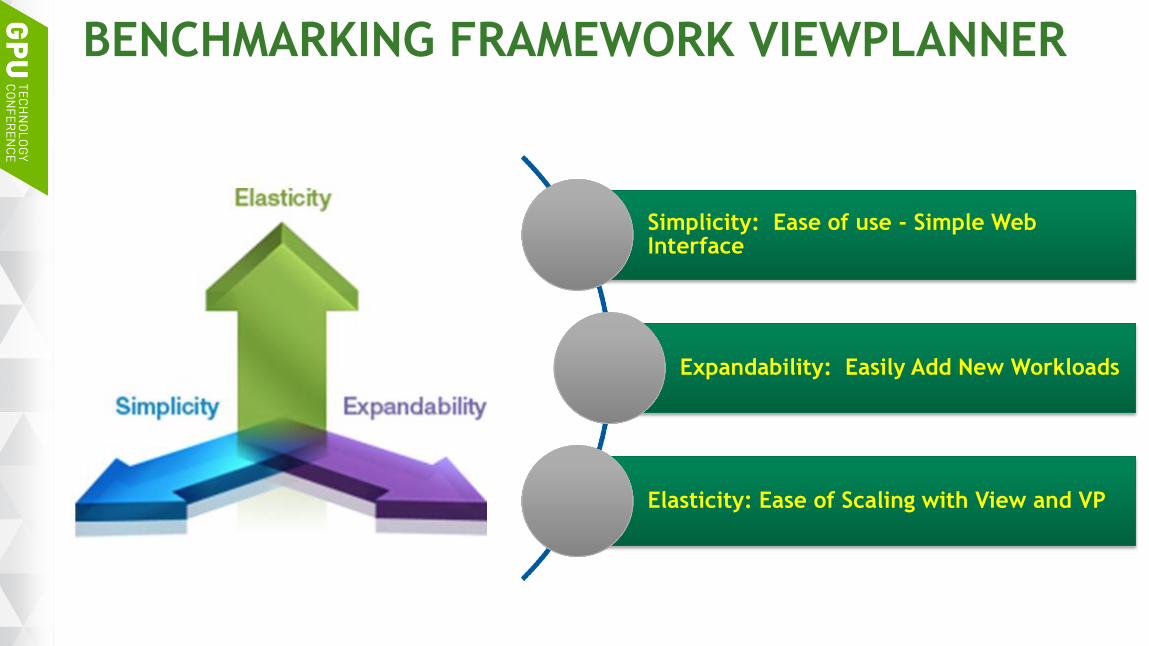
BENCHMARKING FRAMEWORK VIEWPLANNER
Simplicity: Ease of use - Simple Web Interface
Expandability: Easily Add New Workloads
Elasticity: Ease of Scaling with View and VP
12
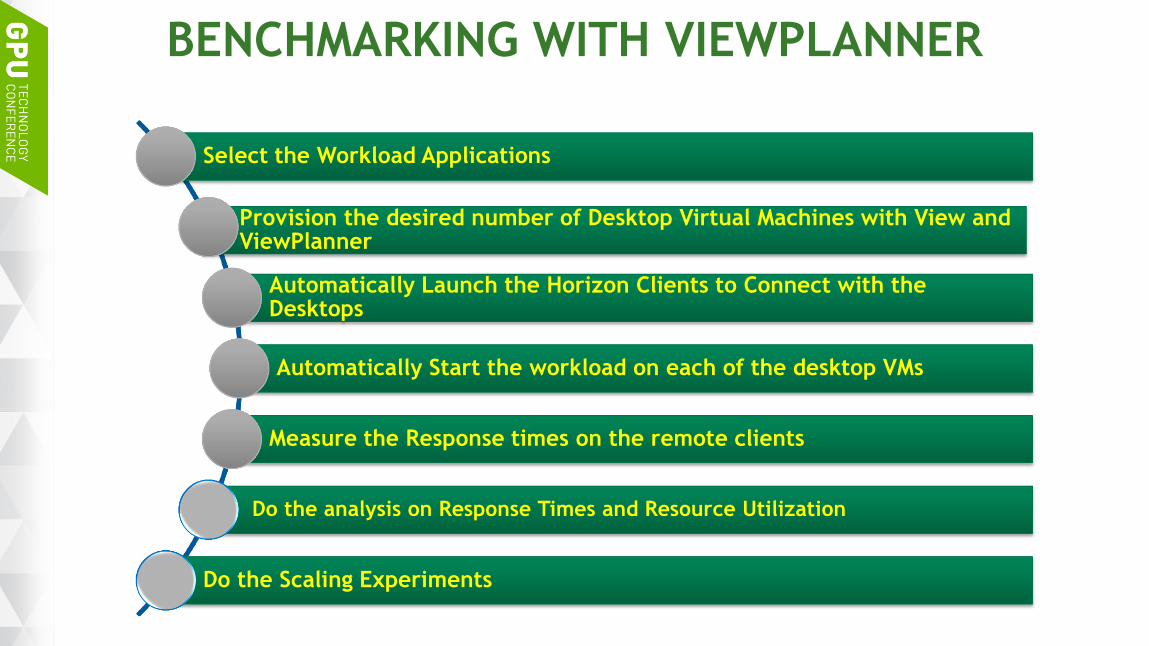
BENCHMARKING WITH VIEWPLANNER
Select the Workload Applications
Provision the desired number of Desktop Virtual Machines with View and ViewPlanner
Automatically Launch the Horizon Clients to Connect with the Desktops
Automatically Start the workload on each of the desktop VMs
Measure the Response times on the remote clients
Do the analysis on Response Times and Resource Utilization
Do the Scaling Experiments
13
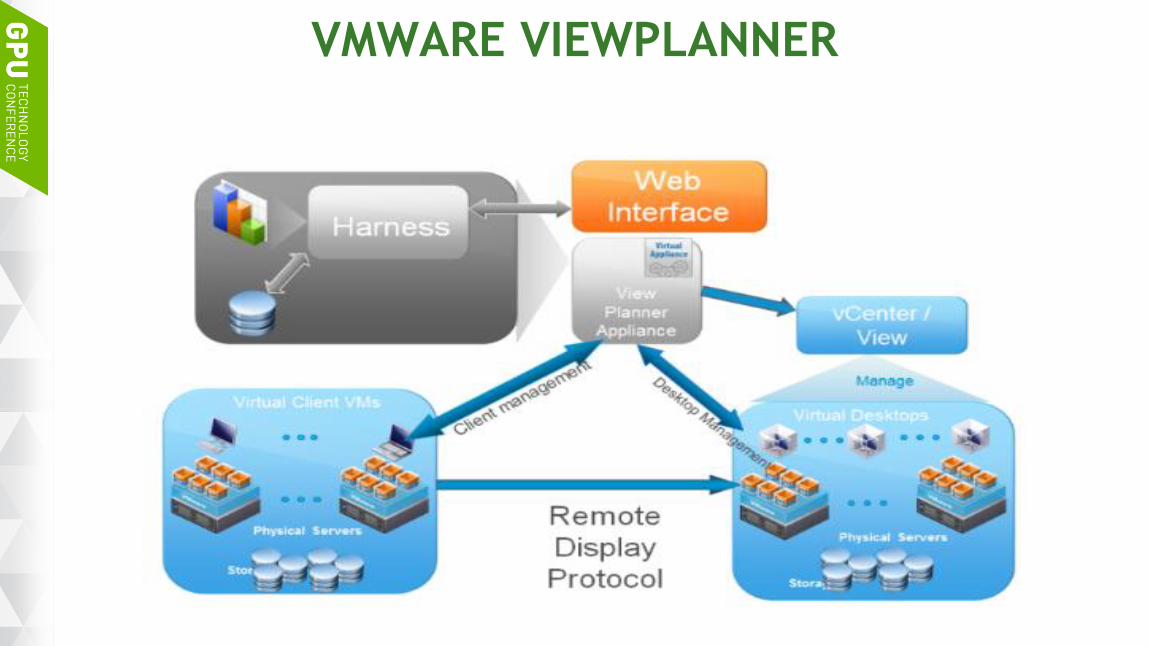
VMWARE VIEWPLANNER
14
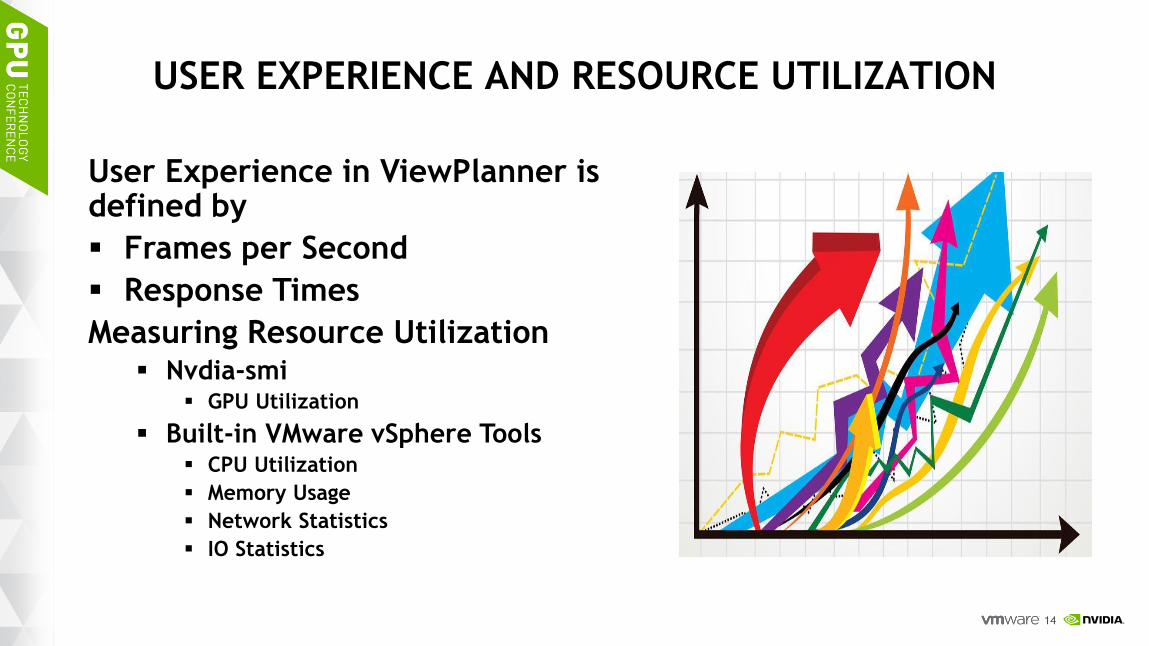
USER EXPERIENCE AND RESOURCE UTILIZATION
User Experience in ViewPlanner is defined by
Frames per Second
Response Times
Measuring Resource Utilization Nvdia-smi
GPU Utilization
Built-in VMware vSphere Tools CPU Utilization
Memory Usage
Network Statistics
IO Statistics
15
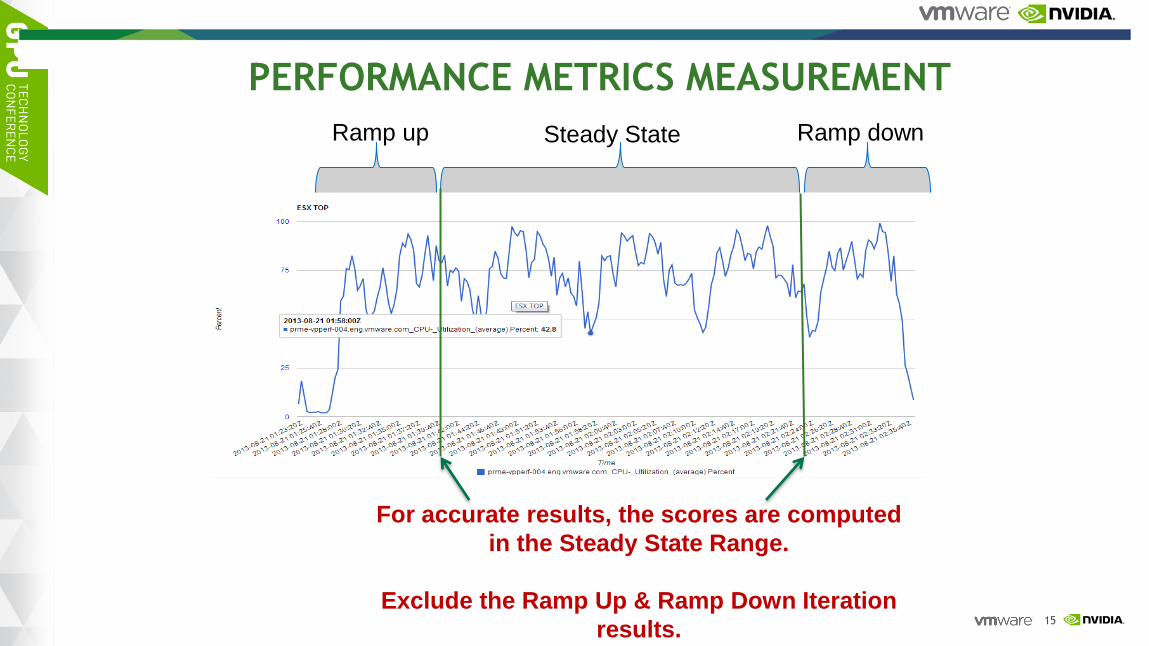
PERFORMANCE METRICS MEASUREMENT
Ramp down Steady State Ramp up
For accurate results, the scores are computed
in the Steady State Range.
Exclude the Ramp Up & Ramp Down Iteration
results.

16
PARTNERS AND CUSTOMERS Using ViewPlanner

17
KNOWLEDGE WORKLOAD TEST RESULTS
18
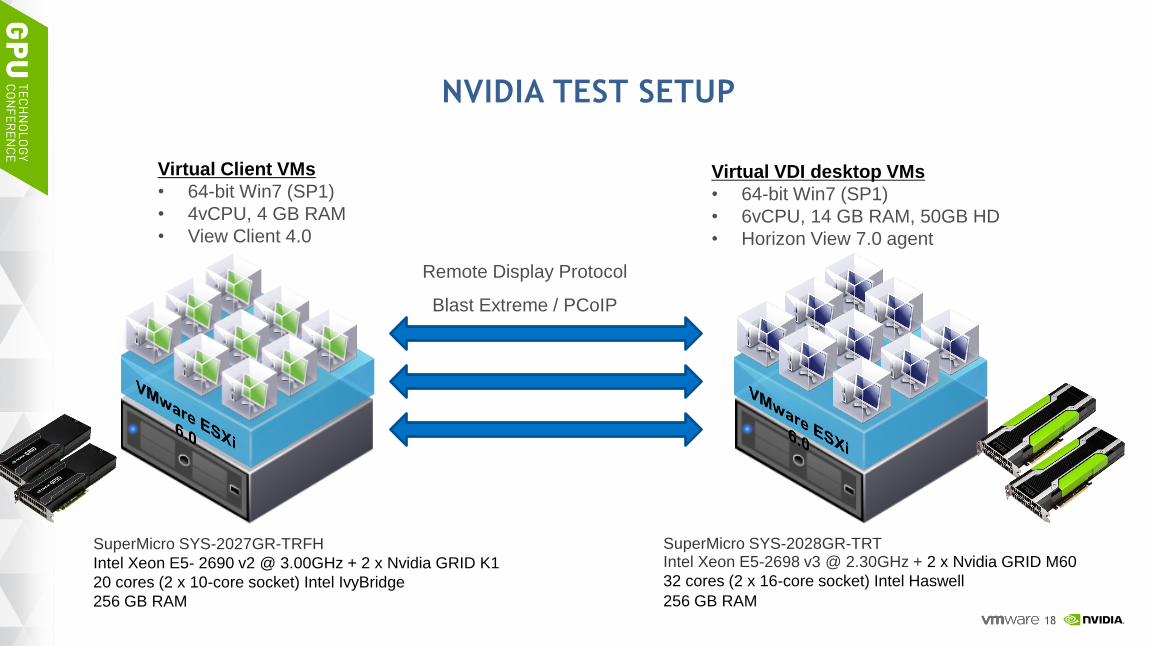
Remote Display Protocol
Blast Extreme / PCoIP
Storage
SuperMicro SYS-2027GR-TRFH
Intel Xeon E5- 2690 v2 @ 3.00GHz + 2 x Nvidia GRID K1
20 cores (2 x 10-core socket) Intel IvyBridge
256 GB RAM
SuperMicro SYS-2028GR-TRT Intel Xeon E5-2698 v3 @ 2.30GHz + 2 x Nvidia GRID M60
32 cores (2 x 16-core socket) Intel Haswell
256 GB RAM
Virtual Client VMs
• 64-bit Win7 (SP1)
• 4vCPU, 4 GB RAM
• View Client 4.0
Virtual VDI desktop VMs
• 64-bit Win7 (SP1)
• 6vCPU, 14 GB RAM, 50GB HD
• Horizon View 7.0 agent
NVIDIA TEST SETUP

19
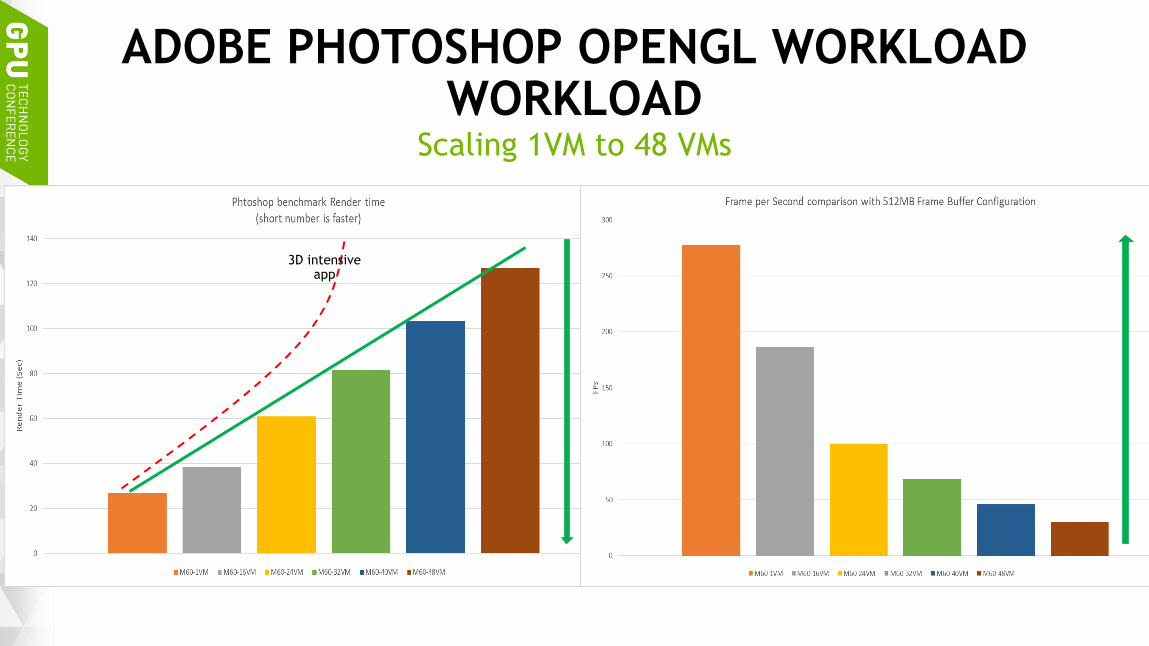
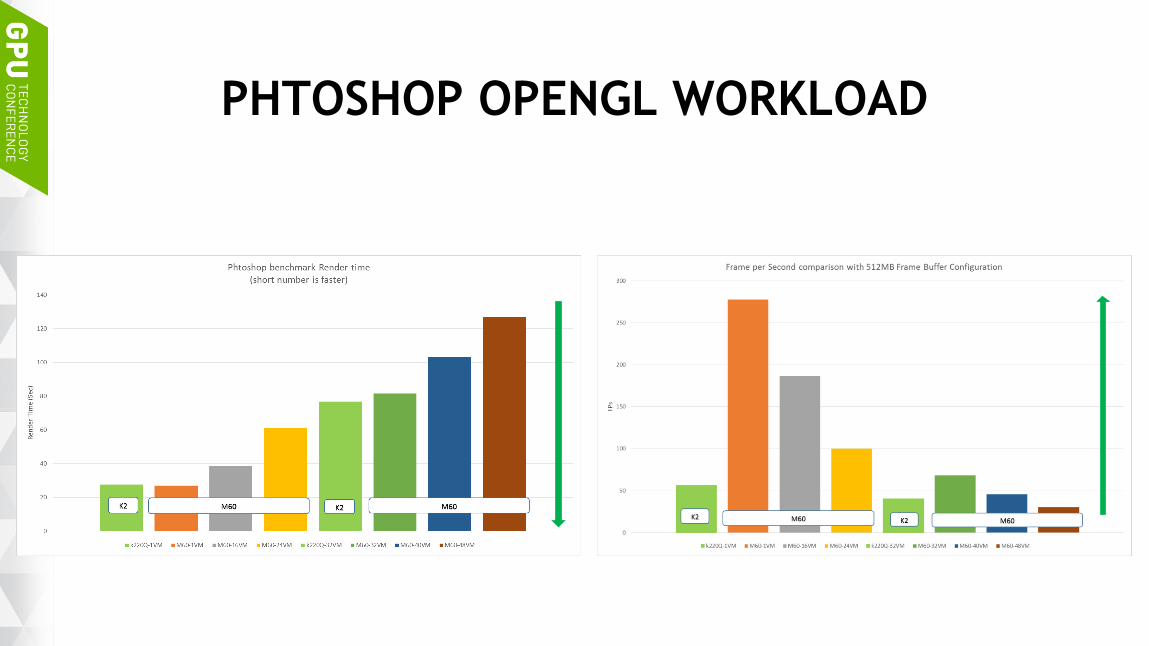
ADOBE PHOTOSHOP OPENGL WORKLOAD OVERVIEW
20
Scaling 1VM to 48 VMs
ADOBE PHOTOSHOP OPENGL WORKLOAD WORKLOAD
3D intensive app
21
AUTOCAD BENCHMARK – USER EXPERIENCE METRIC
• Assuming user experience is FPS on our NVIDIA AutoCAD benchmark
• Only one measurement at the moment
• For AutoCAD anything higher than 20 FPS is awesome but users generally don’t notice the difference once you exceed 30 FPS.
• But once you drop below 10 FPS, the software is going to feel very sluggish and become unusable by the time you hit 5 FPS.
• 20 fps above is good – Autodesk claim this is minimum UX threshold.
• Below 10fps – sluggish
• 5 fps – unusable

22
AUTOCAD WORKLOAD HOST UTILIZATION
• The AutoCAD benchmark doesn’t show rapid pixels moving or doesn’t contains huge pixels on the screen, NVEnc encoder didn’t utilize(around 50% during all benchmark)
• Both case Blast Extreme(NVEnc GPU) and PCoIP enabled hosts are show similar CPU host utilization
• Very different case compare with ESRI ArcGIS
0
10
20
30
40
50
60
70
80
90
100
23
:10
:57
23
:11
:59
23
:13
:01
23
:14
:03
23
:15
:05
23
:16
:07
23
:17
:09
23
:18
:11
23
:19
:12
23
:20
:14
23
:21
:16
23
:22
:18
23
:23
:20
23
:24
:22
23
:25
:24
23
:26
:25
23
:27
:27
23
:28
:29
23
:29
:31
23
:30
:33
23
:31
:35
23
:32
:37
23
:33
:39
23
:34
:40
23
:35
:42
23
:36
:44
23
:37
:46
23
:38
:48
23
:39
:50
23
:40
:52
23
:41
:54
23
:42
:56
23
:43
:58
23
:45
:00
23
:46
:02
23
:47
:04
23
:48
:06
23
:49
:08
23
:50
:10
23
:51
:12
23
:52
:14
23
:53
:16
23
:54
:18
23
:55
:20
23
:56
:22
23
:57
:23
23
:58
:25
23
:59
:27
0:0
0:2
9
0:0
1:3
1
0:0
2:3
2
0:0
3:3
4
0:0
4:3
6
0:0
5:3
7
0:0
6:3
9
0:0
7:4
1
0:0
8:4
3
0:0
9:4
5
0:1
0:4
6
0:1
1:4
8
0:1
2:5
0
0:1
3:5
1
Host CPU utilization, NVEnc vs PCoIP Total 10913 vs 10570 : Very similar
nvenc pcoip NvEnc Encoder
Low
er
is b
ett
er
23
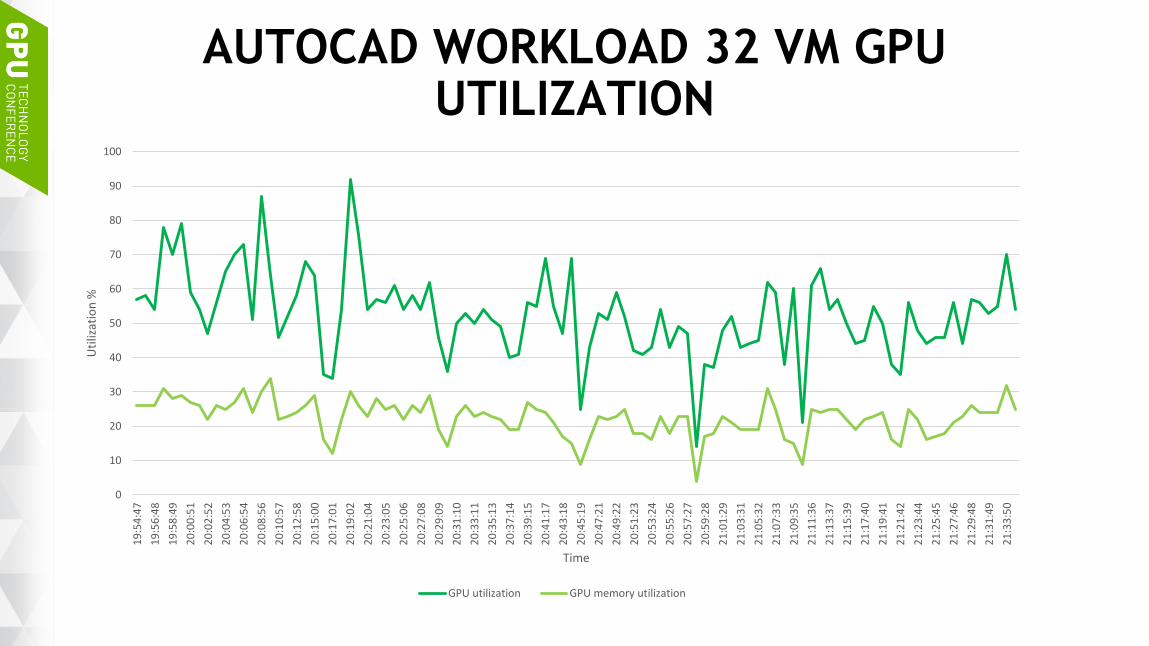
AUTOCAD WORKLOAD 32 VM GPU UTILIZATION
0
10
20
30
40
50
60
70
80
90
1001
9:5
4:4
7
19
:56
:48
19
:58
:49
20
:00
:51
20
:02
:52
20
:04
:53
20
:06
:54
20
:08
:56
20
:10
:57
20
:12
:58
20
:15
:00
20
:17
:01
20
:19
:02
20
:21
:04
20
:23
:05
20
:25
:06
20
:27
:08
20
:29
:09
20
:31
:10
20
:33
:11
20
:35
:13
20
:37
:14
20
:39
:15
20
:41
:17
20
:43
:18
20
:45
:19
20
:47
:21
20
:49
:22
20
:51
:23
20
:53
:24
20
:55
:26
20
:57
:27
20
:59
:28
21
:01
:29
21
:03
:31
21
:05
:32
21
:07
:33
21
:09
:35
21
:11
:36
21
:13
:37
21
:15
:39
21
:17
:40
21
:19
:41
21
:21
:42
21
:23
:44
21
:25
:45
21
:27
:46
21
:29
:48
21
:31
:49
21
:33
:50
Uti
lizat
ion
%
Time
GPU utilization GPU memory utilization

24
BLAST EXTREME(GPU) AVERAGE FPS (UX)
• The host DOES NOT saturate CPU resource 100% with 32 VMs current launching we can scale more than 32. Planning testing go further.
• GPU isn’t bottleneck for scaling.
36.81 36.49
0.00
5.00
10.00
15.00
20.00
25.00
30.00
35.00
40.00
NvEnc(build3) PCoIP
FPS
AutoCAD AVG FPS, M60-1Q 32VMs Blast Extreme(GPU) vs PCoIP
Hig
her
is b
ett
er
Minimum fps for UX

25
Remote Display Protocol
Blast Extreme / PCoIP
Storage
Dell R730 – Intel Haswell CPUs + 2 x NVidia GRID M60
24 cores (2 x 12-core socket) E5-2680 V3
384 GB RAM
Dell R730 – Intel Haswell CPUs + 2 x NVidia GRID M60
24 cores (2 x 12-core socket) E5-2680 V3
384 GB RAM
Virtual Client VMs
• 64-bit Win7 (SP1)
• 1 vCPU, 2 GB RAM,
• View Client 4.0
Virtual VDI desktop VMs
• 64-bit Win7 (SP1)
• 2vCPU, 4 GB RAM, 40GB HD
• Horizon View 7.0 agent
VMware Test-bed for NVIDIA GRID on Horizon View
26
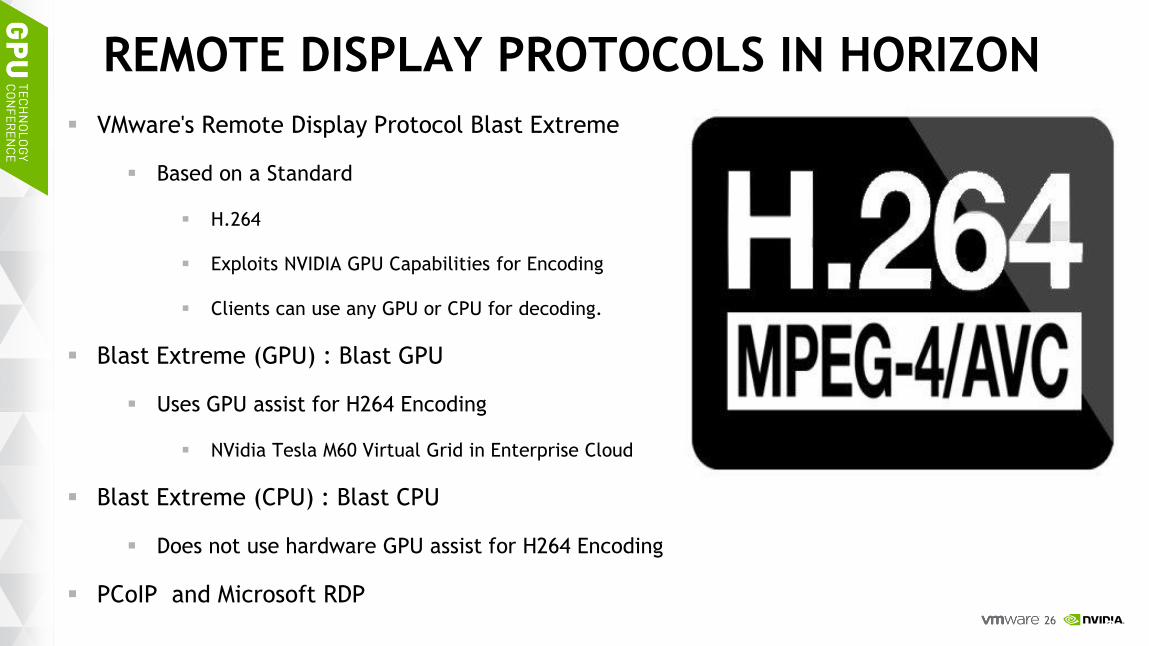
REMOTE DISPLAY PROTOCOLS IN HORIZON
VMware's Remote Display Protocol Blast Extreme
Based on a Standard
H.264
Exploits NVIDIA GPU Capabilities for Encoding
Clients can use any GPU or CPU for decoding.
Blast Extreme (GPU) : Blast GPU
Uses GPU assist for H264 Encoding
NVidia Tesla M60 Virtual Grid in Enterprise Cloud
Blast Extreme (CPU) : Blast CPU
Does not use hardware GPU assist for H264 Encoding
PCoIP and Microsoft RDP
CONFIDENTIAL 2
6

27
KNOWLEDGE WORKER APPS
Knowledge Worker Applications in ViewPlanner 3.6
Office Apps: Word, Excel, PowerPoint, Outlook
Adobe Acrobat Reader, Firefox, 7zip
Windows Media Player

28
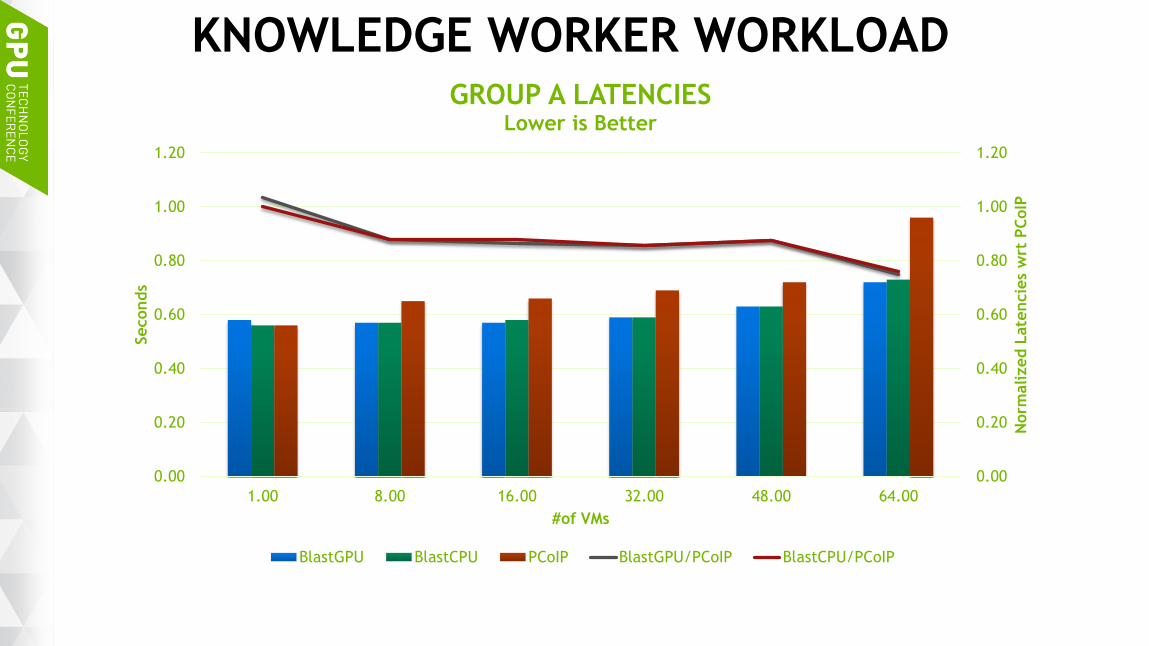
VIEWPLANNER QOS METHODOLOGY
Operations are split in Groups
Group A:Interactive/fast-running CPU bound operations
User expects minimal latencies
E.g. Modifying Word, Excel Operations
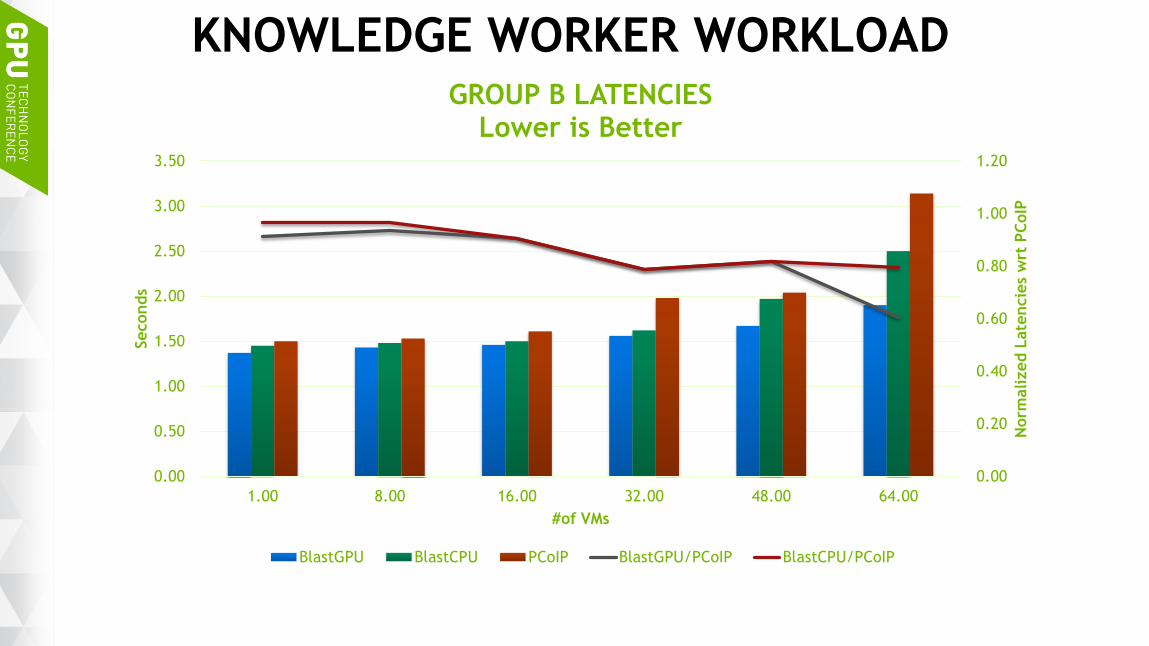
Group B:Long-running slow IO bound operations
User can tolerate longer latencies
E.g. Saving PowerPoint, Zip/UnZip
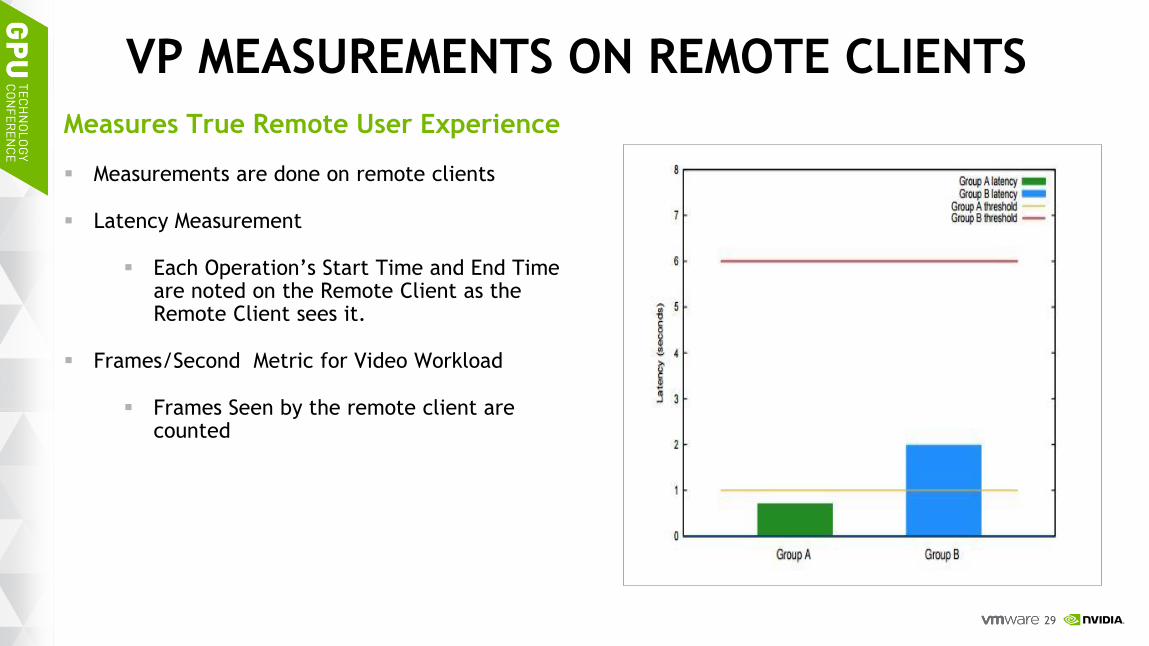
QoS Criteria:
Group A:95th %ile : 0.70s ( <= 1.0 s)
Group B: 95th %ile: 2.3s ( <= 6.0s)
4/20/2016
29
VP MEASUREMENTS ON REMOTE CLIENTS
Measures True Remote User Experience
Measurements are done on remote clients
Latency Measurement
Each Operation’s Start Time and End Time are noted on the Remote Client as the Remote Client sees it.
Frames/Second Metric for Video Workload
Frames Seen by the remote client are counted
4/20/2016
30
KNOWLEDGE WORKER WORKLOAD
0.00
0.20
0.40
0.60
0.80
1.00
1.20
0.00
0.20
0.40
0.60
0.80
1.00
1.20
1.00 8.00 16.00 32.00 48.00 64.00
Norm
alized L
ate
ncie
s w
rt P
CoIP
Seconds
#of VMs
GROUP A LATENCIES Lower is Better
BlastGPU BlastCPU PCoIP BlastGPU/PCoIP BlastCPU/PCoIP
31
KNOWLEDGE WORKER WORKLOAD
0.00
0.20
0.40
0.60
0.80
1.00
1.20
0.00
0.50
1.00
1.50
2.00
2.50
3.00
3.50
1.00 8.00 16.00 32.00 48.00 64.00
Norm
alized L
ate
ncie
s w
rt P
CoIP
Seconds
#of VMs
GROUP B LATENCIES Lower is Better
BlastGPU BlastCPU PCoIP BlastGPU/PCoIP BlastCPU/PCoIP

32
HEAVY VIDEO WORKLOAD

33
NVIDIA GPU SPECIFICATIONS
NVidia GPU Tesla M60
H264 1080p30 Streams: 36
CUDA Cores: 4096/GPU(2x2048)
Concurrent Users/GPU: 2-32
VMware Testbed Configuration
vGPU Type: GRID M60-0q
GPUs/Board: 2
# of Boards: 2
CONFIDENTIAL 3
3
34
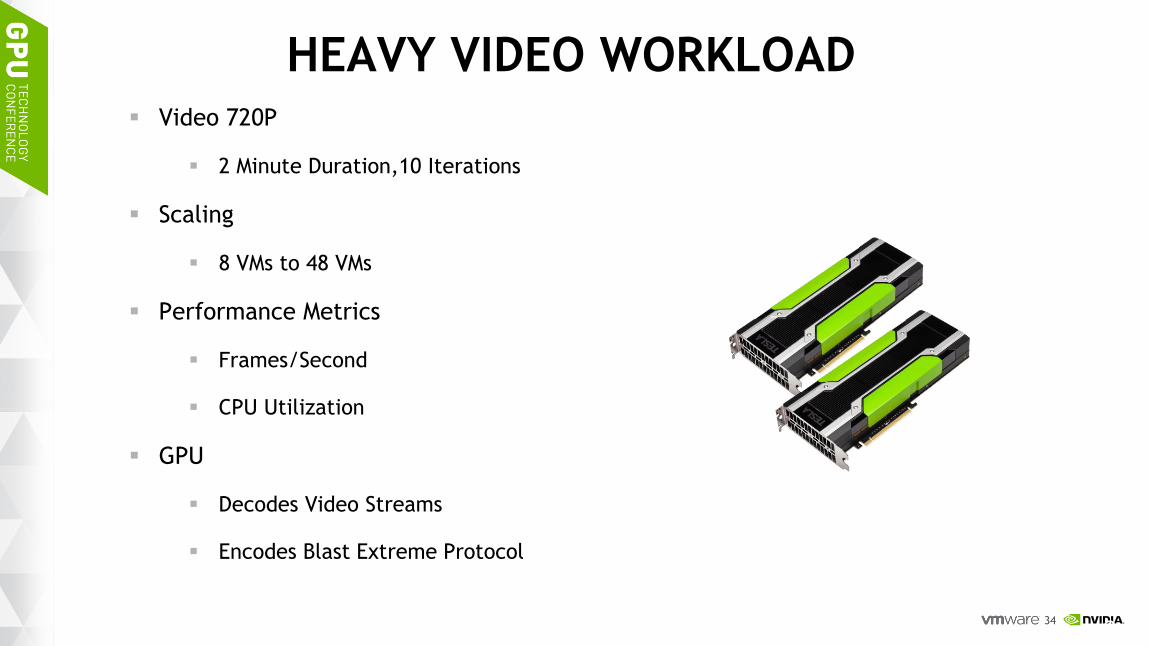
HEAVY VIDEO WORKLOAD Video 720P
2 Minute Duration,10 Iterations
Scaling
8 VMs to 48 VMs
Performance Metrics
Frames/Second
CPU Utilization
GPU
Decodes Video Streams
Encodes Blast Extreme Protocol
CONFIDENTIAL 3
4

35
VIDEO WORKLOAD
0.00
0.50
1.00
1.50
2.00
2.50
3.00
3.50
4.00
4.50
0
100
200
300
400
500
600
700
800
8 16 32 48
Norm
alized F
PS w
rt P
CoIP
Cum
ula
tive F
PS
#of VMs
Cumulative Frames/Second Higher is Better
BlastGPU BlastCPU PCoIP BlastGPU/PCoIP BlastCPU/PCoIP Linear (BlastGPU/PCoIP)

36
VIDEO WORKLOAD
0.00
0.50
1.00
1.50
2.00
2.50
3.00
0
20
40
60
80
100
120
8 16 32 48
Norm
alized A
vera
ge C
PU
Uti
l. w
rt
PC
oIP
%C
PU
Uti
lizati
on
#of VMs
Average CPU Utilization Lower is Better
BlastGPU BlastCPU PCoIP BlastGPU/PCoIP BlastCPU/PCoIP Linear (BlastGPU/PCoIP)
37
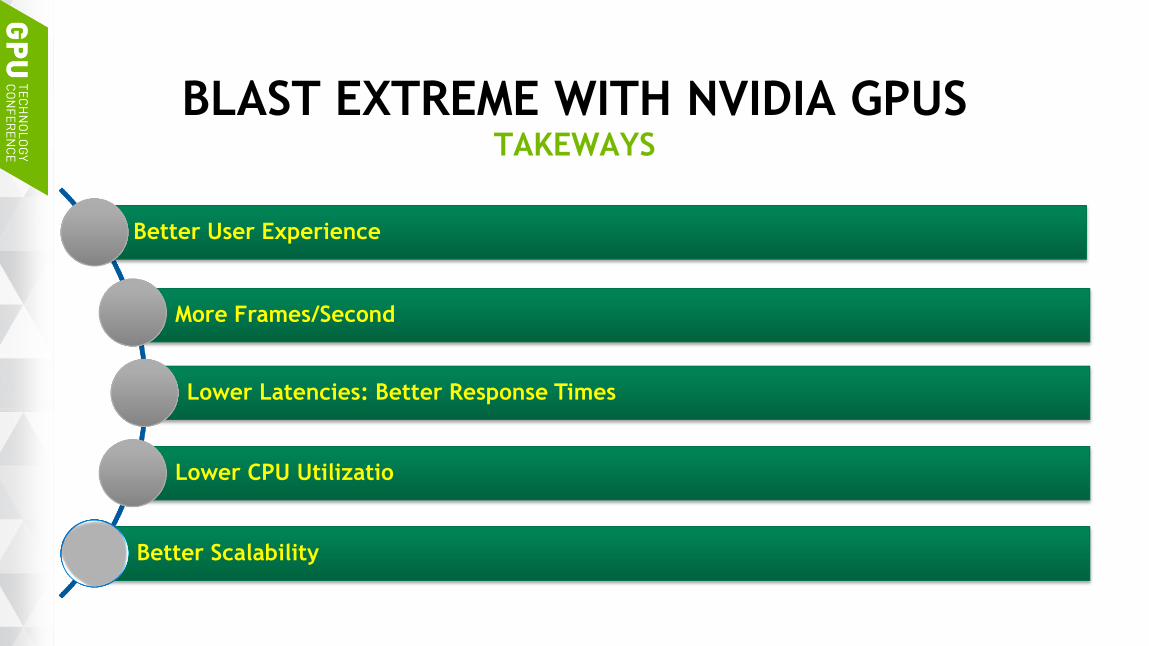
BLAST EXTREME WITH NVIDIA GPUS TAKEWAYS
Better User Experience
More Frames/Second
Lower Latencies: Better Response Times
Lower CPU Utilizatio
Better Scalability
38
RELATED SESSIONS
TUTORIAL S6595 - Benchmarking Graphics Intensive Application on VMware Horizon 6 Using NVIDIA GRID™ vGPUs by ManVender Rawat and Lan VU
S6198 - The Latest in High Performance Desktops with VMware Horizon and NVIDIA GRID™ vGPU by Pat Lee and Luke Wignall

April 4-7, 2016 | Silicon Valley
THANK YOU
JOIN THE NVIDIA DEVELOPER PROGRAM AT developer.nvidia.com/join

40
SECTION DIVIDER OR TRANSITION SLIDE
41
BLAST EXTREME WITH NVIDIA GPUS
Blast Extreme with NVIDIA GPUS
Better User Experience
More frames/seconds
Lower Latencies ( Better Response Times)
Lower CPU Utilization
Better Scalability
42
CONTENT SLIDE: 36 PT BLACK, TREBUCHET FONT BOLD, UP TO 2 LINES MAXIMUM
Body/bullet text no longer has a bullet icon
Use 20 pt font
No sub-bullets allowed
No more than five bullets; one idea per bullet
Example of highlighted text
Subtitle: 24 pt, one line maximum
43
PHTOSHOP OPENGL WORKLOAD
44
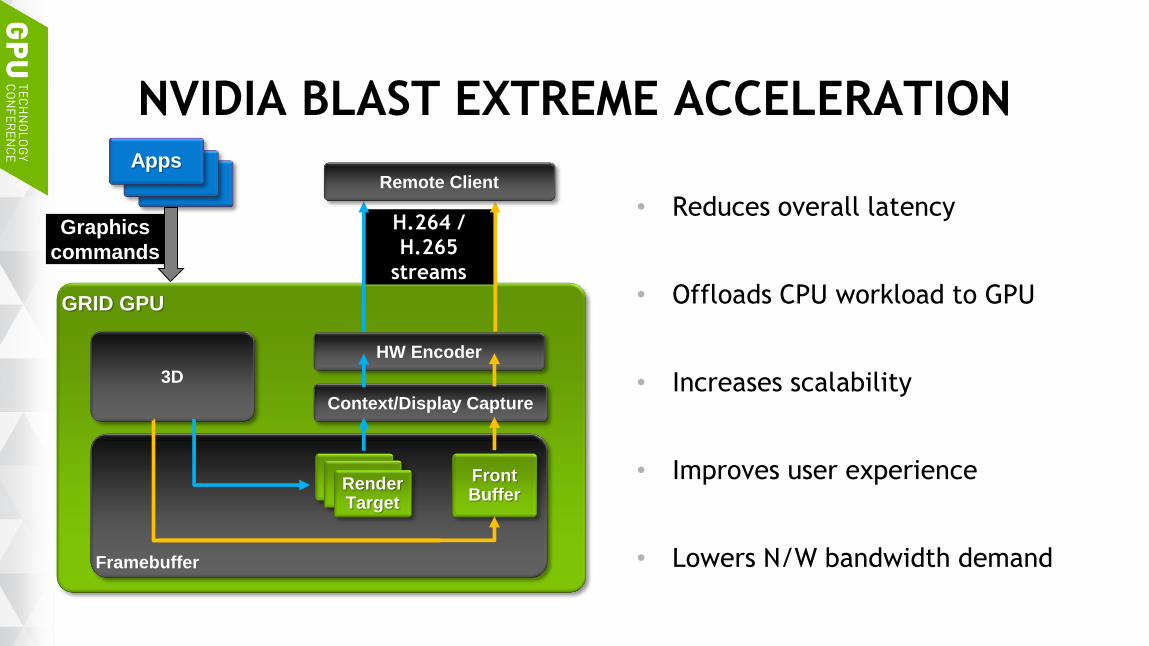
NVIDIA BLAST EXTREME ACCELERATION
• Reduces overall latency
• Offloads CPU workload to GPU
• Increases scalability
• Improves user experience
• Lowers N/W bandwidth demand
GRID GPU
3D
HW Encoder
Framebuffer
Apps Apps
Apps
Graphics
commands
Context/Display Capture
Render Target
Front Buffer
H.264 /
H.265
streams
Remote Client


