36
Real Sector and R&D Investment Policy: Basic Institutional Models Dr. Svetlana Kirdina Institute of Economics, Russian Academy of Sciences, Moscow
| Date post: | 24-Dec-2015 |
| Category: |
Documents |
| Upload: | amberlynn-moore |
| View: | 217 times |
| Download: | 1 times |

Real Sector and R&D Investment Policy:Basic Institutional Models
Dr. Svetlana KirdinaInstitute of Economics,
Russian Academy of Sciences, Moscow

AFEE Boston January 3, 2015
Motivation

AFEE Boston January 3, 2015
Economic Growth in Mainstream Economics
• Generally, the study of economic growth in mainstream economics explicitly or implicitly assumes the domain of neoclassical market model where the growth is the product of innovation activity of competing firms. This assumption is deemed to be a fundamental truth. This approach assumes that the government shall just search for the optimal level of interfering into the economy, which allows the whole economy to overcome all sorts of obstacles and traps for the stable economic growth.

AFEE Boston January 3, 2015
Role of Governments
• At the same time, there is another point of view on the problem of the government, markets and economic growth. It is based on the fact that we need to examine carefully the empirical data in order to understand where and when government economic intervention is good, and where and when it is bad, as well as the way it affects the overall economic growth (Fligstein, 2005).
AFEE Boston January 3, 2015
Outline
• Institutional models of real sector and R&D financing
• Empirical data and research• “A state as a main investor” and “a state as a
regulator” – two institutional models• Conclusion

AFEE Boston January 3, 2015
Institutional Model is…
• The term “institutional model” is understood here as the structure of key institutions providing finance for a real sector and R&D serving further as a technological base for an economic growth. These institutions nominate the structure of major sources that are investing in the spheres.

AFEE Boston January 3, 2015
Main Hypothesis
• Institutional models define the macroeconomic policies for economic growth financing. The hypothesis is tested that two institutional models could be singled out, so called “a state as a main investor” and “a state as a regulator”.

AFEE Boston January 3, 2015
Test of Hypothesis
• We carried out empirical-statistical investigation to check the hypothesis.
• Two countries – Russia and the U.S., with traditionally opposed ways of organizing of economic life, have been chosen a priori for the analysis.
• Three spheres such as 1) fixed investment financing in real sector, 2) R&D financing, and 3) banking systems in Russia and the U.S. were analyzed.

AFEE Boston January 3, 2015
Data about the Dynamics of Real Sector Financing, the U.S.
• Table 752. Corporate Funds - Sources and Uses. U.S. Census Bureau, Statistical Abstracts of the United States. Covers nonfarm nonfinancial corporate business (excluding individual businessmen and small enterprises).

AFEE Boston January 3, 2015
Data about the Dynamics of Real Sector Financing, Russia
• Composition of fixed investment according to financing sources, billions of rubles. Federal State Statistics Service of the Russian Federation web-site. Covers companies of all forms of ownership (excluding small business entities) including profit and non-profit organizations and all branches among them financial and agricultural enterprises .

AFEE Boston January 3, 2015
Problems for Statistical Comparative Analysis
• It is evident that the comparison of fixed investment source structures in Russia and the U.S. is made difficult by the different structure of data obtained by the Federal State Statistics Service of the Russian Federation and U.S. Census Bureau.
• Inconsistency of data structure for survey entities and peculiarities of external financing sources grouping outlined, impose certain restrictions on comparative analysis of the Russian Federation and the U.S. statistical data. Nevertheless, it is possible to do it (keeping these restrictions in mind).

AFEE Boston January 3, 2015
USA: Corporate Funds – Sources and Uses, current prices, %
1990 … 1995 … 2000… 2005… 2010…
Funds for investment, total 100 100 100 100 100
Internal funds (+IVA), including 69.8 60.9 45.2 65.0 58.8
- profits after tax and dividends 4.4 11.4 13.8 10.3 11.3
-capital consumption allowance58.0 44.3 31.4 28.1 36.6
Net increase in liabilities, including
30.2 39.1 54.8 46.9 41.2
- Net funds raised in markets 11.8 17.9 -5.6 -0.9 4.0
among them: FDI 9.7 5.5 12.6 4.8 8.4

AFEE Boston January 3, 2015
Structure Analysis of Real Sector Financing Sources in the U.S.
• Internal corporate financing sources have been dominating (60% on average and over 90% in 2009 e.g.).
• The biggest percentage of internal investment sources is comprised of capital consumption allowance (more than one half of corporate internal financing sources with maximum of 75-85%).
• The raised funds in the form of credits, loans, security yields, foreign direct investment and other liabilities amount in general to less than one half.
• The level of FDI is at 10% on average.
AFEE Boston January 3, 2015
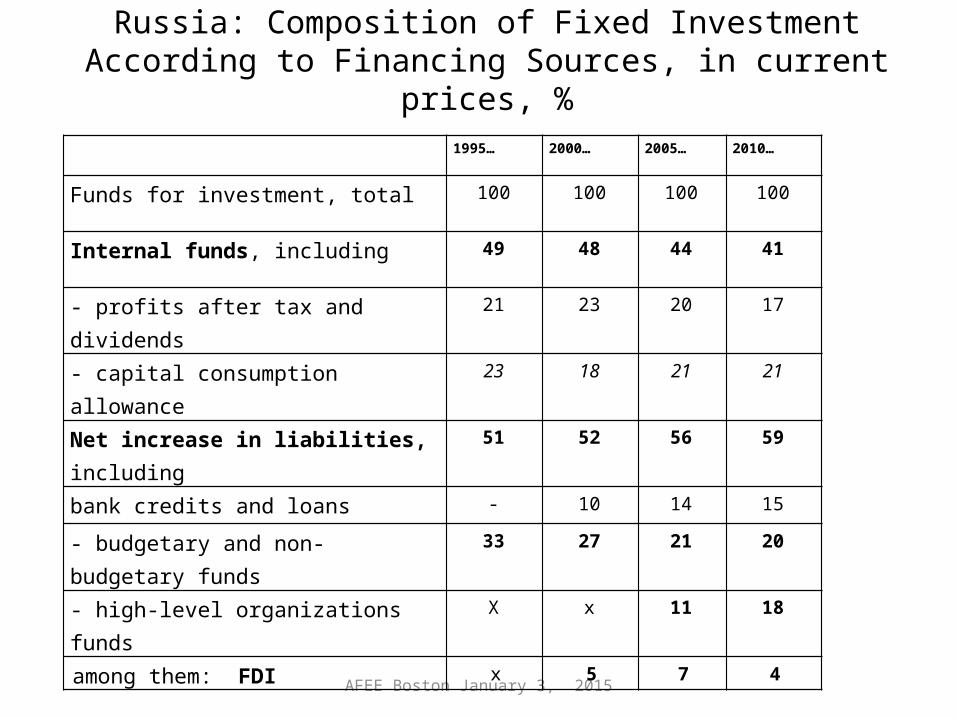
Russia: Composition of Fixed Investment According to Financing Sources, in current prices, %
1995… 2000… 2005… 2010…
Funds for investment, total 100 100 100 100
Internal funds, including 49 48 44 41
- profits after tax and dividends 21 23 20 17
- capital consumption allowance 23 18 21 21
Net increase in liabilities, including
51 52 56 59
bank credits and loans - 10 14 15
- budgetary and non-budgetary funds
33 27 21 20
- high-level organizations funds Х х 11 18
among them: FDI x 5 7 4
AFEE Boston January 3, 2015
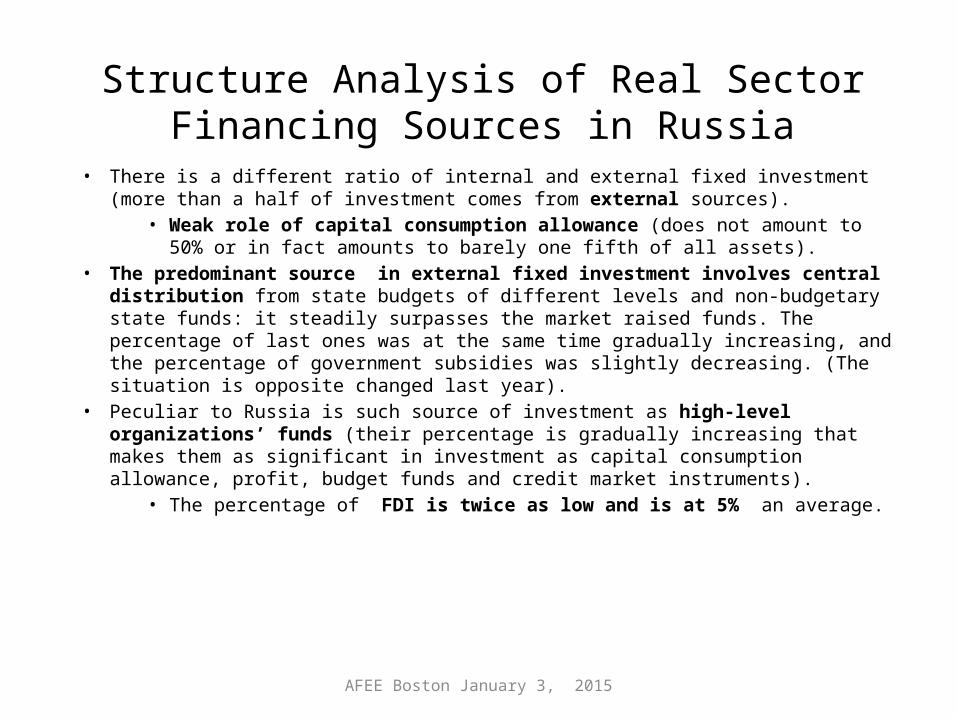
Structure Analysis of Real Sector Financing Sources in Russia
• There is a different ratio of internal and external fixed investment (more than a half of investment comes from external sources).
• Weak role of capital consumption allowance (does not amount to 50% or in fact amounts to barely one fifth of all assets).
• The predominant source in external fixed investment involves central distribution from state budgets of different levels and non-budgetary state funds: it steadily surpasses the market raised funds. The percentage of last ones was at the same time gradually increasing, and the percentage of government subsidies was slightly decreasing. (The situation is opposite changed last year).
• Peculiar to Russia is such source of investment as high-level organizations’ funds (their percentage is gradually increasing that makes them as significant in investment as capital consumption allowance, profit, budget funds and credit market instruments).
• The percentage of FDI is twice as low and is at 5% an average.
AFEE Boston January 3, 2015
Why the Structures are Different?
• To better understand the outlined differences let’s compare the investment of Russia and the U.S. in terms of property forms although statistical views for property forms in Russia and the U.S. are not completely identical.

AFEE Boston January 3, 2015
Gross Fixed Investment in the U.S., 2003-2013, %.
Source: Table 5.9. Changes in Net Stock of Produced Assets (Fixed Assets and Inventories)
Private sector 77-84%
Government sector 16-23%

AFEE Boston January 3, 2015
The Dynamics of Fixed Investment in Russia, 2003-2013, %,
based on Property Types
- state property from 27 to 17
- municipal property from 6 to 3
- private property from 34 to 61- mixed property (no foreign participation) from 32 to 12
- state corporations’ propertyfrom 0 to 5
- joint property (with foreign participation) from 1 to 4

AFEE Boston January 3, 2015
Paradoxes of Statistics
• According to official statistics, the share of fixed investments in privately owned enterprises in Russia now makes 61%, compared to 77% in the U.S. Does it mean that there was a corresponding decrease in the share and the impact of the government institutions in the investment process? Detailed analysis of the organization of statistical accounting in modern Russia forces to put this statement in doubt.
AFEE Boston January 3, 2015
A Latent State Property 1/2• Firstly, in accordance with the rules of Property type code assignment
being in effect on the territory of the Russian Federation, sometimes private property is not always private in every sense of this word. For example, mixed property types include those founded by parties with governmental (federal, regional) and other structures, according to these rules. But if legal entities with any type of mixed property found other economic entities, the latter are considered in our statistics as private property enterprises. It is obvious that in such cases the function of the first-order founders (governmental structures) is preserved though officially this organization is recognized in statistics as pure private property.

AFEE Boston January 3, 2015
A Latent State Property 2/2
• The second example is the property codification of joint stock companies established in the course of privatization with a golden share in state property. According to the rules mentioned, such companies are identified as one of mixed property types, though it is more correct to identify them as modified state property.
• Thirdly, the joint (with foreign participation) property includes enterprises established not only by private but also public institutions with foreign capital.

AFEE Boston January 3, 2015
What is the Reason for the Presence of Property Types Other than State and Private Property?
• Is the only reason the transitional character of the Russian Federation economy? But there is no such structure nowadays in the Eastern Europe countries that moved over from “socialism” to “capitalism” – their statistics on the matters discussed strictly reproduce that of the U.S.
• It is characteristic that unlike western neighboring countries of Russian Federation, the statistics of the People’s Republic of China points out the same property types. The large-sized grouping includes state, municipal, private, mixed Chinese, joint Chinese and foreign property.

AFEE Boston January 3, 2015
Ambiguity of Property Types in Russia
• The main difficulties are linked with a persistent inability to isolate economic and property rights of any entity from state participation. Over the whole period of the Russian history due to the fact that “the state property even with some legal entity based on it remained the state property anyway” (Legal Entity Status (textbook), 2006, p. 4).
• Therefore, in the statistics the property types could not be fully segregated onto private and state types due to a number of intermediate types.

AFEE Boston January 3, 2015
More State than Our Statistics Shows
• Taking into consideration the rules of Property type code assignment being in effect on the territory of the Russian Federation as well as a historical aspect it is possible to assume that the role of state funds in real sector financing in Russia is underrated.

AFEE Boston January 3, 2015
Institutional Models ”A State as an Investor” and ”A State as a Regulator”
• The real sector financing in Russia is based predominantly on the institutional model “a state as an investor”.
• The institutional model “a state as a regulator” dominates in the U.S.

AFEE Boston January 3, 2015
Institutional Model ”A State as an Investor”
• The advantages of the institutional model “a state as an investor” are central resource’s support of the branches with the highest priority and evasion from cyclical changes.
• At the same time its main problems are insufficient motivation of would-be innovators, risk of corruption, and investment thieving at the local levels. It is noted in many expert’s publications (see Yanrui Wu, Zhengxu Wang, Dan Luo, 2009).
AFEE Boston January 3, 2015
Institutional Model ”A State as a Regulator”
• The advantages of the “a state as a regulator” model are high investment activity of market entities and in this respect a higher rate of technological progress. It is the decentralization in some experts’ opinion that provides permanent innovation flow for market economies (Kornai, 2012).
• The problems of this model in real sector financing are cyclicality and financial bubbles risks (Perez, 2002), that emerge in the stock markets as a result of profit pursuit by isolated market entities.

AFEE Boston January 3, 2015
Structure of R&D investment

AFEE Boston January 3, 2015
Government Share in the Structure of R&D Investment
• Russia - 66.5%• the U.S.- 27.1 %

AFEE Boston January 3, 2015
Structure of Russian Banking
2000 2001 2002 2003 2004 2005 2006 2007 2008 2009 2010 20110%
10%
20%
30%
40%
50%
60%
70%
80%
90%
100%
Foreign-controlled banks
Private domestic banks
Other state-controlled banks
Core state-controlled banks
AFEE Boston January 3, 2015
Government Share in Banking System
• Russia - 54.5%• the U.S.- 0 %

AFEE Boston January 3, 2015
External (not internal) financing sources have been dominating (more than a half)
Internal (not external) private corporate financing sources have been dominating (60-90%)
The predominant source in external fixed investment involves central distribution from state budgets of different levels and non-budgetary state funds: it steadily surpasses the market raised funds.
The main part of external sources are raised funds in the form of credits, loans, security yields, foreign direct investment and other liabilities
FDI = 5% FDI = 10%State expenses prevails in R&D ( 66%) Low share of state expenses in R&D (27%)The significant role of the state in banking The significant role of private banks in bankingMain focus of investment policy - state programs and a budget control
Main focus of investment policy – law legislation and rules for businness
A State as the Main Investor A State as a Regulator

AFEE Boston January 3, 2015
Complementarity of Two Institutional Models
• Struggling with the risks of the model “a state as an investor” implies the improvement of itself as well as the necessary compensating action of the alternative model “a state as a regulator”.
• The institutional model “a state as a regulator” risk reduction is achieved by its improvement as well as by incorporation of the alternative “a state as an investor” model complementing the general practice of real sector financing in the countries with market based economy.

AFEE Boston January 3, 2015
Conclusion• Comparative statistical data and analytical survey show that it is
possible to distinguish two basic institutional models in real sector and R&D financing namely “a state as a main investor” and “a state as a regulator”. Even though they do not exist separately but rather coexist, one of the models usually dominates over the other one.
• The dominating position of any of the models is related to social, economic and political structure as a whole and the type of a predominant institutional matrix (Kirdina, 2001, 2014). It is reasonable to keep in mind the mentioned differences during the institutional overview of economic growth problems and mechanisms.

AFEE Boston January 3, 2015
See more in:
• Kirdina, Svetlana, Vernikov, Andrey. Evolution of the Banking System in the Russian Context: An Institutional Analysis.// Journal of Economic Issues. Vol. 47, № 2. June 2013. P. 475-484.
• Kirdina, Svetlana. Institutional Matrices Theory as a Framework for Analysis of S&T Policy. In: Socio Economic and Technological Innovation: Mechanism and Institutions. / Eds. K. Mandal, N. Asheulova, and S. Kirdina. Narosa Publishing House Pvt. Ltd. , 2014. P. 189-199.
• Kirdina, Svetlana. Economic Policy for Real Sector and R&D Financing: Basic Institutional Models. // Montenegrin Journal of Economics. Vol. 9, No. 4 (December 2013). P. 39-52.

AFEE Boston January 3, 2015
www.kirdina.ru
Thank you for your attention!


