Real-time beat tracking for drumless audio signals: Chord change detection for musical decisions Masataka Goto * , Yoichi Muraoka School of Science and Engineering, Waseda University, 3-4-1 Ohkubo, Shinjuku-ku, Tokyo 169-8555, Japan Received 29 December 1997; received in revised form 18 September 1998 Abstract This paper describes a real-time beat-tracking system that detects a hierarchical beat structure in musical audio signals without drum-sounds. Most previous systems have dealt with MIDI signals and had diculty in applying, in real time, musical heuristics to audio signals containing sounds of various instruments and in tracking beats above the quarter-note level. Our system not only tracks beats at the quarter-note level but also detects beat structure at the half- note and measure levels. To make musical decisions about the audio signals, we propose a method of detecting chord changes that does not require chord names to be identified. The method enables the system to track beats at dierent rhythmic levels – for example, to find the beginnings of half notes and measures – and to select the best of various hypotheses about beat positions. Experimental results show that the proposed method was eective to detect the beat structure in real-world audio signals sampled from compact discs of popular music. Ó 1999 Elsevier Science B.V. All rights reserved. Keywords: Beat tracking; Rhythm perception; Chord change detection; Music understanding; Computational auditory scene analysis 1. Introduction One of the goals of computational auditory scene analysis is to implement a computational model that can understand musical audio signals in a human-like fashion. A popular approach to this goal is to build an automatic music transcription system, or a sound source separation system, which typically transforms audio signals into a symbolic representation such as a musical score or MIDI data. Although such detailed- transcription technologies are important, they have diculty in dealing with compact disc audio signals in general. Because only a trained listener can identify the names of musical notes and chords, we can infer that musical transcription is a skill dicult even for human beings to acquire. On the other hand, an untrained listener understands music to some extent without mentally repre- senting audio signals as musical scores. For example, even a listener who cannot identify chord names can perceive harmony and chord changes. A listener who cannot segregate and identify every musical note can nevertheless track musical beats and keep time to music by hand-clapping or foot-tapping. We therefore Speech Communication 27 (1999) 311–335 * Corresponding author. Present address: Machine Understanding Division, Electrotechnical Laboratory, 1-1-4 Ume zono, Tsukuba, Ibaraki 305-8568, Japan. Tel.: +81-298-54-5898; fax: +81-298-54-3313; e-mail: [email protected]0167-6393/99/$ – see front matter Ó 1999 Elsevier Science B.V. All rights reserved. PII: S 0 1 6 7 - 6 3 9 3 ( 9 8 ) 0 0 0 7 6 - 4
Transcript
Real-time beat tracking for drumless audio signals:Chord change detection for musical decisions
Masataka Goto *, Yoichi Muraoka
School of Science and Engineering, Waseda University, 3-4-1 Ohkubo, Shinjuku-ku, Tokyo 169-8555, Japan
Received 29 December 1997; received in revised form 18 September 1998
Abstract
This paper describes a real-time beat-tracking system that detects a hierarchical beat structure in musical audio
signals without drum-sounds. Most previous systems have dealt with MIDI signals and had di�culty in applying, in
real time, musical heuristics to audio signals containing sounds of various instruments and in tracking beats above the
quarter-note level. Our system not only tracks beats at the quarter-note level but also detects beat structure at the half-
note and measure levels. To make musical decisions about the audio signals, we propose a method of detecting chord
changes that does not require chord names to be identi®ed. The method enables the system to track beats at di�erent
rhythmic levels ± for example, to ®nd the beginnings of half notes and measures ± and to select the best of various
hypotheses about beat positions. Experimental results show that the proposed method was e�ective to detect the beat
structure in real-world audio signals sampled from compact discs of popular music. Ó 1999 Elsevier Science B.V. All
rights reserved.
Keywords: Beat tracking; Rhythm perception; Chord change detection; Music understanding; Computational auditory scene analysis
1. Introduction
One of the goals of computational auditory scene analysis is to implement a computational model thatcan understand musical audio signals in a human-like fashion. A popular approach to this goal is to buildan automatic music transcription system, or a sound source separation system, which typically transformsaudio signals into a symbolic representation such as a musical score or MIDI data. Although such detailed-transcription technologies are important, they have di�culty in dealing with compact disc audio signals ingeneral. Because only a trained listener can identify the names of musical notes and chords, we can inferthat musical transcription is a skill di�cult even for human beings to acquire.
On the other hand, an untrained listener understands music to some extent without mentally repre-senting audio signals as musical scores. For example, even a listener who cannot identify chord names canperceive harmony and chord changes. A listener who cannot segregate and identify every musical note cannevertheless track musical beats and keep time to music by hand-clapping or foot-tapping. We therefore
0167-6393/99/$ ± see front matter Ó 1999 Elsevier Science B.V. All rights reserved.
PII: S 0 1 6 7 - 6 3 9 3 ( 9 8 ) 0 0 0 7 6 - 4
think that it is important to ®rst build a computer system that can understand music at the level untrainedhuman listeners do, without relying on transcription, and then extend the system so that it can understandmusic at the higher level musicians do.
Our approach is to build a real-time beat-tracking system that detects a hierarchical beat structure ofthree rhythmic levels in real-world audio signals, such as those sampled from popular compact discs. Beattracking is an important part of the computational modeling of music understanding because the beat isfundamental, for both trained and untrained listeners, to the perception of Western music. The purpose ofthis study is to build such a beat-tracking system that is practical from the engineering viewpoint, that givessuggestions to the modeling of higher-level music understanding systems, and that is useful in variousapplications, such as music-synchronized CG animation, video/audio editing, and human-computer im-provisation in live ensemble. For this purpose it is desirable to detect a hierarchical beat structure, since ahigher structure like the measure (bar-line) level can provide information more useful for modeling musicunderstanding and for implementing beat-tracking applications. We therefore built a system that can trackbeats at three rhythmic levels: the quarter-note level, the half-note level, and the measure level. 1 The systemnot only ®nds the pulse sequence corresponding to the beats at the quarter-note level but also ®nds thebeginnings of half notes and measures under the assumption that the time-signature is 4/4.
To build a real-time system that can output its beat interpretation along to a real-time input, it isnecessary to utilize a beat-tracking algorithm that meets real-time requirements: it must process the inputsequentially rather than in a back-and-forth or all-at-once manner. Although several previous systems(Desain and Honing, 1989, 1994, 1995; Smith, 1996) did not address the issue of predicting the next beat, areal-time beat-tracking algorithm needs to do just that. Several systems (Lee, 1985; Dannenberg and Mont-Reynaud, 1987; Allen and Dannenberg, 1990; Driesse, 1991; Rosenthal, 1992a,b; Desain, 1992; Rowe,1993; Large, 1995) provide this capacity even if the real-time versions of their systems were not necessarilyimplemented. Since it is impossible to backtrack in performing beat tracking in real-time, several authors(Allen and Dannenberg, 1990; Rosenthal, 1992a,b) clari®ed the need for a strategy of pursuing multiplehypotheses in parallel and built their systems on such a strategy. Furthermore, Rosenthal (1992a,b) ad-dressed the issue we are considering, detecting a hierarchical beat structure. Those systems, however, dealtwith MIDI signals or clean onset times as their input. Since it is quite di�cult to obtain complete MIDIrepresentations from audio data, they cannot immediately be applied to complex audio signals.
Although several systems (Schloss, 1985; Katayose et al., 1989; Vercoe, 1994; Scheirer, 1996) dealt withaudio signals, most of them did not consider higher-level musical structure such as the half-note andmeasure levels. Todd (1994, 1995) and Todd and Brown (1996) tackled this issue of detecting a hierarchicalmusical structure in a bottom-up fashion by using a multiscale smoothing model applied to onsets that weredetected by a model of human auditory periphery. Previous practical MIDI-based systems (Allen andDannenberg, 1990; Driesse, 1991; Rosenthal, 1992a,b) that employed musical heuristics to determine amore appropriate beat structure, in particular in situations when beat interpretation is ambiguous, haveshown that a top-down process using musical heuristics provides more informative cues that a beat-tracking system can use to make appropriate musical decisions. It was di�cult, however, to apply suchmusical heuristics to audio signals because of the di�culty of extracting musical elements such as chordsand melodies in real-world audio signals.
We therefore developed a real-time beat-tracking system for audio signals (Goto and Muraoka,1994, 1995a,b) under the assumption that the input contained drum-sounds (a bass drum and a snaredrum). That system, though, was generally not able to track beats in audio signals without drum-sounds
1 Although our system does not rely on score representation, for convenience here we use score-representing terminology like that
used by Rosenthal (1992a,b). In our formulation the quarter-note level indicates the temporal basic unit that a human feels in music
and that usually corresponds to a quarter note in scores.
312 M. Goto, Y. Muraoka / Speech Communication 27 (1999) 311±335
because it relied on musical knowledge related to drum patterns. It was also unable to detect the beatstructure at the measure level.
In the following sections we describe how we extended our previous system so that it can deal withdrumless audio signals and detect the hierarchical beat structure comprising the three rhythmic levels in realtime. We propose a method of detecting chord changes to make musical decisions about the audio signalsby using heuristic musical knowledge. Because our method takes advantage of not requiring chord namesto be identi®ed, it can be applied to complex audio signals sampled from compact discs, signals in whichchord identi®cation is generally di�cult.
2. Beat-tracking problem
In this section we specify the beat-tracking problem that we are dealing with and present the maindi�culties of tracking beats.
2.1. Problem speci®cation
In our formulation, beat tracking is de®ned as a process that organizes music into a hierarchical beatstructure with three levels of rhythm: the quarter-note level, the half-note level and the measure level(Fig. 1). The ®rst step in solving our beat-tracking problem is thus obtaining an appropriate sequence ofbeat times in an input musical audio signal. We de®ne beat times as the temporal positions of almostregularly spaced beats corresponding to quarter notes, and the sequence of beat times is called the quarter-note level. The second step in solving our problem is then ®nding the beginnings of half notes andmeasures. The sequence of half-note times (temporal positions of strong beats 2) is obtained by deter-mining whether a beat is strong or weak (half-note-level type). The sequence of measure times (temporalpositions of the beginnings of measures) is obtained by determining whether a half note is the beginning orthe middle of a measure (measure-level type). The sequence of half-note times is called the half-note level
Fig. 1. Beat-tracking problem.
2 Under the assumption that the time-signature of an input song is 4/4, in this paper a strong beat is either the ®rst or third quarter
note in a measure; a weak beat is the second or fourth.
M. Goto, Y. Muraoka / Speech Communication 27 (1999) 311±335 313
and the sequence of measure times is called the measure level. Both half-note-level and measure-level typesare called beat types.
To solve this problem, we assume that the time-signature of an input song is 4/4 and that its tempo isconstrained to be between 61 M.M. (M�alzel's Metronome: the number of quarter notes per minute) and120 M.M. and to be roughly constant. We also presuppose that a large class of popular music withoutdrum-sounds has harmony transitions and chord changes.
2.2. Acoustic beat-tracking issues
Problematic issues that must be dealt with when tracking the hierarchical beat structure in real-worldmusical acoustic signals are (1) detecting beat-tracking cues in audio signals, (2) examining multiple hy-potheses about beat positions and (3) making musical decisions. The simple technique of peak-®nding witha threshold is not su�cient because there are many energy peaks that are not directly related to beats.Multiple interpretations of beats are possible at any given point because there is not necessarily a singlespeci®c sound that directly indicates the beat position. There are various ambiguous situations, such as oneswhere several events obtained by frequency analysis may correspond to a beat and where di�erent inter-beatintervals (the temporal di�erence between two successive beats) seem plausible. In addition, it is necessaryto make context-dependent decisions, such as determining the half-note-level and measure-level types anddetermining which is the best interpretation in an ambiguous situation.
In detecting tracking cues, it is necessary to detect several cues for di�erent purposes: ®nding beat timesand tracking the higher-level beat structure. Our previous system (Goto and Muraoka, 1995b) found beattimes by ®rst using frequency analysis to detect onset times and then using autocorrelation and cross-correlation of the onset times. The cues for tracking the higher-level beat structure of drumless audiosignals, however, were not dealt with.
The multiple-hypothesis issue was addressed in our previous system (Goto and Muraoka,1994, 1995a, 1996) by managing multiple agents that, according to di�erent strategies, examined parallelhypotheses about beat positions. This multiple-agent architecture enables the system to cope with di�cultbeat-tracking situations: even if some agents lose track of beats, the system will track beats correctly as longas other agents maintain the correct hypothesis.
In making musical decisions, our previous system (Goto and Muraoka, 1995a,b) made use of pre-stored drum patterns, matching them with the drum pattern currently detected in the input signal. Al-though this method was e�ective, it of course cannot be applied to the drumless audio signals we areconsidering here.
In this paper we address the main issue in extending our previous system to drumless audio signals andto higher-level beat structure. The issue is that higher-level processing using musical knowledge in additionto lower-level signal processing is indispensable for tracking the higher-level beat structure and determiningwhich is the best interpretation of beat positions in an ambiguous situation. Musical knowledge that isuseful for analyzing musical scores or MIDI signals, however, cannot be immediately applied to raw audiosignals because of the di�culty of obtaining MIDI-like representations of those signals.
3. Chord change detection for musical decisions
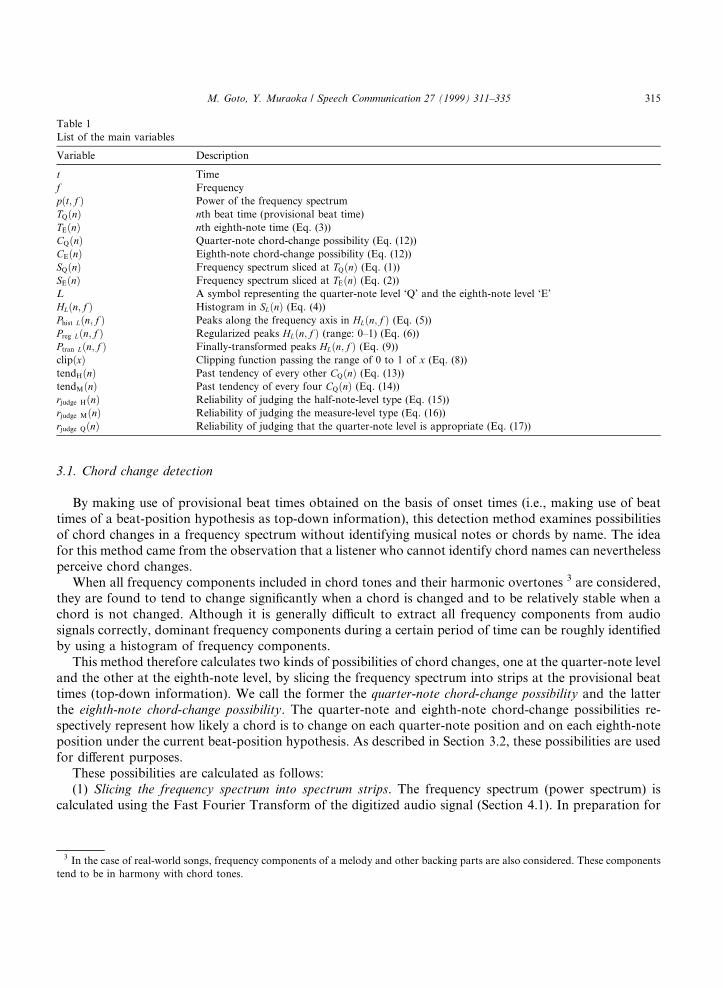
To address the above-mentioned higher-level processing issue, we propose a method for making musicaldecisions based on chord changes. In the following sections, we ®rst describe a method of obtaining beat-tracking cues for the higher-level beat structure by detecting chord changes (Section 3.1) and then explain away of making semantic decisions (musical decisions) by using heuristic musical knowledge based on thosechord changes (Section 3.2). The main variables used in this section are listed in Table 1.
314 M. Goto, Y. Muraoka / Speech Communication 27 (1999) 311±335
3.1. Chord change detection
By making use of provisional beat times obtained on the basis of onset times (i.e., making use of beattimes of a beat-position hypothesis as top-down information), this detection method examines possibilitiesof chord changes in a frequency spectrum without identifying musical notes or chords by name. The ideafor this method came from the observation that a listener who cannot identify chord names can neverthelessperceive chord changes.
When all frequency components included in chord tones and their harmonic overtones 3 are considered,they are found to tend to change signi®cantly when a chord is changed and to be relatively stable when achord is not changed. Although it is generally di�cult to extract all frequency components from audiosignals correctly, dominant frequency components during a certain period of time can be roughly identi®edby using a histogram of frequency components.
This method therefore calculates two kinds of possibilities of chord changes, one at the quarter-note leveland the other at the eighth-note level, by slicing the frequency spectrum into strips at the provisional beattimes (top-down information). We call the former the quarter-note chord-change possibility and the latterthe eighth-note chord-change possibility. The quarter-note and eighth-note chord-change possibilities re-spectively represent how likely a chord is to change on each quarter-note position and on each eighth-noteposition under the current beat-position hypothesis. As described in Section 3.2, these possibilities are usedfor di�erent purposes.
These possibilities are calculated as follows:(1) Slicing the frequency spectrum into spectrum strips. The frequency spectrum (power spectrum) is
calculated using the Fast Fourier Transform of the digitized audio signal (Section 4.1). In preparation for
SQ�n� Frequency spectrum sliced at TQ�n� (Eq. (1))
SE�n� Frequency spectrum sliced at TE�n� (Eq. (2))
L A symbol representing the quarter-note level `Q' and the eighth-note level `E'
HL�n; f � Histogram in SL�n� (Eq. (4))
Phist L�n; f � Peaks along the frequency axis in HL�n; f � (Eq. (5))
Preg L�n; f � Regularized peaks HL�n; f � (range: 0±1) (Eq. (6))
Ptran L�n; f � Finally-transformed peaks HL�n; f � (Eq. (9))
clip�x� Clipping function passing the range of 0 to 1 of x (Eq. (8))
tendH�n� Past tendency of every other CQ�n� (Eq. (13))
tendM�n� Past tendency of every four CQ�n� (Eq. (14))
rjudge H�n� Reliability of judging the half-note-level type (Eq. (15))
rjudge M�n� Reliability of judging the measure-level type (Eq. (16))
rjudge Q�n� Reliability of judging that the quarter-note level is appropriate (Eq. (17))
3 In the case of real-world songs, frequency components of a melody and other backing parts are also considered. These components
tend to be in harmony with chord tones.
M. Goto, Y. Muraoka / Speech Communication 27 (1999) 311±335 315
calculating the quarter-note chord-change possibility CQ�n�, the frequency spectrum is sliced into spectrumstrips SQ�n� at the quarter-note times (beat times):
SQ�n� � fp�t; f � jTQ�n�6 t < TQ�n� 1�g; �1�where TQ�n� is the nth beat time and p�t; f � is the power of the spectrum of frequency f at time t. 4 Inpreparation for calculating the eighth-note chord-change possibility CE�n�, on the other hand, the spectrumis sliced into spectrum strips SE�n� at the eighth-note times TE�n� interpolated from TQ�n�:
SE�n� � fp�t; f � jTE�n�6 t < TE�n� 1�g; �2�
TE�n� � TQ�n=2� �n mod 2 � 0�;�TQ��nÿ 1�=2� � TQ��n� 1�=2��=2 �n mod 2 � 1�:
��3�
Fig. 2 shows an example of a frequency spectrum sliced into spectrum strips. As shown in Fig. 2(b), thefrequency spectrum shown in Fig. 2(a) is sliced at the eighth-note times interpolated from the provisionalbeat times.
(2) Forming histograms. The system forms histograms HQ�n; f � and HE�n; f � (after this, we will useabbreviations such as HL�n; f � �L � Q;E�) summed up along the time axis of the corresponding strip SQ�n�and SE�n�:
HL�n; f � �XTL�n�1�ÿgapL�n�
t�TL�n��gapL�n�p�t; f �; �4�
Fig. 2. Example of a frequency spectrum sliced into spectrum strips. (a) Frequency spectrum; (b) frequency spectrum sliced at the
eighth-note times TE(n).
4 f and t are integers, and 1f and 1t are respectively equal to the frequency resolution (10.77 Hz) and the discrete time step (11.61 ms).
316 M. Goto, Y. Muraoka / Speech Communication 27 (1999) 311±335
where gapL�n� is a margin that was introduced in order to avoid in¯uences of noises and unstable frequencycomponents around the note onset and that was empirically determined as gapL�n� � �TL�n� 1� ÿ TL�n��=5.Fig. 3(a) shows the histograms formed from the spectrum strips shown in Fig. 2(b).
(3) Detecting dominant frequencies. First, peaks Phist L�n; f � along the frequency axis in HL�n; f � are givenby
Fig. 3. Forming histograms and detecting dominant frequencies. (a) Histogram HE�n; f � in each spectrum strip SE�n�; (b) peaks
Phist E�n; f � in each histogram HE�n; f �; (c) regularized peaks Preg E�n; f �; (d) transformed peaks Ptran E�n; f � continuing during silent
periods.
M. Goto, Y. Muraoka / Speech Communication 27 (1999) 311±335 317
Phist L�n; f � � HL�n; f � if HL�n; f �P HL�n; f � 1�;0 otherwise:
��5�
Our current implementation considers only peaks whose frequency is between 10 Hz and 1 kHz. Thesepeaks can be considered the frequencies of the dominant tones in each strip and tend to correspond tofrequency components of a chord or a melody. Fig. 3(b) shows peaks along the frequency axis in eachhistogram shown in Fig. 3(a).
The peaks Phist L�n; f � are then regularized into Preg L�n; f �, which take values between 0 and 1. To avoidamplifying unnecessary noise peaks that appear during a musically silent period such as a rest, the systemcalculates Preg L�n; f � as a value relative to the recent maximum Mrecent L�n� of Phist L�n; f �. In addition, theclipping function clip(x) (Eq. (8)) is applied after multiplying this relative value by a constant gain ratioGainRatio so that the absolute values of dominant peaks of Preg L�n; f � are large enough. We can thusexpress the regularized peaks Preg L�n; f � as
Preg L�n; f � � clip GainRatioPhist L�n; f �Mrecent L�n�
� �; �6�
Mrecent L�n� � max maxf�Phist L�n; f ��; AttnRatio Mrecent L�n
�ÿ 1�
�; �7�
clip�x� �0 �x < 0�;x �06 x6 1�;1 �1 < x�;
8<: �8�
where AttnRatio is a constant attenuation ratio which determines how long the previous local maximuma�ects the current value of the recent maximum and which will also be utilized in Eq. (11). The value ofGainRatio was constrained to be at least 1 and the value of AttnRatio was constrained to be at least 0 andless than 1; those values were empirically set at GainRatio � 5 and AttnRatio � 0:99. Fig. 3(c) shows theregularized peaks calculated from the peaks shown in Fig. 3(b).
Finally the transformed peaks Ptran L�n; f � in each strip are calculated so that the previous peaksPtran L�nÿ 1; f � can be regarded as continuing during a relatively silent period in which the sum of the peaksPreg L�n; f � is low:
Ptran L�n; f � � Preg L�n; f � ifP
f Preg L�n; f �P SilentThresP
f Ptran L�nÿ 1; f �;Ptran L�nÿ 1; f � otherwise;
��9�
where SilentThres is a constant threshold used as the criterion for the silent period and was empirically setat 0:1. This transformation makes it possible to prevent the chord-change possibilities from increasingrapidly after every silent period. The transformed peaks shown in Fig. 3(d) were obtained from Fig. 3(c)and continue during silent periods.
(4) Comparing frequencies between adjacent strips. The chord-change possibilities are calculated bycomparing peaks between adjacent strips: Ptran L�nÿ 1; f � and Ptran L�n; f �. When a chord is changed at theboundary time TL�n� between those strips, the peaks in Ptran L�n; f � tend to di�er from those inPtran L�nÿ 1; f �. Therefore, the chord-change possibility CL�n� is obtained as the result of normalizing thepositive peak di�erence Pdiff L�n� given by Eq. (10). In order to normalize Pdiff L�n� into the range of 0±1, thesystem calculates Pdiff L�n� as a value relative to the recent maximum Mdiff L�n� of Pdiff L�n�. Thus both thequarter-note chord-change possibility CQ�n� and the eighth-note chord-change possibility CE�n� are givenby Eq. (12).
318 M. Goto, Y. Muraoka / Speech Communication 27 (1999) 311±335
Fig. 4 shows examples of two kinds of chord-change possibilities obtained by the above method. Thethin vertical lines in (a) represent the quarter-note times TQ�n� and those in (b) represent the eighth-notetimes TE�n�. The beginning of measure occurs at every four quarter-note times from the extreme left in (a),and the beat occurs at every two eighth-note times from the extreme left in (b). In both (a) and (b), thehorizontal lines above represent the peaks Ptran L�n; f � in each strip and the thick vertical lines below showthe chord-change possibility CL�n�.
3.2. Musical decisions
Utilizing the two kinds of chord-change possibilities, the system tracks the higher-level beat structure(i.e., determines the half-note times and the measure times) and selects the best of various agent-generated
Fig. 4. Examples of peaks in sliced frequency spectrum and of chord-change possibilities. (a) Examining quarter-note chord-change
M. Goto, Y. Muraoka / Speech Communication 27 (1999) 311±335 319
hypotheses about beat positions. For these purposes, we introduce the following two kinds of heuristicmusical knowledge.
(1) Quarter-note-level knowledge. Chords are more likely to change at the beginnings of measures than atother positions. In other words, the quarter-note chord-change possibility tends to be higher on a strongbeat than on a weak beat and higher on the strong beat at the beginning of a measure than on the otherstrong beat in the measure.
(2) Eighth-note-level knowledge. Chords are more likely to change on beats (quarter notes) than betweenadjacent beats. In other words, the eighth-note chord-change possibility tends to be higher on beats than oneighth-note displacement positions.
The system utilizes the quarter-note-level knowledge to detect the higher-level beat structure. It ®rstcalculates tendH�n�, which represents a past tendency of every other quarter-note chord-change possi-bility, and tendM�n�, which represents a past tendency of every four quarter-note chord-change possi-bility:
where PastWeight is a weight factor determining how much the past values (of CQ�n�) are taken intoconsideration and NowWeight is a weight factor determining how much the current value (of CQ�n�) istaken into consideration. Those constant values were empirically set at PastWeight � 0:99 andNowWeight � 0:2. The value of tendH�n� thus becomes higher when CQ�n� tends to be higher on a strongbeat, which occurs on every other quarter note, and the value of tendM�n� becomes higher when CQ�n� tendsto be higher on the beginning of a measure, which occurs on every fourth quarter note.
If tendH�n� ÿ tendH�nÿ 1� > TendThresH, the system judges that the position of a half-note time isTQ�n�, where TendThresH (� 0.3) is a constant threshold for this judgement. If TQ�n� is a half-note timeand tendM�n� ÿ tendM�nÿ 2� > TendThresM, the system judges that the position of a measure time isTQ�n�, where TendThresM (� 0.2) is a constant threshold. The reliabilities of these judgements are de®nedas
rjudge M�n� � clip�jtendM�n� ÿ tendM�nÿ 2�j�: �16�Using the previous positions of a half-note time and a measure time, the system determines the following
beat types (half-note-level type and measure-level type) under the assumptions that strong and weak al-ternate on beat times and that beginning and middle alternate on half-note times.
To select the best hypothesis, the system utilizes the eighth-note-level knowledge. As described in Sec-tion 4.2, the ®nal output is determined on the basis of the appropriate hypothesis that has the highestreliability. To evaluate the reliability of a hypothesis, the system calculates rjudgeQ�n�, which is the reliabilityof the judgement that TQ�n� (� TE�2n�) is the position of a beat:
If rjudge Q�n� becomes high enough (i.e., the eighth-note chord-change possibility tends to be higher on beatsthan on other positions), the reliability value is increased so that the system can select the hypothesis underwhich the appropriate CE�n� is obtained. The reliability is also evaluated from di�erent viewpoints asdescribed in Section 4.2.
320 M. Goto, Y. Muraoka / Speech Communication 27 (1999) 311±335
4. System description
This section brie¯y describes our beat-tracking system for musical audio signals without drum-sounds. 5
It provides, as real-time output, a description called beat information (BI) that consists of the beat time, itsbeat types, and the current tempo. Fig. 5 shows an overview of the system. The system ®rst digitizes aninput audio signal in the A/D conversion stage. Then in the frequency analysis stage, multiple onset-time®nders detect onset times in di�erent ranges of the frequency spectrum, and those results are transformedinto vectorial representation (called onset-time vectors) by onset-time vectorizers. In the beat predictionstage, the system manages multiple agents that, according to di�erent strategies, make parallel hypothesesbased on those onset-time vectors. Each agent ®rst calculates the inter-beat interval and predicts the nextbeat time. By communicating with a chord change checker, it then determines the beat types and evaluatesthe reliability of its own hypothesis. A hypotheses manager gathers all hypotheses and then determines the®nal output on the basis of the most reliable one. Finally, in the BI Transmission stage, the system transmitsBI to application programs via a computer network.
4.1. Frequency analysis
In the frequency analysis stage, the frequency spectrum and several sequences of N-dimensional onset-time vectors are obtained for later processing (Fig. 6). The full frequency band is split into several
Fig. 5. Overview of our beat-tracking system.
5 For detailed descriptions of our beat-tracking system for audio signals that include drum-sounds, see (Goto and Muraoka,
1995a,b).
M. Goto, Y. Muraoka / Speech Communication 27 (1999) 311±335 321
frequency ranges, and each dimension of the onset-time vectors corresponds to a di�erent frequencyrange. This representation makes it possible to consider onset times of all the frequency ranges at thesame time.
4.1.1. Fast Fourier transform (FFT)The frequency spectrum is calculated with the FFT using the Hanning window. Each time the FFT is
applied to the input signal, the window is shifted to the next frame.In our current implementation, the input signal is digitized at 16 bit/22.05 kHz, and two kinds of FFT
are calculated. One FFT, for extracting onset components in the Frequency analysis stage, is calculatedwith a window size of 1024 samples, and the window is shifted by 256 samples. The frequency resolution isconsequently 21.53 Hz and the discrete time step (1 frame-time 6) is 11.61 ms. The other FFT, for examiningchord changes in the Beat prediction stage, is simultaneously calculated in audio down-sampled at 16 bit/
Fig. 6. Examples of a frequency spectrum and of an onset-time vector sequence.
6 The frame-time is the unit of time used in our system, and the term time in this paper is the time measured in units of the frame-time.
322 M. Goto, Y. Muraoka / Speech Communication 27 (1999) 311±335
11.025 kHz with a window size of 1024 samples, and the window is shifted by 128 samples. The frequencyresolution and the time step are consequently 10.77 Hz and 1 frame-time.
4.1.2. Extracting onset componentsThe frequency component p�t; f � that meets the following Condition (18) is extracted as an onset
component.
min�p�t; f �; p�t � 1; f �� > pp; �18�pp � max�p�t ÿ 1; f �; p�t ÿ 1; f � 1��: �19�
The degree of onset d�t; f � (rapidity of increase in power) is given by
d�t; f � � max�p�t; f �; p�t � 1; f �� ÿ pp if Condition �18� is fulfilled;0 otherwise:
��20�
4.1.3. Onset-time ®ndersMultiple onset-time ®nders (seven in our current implementation) detect onset times in several frequency
ranges (0±125 Hz, 125±250 Hz, 250±500 Hz, 500 Hz±1 kHz, 1±2 kHz, 2±4 kHz, and 4±11 kHz). Each onsettime is given by the peak time found by peak-picking in the sum D�t� along the time axis, whereD�t� �Pf d�t; f �. The sum D�t� is linearly smoothed with a convolution kernel before its peak time iscalculated. Limiting the frequency range of
Pf makes it possible to ®nd onset times in the di�erent fre-
quency ranges.
4.1.4. Onset-time vectorizersEach onset-time vectorizer transforms the results of all onset-time ®nders into a sequence of onset-time
vectors: the same onset times in all the frequency ranges are put together into one vector. In the currentsystem, three vectorizers transform onset times from seven ®nders into three sequences of seven-dimen-sional onset-time vectors with the di�erent sets of frequency weights (focusing on all, low, and middlefrequency ranges) (Goto and Muraoka, 1996). These results are sent to agents of the beat prediction stage.
4.2. Beat prediction
Multiple agents interpret the sequences of onset-time vectors according to di�erent strategies andmaintain their own hypotheses (Goto and Muraoka, 1994, 1995a, 1996). Each hypothesis consists of apredicted next-beat time, its beat types (half-note-level type and measure-level type), and the current inter-beat interval (Fig. 7). These hypotheses are gathered by the manager and the most reliable one is consideredthe system output.
All agents are grouped into pairs. 7 The two agents in a pair examine the same inter-beat interval andcooperatively predict the time of the next beat; their two predictions will always di�er by half the inter-beatinterval. For this purpose, one agent interacts with the other through a prediction ®eld, which is an ex-pectancy curve 8 that represents the time that the next beat is expected to occur (Fig. 8). The height of eachlocal peak in the prediction ®eld can be interpreted as the probability that the next beat is at that position.The two agents interact with each other by inhibiting each other's prediction ®eld: the beat time of the
7 In our current implementation there are twelve agents grouped into six pairs.8 Other systems (Desain, 1992; Desain and Honing, 1994; Vercoe, 1994) have used a similar expectancy-curve concept for predicting
future events but not for managing interactions between agents.
M. Goto, Y. Muraoka / Speech Communication 27 (1999) 311±335 323
hypothesis of each agent reduces the probability of a beat in the temporally corresponding neighborhood inthe other's ®eld.
For each agent, the following four parameters determine its strategy for making the hypothesis (Fig. 7).Initial settings of the parameters are listed in Table 2.
Table 2
Initial settings of the strategy parameters
Pair-agent Frequency focus type Auto-correlation period (f.t.) Inter-beat interval range (f.t.) Initial peak selection
1±1 Type-all 500 43±85 Primary
1±2 Type-all 500 43±85 Secondary
2±1 Type-all 1000 43±85 Primary
2±2 Type-all 1000 43±85 Secondary
3±1 Type-low 500 43±85 Primary
3±2 Type-low 500 43±85 Secondary
4±1 Type-low 1000 43±85 Primary
4±2 Type-low 1000 43±85 Secondary
5±1 Type-mid 500 43±85 Primary
5±2 Type-mid 500 43±85 Secondary
6±1 Type-mid 1000 43±85 Primary
6±2 Type-mid 1000 43±85 Secondary
`f.t.' is the abbreviation of frame-time (11.61 ms).
Fig. 7. Relations between onset-time vectorizers, agents, and chord change checkers.
Fig. 8. Agent interaction through a prediction ®eld.
324 M. Goto, Y. Muraoka / Speech Communication 27 (1999) 311±335
(1) Frequency focus type. This parameter determines which vectorizer an agent receives onset-timevectors from. Its value is chosen from among type-all, type-low and type-mid, respectively corresponding tovectorizers focusing on all frequency ranges, low frequency ranges and middle frequency ranges.
(2) Autocorrelation period. This parameter determines the window size for calculating the vectorial au-tocorrelation (described later) of the onset-time vector sequence. The greater its value, the older the onset-time information considered.
(3) Inter-beat interval range. This parameter controls the range of possible inter-beat intervals. As de-scribed later, it limits the range in the result of the vectorial autocorrelation, within which a peak is selected.
(4) Initial peak selection. This parameter takes a value of either primary or secondary. When the value isprimary, the largest peak in the prediction ®eld is initially selected and considered the next beat time; whenthe value is secondary, the second-largest peak is initially selected. This selection helps generate a variety ofhypotheses.
4.2.1. Beat-predicting agentsEach agent makes a hypothesis as follows and sends it to both the one-to-one corresponding chord-
change checker and the manager.(1) Determining the inter-beat interval. To determine the inter-beat interval, each agent receives the se-
quence of onset-time vectors and calculates its vectorial autocorrelation. 9 The windowed and normalizedvectorial autocorrelation function Ac�s� is de®ned as
where o~�t� is the N-dimensional onset-time vector at time t, c is the current time and AcPeriod is thestrategy parameter autocorrelation period (Goto and Muraoka, 1996). The window function win�t; s� whosewindow size s is given by
win�t; s� � 1:0ÿ 0:5t=s 06 t6 s;0 otherwise:
��22�
The inter-beat interval is given by s with the maximum height in Ac�s� within the range limited by theparameter inter-beat interval range. If the reliability of a hypothesis becomes high enough, its agent tunesthis parameter to narrow the range of possible inter-beat intervals so that it examines only a neighborhoodof the current appropriate one. This is e�ective in stabilizing the beat-tracking output because the auto-correlation result tends to contain several unnecessary and confusing peaks around the correct peak pur-sued by an agent whose hypothesis has a high reliability.
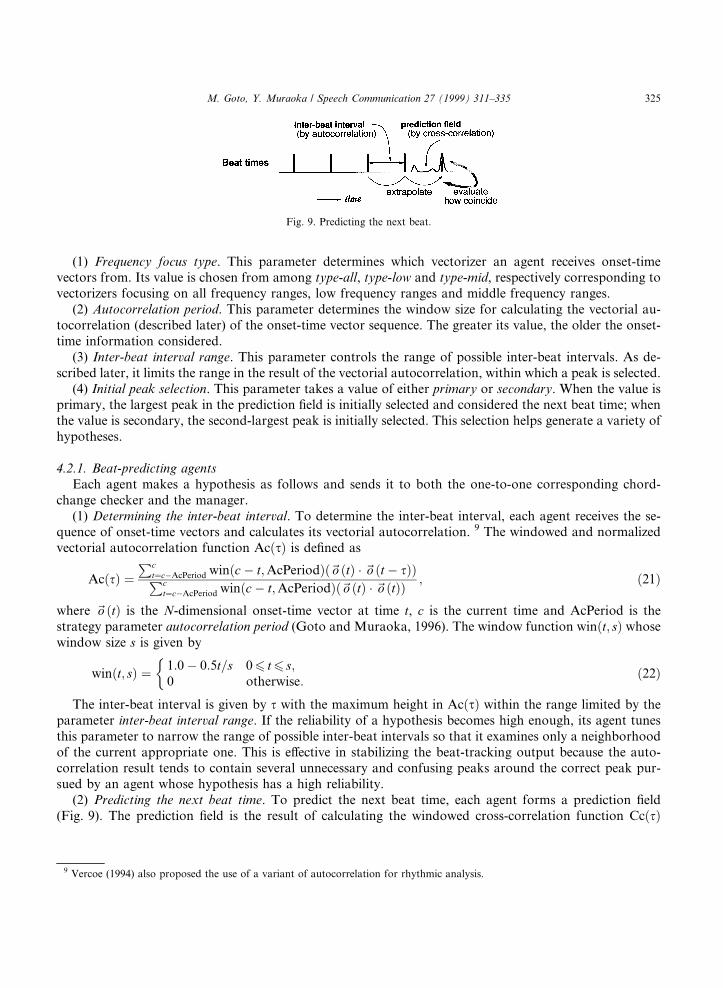
(2) Predicting the next beat time. To predict the next beat time, each agent forms a prediction ®eld(Fig. 9). The prediction ®eld is the result of calculating the windowed cross-correlation function Cc�s�
Fig. 9. Predicting the next beat.
9 Vercoe (1994) also proposed the use of a variant of autocorrelation for rhythmic analysis.
M. Goto, Y. Muraoka / Speech Communication 27 (1999) 311±335 325
between the sum O�t� of all dimensions of o~�t� and the provisional beat-time sequence Ttmp�t;m� whoseinterval is the inter-beat interval obtained using Eq. (21):
where I�t� is the inter-beat interval at time t, CcPeriod (� CcNumBeats I�c�) is the window size for cal-culating the cross-correlation, and CcNumBeats (� 12) is a constant factor that determines how manyprevious beats are considered in calculating the cross-correlation. The prediction ®eld is thus given by Cc�s�where 06 s6 I�c� ÿ 1.
Each agent then selects the next beat time from local peaks in the prediction ®eld after the ®eld is in-hibited by its paired agent. When the reliability of a hypothesis is low, the agent initially selects the peak inthe prediction ®eld according to the parameter initial peak selection and then tries to pursue the peak closeto the sum of the previously selected one and the inter-beat interval.
(3) Judging the beat types. Each agent determines the beat types of the predicted beat time according tothe half-note time and the measure time. As described in Section 3.2, these times are obtained from thequarter-note chord-change possibility received from the corresponding chord-change checker.
(4) Evaluating the reliability of its own hypothesis. Each agent ®nally evaluates the reliability of its hy-pothesis in the following three steps. First, the reliability is evaluated according to how the next beat timepredicted on the basis of the onset times coincides with the time extrapolated from the past beat times(Fig. 9). If they coincide, the reliability is increased; otherwise, the reliability is decreased. Second, thereliability is evaluated according to how appropriate the eighth-note chord-change possibility is. Ifrjudge Q�n� (de®ned in Section 3.2) is high enough, the reliability is increased; otherwise, the reliability isdecreased. Third, the reliability is evaluated according to how appropriate the quarter-note chord-changepossibility is. If rjudge H�n� is high enough, the reliability is increased a little.
4.2.2. Chord change checkersEach chord-change checker examines the two kinds of chord-change possibilities as described in Section
3.1. It analyzes the frequency spectrum on the basis of beat times (top-down information) received from theone-to-one corresponding agent, and it sends the possibilities back to the agent (Fig. 7).
4.2.3. Hypotheses managerThe manager classi®es all agent-generated hypotheses into groups according to beat time and inter-beat
interval. Each group has an overall reliability given by the sum of the reliabilities of the group's hypotheses.The manager then selects the dominant group that has the highest reliability. Since an incorrect group couldbe selected if temporarily unstable beat times split the appropriate dominant group, the manager repeatsgrouping and selecting three times while narrowing the margin of beat times allowable for being classi®edinto the same group. The reliable hypothesis in the most dominant group is thus selected as the output andsent to the BI Transmission stage.
The manager updates the beat types in the output using only the beat types that were labeled whenrjudge H�n� and rjudge M�n� were high compared with the recent maximum, since the beat types labeled by eachagent might be incorrect because of a local irregularity of chord changes or a detection error.
326 M. Goto, Y. Muraoka / Speech Communication 27 (1999) 311±335
5. Experiments and results
In the following, we ®rst describe an experimental result of testing the proposed method of detectingchord changes (Section 5.1) and then show the overall beat detection rates of the system implemented on aparallel computer, the Fujitsu AP1000 10 (Section 5.2). We then report the result of our attempt to evaluatethe di�culty of tracking beats in an input audio signal (Section 5.3) and describe an experimental result ofevaluating the contribution of the proposed method of making musical decisions based on chord changes(Section 5.4). Finally, we summarize those results and introduce a beat-tracking application (Section 5.5).
5.1. Testing chord change detection
We tested the basic performance of the method of chord-change detection proposed in Section 3.1 byusing a random chord progression. This chord progression consisted of one hundred chord transitions of101 chords that were randomly selected from sixty kinds of chords: the twelve kinds of root (A, A], B, C,C], D, D], E, F, F], G, G]) with the ®ve chord types (major triad, minor triad (m), dominant 7th chord (7),minor 7th chord (m7), major 7th chord (M7)). These chords were so selected that the adjacent chords weredi�erent. Using a synthesizer's piano tone, we played them in the basic root position (close positionvoicing). The fundamental frequency of the chord root note was between 110 Hz and 208 Hz. To examinethe case in which the chord did not change, we played each chord twice with the duration of a quarter note(600 ms) under the tempo 100 MM.
The mean, standard deviation (SD), maximum, and minimum of the quarter-note chord-change pos-sibility CQ�n� and the eighth-note chord-change possibility CE�n� obtained when the appropriate beat timeswere provided for slicing the frequency spectrum are listed in Table 3. The `CH' and `NC' of the CQ�n� inTable 3 are respectively the CQ�n� when a chord was changed at TQ�n� and the CQ�n� when a chord was notchanged at TQ�n�. The values listed in these columns indicate that the CQ�n� at chord changes (CH) wereappropriately high.
On the other hand, the `on TQ�n�' and `o� TQ�n�' of the CE�n� respectively mean the CE�n� on beats(n mod 2 � 0) and the CE�n� on eighth-note displacement positions (n mod 2 � 1). In the case of the `onTQ�n�', because the chord-change case (CH) alternated with the no-chord-change case (NC), these caseswere also analyzed separately. The values listed in these columns indicate that chord changes were ap-propriately detected using CE�n�. The CE�n� of NC of `on TQ�n�' tended to be higher than the CE�n� of `o�TQ�n�' because the chord notes were always played at a beat time, whereas all frequency componentspresent on an eighth-note displacement position persisted from the previous beat time.
Table 3
Results of testing chord change detection
CQ�n� CE�n�CH NC on TQ�n� (CH, NC) o� TQ�n�
mean 0.73 0.01 0.56 (0.81, 0.30) 0.03
SD 0.22 0.02 0.29 (0.18, 0.08) 0.05
max. 1.00 0.10 1.00 (1.00, 0.48) 0.21
min. 0.28 0.00 0.12 (0.37, 0.12) 0.00
CH: chord change. NC: no chord change.
10 The AP1000 (Ishihata et al., 1991) consists of 64 processing elements and its performance is at most 960 MIPS and 356 MFLOPS.
Although the AP1000 had relatively huge computing power when we started our research ®ve years ago, those values of the AP1000's
performance imply that our system might now be implemented on an up-to-date personal computer.
M. Goto, Y. Muraoka / Speech Communication 27 (1999) 311±335 327
5.2. Overall result
We ®rst introduce the method we used for evaluating our system and then report beat detection rates ofsongs, how quickly the system started to track the correct beats, and how accurately the system obtainedthe beat, half-note, and measure times.
5.2.1. Evaluation methodWe designed a measure for analyzing the beat-tracking accuracies at the quarter-note, half-note, and
measure levels. The basic concept of this measure is to compare the beat times of the system output (theexamined times) 11 with the hand-labeled beat times (the correct times). In other words, we consideredsubjective hand-labeled beat positions to be the correct beat times. Since the beat is a perceptual conceptthat a person feels in music, it is generally di�cult to de®ne the correct beat in an objective way.
To label the correct beat positions, we developed a beat-position editor program that enables a user tomark the beat positions in a digitized audio signal while listening to the audio and watching its waveform.The positions can be ®nely adjusted by playing back the audio with click tones at beat times, and the useralso de®nes a hierarchical beat structure ± the quarter-note, half-note, and measure levels ± correspondingto the audio signal. This enables the correct beat times to be more accurate than the results of humantapping containing relatively large timing deviations.
The beat-tracking accuracies are each represented as a measurement set {Q, H, M}�f; l; r;M �, whereQ[ ], H[ ], and M[ ] respectively represent the measures at the quarter-note, half-note, and measure levels.The term f � �ANs s, ANe s] is the correctly tracked period (the period between ANs and ANe in which the beatis tracked correctly). In particular, �ANs;ÿ� means that the beat-tracking system keeps on tracking thecorrect beat if once it starts to track the correct one at ANs. The terms l, r and M are respectively the mean,standard deviation, and maximum of the normalized di�erence (deviation error) between the correct timeand the examined time. If the normalized di�erence is 1, it indicates that the di�erence is half the correctinter-beat interval. 12
5.2.2. Beat detection ratesWe tested the system on 40 songs, each at least one minute long, performed by 28 artists (Table 4). The
input monaural audio signals were sampled from commercial compact discs of popular music and con-tained the sounds of various instruments (but not drums). The time-signature was 4/4 and the tempi rangedfrom 62±116 MM and were roughly constant.
We judged that a song was tracked correctly at a certain rhythmic level if the corresponding measure-ment set of the song ful®lled fQ, H, Mg[[ANs < 45:0 s, ANe � ÿ], l < 0:2, r < 0:2, M < 0:35]. In our ex-periment the system correctly tracked beats at the quarter-note level in 35 of the 40 songs (87.5%) 13 andcorrectly tracked the half-note level in 34 of the 35 songs in which the correct beat times were obtained(97.1%) Moreover, it correctly tracked the measure level in 32 of the 34 songs in which the correct half-notetimes were obtained (94.1%) (Table 4).
The beat times were not obtained correctly in ®ve songs because onset times were very few and irregularor the tempo ¯uctuated temporarily. Consequently, the chord-change possibilities in those songs could notbe obtained appropriately because those possibilities depend on the beat times. The main reason that thehalf-note-level or measure-level type was incorrect in the other mistaken songs was inconsistency of chord
11 In evaluating the quarter-note, half-note and measure levels, we respectively use the beat, half-note and measure times.12 The detailed de®nition of this measure is described by Goto and Muraoka (1997).13 In evaluating the tracking accuracy of our system, we did not count unstably tracked songs (those for which correct beats were
obtained just temporarily).
328 M. Goto, Y. Muraoka / Speech Communication 27 (1999) 311±335
changes with the heuristic musical knowledge; there were songs where chords changed at every quarter-noteor every other quarter-note.
We then compared the performance of this system with that of our previous system (Goto and Muraoka,1995b) for music with drum-sounds. The previous system was also tested on the same 40 songs, and theresults of this comparison are listed in Table 5, which shows that the beat detection rates were remarkablyimproved by our system extension.
Table 4
Song list
Title (Artist) Result a Tempo (M.M.)
Ame (Chisato Moritaka) o o o 62
Konoyoruni (Yumi Tanimura) o o o 64
Suki (DREAMS COME TRUE) o o o 65
Anatawo Mitsumete (K.ODA) � � � 65
For You (Katsumi) o o o 68
Futari (Maki Ohguro) o o o 68
Mayonaka no Love Song (T-BOLAN) o o o 68
Kimini Aete (Tetsuya Komuro) o o o 70
Futarino Natsu (ZARD) o o o 72
Blue Star (Mayo Okamoto) o o o 72
Listen to me (ZARD) o o o 73
Harunohi (Miki Imai) � � � 74
No More Rhyme [Acoustic Mix] (Debbie Gibson) o o o 74
My Heart Ballad (Yoko Minamino) o o o 75
Love is... (B'z) o o o 75
Fubukino Nakawo (Yumi Matsutoya) o o o 76
Roots of The Tree (Naoto Kine) o o o 76
Itukano Merry Christmas [Reprise] (B'z) o o o 78
Now and Forever (Richard Marx) o o o 78
Dandelion ± Osozakino Tanpopo (Yumi Matsutoya) o o o 78
Afureru Omoino Subetewo... (Miho Morikawa) o o o 81
You're My Life (Komi Hirose) o o o 82
Alone (Heart) o o � 88
Ruriirono Chikyuu (Seiko Matsuda) � � � 88
Love ± Nemurezuni Kiminoyokogao Zuttomiteita ± (ZARD) o o o 89
Right Here Waiting (Richard Marx) � � � 89
Seasons (B'z) o o o 90
Strangers Of The Heart (Heart) o o o 91
Mitsumeteitaine (ZARD) o o o 92
Mia Maria (ORIGINAL LOVE) o o o 95
Anatani Aiwo (Yumi Tanimura) o o o 100
I Wish (Misato Watanabe) o o o 100
I Won't Hold You Back (TOTO) o o o 102
amour au chocolat (Miki Imai) o o o 106
Lazy Afternoon (STARDUST REVUE) o o o 108
Whispers (Fairground Attraction) o o � 111
Nijiwo Watarou (Hitomi Yuki) o o o 112
Too far gone (Incognito) � � � 112
Resistance (Tetsuya Komuro) o o o 115
Do You Want To Know A Secret (Fairground Attraction) o �� 116
a o o o: Song that was tracked correctly; o o �: Song that was not tracked at the measure level; o � �: Song that was not tracked at the
half-note level; � � �: Song that was not tracked at the quarter-note level.
M. Goto, Y. Muraoka / Speech Communication 27 (1999) 311±335 329
5.2.3. Tracking quicknessWe evaluated how quickly the system started to track the correct beats stably at each rhythmic level by
using the ANs of each measurement set. Fig. 10 shows the ANs of the songs correctly tracked at the quarter-note, half-note, and measure levels. The horizontal axis represents the song numbers (#) arranged in orderof ANs of the quarter-note level up to song #32. The mean, minimum, and maximum of the ANs of all thecorrectly tracked songs are listed in Table 6. In each song where the beat structure was eventually deter-mined correctly, the system initially had trouble determining a higher rhythmic level even though a lowerlevel was correct.
5.2.4. Tracking accuracyWe evaluated how accurate the examined times (the system output) were by using the l, r, and M of
each measurement set. Fig. 11 shows the l and M of the correctly-tracked songs at the three rhythmic
Fig. 10. Start time (ANs) of tracking the correct beats at the quarter-note, half-note and measure levels.
Table 6
Start time (ANs) of tracking the correct beats at the quarter-note, half-note and measure levels
Rhythmic level mean min max
Quarter-note level 10.71 s 0.79 s 35.77 s
Half-note level 14.70 s 3.42 s 42.56 s
Measure level 20.70 s 3.42 s 42.56 s
Table 5
Performance improvement compared to our previous system
Beat structure Proposed system Previous system (Goto and Muraoka, 1995b)
Measure level 32/34 songs 0/2 songs
(94.1%) (0.0%)
Half-note level 34/35 songs 2/9 songs
(97.1%) (22.2%)
Quarter-note level 35/40 songs 9/40 songs
(87.5%) (22.5%)
330 M. Goto, Y. Muraoka / Speech Communication 27 (1999) 311±335
levels. The horizontal axis represents the song numbers rearranged in order of l of the quarter-note level upto song #32. The mean, minimum, and maximum of l and M of all the correctly-tracked songs are listed inTables 7 and 8. The deviation error was at most 0.339 and those mean values were relatively small on theaverage.
Table 7
Mean, minimum and maximum of l at the quarter-note, half-note and measure levels
Rhythmic level mean min max
Quarter-note level 0.062 0.019 0.130
Half-note level 0.031 0.009 0.069
Measure level 0.015 0.005 0.036
Fig. 11. Mean (l) and maximum (M) of the deviation error at the quarter-note, half-note, and measure levels. (a) Quarter-note level
M. Goto, Y. Muraoka / Speech Communication 27 (1999) 311±335 331
5.3. Measuring rhythmic di�culty
It is important but very di�cult to measure the rhythmic di�culty of a real-world song from theviewpoint of the input of beat tracking, because the di�culty can be in¯uenced from various aspects ofsongs. We tried, as a ®rst step, to evaluate the power transition of the input audio signals. In terms of thepower transition of the audio signals, it is more di�cult to track beats of a song in which the power tends tobe lower on beats than between adjacent beats. In other words, the larger the number of syncopations, thegreater the di�culty of tracking beats.
We therefore consider di�erences between the power on beats and the power on other positions as ameasure of the rhythmic di�culty. This measure, called the power-di�erence measure, is calculated as fol-lows:
(1) Finding the local maximum of the power. Let powerinput�t� be the power of the input audio signal attime t. 14 We ®rst calculate two kinds of local maximum of the power, powbeat�n� representing the maximumpower on the nth beat and powother�n� representing the maximum power on positions between the nth beatand �n� 1�th beat:
powbeat�n� � maxTans�n��Ians�n�=4ÿPwMargin
t � Tans�n�ÿPwMargin�powerinput�t��; �26�
powother�n� � maxTans�n�1�ÿPwMargin
t � Tans�n��Ians�n�=4ÿPwMargin�powerinput�t��; �27�
where Tans�n� is the nth correct beat time of the quarter-note level and Ians�n� is the nth inter-beat interval(Fig. 12). PwMargin is a margin to obtain appropriate maximum values because the power of soundsplayed on the beat sometimes increases just before its beat time. In our current implementation, PwMarginis equal to 2 (23.22 ms).
(2) Calculating the normalized power di�erence of each beat. The normalized power di�erence diffpow�n�between powother�n� and powbeat�n� is then calculated:
diffpow�n� � 0:5powother�n� ÿ powbeat�n�
max�powother�n�; powbeat�n��� 0:5: �28�
(3) Calculating the mean of the normalized power di�erences in a song. We ®nally calculate the power-di�erence measure AveDiffpow, which is the mean of all the diffpow�n� in the song:
AveDiffpow � 1
N ÿ 1
XNÿ1
n�1
diffpow�n�; �29�
Table 8
Mean, minimum and maximum of M at the quarter-note, half-note and measure levels
Rhythmic level mean min max
Quarter-note level 0.223 0.053 0.339
Half-note level 0.101 0.026 0.174
Measure level 0.045 0.013 0.077
14 The time resolution of this measurement in our current implementation is 11.61 ms (� 256/22050 Hz).
332 M. Goto, Y. Muraoka / Speech Communication 27 (1999) 311±335
where N is the number of the correct beat times. The AveDiffpow takes a value between 0 (easiest) and 1(most di�cult). For a regular pulse sequence with a constant interval, for example, this measure takes avalue of 0. Practically speaking, the AveDiffpow of a song cannot be 1.
Using this power-di�erence measure, we evaluated the rhythmic di�culty of the 40 songs that we utilizedfor testing the beat-tracking system. Fig. 13 shows the histogram of AveDiffpow for all the songs. Althoughthis measure is not perfect for evaluating the rhythmic di�culty, it represents a meaningful step on the roadto measuring the beat-tracking di�culty in an objective way.
5.4. Evaluating the e�ectiveness of musical decisions
We tested the e�ectiveness of the musical decisions proposed in Section 3.2 in order to con®rm that thosedecisions based on chord-change possibilities contributed to the performance improvement in determiningeach level of the hierarchical beat structure. In this experiment, we disabled the system function of makingmusical decisions based on chord changes by setting 0 to the corresponding chord-change possibility (CQ�n�and/or CE�n�). The disabled system was tested on the same 40 songs utilized in the evaluation described inSection 5.2.
The results are listed in Table 9. In this time, in order to facilitate the performance comparison withinthe table, the percentages in parentheses indicate the ratio of the number of the correctly tracked songs to40 (the number of all the songs). This result shows that musical decision based on eighth-note-levelknowledge contributed the quarter-note-level performance and that musical decision based on quarter-note-level knowledge contributed the half-note-level and measure-level performances. This also shows thatboth of the chord-change possibilities are necessary for determining the hierarchical beat structure.
Fig. 12. Finding the local maximum of the power.
Fig. 13. Histogram of the power-di�erence measures for all the songs.
M. Goto, Y. Muraoka / Speech Communication 27 (1999) 311±335 333
5.5. Summary and beat-tracking application
The above-mentioned results show that the beat detection rates obtained in our evaluation with real-world audio signals were more than 87.5 percent and that the method of detecting chord changes andbasing musical decisions on chord changes were e�ective enough to contribute to determining the hierar-chical beat structure comprising the three rhythmic levels.
We have also developed an application that displays real-time computer graphics dancers whose motionschange in time to musical beats (Fig. 14). This application has shown that our system is useful in multi-media applications in which human-like hearing ability is desirable.
6. Conclusion
We have described the main beat-tracking problem in dealing with drumless audio signals, a solution tothat problem, and the con®guration and implementation of a real-time beat-tracking system. The experi-mental results with the proposed tracking-accuracy measurement set show that the system detected, inaudio signals sampled from compact discs of popular music, the hierarchical beat structure comprising thequarter-note, half-note, and measure levels at the accuracy more than 87.5%.
We proposed a method for detecting chord changes by analyzing the frequency spectrum sliced atprovisional beat times (top-down information). We think that such an approach, without chord nameidenti®cation, is meaningful because a person generally does not perceive music as musical symbols. This
Fig. 14. Virtual dancers synchronized with musical beats.
Table 9
Results of evaluating musical decision e�ectiveness
334 M. Goto, Y. Muraoka / Speech Communication 27 (1999) 311±335
method enabled our system to determine the beat types in audio signals without drum-sounds and to selectthe appropriate hypothesis from multiple agent-generated hypotheses.
We plan to upgrade the system by generalizing it to other musical genres and enabling it to follow tempochanges. Future work will include a study of making use of other higher-level musical structure and willinclude the application to various multimedia systems for which beat tracking is useful, such as systems forvideo/audio editing, controlling stage lighting, and synchronizing various computer graphics with music.
References
Allen, P.E., Dannenberg, R.B., 1990. Tracking musical beats in real time. In: Proceedings of the 1990 International Computer Music
Conference. pp. 140±143.
Dannenberg, R.B., Mont-Reynaud, B., 1987. Following an improvisation in real time. In: Proceedings of the 1987 International
Computer Music Conference. pp. 241±248.
Desain, P., 1992. Can computer music bene®t from cognitive models of rhythm perception?. In: Proceedings of the 1992 International
Computer Music Conference. pp. 42±45.
Desain, P., Honing, H., 1989. The quantization of musical time: A connectionist approach. Computer Music J. 13 (3), 56±66.
Desain, P., Honing, H., 1994. Advanced issues in beat induction modeling: syncopation, tempo and timing. In: Proceedings of the 1994
International Computer Music Conference. pp. 92±94.
Desain, P., Honing, H., 1995. Computational models of beat induction: the rule-based approach. Working Notes of the IJCAI-95
Workshop on Arti®cial Intelligence and Music. pp. 1±10.
Driesse, A., 1991. Real-time tempo tracking using rules to analyze rhythmic qualities. In: Proceedings of the 1991 International
Computer Music Conference. pp. 578±581.
Goto, M., Muraoka, Y., 1994. A beat tracking system for acoustic signals of music. In: Proceedings of the Second ACM International
Conference on Multimedia. pp. 365±372.
Goto, M., Muraoka, Y., 1995a. Music understanding at the beat level ± real-time beat tracking for audio signals ± . Working Notes of
the IJCAI-95 Workshop on Computational Auditory Scene Analysis. pp. 68±75.
Goto, M., Muraoka, Y., 1995b. A real-time beat tracking system for audio signals. In: Proceedings of the 1995 International Computer
Music Conference. pp. 171±174.
Goto, M., Muraoka, Y., 1996. Beat tracking based on multiple-agent architecture ± a real-time beat tracking system for audio signals.
In: Proceedings of the Second International Conference on Multiagent Systems. pp. 103±110.
Goto, M., Muraoka, Y., 1997. Issues in evaluating beat tracking systems. Working Notes of the IJCAI-97 Workshop on Issues in AI
and Music. pp. 9±16.
Ishihata, H., et al., 1991. An architecture of highly parallel computer AP1000. In: IEEE Paci®c Rim Conference on Communications,
Computers, Signal Processing. pp. 13±16.
Katayose, H., et al., 1989. An approach to an arti®cial music expert. In: Proceedings of the 1989 International Computer Music
Conference. pp. 139±146.
Large, E.W., 1995. Beat tracking with a nonlinear oscillator. Working Notes of the IJCAI-95 Workshop on Arti®cial Intelligence and
Music. pp. 24±31.
Lee, C., 1985. The rhythmic interpretation of simple musical sequences: Towards a perceptual model. In: P. Howell, I. Cross, R. West
(Eds.), Musical Structure and Cognition. Academic Press, New York, pp. 53±69.
Rosenthal, D., 1992a. Emulation of human rhythm perception. Computer Music J. 16 (1), 64±76.
Rosenthal, D., 1992b. Machine rhythm: Computer emulation of human rhythm perception. Massachusetts Institute of Technology,
MA, Ph.D. thesis.
Rowe, R., 1993. Interactive Music Systems. The MIT Press, Cambridge, MA.
Scheirer, E.D., 1996. Using bandpass and comb ®lters to beat-track digital audio. Unpublished.
Schloss, W.A., 1985. On the automatic transcription of percussive music ± From acoustic signal to high-level analysis. CCRMA,
Stanford University, Ph.D. thesis.
Smith, L.M., 1996. Modelling rhythm perception by continuous time-frequency analysis. In: Proceedings of the 1996 International
Computer Music Conference. pp. 392±395.
Todd, N.P.M., 1994. The auditory `primal sketch': A multiscale model of rhythmic grouping. J. New Music Res. 23 (1), 25±70.
Todd, N.P.M., 1995. The kinematics of musical expression. J. Acoust. Soc. Amer. 97 (3), 1940±1949.
Todd, N.P.M., Brown, G.J., 1996. Visualization of rhythm, time and metre. Arti®cial Intelligence Review 10, 253±273.
Vercoe, B., 1994. Perceptually-based music pattern recognition and response. In: Proceedings of the Third International Conference
for the Perception and Cognition of Music. pp. 59±60.
M. Goto, Y. Muraoka / Speech Communication 27 (1999) 311±335 335