Page 1
Introduction On-line Monitoring Framework Evaluation Summary References
Real-Time I/O-Monitoring of HPC Applications
with SIOX, Elasticsearch, Grafana and FUSE
Eugen Betke, Julian Kunkel
Research GroupGerman Climate Computing Center22-06-2017
Eugen Betke, Julian Kunkel Real-Time I/O-Monitoring of HPC Applicationswith SIOX, Elasticsearch, Grafana and FUSE
Page 2
Introduction On-line Monitoring Framework Evaluation Summary References
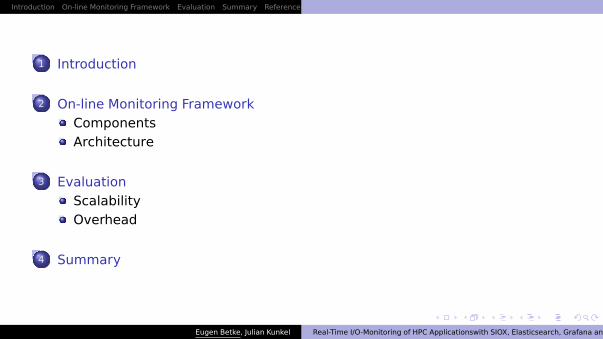
1 Introduction
2 On-line Monitoring FrameworkComponentsArchitecture
3 EvaluationScalabilityOverhead
4 Summary
Eugen Betke, Julian Kunkel Real-Time I/O-Monitoring of HPC Applicationswith SIOX, Elasticsearch, Grafana and FUSE
Page 3
Introduction On-line Monitoring Framework Evaluation Summary References
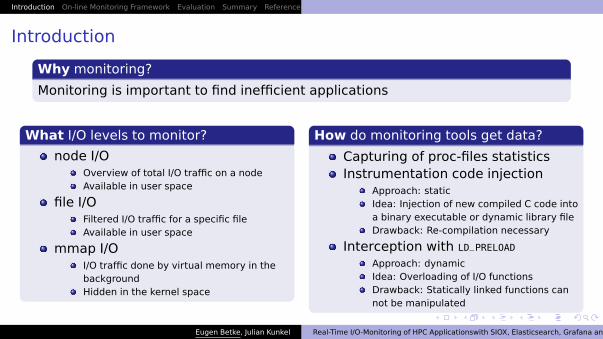
Introduction
Why monitoring?
Monitoring is important to find inefficient applications
What I/O levels to monitor?
node I/OOverview of total I/O traffic on a nodeAvailable in user space
file I/OFiltered I/O traffic for a specific fileAvailable in user space
mmap I/OI/O traffic done by virtual memory in thebackgroundHidden in the kernel space
How do monitoring tools get data?
Capturing of proc-files statisticsInstrumentation code injection
Approach: staticIdea: Injection of new compiled C code intoa binary executable or dynamic library fileDrawback: Re-compilation necessary
Interception with LD_PRELOAD
Approach: dynamicIdea: Overloading of I/O functionsDrawback: Statically linked functions cannot be manipulated
Eugen Betke, Julian Kunkel Real-Time I/O-Monitoring of HPC Applicationswith SIOX, Elasticsearch, Grafana and FUSE
Page 4
Introduction On-line Monitoring Framework Evaluation Summary References Components Architecture
On-line Monitoring Framework Components
Visualization
Database
Online-MonitoringFramework
I/O
Filesystem
(FUSE)
nocache
userspace
nommap
ops
SIOX[2] Layers
HDF
MPIIO
POSIX
NetCDF
Onlineanalysis
Offlineanalysis
Modulardesign
Elastic
search
Scalable
Real-time
Analyticsengine
Searchengine
Grafana
richgraph-
ing
mixedstyling
repeatingpanes
annotations
templatevari-ables
Monitoring ofMMAP I/O
Instrumentation
Eugen Betke, Julian Kunkel Real-Time I/O-Monitoring of HPC Applicationswith SIOX, Elasticsearch, Grafana and FUSE
Page 5
Introduction On-line Monitoring Framework Evaluation Summary References Components Architecture
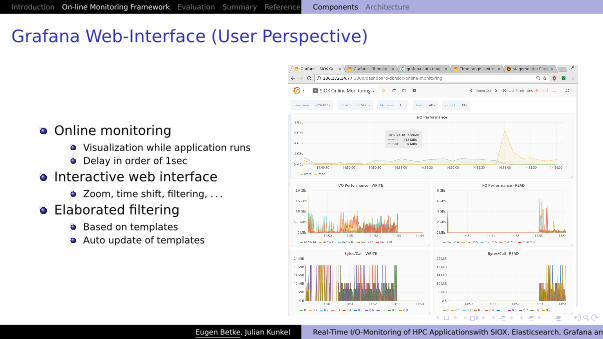
Grafana Web-Interface (User Perspective)
Online monitoringVisualization while application runsDelay in order of 1sec
Interactive web interfaceZoom, time shift, filtering, . . .
Elaborated filteringBased on templatesAuto update of templates
Eugen Betke, Julian Kunkel Real-Time I/O-Monitoring of HPC Applicationswith SIOX, Elasticsearch, Grafana and FUSE
Page 6
Introduction On-line Monitoring Framework Evaluation Summary References Components Architecture
Existing I/O paths
USER
SPA
CE
KER
NEL
SPA
CE
(optional)
SIOX( Application )+ Online-Monitoring-Plugin
Virtual File SystemVirtual Memory FUSE Kernel Module
(optional)
SIOX( IOFS )+ Online-Monitoring-Plugin
Built-in File System
Storage
Elasticsearch
Grafana
I/O statistics I/O statistics
I/O statistics
mmap()
1
1’
6
7
23 4
5
1 6 7
Existing file I/O path. Typically,supported by most instrumentationtools.
1’ 6 7
Existing mmap I/O path. Toolscannot trace this.
Eugen Betke, Julian Kunkel Real-Time I/O-Monitoring of HPC Applicationswith SIOX, Elasticsearch, Grafana and FUSE
Page 7
Introduction On-line Monitoring Framework Evaluation Summary References Components Architecture
On-line Monitoring Architecture
USER
SPA
CE
KER
NEL
SPA
CE
(optional)
SIOX( Application )+ Online-Monitoring-Plugin
Virtual File SystemVirtual Memory FUSE Kernel Module
(optional)
SIOX( IOFS )+ Online-Monitoring-Plugin
Built-in File System
Storage
Elasticsearch
Grafana
I/O statistics I/O statistics
I/O statistics
mmap()
1
1’
6
7
23 4
5
Key features
1 Traditional monitoring of file I/O
1 6 7
File I/O calls are intercepted directlyin application by SIOX
2 Monitoring of mmap I/O (Novelty)
1’ 2 3 4 5 6 7
Redirected mmap I/O path fromkernel to user space allows SIOX tointercept the I/O calls withinelevated privileges.
Eugen Betke, Julian Kunkel Real-Time I/O-Monitoring of HPC Applicationswith SIOX, Elasticsearch, Grafana and FUSE
Page 8
Introduction On-line Monitoring Framework Evaluation Summary References Scalability Overhead
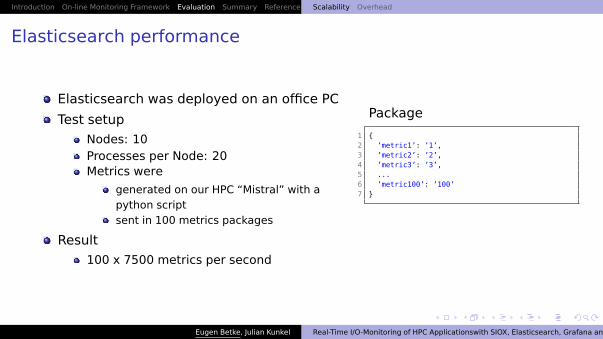
Elasticsearch performance
Elasticsearch was deployed on an office PC
Test setup
Nodes: 10Processes per Node: 20Metrics were
generated on our HPC “Mistral” with apython scriptsent in 100 metrics packages
Result
100 x 7500 metrics per second
Package
1 {2 ’metric1’: ’1’,3 ’metric2’: ’2’,4 ’metric3’: ’3’,5 ...6 ’metric100’: ’100’7 }
Eugen Betke, Julian Kunkel Real-Time I/O-Monitoring of HPC Applicationswith SIOX, Elasticsearch, Grafana and FUSE
Page 9
Introduction On-line Monitoring Framework Evaluation Summary References Scalability Overhead
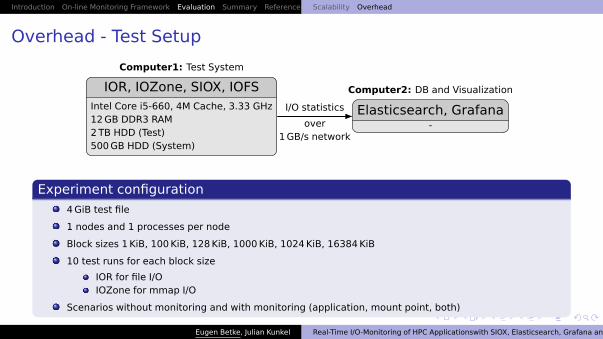
Overhead - Test Setup
IOR, IOZone, SIOX, IOFSIntel Core i5-660, 4M Cache, 3.33 GHz12 GB DDR3 RAM2 TB HDD (Test)500 GB HDD (System)
Computer1: Test System
Elasticsearch, Grafana-
Computer2: DB and Visualization
I/O statistics
over1 GB/s network
Experiment configuration
4 GiB test file
1 nodes and 1 processes per node
Block sizes 1 KiB, 100 KiB, 128 KiB, 1000 KiB, 1024 KiB, 16384 KiB
10 test runs for each block size
IOR for file I/OIOZone for mmap I/O
Scenarios without monitoring and with monitoring (application, mount point, both)
Eugen Betke, Julian Kunkel Real-Time I/O-Monitoring of HPC Applicationswith SIOX, Elasticsearch, Grafana and FUSE
Page 10
Introduction On-line Monitoring Framework Evaluation Summary References Scalability Overhead
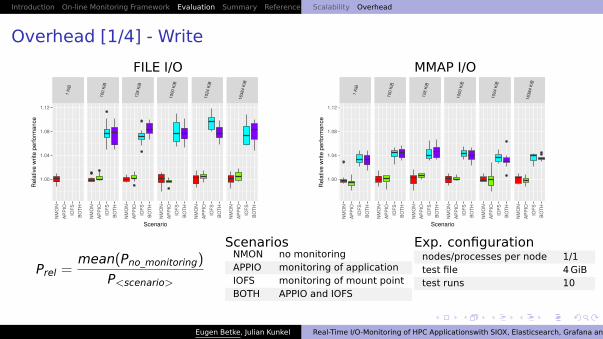
Overhead [1/4] - Write
FILE I/O1 K
iB
100 K
iB
128 K
iB
1000 K
iB
1024 K
iB
16384 K
iB
NM
ON
AP
PIO
IOF
S
BO
TH
NM
ON
AP
PIO
IOF
S
BO
TH
NM
ON
AP
PIO
IOF
S
BO
TH
NM
ON
AP
PIO
IOF
S
BO
TH
NM
ON
AP
PIO
IOF
S
BO
TH
NM
ON
AP
PIO
IOF
S
BO
TH
1.00
1.04
1.08
1.12
Scenario
Rela
tive
wri
te p
erf
orm
ance
MMAP I/O
1 K
iB
100 K
iB
128 K
iB
1000 K
iB
1024 K
iB
16384 K
iB
NM
ON
AP
PIO
IOF
S
BO
TH
NM
ON
AP
PIO
IOF
S
BO
TH
NM
ON
AP
PIO
IOF
S
BO
TH
NM
ON
AP
PIO
IOF
S
BO
TH
NM
ON
AP
PIO
IOF
S
BO
TH
NM
ON
AP
PIO
IOF
S
BO
TH
1.00
1.04
1.08
1.12
Scenario
Rela
tive
wri
te p
erf
orm
ance
Prel =mean(Pno_monitoring)
P<scenario>
ScenariosNMON no monitoringAPPIO monitoring of applicationIOFS monitoring of mount pointBOTH APPIO and IOFS
Exp. configurationnodes/processes per node 1/1test file 4 GiBtest runs 10
Eugen Betke, Julian Kunkel Real-Time I/O-Monitoring of HPC Applicationswith SIOX, Elasticsearch, Grafana and FUSE
Page 11
Introduction On-line Monitoring Framework Evaluation Summary References Scalability Overhead
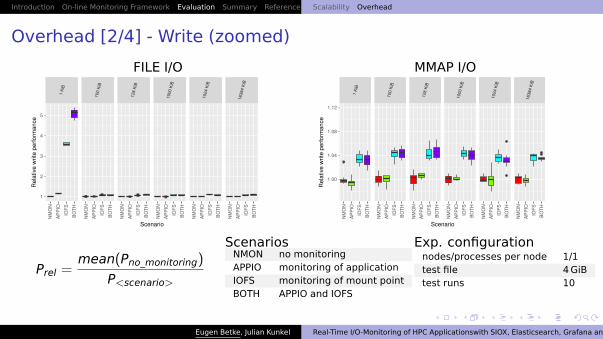
Overhead [2/4] - Write (zoomed)
FILE I/O1 K
iB
100 K
iB
128 K
iB
1000 K
iB
1024 K
iB
16384 K
iB
NM
ON
AP
PIO
IOF
S
BO
TH
NM
ON
AP
PIO
IOF
S
BO
TH
NM
ON
AP
PIO
IOF
S
BO
TH
NM
ON
AP
PIO
IOF
S
BO
TH
NM
ON
AP
PIO
IOF
S
BO
TH
NM
ON
AP
PIO
IOF
S
BO
TH
1
2
3
4
5
Scenario
Rela
tive
wri
te p
erf
orm
ance
MMAP I/O
1 K
iB
100 K
iB
128 K
iB
1000 K
iB
1024 K
iB
16384 K
iB
NM
ON
AP
PIO
IOF
S
BO
TH
NM
ON
AP
PIO
IOF
S
BO
TH
NM
ON
AP
PIO
IOF
S
BO
TH
NM
ON
AP
PIO
IOF
S
BO
TH
NM
ON
AP
PIO
IOF
S
BO
TH
NM
ON
AP
PIO
IOF
S
BO
TH
1.00
1.04
1.08
1.12
Scenario
Rela
tive
wri
te p
erf
orm
ance
Prel =mean(Pno_monitoring)
P<scenario>
ScenariosNMON no monitoringAPPIO monitoring of applicationIOFS monitoring of mount pointBOTH APPIO and IOFS
Exp. configurationnodes/processes per node 1/1test file 4 GiBtest runs 10
Eugen Betke, Julian Kunkel Real-Time I/O-Monitoring of HPC Applicationswith SIOX, Elasticsearch, Grafana and FUSE
Page 12
Introduction On-line Monitoring Framework Evaluation Summary References Scalability Overhead
Overhead [3/4] - Read
FILE I/O1 K
iB
100 K
iB
128 K
iB
1000 K
iB
1024 K
iB
16384 K
iB
NM
ON
AP
PIO
IOF
S
BO
TH
NM
ON
AP
PIO
IOF
S
BO
TH
NM
ON
AP
PIO
IOF
S
BO
TH
NM
ON
AP
PIO
IOF
S
BO
TH
NM
ON
AP
PIO
IOF
S
BO
TH
NM
ON
AP
PIO
IOF
S
BO
TH
0.98
0.99
1.00
1.01
1.02
Scenario
Rela
tive
read p
erf
orm
ance
MMAP I/O
1 K
iB
100 K
iB
128 K
iB
1000 K
iB
1024 K
iB
16384 K
iB
NM
ON
AP
PIO
IOF
S
BO
TH
NM
ON
AP
PIO
IOF
S
BO
TH
NM
ON
AP
PIO
IOF
S
BO
TH
NM
ON
AP
PIO
IOF
S
BO
TH
NM
ON
AP
PIO
IOF
S
BO
TH
NM
ON
AP
PIO
IOF
S
BO
TH
0.98
0.99
1.00
1.01
1.02
Scenario
Rela
tive
read p
erf
orm
ance
Prel =mean(Pno_monitoring)
P<scenario>
ScenariosNMON no monitoringAPPIO monitoring of applicationIOFS monitoring of mount pointBOTH APPIO and IOFS
Exp. configurationnodes/processes per node 1/1test file 4 GiBtest runs 10
Eugen Betke, Julian Kunkel Real-Time I/O-Monitoring of HPC Applicationswith SIOX, Elasticsearch, Grafana and FUSE
Page 13
Introduction On-line Monitoring Framework Evaluation Summary References Scalability Overhead
Overhead [4/4] - Read (zoomed)
FILE I/O1 K
iB
100 K
iB
128 K
iB
1000 K
iB
1024 K
iB
16384 K
iB
NM
ON
AP
PIO
IOF
S
BO
TH
NM
ON
AP
PIO
IOF
S
BO
TH
NM
ON
AP
PIO
IOF
S
BO
TH
NM
ON
AP
PIO
IOF
S
BO
TH
NM
ON
AP
PIO
IOF
S
BO
TH
NM
ON
AP
PIO
IOF
S
BO
TH
0.98
0.99
1.00
1.01
1.02
Scenario
Rela
tive
read p
erf
orm
ance
MMAP I/O
1 K
iB
100 K
iB
128 K
iB
1000 K
iB
1024 K
iB
16384 K
iB
NM
ON
AP
PIO
IOF
S
BO
TH
NM
ON
AP
PIO
IOF
S
BO
TH
NM
ON
AP
PIO
IOF
S
BO
TH
NM
ON
AP
PIO
IOF
S
BO
TH
NM
ON
AP
PIO
IOF
S
BO
TH
NM
ON
AP
PIO
IOF
S
BO
TH
1.0
1.1
1.2
1.3
Scenario
Rela
tive
read p
erf
orm
ance
Prel =mean(Pno_monitoring)
P<scenario>
ScenariosNMON no monitoringAPPIO monitoring of applicationIOFS monitoring of mount pointBOTH APPIO and IOFS
Exp. configurationnodes/processes per node 1/1test file 4 GiBtest runs 10
Eugen Betke, Julian Kunkel Real-Time I/O-Monitoring of HPC Applicationswith SIOX, Elasticsearch, Grafana and FUSE
Page 14
Introduction On-line Monitoring Framework Evaluation Summary References
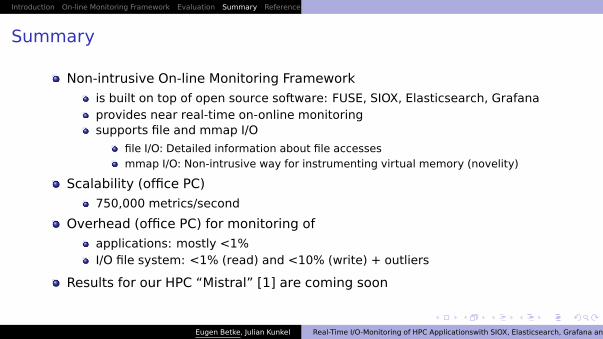
Summary
Non-intrusive On-line Monitoring Framework
is built on top of open source software: FUSE, SIOX, Elasticsearch, Grafanaprovides near real-time on-online monitoringsupports file and mmap I/O
file I/O: Detailed information about file accessesmmap I/O: Non-intrusive way for instrumenting virtual memory (novelity)
Scalability (office PC)
750,000 metrics/second
Overhead (office PC) for monitoring of
applications: mostly <1%I/O file system: <1% (read) and <10% (write) + outliers
Results for our HPC “Mistral” [1] are coming soon
Eugen Betke, Julian Kunkel Real-Time I/O-Monitoring of HPC Applicationswith SIOX, Elasticsearch, Grafana and FUSE
Page 15
Introduction On-line Monitoring Framework Evaluation Summary References
References
HLRE-3 "Mistral". https://www.dkrz.de/Klimarechner/hpc. Accessed:2017-03-22.
SIOX.https://wr.informatik.uni-hamburg.de/research/projects/siox.Accessed: 2017-03-22.
Eugen Betke, Julian Kunkel Real-Time I/O-Monitoring of HPC Applicationswith SIOX, Elasticsearch, Grafana and FUSE