20
REAL TIME OZONE MAPPING Houston Clean Air Network, Mapping as Community Outreach and Epidemiology Dan Price, Ph.D., University of Houston
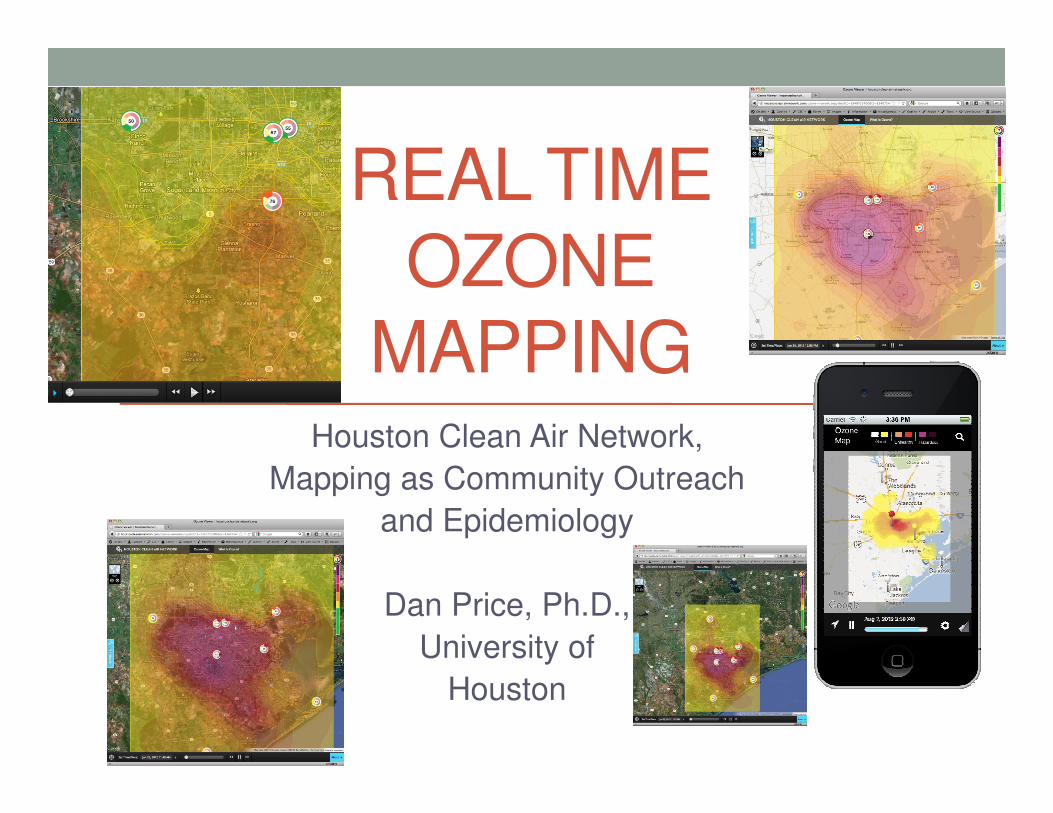
REAL TIME
OZONE
MAPPING Houston Clean Air Network,
Mapping as Community Outreach
and Epidemiology
Dan Price, Ph.D.,
University of
Houston
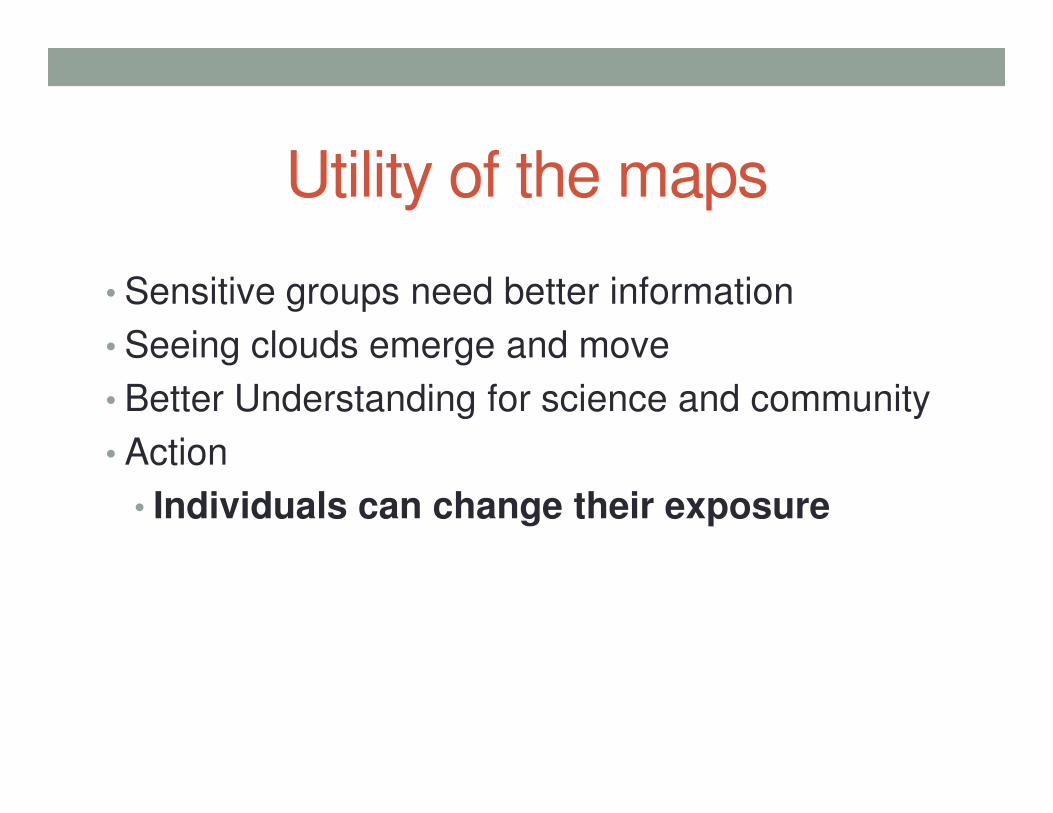
Utility of the maps
• Sensitive groups need better information
• Seeing clouds emerge and move
• Better Understanding for science and community• Better Understanding for science and community
• Action
• Individuals can change their exposure

Tour of the site
•http://houstoncleanairnetwork.com/
•The information pages:


Tour of the site
•http://houstoncleanairnetwork.com/
•The maps:


Tour of the site
•http://houstoncleanairnetwork.com/
•The iPhone App:
• (Android coming soon)

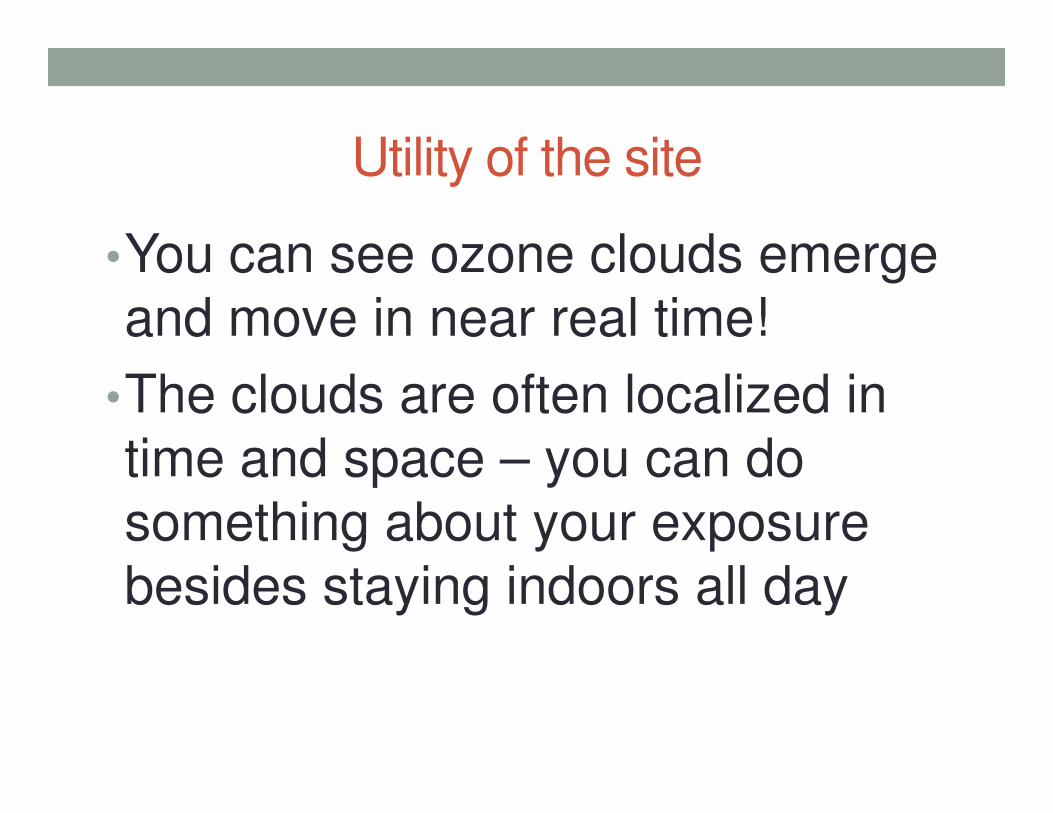
Utility of the site
•You can see ozone clouds emerge
and move in near real time!
•The clouds are often localized in •The clouds are often localized in
time and space – you can do
something about your exposure
besides staying indoors all day

Utility of the site
•Technology is modular:
interpolation for producing grid
data and for generating contour data and for generating contour
lines can be adapted for new
places, new pollutants, and new
interfaces.

Utility of the site
•Visualization tool for public health,
not for regulatory enforcement• (This is important for public outreach, and for eventually
changing how the public sees pollution data)changing how the public sees pollution data)
• (We are using 8hr AQI)

Future of the site
•New Locations
•Epidemiology
•Personal Health Calculators
Historical Maps•Historical Maps
•Forecast maps
•Now-casting
•Other pollutants
•Future outreach


![Ozone cci DARD - European Space AgencyNP-SDR_D.pdf. [RD-12] Algorithm Theoretical Basis Document (ATBD) for the Sensor Data Record (SDR) Algorithm Limb Profiler Ozone Mapping And Profiler](https://static.documents.pub/doc/80x56/6076d54beb3e66438f0efbb1/ozone-cci-dard-european-space-agency-np-sdrdpdf-rd-12-algorithm-theoretical.jpg)


