20
Real-Time Quality Control Analysis

Real-Time Quality Control Analysis

C O N T E N T S
IAMQC® Introduction . . . . . . . . . . . . . . . . 3
Work Flow . . . . . . . . . . . . . . . . . . . . . . . . . .4
Technopath Products . . . . . . . . . . . . . . . . 5
Peer . . . . . . . . . . . . . . . . . . . . . . . . . . . . . . .6
Daily . . . . . . . . . . . . . . . . . . . . . . . . . . . . . . 10
Expert . . . . . . . . . . . . . . . . . . . . . . . . . . . . 13
Transfer . . . . . . . . . . . . . . . . . . . . . . . . . . . 17
Connectivity . . . . . . . . . . . . . . . . . . . . . . . 18
Benefits . . . . . . . . . . . . . . . . . . . . . . . . . . . 19
QUAL ITY CONTROL SOFTWARE
3
Designed to complement and support
Technopath’s Multichem® Quality Control (QC)
product range, IAMQC® Software provides
Laboratory Managers and Technologists with a
range of QC software tools to analyse their QC
results in real-time .
IAMQC® Software products allow users to
automate, centralise, standardise and improve
QC processes in a laboratory setting . Our
combination of modules satisfy the varying
levels of QC requirements in individual
laboratories and are easily tailored to meet
different QC management expectations .
Technopath’s full suite of software products
provide clinical laboratories significant cost
and time savings, whilst delivering higher
confidence in analytical testing methods .
Choose from Intranet and/or Internet based
statistical quality control and quality assurance
software products . IAMQC® software products
are practical, graphical, user-definable and
easy to use .
QUAL ITY CONTROL SOFTWARE
4
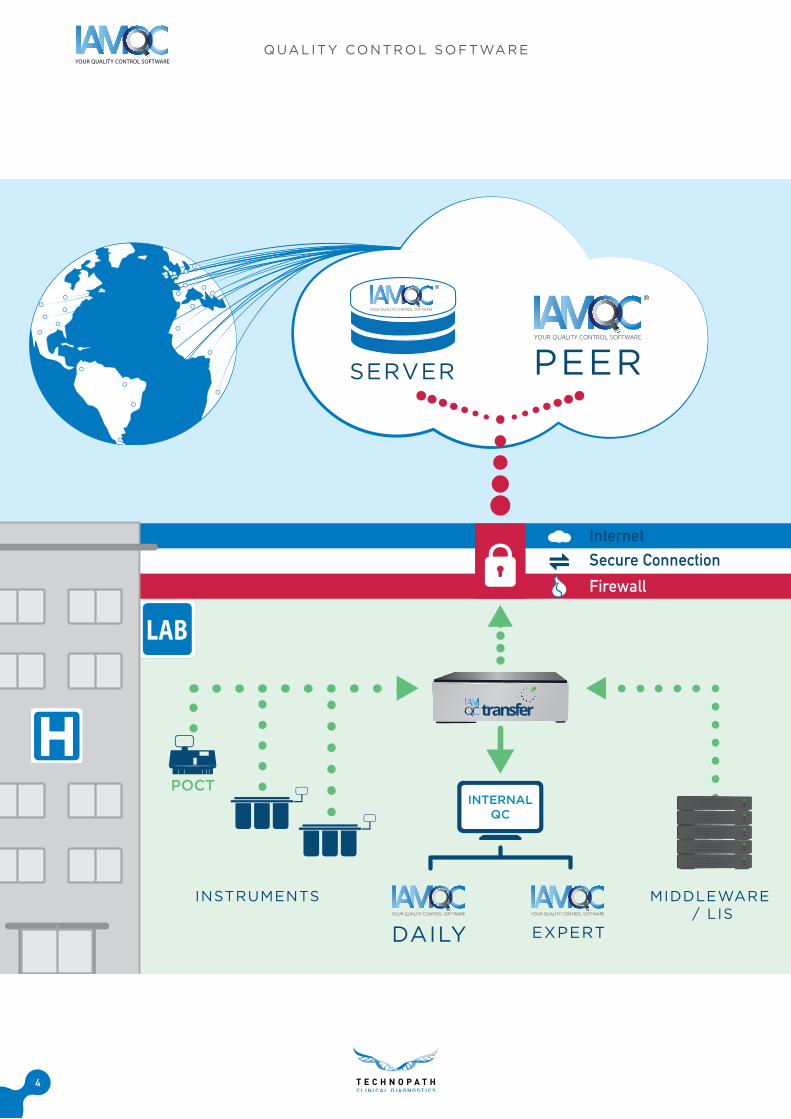
InternetSecure ConnectionFirewall
SERVER PEER
LAB
INTERNALQC
MIDDLEWARE / LIS
INSTRUMENTS
DAILY EXPERT
POCT

QUAL ITY CONTROL SOFTWARE
5
BENCH TECHNOLOGISTS:
• Spend less time on false positive QC flags
• Concentrate on tests, which require their
attention
• Spend less time trouble-shooting
• Know how to react when the mean shifts
• Assess the acceptability of new reagent
lots and calibrations
• Solve QC problems
• Gain understanding and confidence in the
QC process
LAB MANAGERS:
• Choose QC rules to maximise true rejects
and minimise false rejects
• Quickly see the tests that require their
attention
• Skim graphics to quickly review current
or historical data by lab, department,
instrument or test
• Monitor performance in groups of
laboratories
• Review problem tests and QA activities in
local and remote labs
LAB OR HOSPITAL ADMINISTRATORS:
• Save money
• Improve quality
• Improve service
• Review Administrative Summary Reports
to ensure quality performance
TECHNOPATH’S SOFTWARE
PRODUCTS HELP:

QUAL ITY CONTROL SOFTWARE
6
PEER
IAMQC® Peer is an innovative, real-time, Peer
Comparison Software . This web based system
facilitates laboratories testing the same lot
number of control material to access valuable
information from their colleagues through peer
comparison . The reports that are generated
in IAMQC® Peer compare the accuracy and
precision of analytical processes between
laboratories and peer groups . This information
can be extremely valuable, indicating the
user’s performance relative to their peer group
and also providing powerful troubleshooting
tools when attempting to resolve potential
problems .
To participate in IAMQC® Peer, each individual
laboratory submits their individual results
or summary statistics (mean, standard
deviation, and number of data points) to the
central database maintained by Technopath .
Laboratories data may be submitted manually
on-line or, alternatively, captured by one of our
many live interfacing options . The information
provided by IAMQC® Peer can be used on
a monthly basis to evaluate how well lab’s
methods are operating relative to the overall
peer group . Users can also look at this peer
data in real-time interactive tables online, when
they are investigating a potential problem with
accuracy or precision in an individual method .
KEY FEATURES
• Centralised data management
• Instant comparison data from multiple
instruments and locations
• Web based system
• User-friendly navigation
• Easy to read tables and charts
• Facilitates meeting ISO 15189
requirements
• Significant cost and time savings
PEER Request IAMQC® PEER Demo:[email protected]

QUAL ITY CONTROL SOFTWARE
7
PEER
Each one of the IAMQC® Peer comparison reports are generated in PDF format and are available on
the web . These reports can be generated by the user or automatically on a user defined schedule .
The generated reports can be emailed automatically as well as printed . At any time, the reports are
available online and can be downloaded by users using their login name and password .
LEVEY JENNINGS REPORT
The Levey Jennings Report displays
individual daily QC means for the
selected month for a specific analyte .
The report can be generated for two or
three levels of QC material .
This report also provides a super-
imposed version of all QC levels at the
bottom of each sheet, highlighting any
level specific bias . The top of the graph
displays a summary of both monthly
and cumulative data, including all of the
relevant statistics for the laboratory .
GROUP COORDINATOR REPORT
This report provides a test by test listing of
statistics for the lab and its peer groups for up
to 3 levels of control material . A peer group is
a group of labs using the same control material
and the same analytical method . The Group
Coordinator Report documents all of the
relevant data points submitted to IAMQC® and
automatically provides a statistical analysis in
table format .
This report provides a centralised review of all
instruments from the moment the customer
begins to report data and thus facilitates users
meeting accreditation requirements, with
respect to the storage, retrieval and statistical
analysis of quality control data .
QUAL ITY CONTROL SOFTWARE
8
PEER
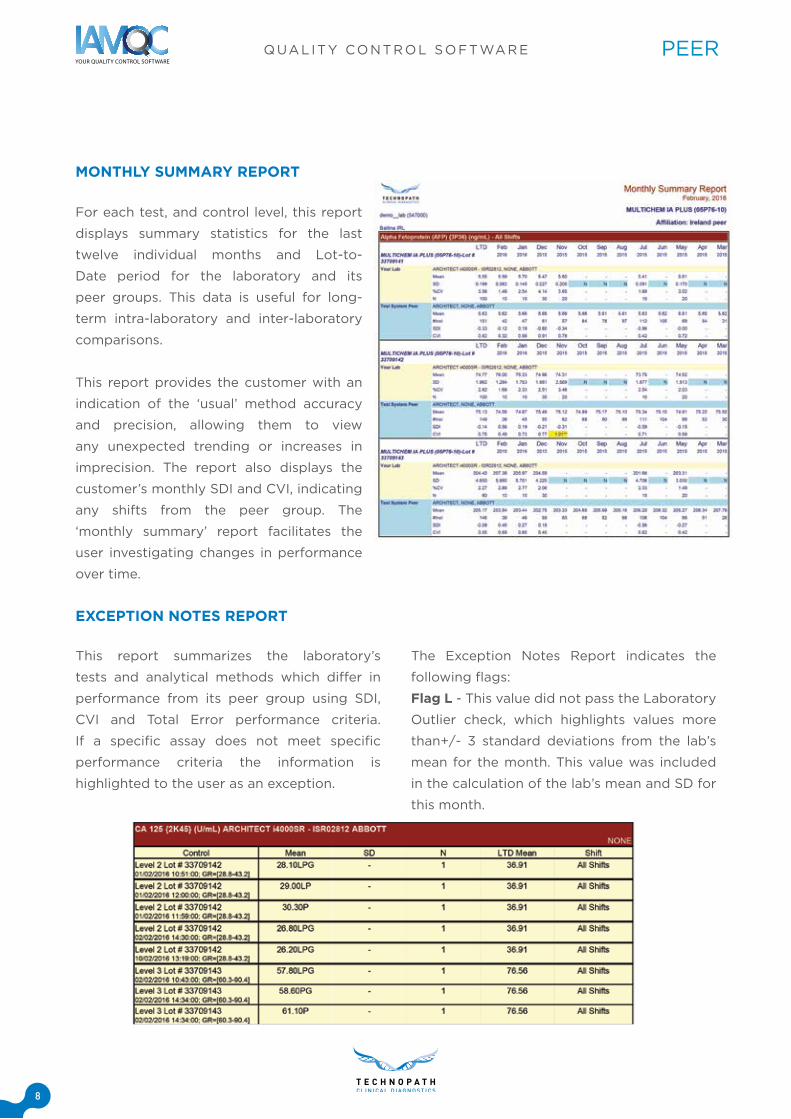
EXCEPTION NOTES REPORT
This report summarizes the laboratory’s
tests and analytical methods which differ in
performance from its peer group using SDI,
CVI and Total Error performance criteria .
If a specific assay does not meet specific
performance criteria the information is
highlighted to the user as an exception .
The Exception Notes Report indicates the
following flags:
Flag L - This value did not pass the Laboratory
Outlier check, which highlights values more
than+/- 3 standard deviations from the lab’s
mean for the month . This value was included
in the calculation of the lab’s mean and SD for
this month .
MONTHLY SUMMARY REPORT
For each test, and control level, this report
displays summary statistics for the last
twelve individual months and Lot-to-
Date period for the laboratory and its
peer groups . This data is useful for long-
term intra-laboratory and inter-laboratory
comparisons .
This report provides the customer with an
indication of the ‘usual’ method accuracy
and precision, allowing them to view
any unexpected trending or increases in
imprecision . The report also displays the
customer’s monthly SDI and CVI, indicating
any shifts from the peer group . The
‘monthly summary’ report facilitates the
user investigating changes in performance
over time .

QUAL ITY CONTROL SOFTWARE
9
PEER
YOUDEN PLOT REPORT
The Youden Report describes internal
laboratory performance against the test
system peer and method principle peer using
the Youden Plot design . Laboratory data is
tabularised at the top of the page by individual
analyte . The lower half of the page provides a
laboratory vs . peer comparison in the form of
a Youden plot . The centre of each Youden plot
represents the mean of the associated peer
group .
It is appropriate to assume that each laboratory
has its own systematic error . A user that has
good precision could unknowingly have an
error within their laboratory that is operating to
displace their results from the values achieved
by the rest of the peer group . The Youden
plot visualizes both bias and imprecision and
can be used to evaluate systematic and / or
random error .
Flag P - This value did not pass the Peer Outlier
Check, which highlights values more than +/- 3
standard deviations from the peer’s mean for
the month .
This value was included in the calculation of
the peer’s mean and SD for this month .
Flag G - This value did not pass the Gross Outlier
Check, which excludes extremely discrepant
data that falls outside of present limits for each
test . This data was not processed and is not
included in IAMQC® Reports and was excluded
from the calculation of the peer stats .

QUAL ITY CONTROL SOFTWARE
10
DAILY
IAMQC® Daily is a comprehensive Internal
Quality Control software that applies Westgard
and/or any user-defined QC rules to individual
QC results . The software automatically
builds interactive Levey-Jennings charts and
tables and provides summary and detailed
customised reports to the end user . IAMQC®
Daily integrates with Microsoft Excel to
produce customised electronic reports . The
system also allows the import of pre-defined
templates, resulting in instant system setups .
Users can create audit trails, action logs and
summary reports at the click of a button .
IAMQC® Daily comprises a centralised
program that facilitates the analysis of
multiple QC materials, across numerous
departments in a laboratory setting . The
system can be configured to submit approved
results automatically to IAMQC® Peer via
our proprietary driver solutions . This will
help to satisfy both Internal and External QC
requirements .
KEY FEATURES
• Works with multiple Sites, Departments, Instruments, Tests and Levels .
• Applies Westgard and/or any user-defined QC rules .
• Works with both quantitative and qualitative results .
• Focused troubleshooting for failed QC results via the system Action Log .
• Technologist and Supervisor Reviews and sign-off capabilities .
• Automatic Reverse Levels function .
• QC management at different administrative levels .
• Works on a single PC, LAN, WAN, and/or over the Internet .
• Runs on a powerful Database Management System to support large volumes of data in real time .
• Advanced functions for fast and easy setup .
• Multiple ways to enter data manually .
• Powerful reporting and charting capabilities .
DAILY Request IAMQC® DAILY Demo:[email protected]

QUAL ITY CONTROL SOFTWARE
11
DAILY
IAMQC® Daily offers a centralised review of
all QC data from all laboratories/instruments .
Central administrator access facilitates
managers to review QC performance at
multiple facilities – no need to visit each
laboratory site . Closer monitoring of QC from
remote locations without additional costs
provides a flexible option for managing the
inter and intra-lab performance . The software
works on an ‘open’ platform that allows the
end user to add all types of control material
from a range of laboratories .
Both IAMQC® Daily and Expert can run using
an internet OR intranet connection . Each PC
Interactive Data Review Screen
Super Impose Instruments

QUAL ITY CONTROL SOFTWARE
12
DAILY
license allows the user to manage an unlimited
number of departments, control materials
(not limited to Technopath materials) and
instruments . An unlimited number of user
logins can be added to the system at any stage .
An administrator module can also manage
user logins, customising the functionality that
is available to each user . All data can also be
filtered using the same logic to apply a user-
friendly atmosphere and save time scrolling
through data .
Custom Rule Sets
Customisable Reports in Microsoft Excel

QUAL ITY CONTROL SOFTWARE
13
EXPERT
IAMQC® Expert is an interactive system that
helps front-line laboratory staff select QC
rules, reduce unnecessary repeats and make
meaningful QC decisions . IAMQC® Expert
creates graphical color-coded representations
of accuracy and precision, illustrating
performance relative to target values and error
limits . Interactive modules such as ‘Reagent
Verification’, ‘Calibration Check’ and ‘Mean
Shift Analysis’ assist with problem solving and
decision-making .
IAMQC® Expert allows the end-user to monitor
method performance relative to clinical
requirements and focus on the tests that
require their attention . The system can also be
integrated with IAMQC® Daily to automatically
capture summary data for analysis . Upon
entering the IAMQC® Expert database, the
software automatically analyses the data and
suggests QC rules to maximise true rejects and
minimise false rejects .
KEY FEATURES
• Works with multiple Sites, Departments, Instruments, Tests and Levels .
• Recommends QC rules for IAMQC® Daily software .
• Powerful QC troubleshooting tools .
• Integrates with various Laboratory Information Systems and/or instruments .
• Works on a single PC, LAN, WAN, and over the Internet .
• Runs on a powerful Database Management System .
• Powerful reporting and charting capabilities
EXPERT Request IAMQC® EXPERT Demo:[email protected]

QUAL ITY CONTROL SOFTWARE
14
EXPERT
Times and technologies are changing rapidly .
Instruments and methodologies are more
accurate, precise and stable than they were a
decade ago . Most laboratories have adopted
these new technical advances, but few have
modified their QC processes to match . Many
laboratories are still using a 1-2S rule as
recommended by Levey and Jennings in 1951 .
In 1981 Westgard recommended using a multi-
rule algorithm to avoid the false positive flags
inherent in using only a 1-2S rule . Technology
has come a long way since 1981, and for the
past ten years industry leaders such as James
Westgard, Per Hyltoft Petersen and Callum
Fraser have advised the use of a variety of QC
rules to match the analytical capability and
stability of each test . With the dramatically
improved precision of today’s methods, we
now see shifts of several SD for the same
control on the same test from time to time
within a single laboratory . We have designed
a QC system that will alert users to significant
changes and not generate QC flags when the
system is operating safely within acceptable
limits .
The system compares method performance
to defined quality requirements (rather than
to last month’s data) and recommends QC
strategies that will warn users when QC data
points exceed acceptable performance -
with a minimal number of false flags . In the
design of our QC system we “balance” the
quality control system to meet the changing
performance and stability of the analytical
system .
Our analytical processes also vary in their
susceptibility to the occurrence of significant
errors . Error rates vary from low to moderate
to high, depending on the frequency of
significant errors that occur in a specific test
system . Some methods seldom encounter
significant problems . Others are susceptible
EXPERT ANALYSIS
Data Review - Traffic Light System

QUAL ITY CONTROL SOFTWARE
15
EXPERT
to relatively frequent sources of significant
error . Methods with high error rates frequently
see significant shifts in the mean or have on-
going precision problems; these methods may
also be susceptible to frequent instrument
breakdowns or problems .
We monitor method performance (accuracy
and precision) relative to a quality requirement
by calculating critical systematic error (^SEc) .
Critical systematic error is an extremely
powerful and useful statistic . ^SEc indicates
in one number how method accuracy and
precision compare to the target and TEa
limit set for each control . ^SEc indicates the
number of standard deviations the mean can
shift before the results will exceed error limits .
Therefore changes in either the mean or SD will
be reflected in a change in critical systematic
error .
Our QC system has an improved error
detection process when methods are close
to the error limit (have a low ^SEc) or when
methods have poor stability and are prone
to errors . In this case we will select a higher
number of controls or run our existing controls
more frequently and we will select QC rules
that are more powerful when assessing small
changes in method performance . When the
^SEc is high (method performance is well
within quality requirements) and the analytical
system is stable, we will run fewer controls or
run controls less frequently and we will select
QC rules to minimise false QC flags .
Critical systematic error is a valuable indicator
of the size of the shift in the mean that we must
detect . We can easily visualize how it would
be appropriate to use “tighter” QC rules when
the method is closer to the error limit and to
use “looser” QC rules when a method can shift
many standard deviations before exceeding
the quality requirement . When we run more
levels of controls or run the same controls
more frequently, we increase our probability
of detecting errors . Unfortunately, we also
increase the probability of false rejection .
Remember, if we are using a 1-2S rule, we will
see 5% of our “good” data falling between
Problem Solver Report

QUAL ITY CONTROL SOFTWARE
16
EXPERT
2 and 3 SD . Therefore, the more controls we
run, the higher the probability in any given run
that one of them will fall outside two standard
deviations . When it is necessary to design a QC
process to detect a very small change in the
analytical system, one of the strategies we can
use is to increase the number and frequency of
the controls .
IAMQC® Expert is a user-friendly interactive
expert system that helps front-line laboratory
staff select QC rules, reduce unnecessary
repeats and make meaningful QC decisions .
The software creates graphical colour-coded
representations of accuracy and precision
illustrating performance relative to target
values and error limits for several departments
or groups of affiliated laboratories . Interactive
modules assist with problem solving and
decision-making .
IAMQC® Expert Helps Bench Technologists:
• Spend less time on false positive QC flags
• Concentrate on tests which require their
attention
• Spend less time trouble-shooting
• Know how to react when the mean shifts
• Assess the acceptability of new reagent
lots and calibrations
• Solve QC problems
• Gain understanding & confidence in the QC
process
IAMQC® Expert Helps Lab Managers:
• Monitor method performance relative to
CLIA or clinical requirements
• Choose QC rules to maximise true rejects
and minimise false rejects
• Quickly see the tests that require their
attention
• Skim graphics to quickly review current
or historical data by lab, department,
instrument or test
• Monitor performance in groups of
laboratories
• Review problem tests and QA activities in
local and remote labs
IAMQC® Expert Helps Lab Or Hospital Administrators:
• Save money
• Improve quality
• Improve service
• Review Administrative Summary Reports
to ensure quality performance
Expert Reports in Microsoft Excel

QUAL ITY CONTROL SOFTWARE
17
TRANSFER
The most advanced connectivity solution
available for laboratory instrumentation.
IAMQC® Transfer is a connectivity device
that can communicate with Laboratory
Information Systems (LIS), Middleware,
automated instrumentation and Point Of Care
platforms . Through the use of our proprietary
drivers and a single board computer device,
IAMQC Transfer processes and communicates
data from your system to any one of our
powerful IAMQC software packages; IAMQC
Peer, IAMQC Daily, IAMQC Expert or IAMQC
Proficiency Testing module . By
combining software and hardware
elements, we can eliminate the
requirement for additional PCs or
servers . A plug-and-play set up,
combined with over 200 available
connectivity options ensure an
un-matched level of flexibility – all
within an incredibly small, seamless
enclosure .
Automated data collection . Easy
to Implement . Introducing IAMQC
Transfer in to your laboratory
will drive efficiency through
automation, whilst increasing
quality by transitioning away from
manual entry programs . IAMQC
Transfer can function as a uni-
directional interface to process QC files and
data streams of all formats . However, in addition
to receiving the results, IAMQC Transfer can
also work as a bi-directional interface, where
it will communicate back to the instrument,
LIS or middleware . To satisfy the requirements
of laboratories of all sizes and configurations,
Technopath Clinical Diagnostics introduces
IAMQC Transfer, a next-generation informatic
solution .
More than just an interface to IAMQC
Software, IAMQC Transfer is available to
purchase as a stand-alone connectivity device
for your software program . By providing a
comprehensive solution that can work with
multiple information systems, Technopath
Clinical Diagnostics’ IAMQC Transfer can
automate your data collection process . Contact
us at qcsoftware@technopathcd .com for more
information .
TRANSFER
InternetSecure ConnectionFirewall
SERVER PEER
LAB
INTERNALQC
MIDDLEWARE / LIS
INSTRUMENTS
DAILY EXPERT
POCT
Request IAMQC® TRANSFER Demo:[email protected]

QUAL ITY CONTROL SOFTWARE
18
CONNECTIVITY
CONNECTIVITYProviding the flexibility for an internet OR
intranet connection facilitates the customer
in choosing their preference with regards
to connectivity . The system can run locally
behind a firewall, or alternatively, over the web
should access be required outside of the local
network .
Built-in real-time and semi-real time interface
solutions are available to capture data from all
types of instruments, middleware systems and
LIS across all departments . To date, we have
developed over 200 types of drivers for data
capturing purposes . IAMQC® Daily can also
capture QC results from diagnostic instruments
that are not interfaced to the DMS and from
manual result entry programs on a daily basis .
IAMQC® Drivers include, but are not limited to,
the following list:
Abbott Architect Datalink RCM Beziers
Abbott AXSYM EPIC LIS SDF 1 .0 Quadramed LIS
Abbott CELL DYN ERMA Roche COBAS
ABX Fletcher Flora Roche ELECSYS
AVL OMNI 5 HMS LIS Roche HITACHI 747
Bayer Atlas Hutt No 2 QC Roche Integra 4 .1 .ARC
Bayer CLINITEK IL ELECTRA 1000 Roche Modular
Beckman AU IL Synthesis Roche PSM
Beckman DxC Immucor Galileo RT Communicator
Beckman DXI ACCESS 2 LabDaq LIS Schuylab LIS
Beckman Remisol McKesson LIS Siemens ADVIA Centaur
Beckman SYNCHRON CX9 Meditech LIS Siemens CentraLink
Cerner LIS Menarini Siemens Dimension 2 .0
Cerner Millennium LIS MGC 240 Qualitative 1 .0 Siemens Immulite (DPC)
Citation LIS Microplate Siemens Novius LIS
CLARIS LIS Microscan SOFT LIS
Coag-A-Mate MTX II MOLIS LIS StaRRsed
ConcurTrak SDF Mysis LIS Stat Profile M
CPSI LIS NEMO Middleware Sunquest 1
Dade Behring BN II Nephelometer NOVA ELECTROLYTE 5 SYSMEX
Dade Dimension NUCLEUS TOSOH A1c 2 .2
Dairyland LIS Omnilab AMS UF100
Data Innovations IM Orchard LIS UriScan-S300
Dawning UC Ortho Vitros ECi Viper

QUAL ITY CONTROL SOFTWARE
19
BENEFITS
1. Centralised review of all QC data from all laboratories/instruments . Central administrator access to review QC performance at multiple facilities – no need to visit each laboratory site
2. Closer monitoring of QC from remote locations without additional costs
3. Built-in real-time and semi-real time interface solutions. Integrate with various Laboratory Information Systems and/or instruments
4. Capture QC results from diagnostic instruments and manual result entry programs on a daily basis
5. Compare each result to Assigned Mean & SD
6. Assess QC results against a set mean and standard deviation using QC rules (Westgard and/or User-defined): single or multiple QC rules
7. Auto-approval protocol
8. Troubleshoot problematic daily QC
9. Manage multiple Sites, Departments, Instruments, Tests and QC Levels on one central database
10. Manage both quantitative and qualitative results
11. Manage different departments (Chemistry, Haematology, Microbiology, etc .) on one software system
12. Focused troubleshooting for failed QC results
13. Technologist and Supervisor Reviews / Sign-off
14. “Reverse Levels” automatic function
15. QC management at different levels: administrative and bench technologists
16. Document all activities regarding daily QC
17. Tracking of proficiency testing performance and problem resolution
18 . Documentation of new reagent/calibrator/QC lot numbers and studies
19. Monthly reporting on-line for management
20. Document activities and administrative comments for summarized QC data
21. Transfer detail and summary data between a Laboratory and a single QC database in real time over the Internet
22. Internal/External peer QC review capability. Collect, analyse and compare individual laboratory data immediately with a world-wide peer group at the touch of a button over the Internet
23. Works on a single PC, LAN, WAN, and over the Internet
24. Runs on a powerful Database Management System to support large volumes of data in real time
25. Multiple Assign and Advanced Setup/Copy functions for fast and easy setup and ongoing maintenance
26. Multiple ways to enter data manually (by Level, Test or Instrument; one at a time or many at a time)
27. Monthly Supervisor Review
28. Powerful reporting and charting capabilities. Includes User-definable reports
29. Multi-user environment
30. Audit trail/Admin module for setting up users with different security profiles
BENEFITS

iamqcsupport@technopathcd .com www .technopathcd .comTechnopath Life Sciences Park, Fort Henry, Ballina, Co . Tipperary, V94 FF1P, Ireland .


