Elliott Wave Institute, 1278 Glenneyre, Laguna Beach, CA 92651 • (800) 636-9283 Copyright ® 1998 by Glenn Neely FUTURES WEST 1998 • Real-Time TRADING using NEoWave™ Concepts Real-Time Trading using NEoWave™ Concepts Presented by Glenn Neely President of the Elliott Wave Institute Laguna Beach, California - USA
Transcript
Elliott Wave Institute, 1278 Glenneyre, Laguna Beach, CA 92651 • (800) 636-9283Copyright ® 1998 by Glenn Neely
FUTURES WEST 1998 • Real-Time TRADING using NEoWave™ Concepts
Real-Time Trading using NEoWave™ Concepts
Presented by
Glenn Neely
President of the
Elliott Wave InstituteLaguna Beach, California - USA
Elliott Wave Institute, 1278 Glenneyre, Laguna Beach, CA 92651 • (800) 636-9283Copyright ® 1998 by Glenn Neely
FUTURES WEST 1998 • Real-Time TRADING using NEoWave™ Concepts
Topics Covered Today
• Trade CONTEMPLATION
• Trade INITIATION
• STOPS and Trade MANAGEMENT
• Price FORECASTING and positionLIQUIDATION
• Trading Does and Don’ts
Elliott Wave Institute, 1278 Glenneyre, Laguna Beach, CA 92651 • (800) 636-9283Copyright ® 1998 by Glenn Neely
FUTURES WEST 1998 • Real-Time TRADING using NEoWave™ Concepts
Pre-TRADE Considerations
• Is the market worth trading?
• Is Psychology in your favor?(Put/Call Ratios, sentiment, etc.)
• What will be your RISK upon entry,what might be your REWARD?
• Can you identify signs ofImpending Trend Change
Elliott Wave Institute, 1278 Glenneyre, Laguna Beach, CA 92651 • (800) 636-9283Copyright ® 1998 by Glenn Neely
FUTURES WEST 1998 • Real-Time TRADING using NEoWave™ Concepts
Behavior Associated with Impending TOPS
To increase confidence thatan important top is approaching,or has taken place, look for of these conditions:
A . Each successive advanceleading up to the high is takingmore time to cover less ground.
B . The market advancesviolently to its highest point,that is then followed by aslower, larger decline that dropsbelow the starting point of thefinal violent advance.
C . Following a high andsome consolidation, the declinesbecome more violent than theadvances.
In relation to surrounding priceevidence, the advance into the high isviolent. The high is then followed bya larger , but slower and morecomplex decline. This is one of thebest signals that a top is forming.
A violent downmove , followed by a slowermore complex rally, indicates the trend hasalready changed from up to down.
A.
C.
B.
Each successive advancetaking more time, but makingless progress. Usually a verynegative arrangement.
Elliott Wave Institute, 1278 Glenneyre, Laguna Beach, CA 92651 • (800) 636-9283Copyright ® 1998 by Glenn Neely
FUTURES WEST 1998 • Real-Time TRADING using NEoWave™ Concepts
Behavior Associated with Impending BOTTOMS
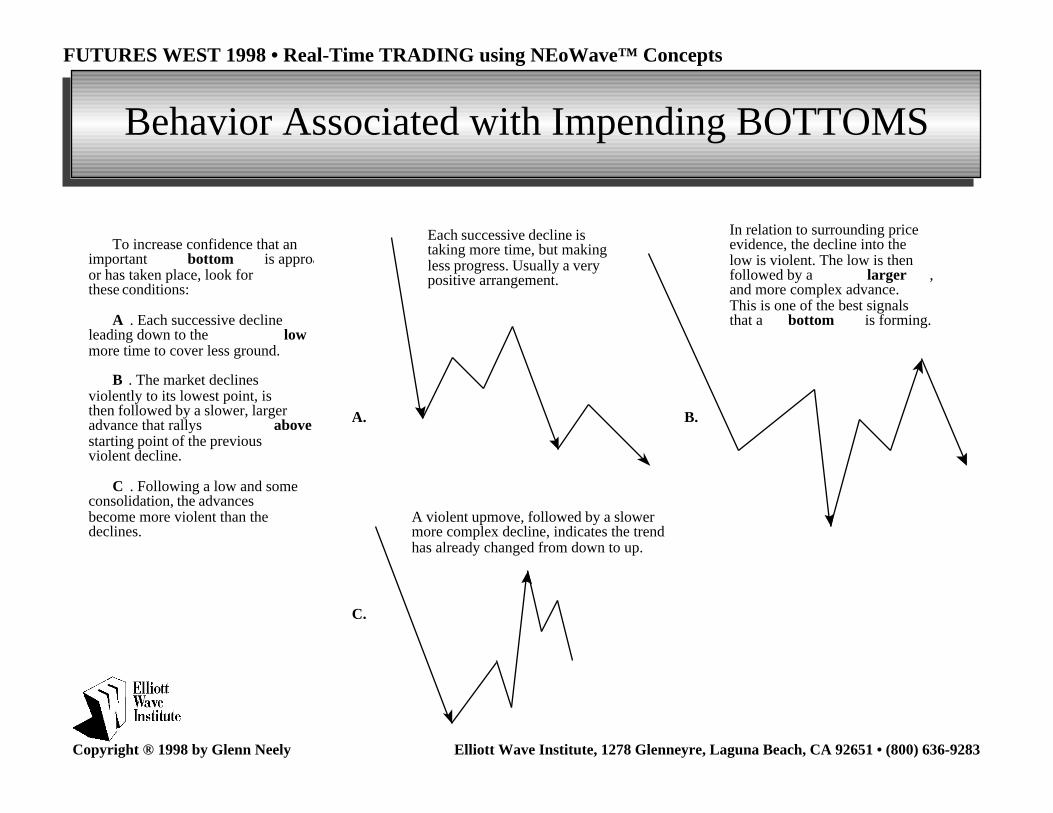
To increase confidence that animportant bottom is approaching,or has taken place, look for these conditions:
A . Each successive declineleading down to the lowmore time to cover less ground.
B . The market declinesviolently to its lowest point, isthen followed by a slower, largeradvance that rallys abovestarting point of the previousviolent decline.
C . Following a low and someconsolidation, the advancesbecome more violent than thedeclines.
In relation to surrounding priceevidence, the decline into thelow is violent. The low is thenfollowed by a larger , but slowerand more complex advance.This is one of the best signalsthat a bottom is forming.
A violent upmove, followed by a slowermore complex decline, indicates the trendhas already changed from down to up.
A.
C.
B.
Each successive decline istaking more time, but makingless progress. Usually a verypositive arrangement.
Elliott Wave Institute, 1278 Glenneyre, Laguna Beach, CA 92651 • (800) 636-9283Copyright ® 1998 by Glenn Neely
FUTURES WEST 1998 • Real-Time TRADING using NEoWave™ Concepts
1 11 21
NEoWave™ Momentum Studies (S&P data)
Markets almost alwaysprovide clues or warningsthat a trend change is in theworks. If a market is readyto reverse on a morepermanent basis, inpreparation for that event,it will almost always beginlosing momentum.
The market is rallying less andtaking more time, implyingthat a reversal of the uptrendis approaching.
Declines getting smaller,taking longer - Bottom near
Buy Level
Sell Level
Elliott Wave Institute, 1278 Glenneyre, Laguna Beach, CA 92651 • (800) 636-9283Copyright ® 1998 by Glenn Neely
FUTURES WEST 1998 • Real-Time TRADING using NEoWave™ Concepts
What is the TREND of the market?
To determine which side of amarket you should trade, locate thelargest, fastest move on the chart (aviolent move that covers the mostterritory in the shortest time); thatwill almost always be the directionof the trend for at least a whilelonger (see Segment A at far right).
Next, notice how much theviolent move is retraced. If themarket consolidates, retracing lessthan 38.2% of the violent move, thetrend is powerful and shouldcontinue. If retracement is between38.2% and 61.8%, the trend is lesspowerful, but should continue. Ifretracement is between 61.8% and100%, the trend is coming to an end,and may end with the nextapproach/retest of the area where theviolent move ended. If retracement ismore than 100%, the end of theviolent move probably marks animportant high or low. Look for acounter-trend trade to develop soon.
Market drifting lowerAFTER a high was made.Indicates the uptrend is notstrong and may indicate achange of trend is occurring.
Based on previous discussions,the market started advancingfaster AFTER a low was alreadyin. That is a sign the trend hasturned from down to up, so Longside of the market is best.
Segment A
END of Segment A
Segment A retracedbetween 61.8% and 100%.Indicates the trend couldend with the next approachof Segment A’s END point.
Elliott Wave Institute, 1278 Glenneyre, Laguna Beach, CA 92651 • (800) 636-9283Copyright ® 1998 by Glenn Neely
FUTURES WEST 1998 • Real-Time TRADING using NEoWave™ Concepts
250
260
270
280
290
300
310
320
330
340
350
360
370
380
390
1 21 41 61
What if Trend Concludes AT High or Low?
Part of theevidence that a trendhas concluded AT ahigh or low occurswhen a violentcounter trend moveunfolds immediatelyafterward (see twocircled points, theirhighs were followedby the largest, fastestmoves to occurfollowing significanttrends).
Confirmation thatthe trend is not overoccurs if the violentreversal is“completely” retracedby future action.
Whether new highsare made or not, thepattern of one largerdegree is not likely toend right at this high.
Violent counter-trend decline beginsconsolidation. In both cases, the violentdecline is completely retraced by futureaction - a set up that almost guaranteesthe larger trend is still UP.
Market datacontinued onnext page...
Elliott Wave Institute, 1278 Glenneyre, Laguna Beach, CA 92651 • (800) 636-9283Copyright ® 1998 by Glenn Neely
FUTURES WEST 1998 • Real-Time TRADING using NEoWave™ Concepts
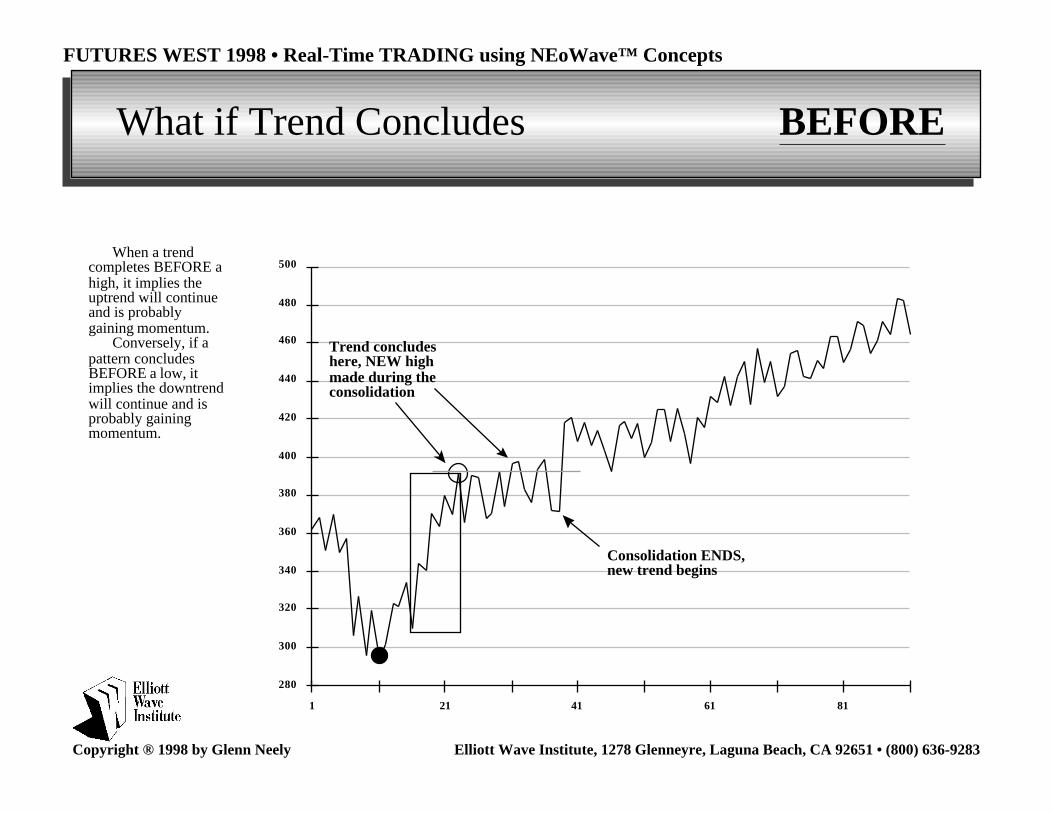
What if Trend Concludes BEFORE
When a trendcompletes BEFORE ahigh, it implies theuptrend will continueand is probablygaining momentum.
Conversely, if apattern concludesBEFORE a low, itimplies the downtrendwill continue and isprobably gainingmomentum.
280
300
320
340
360
380
400
420
440
460
480
500
1 21 41 61 81
Trend concludeshere, NEW highmade during theconsolidation
Consolidation ENDS,new trend begins
Elliott Wave Institute, 1278 Glenneyre, Laguna Beach, CA 92651 • (800) 636-9283Copyright ® 1998 by Glenn Neely
FUTURES WEST 1998 • Real-Time TRADING using NEoWave™ Concepts
What if Trend Concludes AFTER
If a pattern concludes AFTERa low, the probabilities are highthat the higher low will produce asignificant change in trend. Toanticipate such a situation is notdifficult, it just requires patience.If you see a market bottomfollowed by a recovery that islarger but slower than the oneright into the low, this situationmay be setting up.
The same rules that apply for abottom apply for a top. If themarket makes a top, reacts, thenmakes a lower high that isfollowed by a violent decline, thechances for a significant high aresubstantial.
The only exception to this ruleis when the market is forming aContracting environment (such asa Contracting Triangle). But, evenin that situation, the market willmove away from that high or lowuntil the “thrust” occurs. Eventhen the “thrust” may move awayfrom the high or low you wereanalyzing.
280
300
320
340
360
380
400
1 11 21 31
Under NEoWave™theory, the downtrendconcluded here,AFTER the low.
Recovery off low is larger,but slower than the finaldrop into the low. That isa reliable warning of amarket preparing for asignificant bottom.
Elliott Wave Institute, 1278 Glenneyre, Laguna Beach, CA 92651 • (800) 636-9283Copyright ® 1998 by Glenn Neely
FUTURES WEST 1998 • Real-Time TRADING using NEoWave™ Concepts
Which VEHICLE should you use?Stocks, Futures, Options
• Impact of TIME on Selection
• Checklist for Trading OPTIONS
• Checklist for Trading FUTURES
• Checklist for Trading STOCKS
Elliott Wave Institute, 1278 Glenneyre, Laguna Beach, CA 92651 • (800) 636-9283Copyright ® 1998 by Glenn Neely
FUTURES WEST 1998 • Real-Time TRADING using NEoWave™ Concepts
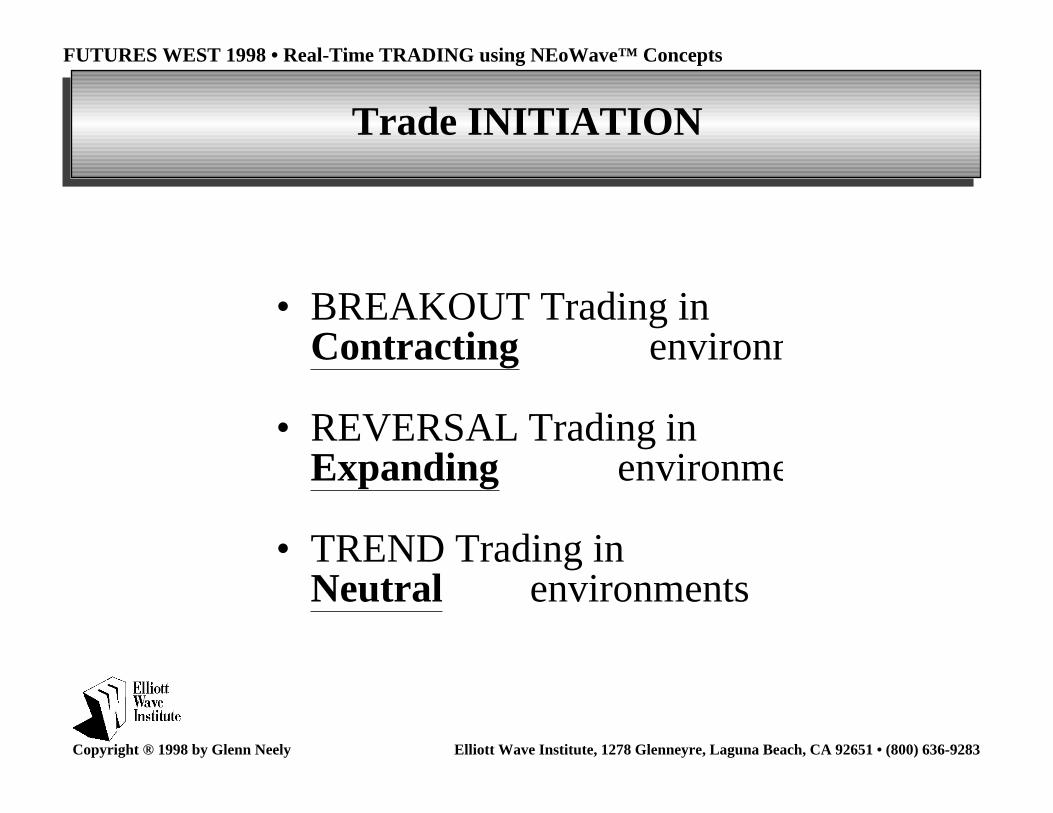
Trade INITIATION
• BREAKOUT Trading inContracting environments
• REVERSAL Trading inExpanding environments
• TREND Trading inNeutral environments
Elliott Wave Institute, 1278 Glenneyre, Laguna Beach, CA 92651 • (800) 636-9283Copyright ® 1998 by Glenn Neely
FUTURES WEST 1998 • Real-Time TRADING using NEoWave™ Concepts
BREAKOUT Trading inContracting environments
If the market has beencontracting for some timeand you think the pattern isapproaching conclusion, thisis the time to plan a“breakout” trading strategy.Decide the price level that, ifthe market moved beyond,would indicate a quick moveto a new level or thebeginning of a new sustainedtrend.
Depending on your levelof conviction, you woulddecide at which high a pricemove would indicate that theconsolidation is over and thenew trend has begun. Even ifthe trend does not last long(which is frequently the casewith Contractingenvironments), it usually willmove far enough to make thetrade worth while.
1 11 21 31 41 51
Possible“breakout”points - Buyabove one orboth levels
Elliott Wave Institute, 1278 Glenneyre, Laguna Beach, CA 92651 • (800) 636-9283Copyright ® 1998 by Glenn Neely
FUTURES WEST 1998 • Real-Time TRADING using NEoWave™ Concepts
REVERSAL Trading inExpanding environments
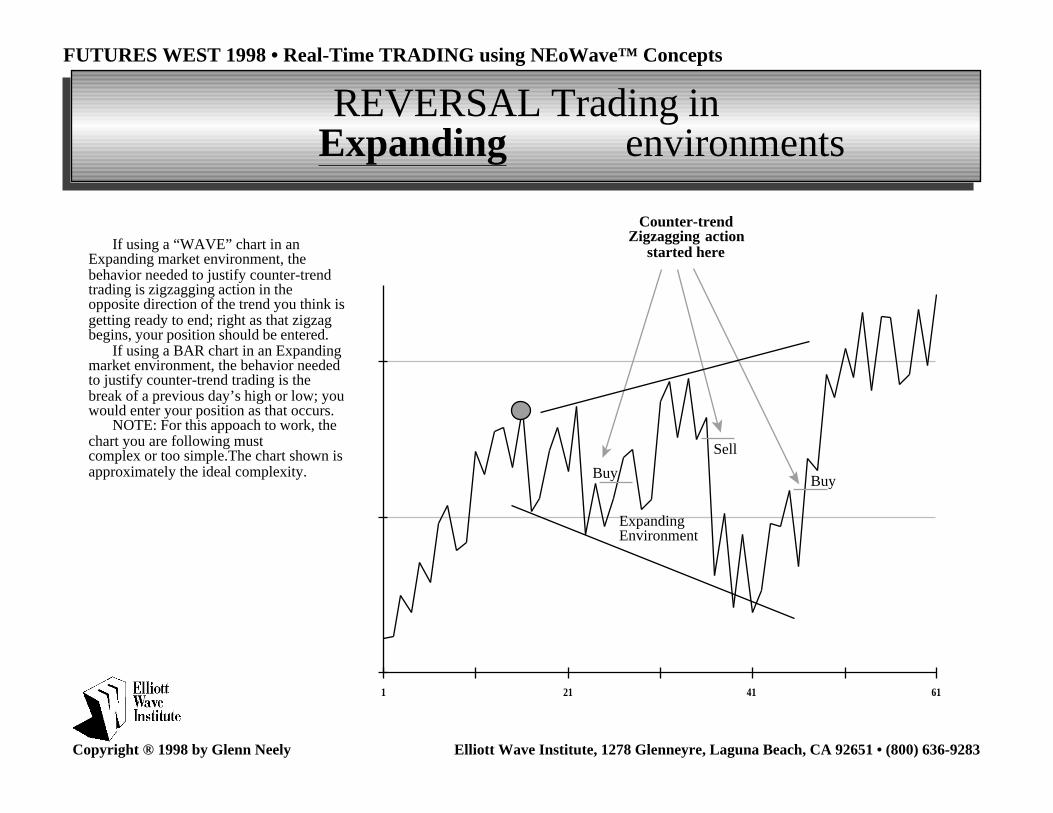
If using a “WAVE” chart in anExpanding market environment, thebehavior needed to justify counter-trendtrading is zigzagging action in theopposite direction of the trend you think isgetting ready to end; right as that zigzagbegins, your position should be entered.
If using a BAR chart in an Expandingmarket environment, the behavior neededto justify counter-trend trading is thebreak of a previous day’s high or low; youwould enter your position as that occurs.
NOTE: For this appoach to work, thechart you are following must complex or too simple.The chart shown isapproximately the ideal complexity.
1 21 41 61
Counter-trendZigzagging action
started here
ExpandingEnvironment
Buy Buy
Sell
Elliott Wave Institute, 1278 Glenneyre, Laguna Beach, CA 92651 • (800) 636-9283Copyright ® 1998 by Glenn Neely
FUTURES WEST 1998 • Real-Time TRADING using NEoWave™ Concepts
1 11 21 31 41
Original consolidation range
TREND Trading inNeutral environments
If you are confidentof the direction of amarket’s trend in anenvironment ofsideways consolidations,the best way to enter ison a new low (if thetrend is down) or a newhigh (if the trend is up).Once you enter, yourstop should be on theopposite end of theconsolidation range at apoint twice the width ofthe consolidation. Oncethe new trend hasdoubled the width of theoriginal consolidationrange, part of yourposition should beliquidated and your stopshould be moved to thelast low or high beforethe trend reinstated.
Don’t Sell (consolidationretraced too much ofprevious decline)
Retracement MORE than 50%,do NOT Short new low
Elliott Wave Institute, 1278 Glenneyre, Laguna Beach, CA 92651 • (800) 636-9283Copyright ® 1998 by Glenn Neely
FUTURES WEST 1998 • Real-Time TRADING using NEoWave™ Concepts
STOPS and Trade MANAGEMENT
• STOP Placement -Contracting Environment
• STOP Placement -Expanding Environment
• STOP Placement -Trending Environment
Elliott Wave Institute, 1278 Glenneyre, Laguna Beach, CA 92651 • (800) 636-9283Copyright ® 1998 by Glenn Neely
FUTURES WEST 1998 • Real-Time TRADING using NEoWave™ Concepts
STOP Placement - Contracting Environment
After entering yourposition due to the“breakout,” your stopshould be placed justbeyond 61.8% of thelength of the new trendand the highest or lowestpoint right before thebreakout occurred.
If the market reallybegan a new trend, itWILL NOT retracemore than 61.8% of thatinitial move.
1 11 21 31 41 51
Long Here
Stop Here(62% of
distance frombreakout high
to reaction low)
Elliott Wave Institute, 1278 Glenneyre, Laguna Beach, CA 92651 • (800) 636-9283Copyright ® 1998 by Glenn Neely
FUTURES WEST 1998 • Real-Time TRADING using NEoWave™ Concepts
1 21 41 61
STOP Placement - Expanding Environment
Once you have entered anExpanding market environment,the stop should go at the highest orlowest point where the zigzaggingaction began. If you get stoppedout, wait for another zigzaggingperiod in the preferred directionbefore reentering, then begin theprocess again.
Zigzaggingaction started,trade entered
Long
Long
Stop Here
Stop Here
Short
Stop Here
Stop placed at highest orlowest point after entry
Raise Stop
Raise Stop
Raise Stop
Raise Stop
Elliott Wave Institute, 1278 Glenneyre, Laguna Beach, CA 92651 • (800) 636-9283Copyright ® 1998 by Glenn Neely
FUTURES WEST 1998 • Real-Time TRADING using NEoWave™ Concepts
1 11 21 31 41
Width of originalconsolidation
STOP Placement - Trending Environment
After you take aposition in what you thinkwill be a trending market,your stop should be onthe opposite end of theconsolidation range at apoint twice the width ofthe original consolidation.
After the market hasdoubled the width of theoriginal consolidationrange, liquidate part ofyour position and moveyour stop to the last lowor high right before thelatest trend began.
As the market goesthrough anotherconsolidation, the samestrategy should be used tomove the stop again (i.e.,once the width of thesecond consolidation isreached, liquidate more ofyour position and moveyour stop to the end of thesecond consolidation).
Initial Stop (double width of initial consolidation)
Shorting Level
Initial consolidation range doubled,liquid part of position, lower stop
Stop lowered to here (after initial consolidation range doubled)
Second consolidation range
Second consolidation range doubled,liquidate part of position, lower stop
Stop lowered to here after thirdconsolidation range doubled
Elliott Wave Institute, 1278 Glenneyre, Laguna Beach, CA 92651 • (800) 636-9283Copyright ® 1998 by Glenn Neely
FUTURES WEST 1998 • Real-Time TRADING using NEoWave™ Concepts
Forecasting and Trade LIQUIDATION
• Using EstablishedSupport/Resistance Levels
• Forecasting • Post- Contraction
• Forecasting • Post- Expansion
• Forecasting • Post- Trending
Elliott Wave Institute, 1278 Glenneyre, Laguna Beach, CA 92651 • (800) 636-9283Copyright ® 1998 by Glenn Neely
FUTURES WEST 1998 • Real-Time TRADING using NEoWave™ Concepts
1 11 21 31 41 51
Forecasting • Post- Contraction
Price action followingContraction (which contains5 segments) will usuallyapproximate the width of thelargest segment duringContraction. In this real-timeexample, Gold went througha multi-month contraction.Once the pattern was over,the initial “thrust” wasapproximately equal to thewidth of the Contraction in aperiod that wasapproximately half the timeconsumed by the Contraction.When trading such asituation, you would want toexit some of your positionwhen the “thrust” approaches100% of the width of theContraction. If you think the“thrust” is going to END thetrend, you should exit allyour positions. If you thinkthe trend is going to continue,only liquidate part of it.
Height and Widthof Contraction
Post Contraction Forecast
Market exceeded the withof the contracting phase inless than half the time
Elliott Wave Institute, 1278 Glenneyre, Laguna Beach, CA 92651 • (800) 636-9283Copyright ® 1998 by Glenn Neely
FUTURES WEST 1998 • Real-Time TRADING using NEoWave™ Concepts
Forecasting • Post- Expansion
Expanding environmentsare composed of five (5)segments. As the expansionbecomes more obvious, youcan predict its END (and thestart of the new trend) bymaking sure five segments arepresent and that the last legbreaks beyond previous highsor lows,
Unless you understandwave theory and know exactlywhat the expansion is part of, itmay not be possible to predictexactly what will happen the expansion. The mostimportant characteristic toremember is, if the market isgoing to completely retrace theexpansion, it will take moretime to retrace Seg. 5 than Seg.5 took to form.
1 21 41 61
Seg. 1
Seg. 2
Seg. 3
Seg. 4
Seg. 5(last leg)
Retracementshould takeslightly moretime than Seg. 5
Post-Expansionretracement
Previous Low brokenduring 5th Segment
Elliott Wave Institute, 1278 Glenneyre, Laguna Beach, CA 92651 • (800) 636-9283Copyright ® 1998 by Glenn Neely
FUTURES WEST 1998 • Real-Time TRADING using NEoWave™ Concepts
Forecasting • Post- Trending
If a market-trend’speak is followed by aconsolidation in whichpart of the consolidationexceeds the end of thetrending period, you cancomfortably assume thetrend is gaining inmomentum (this conceptapplies equally forsituations in which theinitial trend is down).
280
300
320
340
360
380
400
420
440
460
480
500
1 21 41 61 81
Market-trendpeak
Corrective period ends here. During theinterim, the market exceeded the high of thefirst pattern. That behavior implies strengthand indicates the next advance will be atleast as large as the first. To make theprojection, the price/time consumption ofthe first advance is added to the end of theconsolidation.
Minimum Expectation
During consolidation,market makes newhigh, implying futuremarket strength
Elliott Wave Institute, 1278 Glenneyre, Laguna Beach, CA 92651 • (800) 636-9283Copyright ® 1998 by Glenn Neely
FUTURES WEST 1998 • Real-Time TRADING using NEoWave™ Concepts
Trading Does and Don’ts
DO - Maintain charts on multiple time frames so you are aware of ALL influences (trends, support/resistance,trendlines, etc.)
DO - Plan your trading while the markets are closed, you will be more objective
DO - Demand MANY positive factors before entering, just one or two to exit (one can mushroom into many )
DO - BUY Options only during “ dead ” periods, SELL Options only during
DO - Raise stops on a NEW position to breakeven as quickly as possible
DON'T - use arbitrary Stops (i.e., stops based on %’s, specific $ amounts or rigid time values) - Stop placementshould depend on market conditions, not preconceived notions
DON'T - enter a trade when markets are volatile (risk control is difficult - support and resistance levels areusually too far apart to allow for low risk entry)
DON'T - focus on what you MIGHT make if correct, but what you WILL lose if wrong
DON'T - exit a winning trade because you think you have made enough money, wait for clear signs of trenddeterioration OR for your stop to be hit before exiting
DON'T - risk more than 5% of capital on any one trade (2% is approx. ideal - fve losing trades in a row or moreis a real possibility, if you are risking much more than 2% each trade, it will be nearly impossible to recoverafter only a few losses)
Elliott Wave Institute, 1278 Glenneyre, Laguna Beach, CA 92651 • (800) 636-9283Copyright ® 1998 by Glenn Neely
FUTURES WEST 1998 • Real-Time TRADING using NEoWave™ Concepts
Due to thedecline inAug./Sep. of1998, it hasbecome apparentthat the 1994 -1998 “bullmarket” was -underNEoWave™theory - acorrectivepattern. Thatmeans the S&Pwill trendsideways ordown for 1-4years. Downsidepotential is aslow as 700.
[ ]
Elliott Wave Institute, 1278 Glenneyre, Laguna Beach, CA 92651 • (800) 636-9283Copyright ® 1998 by Glenn Neely
FUTURES WEST 1998 • Real-Time TRADING using NEoWave™ Concepts
S&P 500 - Weekly
The drop offof 1998’s highconstitutes thelargest, fastest inover four years.That clearlyindicates the1994 - 1998 rallywas a ComplexCorrective rally.As a result, theS&P will trendsideways for atleast one year; atworst, the S&Pcould correct formore than fouryears and dropbelow 700.
300
400
500
600
700
800
900
1000
1100
1200
1300
1400
Oct 24, 94 Dec 25, 95 Feb 24, 97 Apr 27, 98 Jun 28, 99
x
E
X
a
b
c
ab
c
As I have said before, 1994’s LOW should not be broken for 100+ years!
Elliott Wave Institute, 1278 Glenneyre, Laguna Beach, CA 92651 • (800) 636-9283Copyright ® 1998 by Glenn Neely
FUTURES WEST 1998 • Real-Time TRADING using NEoWave™ Concepts
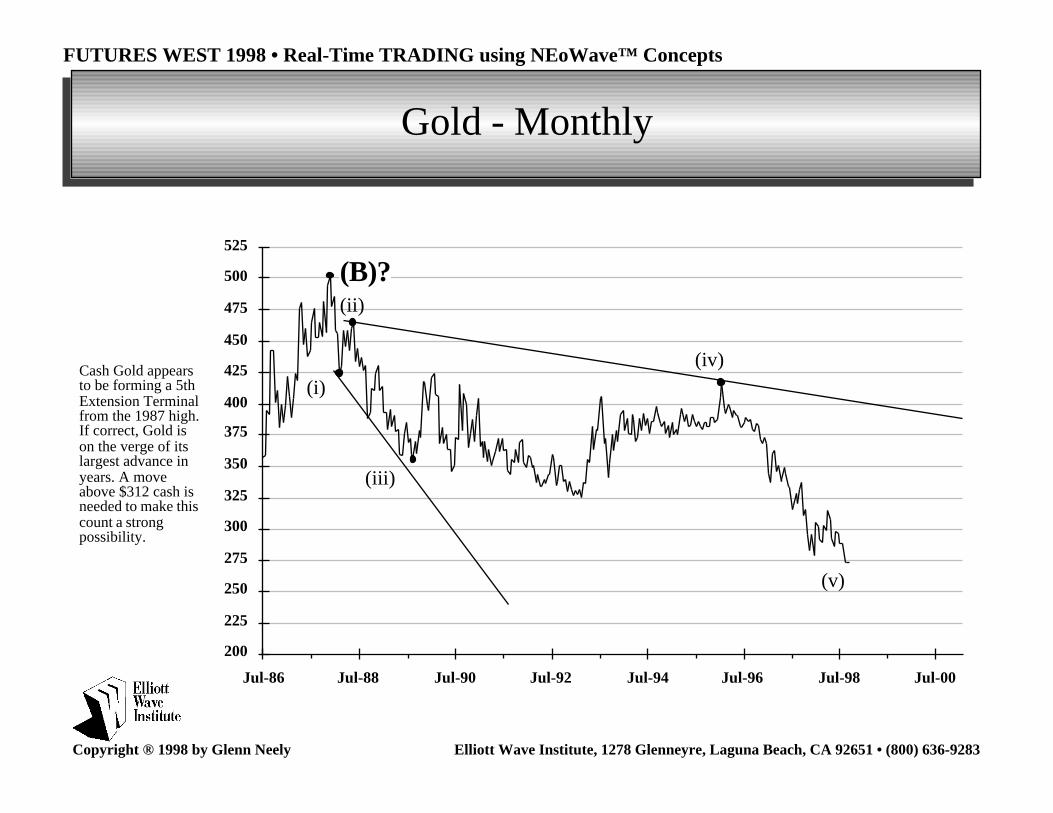
Cash Gold appearsto be forming a 5thExtension Terminalfrom the 1987 high.If correct, Gold ison the verge of itslargest advance inyears. A moveabove $312 cash isneeded to make thiscount a strongpossibility.
Elliott Wave Institute, 1278 Glenneyre, Laguna Beach, CA 92651 • (800) 636-9283Copyright ® 1998 by Glenn Neely
FUTURES WEST 1998 • Real-Time TRADING using NEoWave™ Concepts
Gold - Weekly
225
250
275
300
325
350
375
400
425
450
Oct 25, 95 Apr 24, 96 Oct 23, 96 Apr 23, 97 Oct 22, 97 Apr 22, 98 Oct 21, 98 Apr 21, 99
(v)?
AB
C
X
A
B
C
X
A
B
C
(iv)
D
E
A complexcorrective declinemay have endedwith Gold’srecent rally. Abreak of thedownwardslanting dashedtrendline shouldprovide stage-1confirmation.
Elliott Wave Institute, 1278 Glenneyre, Laguna Beach, CA 92651 • (800) 636-9283Copyright ® 1998 by Glenn Neely
FUTURES WEST 1998 • Real-Time TRADING using NEoWave™ Concepts
Bonds - Monthly
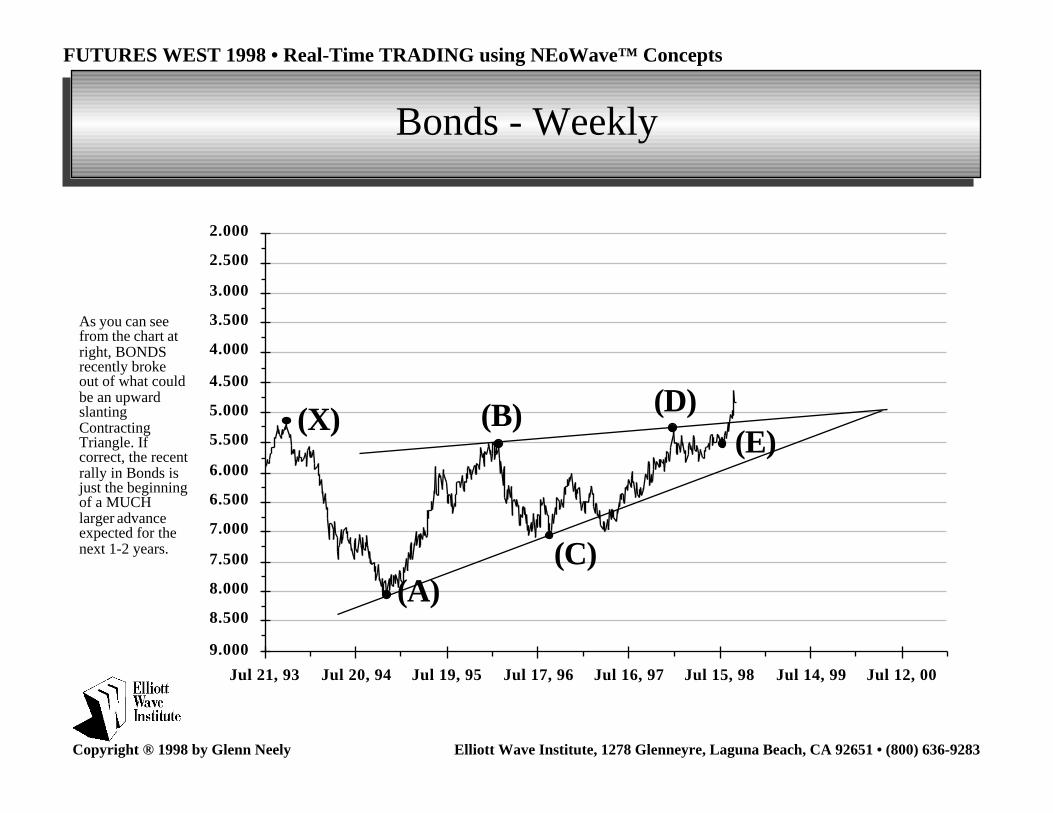
The violentadvance seen inBonds duringAug. and Sep. of1998 indicate the10+ yearconsolidation hasended. Wavestructure tells usthe next moveshould be amulti-yearadvance inBonds, bringing10 year cashyields to 3% orless!
As you can seefrom the chart atright, BONDSrecently brokeout of what couldbe an upwardslantingContractingTriangle. Ifcorrect, the recentrally in Bonds isjust the beginningof a MUCHlarger advanceexpected for thenext 1-2 years.