S1 Real-Time, Wearable, Bio-Mechanical Movement- Capture of Both Humans and Robots with Metal- Free Electrodes Priya Rathi a , Mihir Kumar Jha a , Kenji Hata b , Chandramouli Subramaniam a * a Department of Chemistry, Indian Institute of Technology Bombay, Powai, Mumbai-400076, Maharashtra, India b Director, Nanotube Research Center, National Institute of Advanced Industrial Science and Technology (AIST) Tsukuba, Japan 305 – 8565.
Transcript
S1
Real-Time, Wearable, Bio-Mechanical Movement-
Capture of Both Humans and Robots with Metal-
Free Electrodes
Priya Rathia, Mihir Kumar Jha
a, Kenji Hata
b, Chandramouli Subramaniam
a*
aDepartment of Chemistry, Indian Institute of Technology Bombay, Powai, Mumbai-400076,
Maharashtra, India
bDirector, Nanotube Research Center, National Institute of Advanced Industrial Science and
Technology (AIST) Tsukuba, Japan 305 – 8565.
S2
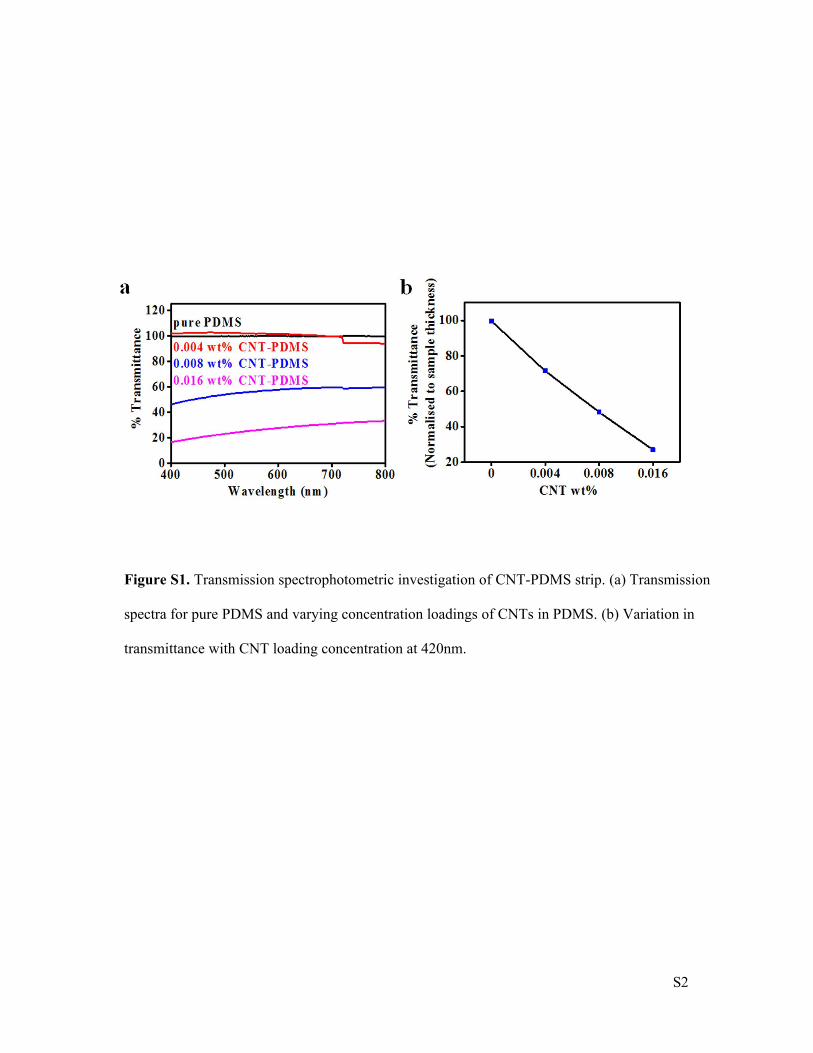
Figure S1. Transmission spectrophotometric investigation of CNT-PDMS strip. (a) Transmission
spectra for pure PDMS and varying concentration loadings of CNTs in PDMS. (b) Variation in
transmittance with CNT loading concentration at 420nm.
S3
Figure S2. Investigation of CNT-thread. (a) SEM image of uncoated, pure cellulose thread.
(b) SEM image of CNT-coated thread. (c) SEM image showing the uniform distribution of
interconnected CNTs when coated on thread. (d) TEM image of the CNTs.
S4
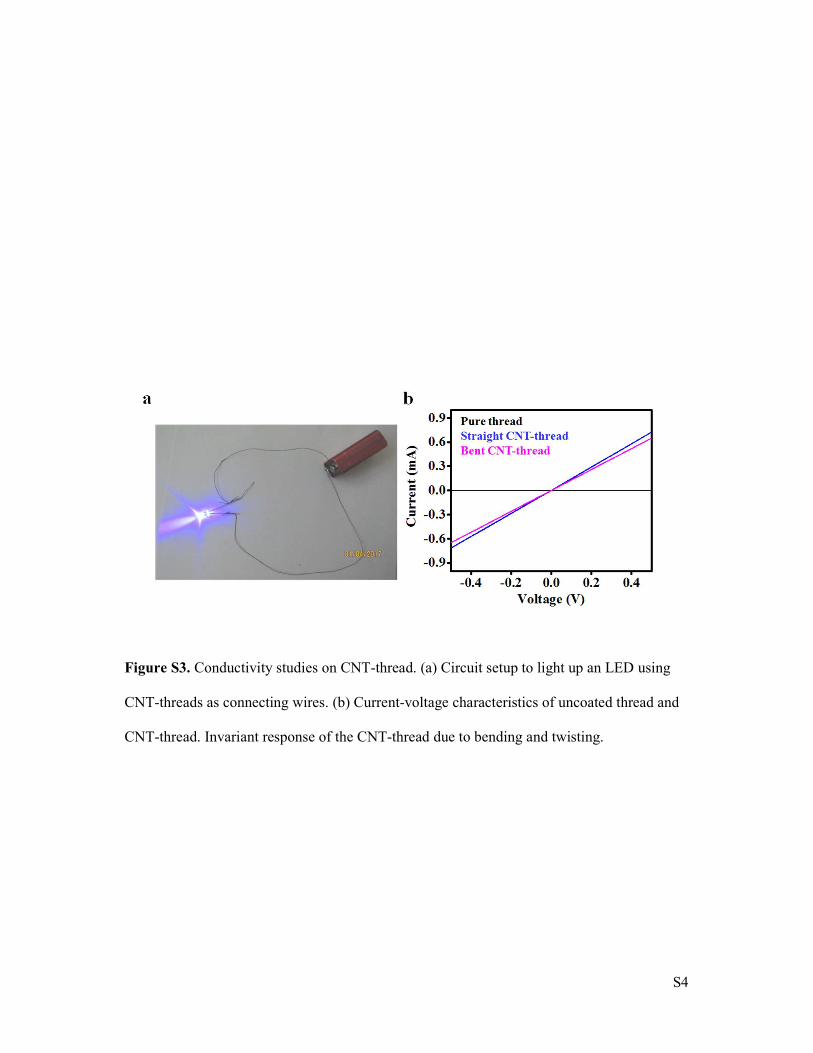
Figure S3. Conductivity studies on CNT-thread. (a) Circuit setup to light up an LED using
CNT-threads as connecting wires. (b) Current-voltage characteristics of uncoated thread and
CNT-thread. Invariant response of the CNT-thread due to bending and twisting.
S5
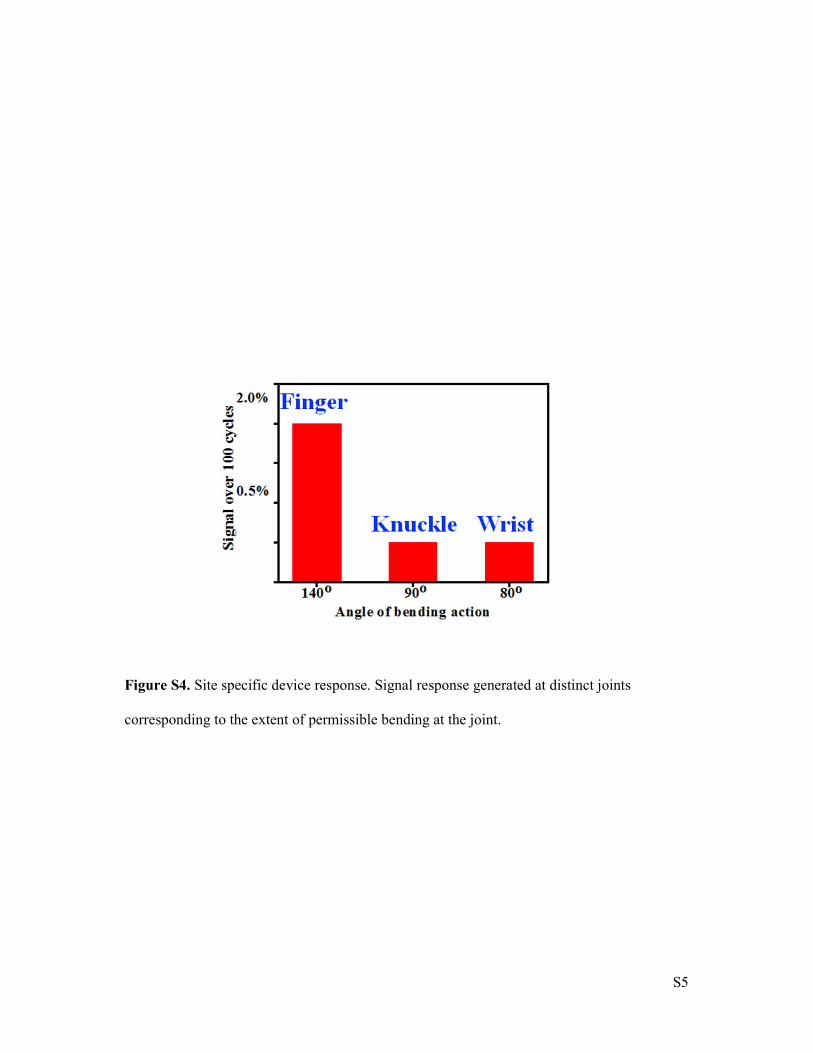
Figure S4. Site specific device response. Signal response generated at distinct joints
corresponding to the extent of permissible bending at the joint.
S6
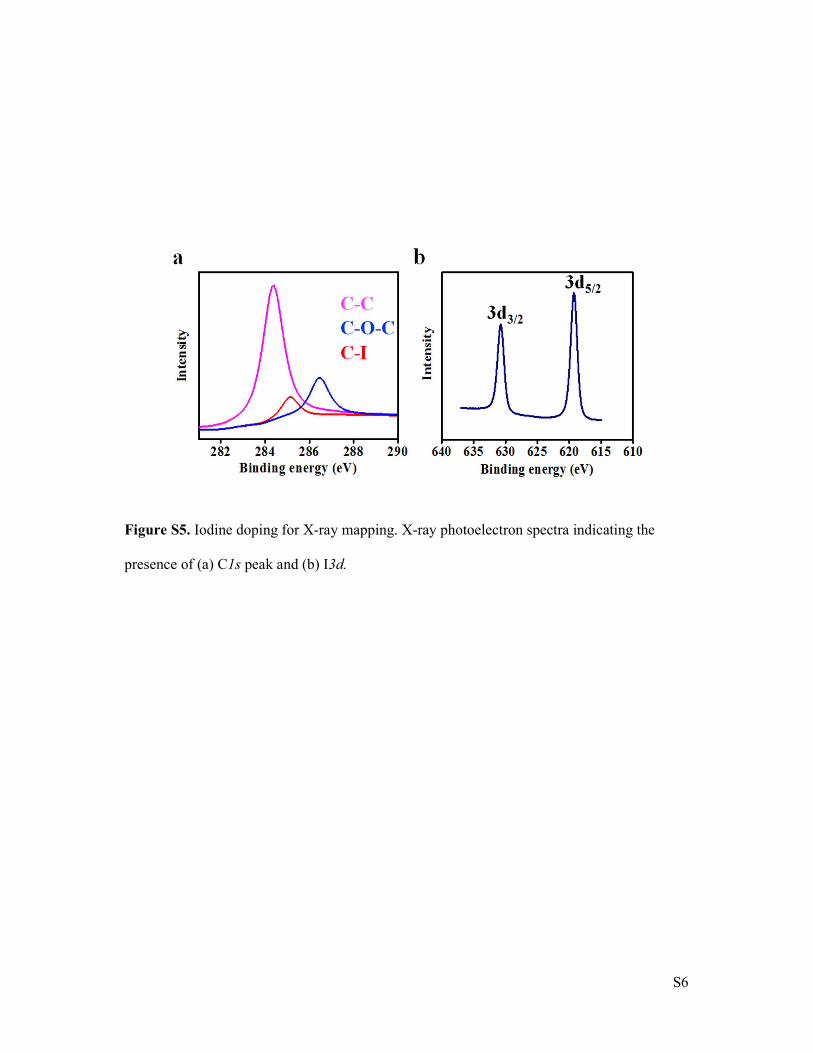
Figure S5. Iodine doping for X-ray mapping. X-ray photoelectron spectra indicating the
presence of (a) C1s peak and (b) I3d.
S7
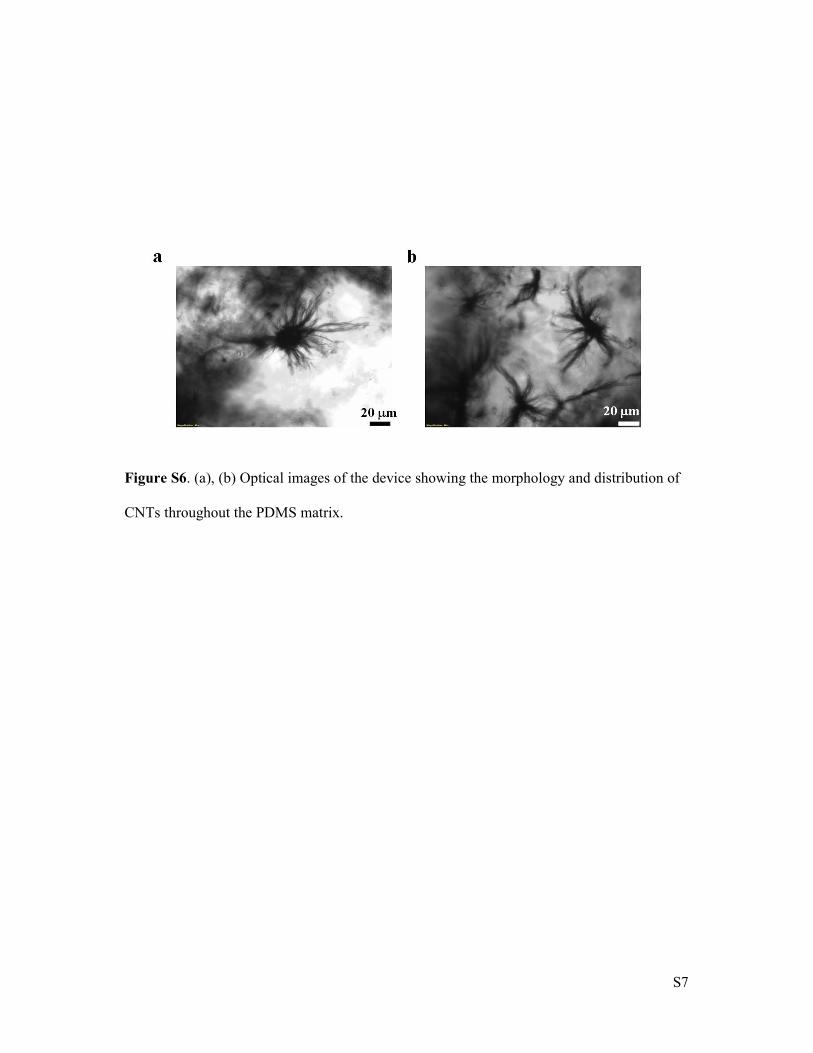
Figure S6. (a), (b) Optical images of the device showing the morphology and distribution of