27 Real Wages, Inflation and Labour Productivity: Evidence from the Public and Private Sectors in Sri Lanka Rohini D. Liyanage 1 Productivity as a measure of efficiency, how productively a nation produces its goods and services using its limited resources, a measure of competitiveness among the nation in the global world, has been a current research interest of many. The main objective of this study is to examine and analyse the relationships between real wages, inflation and labour productivity in Sri Lanka during the period from 2006 to 2019 using quarterly, secondary and seasonally adjusted data. Identifying the factors affecting labour productivity and determining the causal relationship among variables are secondary objectives. The Ordinary Least Square (OLS) and Vector Auto Regression (VAR) models are employed to determine the static and dynamic relationship among Labour productivity (LPDCT), Colombo Consumer Price Index (CCPI), Real Wages in Government Sector (RWGSEC), Real Wages in Private Sector (RWPSEC) and Real Wages in Informal Private Sector (RWIPSEC). Accordingly, in the short run, a negative dynamic relationship between inflation and labour productivity, and a positive relationship between real wages of all sectors and labour productivity are identified. As per the results of FEVD, DLPDCT is a strongly endogenous variable while other variables are least exogenous. Real wages of Private Sector and Real Wages of Informal Private Sector employees’ contributions to labour productivity are significant compared to the Real Wages of Government Sector employees as per the analysis of the sample period. Results suggest that economic growth stimulating policies, and that well-managed lower level inflation, increasing Real Wages of PSEC employees, encourage PSEC by facilitating initial requirements, infrastructure, innovations, research and development to enhance labour productivity. Allocating and assigning more work to government sector employees can be recommended as a measure to further enhance labour productivity in Sri Lanka. One directional causality exists from DLPDCT towards DLCCPI. Further, inflation Granger caused real wages in Private Sector employees as per the Granger Causality Block Erogeneity test during the period studied. 1 The author is currently serving as a Senior Assistant Director of the Payments and Settlements Department. Corresponding email: [email protected] She would like to thank Mr A.T. Sooriyaarachchi and Ms. B.N.K. Fernando for their support. Further, the author is thankful to the anonymous reviewers for their comments and advice. The views presented in the paper are those of the author and do not necessarily indicate the views of the Central Bank of Sri Lanka . Abstract Key Words: Labour Productivity, Inflation, Real Wages, VAR, Sri Lanka
Transcript
27
27
Real Wages, Inflation and Labour Productivity: Evidence from the Public and Private Sectors in Sri Lanka
Rohini D. Liyanage1
Abstrac t
Productivity as a measure of efficiency, how productively a nation produces its goods and services using its limited resources, a measure of competitiveness among the nation in the global world, has been a current research interest of many. The main objective of this study is to examine and analyse the relationships between real wages, inflation and labour productivity in Sri Lanka during the period from 2006 to 2019 using quarterly, secondary and seasonally adjusted data. Identifying the factors affecting labour productivity and determining the causal relationship among variables are secondary objectives. The Ordinary Least Square (OLS) and Vector Auto Regression (VAR) models are employed to determine the static and dynamic relationship among Labour productivity (LPDCT), Colombo Consumer Price Index (CCPI), Real Wages in Government Sector (RWGSEC), Real Wages in Private Sector (RWPSEC) and Real Wages in Informal Private Sector (RWIPSEC). Accordingly, in the short run, a negative dynamic relationship between inflation and labour productivity, and a positive relationship between real wages of all sectors and labour productivity are identified. As per the results of FEVD, DLPDCT is a strongly endogenous variable while other variables are least exogenous. Real wages of Private Sector and Real Wages of Informal Private Sector employees’ contributions to labour productivity are significant compared to the Real Wages of Government Sector employees as per the analysis of the sample period. Results suggest that economic growth stimulating policies, and that well-managed lower level inflation, increasing Real Wages of PSEC employees, encourage PSEC by facilitating initial requirements, infrastructure, innovations, research and development to enhance labour productivity. Allocating and assigning more work to government sector employees can be recommended as a measure to further enhance labour productivity in Sri Lanka. One directional causality exists from DLPDCT towards DLCCPI. Further, inflation Granger caused real wages in Private Sector employees as per the Granger Causality Block Erogeneity test during the period studied.
Key Words : Labour Productivity, Inflation, Real Wages, VAR, Sri Lanka
1 The author is currently serving as a Senior Assistant Director of the Payments and Settlements Department. Corresponding email: [email protected] She would like to thank Mr A.T. Sooriyaarachchi and Ms. B.N.K. Fernando for their support. Further, the author is thankful to the anonymous reviewers for their comments and advice. The views presented in the paper are those of the author and do not necessarily indicate the views of the Central Bank of Sri Lanka
.
Abstract
Key Words: Labour Productivity, Inflation, Real Wages, VAR, Sri Lanka
Indrajith
Typewritten Text
DOI: http://doi.org/10.4038/ss.v49i2.4718
Central Bank of Sri Lanka – Staff Studies – Volume 49 Number II - 2019
28
28
1. Introduction
Productivity can be identified as a measure of efficiency of production, and a measure for competitiveness among nations. Therefore, the factors affecting productivity are also of paramount importance in order to identify the relationship and make recommendations to enhance productivity, as well as to achieve higher economic growth and other long-term objectives of any economy. "Productivity isn't everything, but in the long run it is almost everything. A country's ability to improve its standard of living over time depends almost entirely on its ability to raise its output per worker" (Krugman). It provides a basis for consumption, savings, investments, poverty reduction and is a vital factor of international competitiveness. Hence, productivity improvement is a substantial issue for many countries. Real wages and inflations can be identified as key determinants of labour productivity as per theoretical and empirical literature. Labour productivity is defined as the output per unit of labour input which is considered a measure of efficiency and expressed as a ratio of GDP. Wages can be identified as return to the labour compensation to the employer. Real wages are wages adjusted for inflation, measured by the consumer price index and providing a guide for the changes to the cost of living. Inflation can be identified as a continuous increase of the general price level of a country as measured by consumer price indices.
As per the Production function, production is a function of factors of production, namely labour and capital. In the short run, only labour can be changed while other factors change only in the long run. Other factors include capital, technological change and population growth. Wages are monetary compensation paid by a firm for the commitment of labour for the workers. Therefore, wages are the primary source of income and expenditure in a household. Real wages can be defined as wages adjusted for inflation, or the purchasing power of nominal wages that workers are interested in. Higher inflation leads to lower real wages due to erosion of the purchasing power of the nominal wages. Therefore, both wages and inflation are concerns in labour market related issues. Efficiency wages, average wages and minimum wages are found among labour market concepts. Countries have convergence in minimum wages to ensure the basic requirements of workers. (Shapiro and Stiglitz) found that the Efficiency wage theory is based on the idea that increasing wages can increase labour productivity. Efficiency wages can be identified as wages above the equilibrium level of the market, and there are reasons for existing efficiency wages in the market. Risk of the opportunity cost of job loss is higher and thus workers tend to work more efficiently. When labour cost is higher, firms change factor inputs by substituting capital for labour which causes increase in the Marginal Productivity of Labour (MPL). As per the Neo-classical theory, wage determination is based on the marginal productivity of labour. As per empirical evidence, the relationship between real wages and productivity are positive (Narayan and Smyth; Wakeford ; Strauss and Wohar; Alexander; Hall). Such findings are supported by the efficiency wage hypothesis and a mix of factor inputs from labour to capital. (Gordon) explains that factor
As per the Production function, production is a function of factors of production, namely labour and capital. In the short run, only labour can be changed while other factors change only in the long run. Other factors include capital, technological change and population growth. Wages are monetary compensation paid by a firm for the commitment of labour for the workers. Therefore, wages are the primary source of income and expenditure in a household. Real wages can be defined as wages adjusted for inflation, or the purchasing power of nominal wages that workers are interested in. Higher inflation leads to lower real wages due to erosion of the purchasing power of the nominal wages. Therefore, both wages and inflation are concerns in labour market related issues. Efficiency wages, average wages and minimum wages are found among labour market concepts. Countries have convergence in minimum wages to ensure the basic requirements of workers. (Shapiro and Stiglitz) found that the Efficiency wage theory is based on the idea that increasing wages can increase labour productivity. Efficiency wages can be identified as wages above the equilibrium level of the market, and there are reasons for existing efficiency wages in the market. Risk of the opportunity cost of job loss is higher and thus workers tend to work more efficiently. When labour cost is higher, firms change factor inputs by substituting capital for labour which causes increase in the Marginal Productivity of Labour (MPL). As per the Neo-classical theory, wage determination is based on the marginal productivity of labour. As per empirical evidence, the relationship between real wages and productivity are positive (Narayan and Smyth; Wakeford; Strauss and Wohar; Alexander; Hall). Such findings are supported by the efficiency wage hypothesis and a mix of factor inputs from labour to capital. (Gordon) explains that factor
29
Real Wages, Inflation and Labour Productivity: Evidence from the Public and Private Sectors in Sri Lanka
29
substitution from labour to capital in response to inexorable/unstoppable increases in real wages has been at the heart of the economic growth process for centuries.
Inflation is a short-term objective of the monetary authorities of a country. In stabilization policies, which include fiscal and monetary policy, more attention has been paid to keeping a lower level inflation to achieve long term objectives of an economy. Some developed countries have converged to maintain a lower level of inflation that has defined below 2 per cent. Inflation negatively impacts productivity due to the impact of worker purchasing power, motivation and effort. Further, inflation impacts investment plans of firms, capital depreciation rates and substitution of factor inputs that is capital for labour. An inflation and real wages related study by (Hendry) concludes that inflation responds to many parts of an economy including labour cost and labour market. A negative relationship between inflation and labour productivity has been established in the majority of empirical analysis. (Freeman and Yerger "Does Inflation Lower Productivity? Time Series Evidence on the Impact of Inflation on Labor Productivity in 12 Oecd Nations") examine whether there is an empirical support to reduce already low rates of inflation to increase labour productivity growth and economic growth. Findings do not support the view that further reductions in inflation from already low single-digit levels would have a positive impact on labour productivity growth for major industrial countries. Therefore, it is a well-established fact that there must be a stable lower level inflation rate to stimulate economic activity and growth while a higher level of inflation is harmful to encourage economic activities. Several arguments point out that this inverse relationship is spurious due to cyclical movements of the variables.
In Sri Lanka, labour productivity has performed well compared to the other countries of the region. Being a competitive nation is important in the globalized world among its peer countries. Higher economic growth is a primary factor of increasing productivity. Countries with a higher economic growth enhance their productivity, living standards and competitiveness. Economic growth in Sri Lanka has been limited to around 5 per cent for the last two decades. Inflation also has been managed at mid-single digits level after the end of civil war in 2009. Wages of government and private sector employees increase with the bargaining powers of trade unions periodically, and for government sector employees, the COLA allowance is additionally annexed to the wages that link to the inflation. As per the Central Bank of Sri Lanka (Central Bank of Sri Lanka Annual Reports 2018; Central Bank of Sri Lanka Annual Report 2019) real wage erosion was prominent in both government and private sector employees. This might have resulted in deteriorating living standards, consumption and exposing employees to the poverty margin since wages are their primary source of expenditure. Lower real wages lead to lower labour productivity even with easing inflation. Inflation keeps at a lower level in Sri Lanka, and economic growth is slowly improving while real wages are improving in the government and informal private sectors. With these recent developments, it is required to examine whether there is a possibility to stimulate economic growth and enhance productivity to facilitate higher standard of living, competitiveness and achieve other
Central Bank of Sri Lanka – Staff Studies – Volume 49 Number II - 2019
30
30
long-term objectives. Further, according to the (Asian Development Bank, International Labour Organisation and Regional Office for Labour the Pacific) Sri Lanka has entered a demographic transition characterized by lower birth and death rates. This causes the working-age population to decline with an ageing of society and the rising age dependency ratio. To sustain the expenses, a higher growth rate is to be achieved to cushion the requirements of pensions, health and other expenses. Further, Sri Lanka was categorized as an upper middle-income country based on the per capita gross national income in 2017, while later the category was downgraded to a lower middle-income country in 2020 considering revisions to national accounting methods and adjustments to keep income classification thresholds fixed in real time. However, it takes a long time to reach the upper level income status compared to other emerging market economies. Now the challenge of the Middle-Income Trap (MIT) must be overcome through efficiency-based productivity which comes by together with technology and innovations. In this regard, (Pruchnik and Zowczak) point out that being stuck in MIT could be led by decrease of productivity due to factors like less economic diversification, the inelastic and inefficient labour market, inefficient financial market, outdated infrastructure facilities, inefficient institutions and less innovations. As per the above categorization, Sri Lanka belongs to the lowest level of economic diversification and inefficient labour market. Therefore, in order to overcome this challenge, the next level would rely on efficiency driven productivity growth. Therefore, in all these scenarios, an increase in labour productivity is essential to sustain economic growth and thereby achieve a higher standard of living, the wellbeing of the nation and to maintain the economy’s competitiveness.
Studies have covered mostly developed countries such as the USA, the UK, European countries, Australia, Japan, Korea and Malaysia. Further, Studies has been limited to capture the real wages of the manufacturing and mining sector while contributions of other sectors are also substantially high in the economy. From the economic viewpoint, contributions of agriculture, industry and service sectors change when economic transits happen. Further, Panel data analysis techniques have been used to examine problems related to macro-economic variables that are different country-wise. In some studies, small sample and annual data have been employed while data frequency is monthly or quarterly for the macroeconomic variables. More attention is paid to the relationship between inflation and labour productivity and conclude with endless arguments that the relationship between inflation and productivity is spurious due to variables are not integrated in same order and cyclical movements of the variables. Further, no studies have been conducted on inflation, real wages and labour productivity in the case of Sri Lanka. Therefore, with the existing gap in the literature on the relevant field, this study tries to fill the vacuum in literature related to the relationship among inflation, real wages and labour productivity covering both government and private sectors using quarterly, secondary data. The direction of causality is also considered, which has been covered in many studies but has ended up in different findings based on the data. Therefore, this study contributes to fill the existing gap in literature and methodology, and makes policy
31
Real Wages, Inflation and Labour Productivity: Evidence from the Public and Private Sectors in Sri Lanka
31
level recommendations in order to improve labour productivity subject to managing inflation and improving real wages and the wellbeing of the society. The aim of this study is to analyse the relationship among real wages, inflation and labour productivity of the public and private sectors in Sri Lanka from 2006 to 2019. Finally, the causality among inflation, real wages and labour productivity are examined to better predict variables using lag values of others.
The remainder of this paper is structured as follows: section 2 is allocated for conceptual, theoretical and empirical literature and critical reviews related to inflation, real wages and labour productivity and thereby a research gap is identified, and the importance of contribution in terms of theory, methodology and policy related recommendations are pointed out. Methodological aspects of the research are discussed in section 3 covering the economic approach, conceptual framework, analytical methods and data collection methods, sources etc. Data presentation and analysis are done in section 4. Finally, section 5 is devoted to the summary of findings, theoretical relevance, conclusions, inferences and policy recommendations.
2. Literature review
2.1 Theory and empirical literature There are theories of inflation, real wages and productivity that are separately described in literature. Empirical literature on the topics can be categorized into three as the relationship between inflation and labour productivity, real wages and labour productivity, and inflation real wages and labour productivity, and is reviewed below.
2.2 Inflation and productivity Interest on inflation and productivity has been a growing concern with the stabilization policy conditions set under the fiscal and monetary discipline. Economists’ argument on inflation and productivity can be identified as inflation having a negative impact on productivity through price signalling to economic agents and sectors. Firstly, inflation impacts worker purchasing power, a mix of factor inputs and to the investment’s plans. Worker purchasing power is from the labour supply side factor and the other two are from a production point of view. (Feldstein) concludes that given the existing tax structure, inflation lowers the real return on capital. A number of studies have been conducted related to inflation and productivity. Research covers the USA and European countries with panel data analysis, and econometric techniques are used for annual or quarterly data while stationary test and cointegration test in Johansen methodology are followed. Findings of empirical literature are in line with theory and give somewhat different views from theoretical concepts. Accordingly, many studies (Clark; Bårdsen, Hurn and McHugh; Buck and Fitzroy; Christopoulos and Tsionas; De Gregorio; Narayan and Smyth; Smyth) conclude that there is a negative relationship between inflation and productivity.(Kim, Lim and Park) suggest that productivity
Central Bank of Sri Lanka – Staff Studies – Volume 49 Number II - 2019
32
32
inflation nexus became stronger in Korea due to Asian financial crisis. One study from the few studies conclude with mixed findings. (Sbordone and Kuttner) conclude that there is a negative relationship between inflation and labour productivity. Further, they show that it is difficult to conclude as higher inflation causes productivity to fail. This conclusion is made regarding the US, covering the period of 1949-94 post-war evidence. (Cameron, Hum and Simpson) in the study of Stylized facts and stylized illusions, inflation and productivity revisit covering Canada, the USA, the UK and West Germany. They conclude that there is no evidence for any connection between inflation and productivity growth in the long run while there is a strong connection between inflation and productivity growth in the short run, and that it depends entirely on the cointegration and stationary properties of the variables.
(Freeman and Yerger "Inflation and Multifactor Productivity Growth: A Response to Smyth") conclude that the impact of inflation on multifactor productivity growth is so minor that it did not show up as statistically significant in the analysis. Moreover, (Freeman and Yerger "Does Inflation Lower Productivity? Time Series Evidence on the Impact of Inflation on Labor Productivity in 12 OECD Nations") show that there is no evidence of a consistent relationship between inflation and productivity growth with regard to either sign or magnitude. Therefore, study does not support to further reduction of low inflation to enhance labour productivity. In line with this (Hondroyiannis and Papapetrou "Temporal Causality and the Inflation-Productivity Relationship: Evidence from Eight Low Inflation Oecd Countries") argue that there is no important relationship between inflation and productivity. According to their study, the bivariate relationship between inflation and productivity is ‘spurious’ due to inflation and productivity being integrated in a different order and there is a unidirectional causality from inflation to productivity for five countries. Further it concludes that there is no evidence of a consistent relationship between inflation and productivity growth with regard to either sign or magnitude. (Papapetrou) examines the inflation and productivity relationship in Poland from 1991-1998 concluding the same, spurious relationship between inflation and productivity. (Christopoulos and Tsionas; Mehra) examine the relationship between inflation and productivity using unit root and cointegration techniques and conclude that there is a bidirectional relationship in the long run. Lack of consensus can be noticed in relation to the literature on inflation and labour productivity. Reasons could be considering only a nominal variable and the omission of other important variables related to labour productivity.
Accordingly, the majority of empirical literature suggests that the relationship between inflation and labour productivity is negative. Findings of other studies vary from negative to zero and towards an insignificant relationship. Causality between inflation and productivity is also a mixed finding that runs from inflation to productivity, and from productivity to inflation. Well-established direction of causality running from inflation to productivity appeared in many studies. Methodology used in early studies on inflation and labour productivity was the ratios, regressions analysis and time series analysis. Small samples used for the analysis lead towards distorting the power of the test and mislead conclusions which
33
Real Wages, Inflation and Labour Productivity: Evidence from the Public and Private Sectors in Sri Lanka
33
are representative. Cointegration and causality have also been tested. There is an argument that the relationship between inflation and productivity is ‘spurious’ based on the different order of integration and cyclical movements of the variables. In this regard (Hendry) finds that UK inflation is best characterised as integrated at level variable, but non-stationary due to regime breaks over a very long sample. (Bruno and Easterly; Chowdhury and Mallik) argued that this negative relationship between inflation and productivity are only indicative for high frequency data and with the observation of higher inflation.
2.3 Real wages and labour productivity It has been proven that the increase of real wages increases labour productivity significantly. (Erenburg; Klein; Mora, Lòpez-Tamayo and Suriñach; Hsu) conclude that raising real wages lead to stimulate labour productivity which is supported by many reasons. Implying with efficiency wages which are higher real wages than equilibrium level exists, opportunity cost of jobless are higher. This leads to greater work efforts and avoids redundancy. Further, firms tend to substitute factor inputs from labour to capital due to higher wages. (Gordon) explains that, factor substitution from labour to capital in response to inexorable/unstoppable increases in real wages has been at the heart of the economic growth process for centuries. Therefore, the positive relationship between real wages and productivity is well-established in theory and empirical studies. According to (Wakeford ) there is a long-run relationship between productivity and real wages. Further, factor substitution from labour to capital could increase the marginal labour productivity. (Kim) studied real wages and nominal shock: evidence from Pacific-rim countries covering Japan, New Zealand. Korea and Australia. Findings suggest that positive real-wage responses are reported in Japan and New Zealand while negative responses are reported in Australia and Korea. Further, it recommends the sticky price model and the sticky wage model for the two countries respectively. In the transmission of nominal shocks to real economic activities, the findings show a sticky-price model to be more important in Japan and New Zealand, while a sticky-wage model plays a more dominant role in Australia and Korea. Efficiency wages, average wages and minimum wage are also considered in the labour market concept and a country-wise convergence on minimum wages can be seen to ensure the basic requirement fulfilment of workers. (Angeles-Castro, Juárez-Cruz and Flores-Ortega) discuss the effect of average wages on the economy, and show that average wage growth increases economic growth, reduces inflation and does not affect unemployment. Moreover, (Katovich and Maia) suggest that productivity is significantly associated with wages of all sectors of the economy in Brazil. (Maia and Sakamoto) in the study, “Does wage reflect labour productivity? A comparison between Brazil and the United States”, conclude that wages in the US are more attached to labour productivity while in Brazil average earnings grew initially much faster than labour productivity.
In contrast, (Alexander) examines the changing relationship between productivity, wages and unemployment in the UK during the period from 1955-1991. It was found that there is no
Central Bank of Sri Lanka – Staff Studies – Volume 49 Number II - 2019
34
34
direct link between wages and productivity while causality runs from wages to unemployment but not conversely. (Islam, Kinyondo and Nganga) reveals that there is no clear pattern in the link between real wages and productivity which depends on the sector. Real incomes in the private sector have registered a negative growth and the opposite is evident in the public sector, while real wages have a significant impact on productivity in the manufacturing sector. (Brida, Risso and Carrera) study real wages as a determinant of labour productivity in the Mexican tourism sector and conclude that there is no evidence of a direct relationship between wages and productivity. Therefore, in empirical literature, findings of some studies are not in line with the theory.
Overall, the theoretically established positive relationship between real wages and productivity can be found in many empirical studies while several others have concluded that the relationship between the two variables is not significant or there is no direct link between variables. Direction of causality has been found from productivity towards real wages while it has changed later from inflation, real wages towards productivity. Many of the studies cover only real wages of the manufacturing and mining sector while one study examines that productivity is significantly impacted by real wages in all sectors in Brazil. Later, it further establishes that wages as well as average earnings impact labour productivity in the US and Brazil respectively. Further, it can be noticed that there is less attention to real wages and labour productivity compared to studies on inflation and labour productivity in the empirical literature.
In practice, there are rigidities for adjustment towards the equilibrium in the labour market. It can be observed as an upward adjustment and downward sticky wages. Government sector and private sector real wages are sticky compared to the informal private sector real wage adjustments with market forces. Consequently, any type of intervention to the market can be identified as a delay in adjustment towards the equilibrium. The sticky wage theory hypothesizes that the pay of employees tends to have a slow response to the changes in the performance of a company or the economy. According to the theory, when unemployment rises, the wages of those workers that remain employed tend to stay the same or grow at a slower rate than before rather than falling with the decrease in demand for labour. In this study, real wages of the Government and private sectors are sticky compared to the informal private sector real wages that are adjusted with market forces.
2.4 Real wages, inflation and labour productivity Empirical literature has established the relationship between real wages, inflation and labour productivity gradually with more attention to inflation and productivity than real wages and productivity. Later, it has incorporated all variables into one model as an interrelationship among inflation, real wages labour productivity in a trivariate model. In the empirical literature on inflation wages and labour productivity, different findings have been reported while some are in line with the theory. At least one of the variables has impacted significantly on labour
35
Real Wages, Inflation and Labour Productivity: Evidence from the Public and Private Sectors in Sri Lanka
35
productivity in their studies. (Hondroyiannis and Papapetrou "Seasonality-Cointegration and the Inflation, Productivity and Wage Growth Relationship in Greece") find that in the short-run, dynamic results are indicative of a negative effect of inflation on productivity but not of a clear-cut effect of wages on productivity, while there has not been long run relationship among variables. Accordingly, inflation has an effect on productivity rather than wages in the short run. However, (Strauss and Wohar) in their study of the USA of the period 1956-96 show that prices are weakly exogenous and cause movements in unit labour cost. Further, there is a bidirectional causality between real wages and productivity while the relationship is not one-to-one. It examines the relationship between inflation and real wages, and real wages and productivity as well. The positive relationship between real wages and labour productivity is further confirmed by (Kumar, Webber and Perry) in their study on real wages, inflation and labour productivity in Australia for the period of 1965-2007, findings quantify that 1% increase in real wages of manufacturing sector is expected to increase productivity between 0.5% and 0.8% implying a positive significant relationship between wages and productivity while the effect of inflation on manufacturing sector productivity is not significant. In line with the same, (Narayan and Smyth) also confirm that a 1% increase in real wages generates a 0.6% increase in productivity while effects of inflation on productivity are insignificant. (Tang) on the study of the effect of real wages and inflation on labour productivity in Malaysia during 1970-2007, points out that there is a negative relationship between inflation and labour productivity while the effect of real wages on labour productivity is a non-linear/ U shaped one. In the causal relationship, real wages Granger cause productivity while reverse causation is not valid. A one directional relationship from real wages towards productivity has thus been identified supporting with efficiency wage theories. (Yildirim) studies the relationship among labour productivity, real wages and inflation in Turkey covering the 1988-2012 period, and concludes that inflation has a greater impact on productivity than real wages while Granger causality shows that there is a strong relationship between labour productivity and inflation. However, (Dritsaki) concludes that there is a negative relationship between inflation and productivity. Additionally, the impact of wages on labour productivity is far greater than the impact of inflation.(Eryılmaz and Bakır) examine real wages, inflation and labour productivity within the Turkish context in the period 1988-2012 and reveal that there is a long-term relationship among the variables from productivity and inflation towards the real wages. In the short run, a causality relationship exists both from inflation to real wages and from inflation to productivity. Thus, findings are supported the acceptance of the alternative hypothesis: there is a relationship among real wages, inflation and labour productivity against the null hypothesis; there the is no relationship among real wages, inflation and labour productivity.
Central Bank of Sri Lanka – Staff Studies – Volume 49 Number II - 2019
36
36
2.5 Concerns of empirical literature There are many studies that analyse the relationship between labour productivity and wages, and labour productivity and inflation separately. Recent studies incorporate a trivariate model to examine the interrelationship among real wages, inflation and labour productivity. Several concerns are noted regarding this empirical literature. Firstly, the majority of studies are limited to developed countries such as the USA, the UK, European countries, Australia, Japan, Korea and Malaysia. Secondly, the studies cover only the manufacturing sector, while other sectors also play a vital role in the productivity process. As per the economic viewpoint, productivity in the agriculture sector is lower compared to the other sectors. In this research field, no attention has been paid towards a sector wise analysis though the base for any economy is primarily the agriculture sector. Thirdly, only a few recent studies have covered the analysis subject to testing basic properties of time series data. Other studies have employed panel data analysis techniques to examine the relationships between macro-economic variables which may vary country-wise. Cointegration analysis is conducted with small sample sizes which might distort the power of the test and cause reliability issues. More attention is placed on studies related to inflation and labour productivity. Further, there is an argument that the relationship which exists among the variables is ‘spurious’ which has been concluded based on all variables that have not been integrated at level and due to the cyclical movements of the variables. In this regard, (Hendry) finds that UK inflation is best characterised as integrated at level variable, but non-stationary due to regime breaks over a very long sample. In this regard (Bruno and Easterly) and (Chowdhury and Mallik) argued that this negative relationship between inflation and productivity are only indicative for high frequency data and with the observation of higher inflation. In some studies, sample period is limited, annual data has been used while movements of the variable are in quarterly or monthly data. In the case of Sri Lanka, no study has been conducted on inflation, real wages and labour productivity; accordingly, there is a vacuum in the literature.
With these concerns in empirical literature and the existing gap in literature on real wages, inflation and labour productivity, this study is conducted to examine the relationship among inflation, real wages and labour productivity, improving coverage of both government and private sectors, to find the key factors affecting labour productivity in Sri Lanka. Real wages are considered sector wise as Government, private and informal private sector to identify the sectoral contribution. Granger causality tests are conducted to check whether one or two direction causality exists among variables and for the use of predicting variables. Multi-equation time series analysis techniques subject to the basic diagnostic test of statistical properties of the variables are employed for the quantitative secondary quarterly seasonally adjusted data spanning from 2006-2019.
Accordingly, a null hypothesis is formed as there is no relationship among real wages, inflation and labour productivity against the alternative hypothesis that there is a relationship among real wages, inflation and labour productivity in Sri Lanka. The validity of the hypothesis is
37
Real Wages, Inflation and Labour Productivity: Evidence from the Public and Private Sectors in Sri Lanka
37
tested using a time series statistical analysis model, VAR via the computer software package E-Views. Identifying strong evidence among inflation real wages and labour productivity can be used for shaping policy formulation to enhance productivity, control inflation, increase real wages, consumption simulation and achieving other long-term objectives of the economy.
3. Methodology
The aim of the study is to find and analyse the relationship between real wages, inflation and labour productivity in Sri Lanka during the period from 2006 to 2019. Both qualitative and quantitative analytical methodologies are used for the study. In order to analyse quantitative data, time series analytical techniques are used depending on the stationarity and cointegration of data. As per theoretical and empirical literature, labour productivity depends on real wages and inflation. Therefore, based on economic theory and empirical studies, labour productivity (Gross Domestic Product divided by Hours of work per week) is considered as the dependent variable while Real Wages of Government Sector Employees (RWGSEC), Real Wages of Private Sector Employees (RWPSEC), Real Wages of Informal Private Sector (RWIPSEC) employees and inflation are considered the independent variables. Data has been collected using various secondary sources such as Department of Census and Statistics (DCS) and Central Bank of Sri Lanka (CBSL). All data used in the study are seasonally adjusted in logarithm transformation form in order to remove the seasonality and heteroscedasticity problems.
As per economic approaches and empirical studies, the relationships between variables are described as follows:
GDP: Gross Domestic Product, 2010 =100, quarterly data
HWPW: Hours of work per week as given by labour force indicators, quarterly data. Quarterly figures are multiplied by 13 in order to get the total hours of work in the quarter.
RWGSEC1 : Real wages of Government Sector Employees measured by Wage Rate Index, 2010 = 100 quarterly data are calculated, using monthly data.
1 Employees governed under the circular of the Ministry of Public Administration
Central Bank of Sri Lanka – Staff Studies – Volume 49 Number II - 2019
38
38
RWPSEC2 : Real Wages of Private Sector employees measured by WRI, 1978 =100, quarterly data, using monthly data.
RWIPSE 3: Real wages of Informal Private Sector Employees, 2012 = 100, quarterly data, using monthly data.
CCPI: Inflation as measured by price indices 2013= 100, quarterly data calculated, using monthly data.
Coefficient of β1, β2 and β3 of real wages shows the labour’s productivity elasticity in relation to real wages, and is expected to be positive. The coefficient β4 of inflation shows labour’s productivity elasticity, and is expected to be negative. Logarithmic transformation of the above equation is as follows:
Basic test to be followed for time series data, before estimation of the model, can be described as below.
3.2 Unit root test Since time series data are used for the analysis, a basic test to check the stationarity of the variables should be performed. In this regard, (Granger, Newbold and Econom) show that if all variables are not stationary there is a chance to estimate a spurious regression. Therefore, in order to find whether the series are integrated of order (0) or I (1), Dickey-Fuller (ADF) (1979, 1981) and Phillips-Perron (PP) (1988) tests are used in conducting unit root test and make a conclusion whether series are unit roots and the order I(0) or I(1). As per (Phillips and Ouliaris) results of the all of these test are shown to be asymptotically similar representations of their limiting distribution. Stationary variables give the best linear predictors.
3.3 Cointegration test Cointegration is associated with the long run relationship among the variables. If all variables are stationary or integration in order I (0) or level, then it is decided, there is no cointegration relationship among variables and a Vector Auto Regression (VAR) model is possible. In order to check whether there is a long run relationship among variables, a cointegration test is performed using (Johansen) methodology.
2 Wages governed by the wage board and trade union, contribute to the EPF, compiled by the Department of Labour 3 Employees who do not contribute to any of the formal Funds for retirement benefits
39
Real Wages, Inflation and Labour Productivity: Evidence from the Public and Private Sectors in Sri Lanka
39
There are two ways of checking cointegration. For the variables/ series of integrated order I(1) are tested in (Engle and Granger) named as residuals tests. Also, there is the Johansen methodology (1988, 1991) which refers to a system of equations of the series and uses the method of maximum likelihood. Since in the study, several variables are considered, the Johansen methodology is used to check whether cointegration exists. There are two types of Johansen tests, test statistics with trace or with eigenvalue indicates the cointegration relationship and the rank.
3.4 Lag length criteria Determining the lag length of the autoregressive process for a time series is a crucial econometric exercise. Purpose of choosing an optimal lag is to reduce residual correlation. Information criterion for lag length selection in determining the autoregressive lag length are Akaike’s information criterion (AIC) and Final Prediction Error (FPE). According to (Liew) most economic sample data can seldom be considered “large” in size, and AIC and FPE are recommended for the estimation of the autoregressive lag length. In practice, the model is estimated as lag order criteria and the appropriate lag length is selected based on information criteria.
3.5 VAR estimation The VAR model is estimated to analyse the dynamic impact of random disturbances of the system of variables which are all endogenous, based on the stationarity and cointegration relationship among variables. Results of the VAR model are explained by means of impulse response functions and variance decomposition. Before VAR estimation, basic diagnostic test and after the estimation, stability test and residual tests are performed to measure the appropriateness of the model. The VAR model can be described using its own lags for each variable. Therefore, estimating a VAR using Y variable can be given as below.
If we assume, yt = (y1t, y2t,.ykt)’ Vector of endogenous variable as, k dimensional stochastic time series, t =1,2,3,….T, yt ~I(1), yit ~ I(1), I =1,2,3…..k
k is affected by exogenous time series of d dimension xt = (x1t, x2t,….xdt)’ Vector of exogenous variables, then, VAR model can be written as
yt = A1yt – 1 + A2yt – 2 +……..+ Apyt – p + Bxt + et (3)
yt = endogenous variable
xt = exogenous variable
A1, A2….Ap , k x k matrices of the lag of coefficients to be estimated
et = (e1t,e2t,…..ekt)’ k x 1 white noise term
Central Bank of Sri Lanka – Staff Studies – Volume 49 Number II - 2019
40
40
After performing the basic diagnostic test for stationarity and cointegration, the VAR model is estimated using appropriate lag length based on information criteria. Post estimation tests (stability tests and residual tests) are conducted in order to see the robustness of the estimation. Results are discussed by means of impulse response functions and variance decomposition. All diagnostic tests, VAR Model, stability and the residuals test are performed using econometric software. Before VAR estimation, OLS regression is also estimated to analyse the static relationship among variables. Then the static versus dynamic relationship is discussed in the analysis.
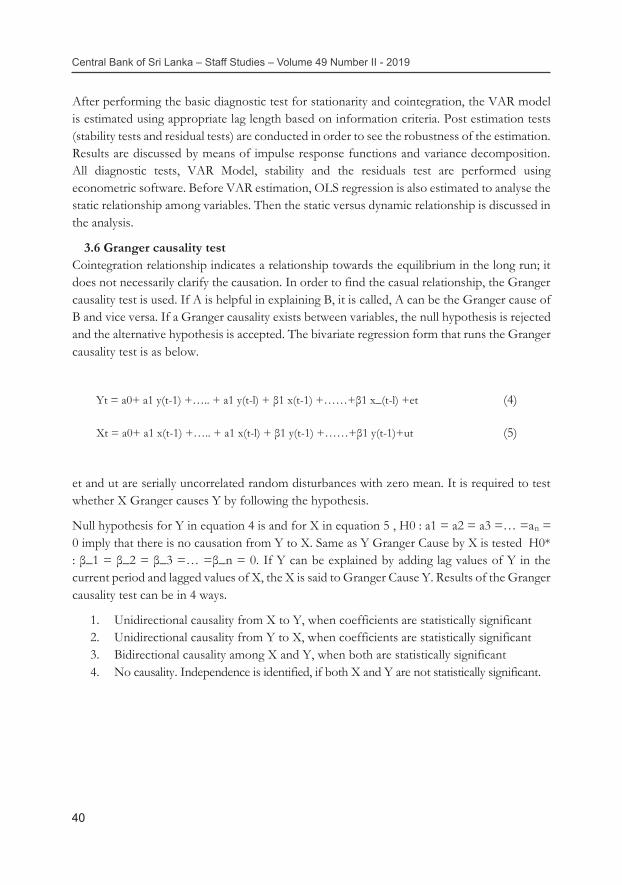
3.6 Granger causality test Cointegration relationship indicates a relationship towards the equilibrium in the long run; it does not necessarily clarify the causation. In order to find the casual relationship, the Granger causality test is used. If A is helpful in explaining B, it is called, A can be the Granger cause of B and vice versa. If a Granger causality exists between variables, the null hypothesis is rejected and the alternative hypothesis is accepted. The bivariate regression form that runs the Granger causality test is as below.
et and ut are serially uncorrelated random disturbances with zero mean. It is required to test whether X Granger causes Y by following the hypothesis.
Null hypothesis for Y in equation 4 is and for X in equation 5 , H0 : a1 = a2 = a3 =… =an = 0 imply that there is no causation from Y to X. Same as Y Granger Cause by X is tested H0* : β_1 = β_2 = β_3 =… =β_n = 0. If Y can be explained by adding lag values of Y in the current period and lagged values of X, the X is said to Granger Cause Y. Results of the Granger causality test can be in 4 ways.
1. Unidirectional causality from X to Y, when coefficients are statistically significant 2. Unidirectional causality from Y to X, when coefficients are statistically significant 3. Bidirectional causality among X and Y, when both are statistically significant 4. No causality. Independence is identified, if both X and Y are not statistically significant.
41
Real Wages, Inflation and Labour Productivity: Evidence from the Public and Private Sectors in Sri Lanka
41
4. Results and discussion
4.1 Data source This study aims to examine the relationship among real wages, inflation and labour productivity for the period from 2006 to 2019. Seasonally adjusted quarterly logarithm form of data is used for the analysis. All data were obtained from secondary data sources. Variables considered as per the theory and empirical literature are, Labour productivity which is derived from Gross Domestic Product (GDP) at constant prices divided by Hours of work per week (HWPW). GDP data from the Central Bank of Sri Lanka, and HWPW obtained from the labour force indicators in the Department of Census and Statistics (DCS). Colombo Consumer Price Index (CCPI), Real Wages of Government Sector Employees (RWGSEC), Real Wages of Private Sector Employees (RWPSEC) and Real Wages of Informal Private Sector Employees (RWIPSEC) data are obtained through the Central Bank of Sri Lanka. In order to examine the dynamic relationship among variables the VAR model is estimated and results are discussed with impulse responses and variance decomposition.
4.2 Movements of variables The purpose of describing the movements of the variables is to get a basic understanding of the variables that gives a background to the study.
4.2.1 Gross domestic product, hours of work and labour productivity Labour productivity is calculated using Gross Domestic Production (GSP) divided by Hours of Work Per Week (HWPW). HWPW is obtained from labour force indicators published quarterly. A total of two categories, 10-39 and 40+ hours of work per week was considered as HWPW for the quarter which has covered above 90 per cent of total work hours. HWPW was multiplied by 13 in order to get compatible with quarterly GDP.
Figure 1: Movements of GDP and hours of work quarterly
800,000
1,200,000
1,600,000
2,000,000
2,400,000
2,800,000
2006 2008 2010 2012 2014 2016 2018
GDP at Constant price 2010 = 100GDP at Constant price 2010 = 100
520
540
560
580
600
620
640
2006 2008 2010 2012 2014 2016 2018
HWPWHWPW
Central Bank of Sri Lanka – Staff Studies – Volume 49 Number II - 2019
42
42
As depicted in figure 1, GDP at constant prices has increased over the period. If we consider the GDP growth rate, the growth rate is averaged to 5% during the period from 2006 to 2019, while growth has been limited to below 4-3 per cent recently. Hours of work per quarter averaged to 600 or per week 46 hours. In order to increase labour productivity, numerator, GDP can be increased with a same level of hours of work or with a same level of GDP, the denominator can be decreased. Practically, the number of hours of work is stable or can slightly be changed. Therefore, GDP must be increased to enhance labour productivity. Therefore, slowing down the economic growth means that productivity has also declined compared to the previous year. As per the above graph, it shows a decline in slightly hours of work after 2015. Labour productivity (GDP/HWPW) and the movements in CCPI are given below.
Figure 2: Labour productivity and inflation
Figure 2 depicts the labour productivity (GDP/HWPW) and Consumer Price Index for the period from 2006 to 2019. During the period, both inflation and labour productivity marginally increased. Increase in LPDCT is driven mainly by increase in GDP. The gap between labour productivity and Consumer price index has narrowed mainly due to inflation that has been managed at below 5 per cent.
4.2.2 Labour productivity and real wages
Real Wage Index of Government Sector (RWGSEC), Real Wage Index of Private Sector (RWPSEC) and Real Wage Index of Informal Private Sector employees are considered covering all sectors in the economy. For RWGSEC and RWIPSEC the base year is 2012 = 100, while the base year for RWPSEC is 1978 = 100. RWPSEC covered only the workers in wages board and trades. Movements of indices are discussed with labour productivity. RWGSEC and RWPSEC and REIPSEC are discussed separately.
7.4
7.6
7.8
8.0
8.2
8.4
2006 2008 2010 2012 2014 2016 2018
LPDCTLPDCT
3.8
4.0
4.2
4.4
4.6
4.8
5.0
2006 2008 2010 2012 2014 2016 2018
LCCPILCCPI
43
Real Wages, Inflation and Labour Productivity: Evidence from the Public and Private Sectors in Sri Lanka
43
Figure 3: Movements of labour productivity, real wages of government and private sector employees
4.2
4.3
4.4
4.5
4.6
4.7
4.8
4.9
5.0
5.1
06 07 08 09 10 11 12 13 14 15 16 17 18 19
LRWGSEC LRWPSEC LRWIPSEC As per figure 3, productivity has gradually increased over the period while real wage indices of GSEC and PSEC have fluctuated during the period. REIPSEC has always moved above or in line with CCPI movements. The gap between two the Wage indices (RWGSEC and RWPSEC) narrows by 2012, and then it shows the equal movements in wage indexes up to 2014 in several years. After 2014 Q3, a stable parallel gap widens towards 2019 with respect to RWGSEC, RWPSEC and RWIPSEC. It is clear that after 2015 RWGSEC are higher compared to RWPSEC with increase of salary allowances in Government budget proposal that continued to 2020.
Real wages in PSEC declined compared to real wages of other two sectors. Private sector, being 43.4% remains the main employment generating sector in Sri Lanka and public sector contributed 20% to the total employment as per the DCS. Real wages of PSEC is lower compared to the GSEC and IPSEC. Further, after 2015 real wages of GSEC and PSEC assume a declining trend that shows wage pressure in the market. Wages are determined by the Wages Board for RWPSEC and the circulars issued by the Department of public administration for RWGSEC employees, showing some rigidities and sticky adjustment with the market compared to the both CCPI and REIPSEC. A continuous increase of the Real wages of informal private sector employees can be noticed since wages of IPSEC are determined by the market forces. As per the theory and empirical evidence, there is a positive significant relationship between labour productivity and real wages. Therefore, declining real wages would impact labour productivity negatively. Further, a massive salary increases for GSEC employees in 2015 has also impacted a decline in their real wages from 2015 to 2019. Therefore, the continuation of a sustainable wage increasing proposal is important to avoid real wage erosion and minimize differences with real wages of other sectors and to enhance productivity to a significant level.
Central Bank of Sri Lanka – Staff Studies – Volume 49 Number II - 2019
44
44
4.3 Empirical tests Since time series data has special properties with time varying/ time ordered, it is required to check whether the series’ mean, variance and covariance are the same over the period. In order to check stationarity, ADF (Augmented Dickey-Fuller), PP (Phillips-Perron) and KPSS (Kwiatkowski–Phillips–Schmidt–Shin (KPSS) tests are performed to check the stationarity of variables. Accordingly, all variables are integrated at their first difference and therefore, can be identified as level (1) variables. Since variables are not integrated at I(0), it is required to check whether cointegration exists among variables.
4.4 Cointegration test If all variables are not stationary in level, it should be tested whether the variables are in equilibrium in the long run that we call the existing cointegration. Since all variables are not I (0) and integrated at their first difference, it is required to check whether a long run relationship exists among variables. To check cointegration, the Johansen methodology is used. Cointegration is detected in the Johansen methodology using two tests called the Trace test and the Eigen Value test. In this study, as per both test statistics, it has indicated no cointegration, and therefore the VAR model using first difference of the variables is decided as an appropriate technique to estimate the relationship among variables.
After estimating the VAR model, other tests to check appropriateness and robustness of the model, stability and residual test are performed. Results of the pre-test, stability and residual test are in Annexure.
4.5 Estimating Ordinary Least Squared (OLS) regression OLS is a type of linear least squares method for estimating the unknown parameters in a linear regression model. OLS selects the parameters of a linear function of a set of explanatory variables by the principle of least squares, minimizing the sum of the squares of the differences between the observed dependent variable in the given dataset and those predicted by the linear function. The OLS estimator is consistent when the regressors are exogenous, and optimal in the class of linear unbiased estimators when the errors are homoscedastic and serially uncorrelated. Under these conditions, the method of OLS provides minimum-variance mean-unbiased estimation, Best Linear Unbiased Estimator (BLUE) when the errors have finite variances. Under the additional assumption, the errors are normally distributed; OLS is the maximum likelihood estimator. Therefore, before estimating the VAR, Ordinary Least Square (OLS) estimation for the variables is performed to establish the linear static relationship among variables. The dependent variable is Labour productivity (LPDCT) and the independent variables are Colombo Consumer Price index (CCPI), real wages of government sector (RWGSEC), real wages of private sector (RWPSE) and real wages of informal private sector employee (RWIPSEC).
45
Real Wages, Inflation and Labour Productivity: Evidence from the Public and Private Sectors in Sri Lanka
As per the OLS results, there is a positive significant relationship between labour productivity growth and real wages in private sector employees. As per the theory and empirical evidence, a positive relationship between labour productivity and real wages is established. In this study, the positive relationship between DLPDCT and DLRWPSEC and DLRWIPSEC is examined. The inverse relationship between labour productivity and inflation is in line with the expected results in empirical evidence but not significant. Real wages in government sector employees negatively impact labour productivity. If the results are quantified, a 1 per cent increase in growth of real wages in private sector employees is impacted to increase labour productivity by 0.23 per cent, on average subject to the assumption under ceteris paribus.
Findings support establishing a positive relationship between labour productivity and real wages which is in line with the theory and empirical literature. Therefore, increasing real wages of PSEC and IPSEC employees leads to an increase in productivity higher than increasing real wages of GSEC employees. Inflation negatively but not significantly impacts to enhance labour productivity for the research period covered from 2006 to 2019.
4.6 Estimating the VAR model In order to estimate a VAR model, firstly, the difference of all variables must be considered due to the absence of cointegration and because all variables are integrated at first difference. Then, appropriate lag length must be determined to indicate the dynamic adjustment of variables in the model. Lower lag length results in autocorrelation of the error term to a significant level and insignificant estimators. Higher lag would lead to reduce the degrees of freedom and thereby to estimate insignificant coefficients. Therefore, appropriate lag length is selected based on the LR Sequential modified LR test statistics, FPE Final Prediction Error, AIC Akaike Information Criterion, SC: Schwarz Information Criterion, HQ: Hannan -Quinn Information Criterion to decide appropriate lag length for the model. Lag order 7th is selected based on AIC. The VAR model using the first difference of the variables is estimated under fulfilment of the conditions in lag exclusion test, stability test and residual test performed and are in annex 1. Estimated results of the VAR model are discussed in below sections since
Central Bank of Sri Lanka – Staff Studies – Volume 49 Number II - 2019
46
45
results of the pre-tests, stability and residual test (Gujarati) for the estimated model fulfil the requirements4 under the Gauss Markov theorem to have estimators with BLUE5 properties.
In the above estimated VAR model, results are discussed using impulse response functions and forecast error variance decompositions. An impulse response function shows the reaction of any dynamic system in response to external change/ shock. Therefore, the impulse response describes the reaction of the system as a function of time. In the study impulse responses indicate how each variable in the model would behave in response to a shock for variables of LPDCT, LCCPI, LRWGSEC, LRWPSEC and LRWIPSEC.
4 The error term has a population mean of zero, All independent variables are uncorrelated with the error term, no endogeneity, Observations of the error term are independently distributed and uncorrelated with each other, no autocorrelation/ serial correlation, The error term has a constant variance, no heteroscedasticity Independent variable is not a perfect linear function of other explanatory variables, no multicollinearity 5 Best Linear Unbiased Estimator
-‐.04
-‐.02
.00
.02
2 4 6 8 10 12 14 16 18 20
Response of DLPDCT to DLPDCTResponse of DLPDCT to DLPDCT
-‐.04
-‐.02
.00
.02
2 4 6 8 10 12 14 16 18 20
Response of DLPDCT to DLCCPIResponse of DLPDCT to DLCCPI
-‐.04
-‐.02
.00
.02
2 4 6 8 10 12 14 16 18 20
Response of DLPDCT to DLRWGSECResponse of DLPDCT to DLRWGSEC
-‐.04
-‐.02
.00
.02
2 4 6 8 10 12 14 16 18 20
Response of DLPDCT to DLRWPSECResponse of DLPDCT to DLRWPSEC
-‐.04
-‐.02
.00
.02
2 4 6 8 10 12 14 16 18 20
Response of DLPDCT to DLRWIPSECResponse of DLPDCT to DLRWIPSEC
-‐.010
-‐.005
.000
.005
.010
2 4 6 8 10 12 14 16 18 20
Response of DLCCPI to DLPDCTResponse of DLCCPI to DLPDCT
-‐.010
-‐.005
.000
.005
.010
2 4 6 8 10 12 14 16 18 20
Response of DLCCPI to DLCCPIResponse of DLCCPI to DLCCPI
-‐.010
-‐.005
.000
.005
.010
2 4 6 8 10 12 14 16 18 20
Response of DLCCPI to DLRWGSECResponse of DLCCPI to DLRWGSEC
-‐.010
-‐.005
.000
.005
.010
2 4 6 8 10 12 14 16 18 20
Response of DLCCPI to DLRWPSECResponse of DLCCPI to DLRWPSEC
-‐.010
-‐.005
.000
.005
.010
2 4 6 8 10 12 14 16 18 20
Response of DLCCPI to DLRWIPSECResponse of DLCCPI to DLRWIPSEC
-‐.02
.00
.02
2 4 6 8 10 12 14 16 18 20
Response of DLRWGSEC to DLPDCTResponse of DLRWGSEC to DLPDCT
-‐.02
.00
.02
2 4 6 8 10 12 14 16 18 20
Response of DLRWGSEC to DLCCPIResponse of DLRWGSEC to DLCCPI
-‐.02
.00
.02
2 4 6 8 10 12 14 16 18 20
Response of DLRWGSEC to DLRWGSECResponse of DLRWGSEC to DLRWGSEC
-‐.02
.00
.02
2 4 6 8 10 12 14 16 18 20
Response of DLRWGSEC to DLRWPSECResponse of DLRWGSEC to DLRWPSEC
-‐.02
.00
.02
2 4 6 8 10 12 14 16 18 20
Response of DLRWGSEC to DLRWIPSECResponse of DLRWGSEC to DLRWIPSEC
-‐.02
.00
.02
2 4 6 8 10 12 14 16 18 20
Response of DLRWPSEC to DLPDCTResponse of DLRWPSEC to DLPDCT
-‐.02
.00
.02
2 4 6 8 10 12 14 16 18 20
Response of DLRWPSEC to DLCCPIResponse of DLRWPSEC to DLCCPI
-‐.02
.00
.02
2 4 6 8 10 12 14 16 18 20
Response of DLRWPSEC to DLRWGSECResponse of DLRWPSEC to DLRWGSEC
-‐.02
.00
.02
2 4 6 8 10 12 14 16 18 20
Response of DLRWPSEC to DLRWPSECResponse of DLRWPSEC to DLRWPSEC
-‐.02
.00
.02
2 4 6 8 10 12 14 16 18 20
Response of DLRWPSEC to DLRWIPSECResponse of DLRWPSEC to DLRWIPSEC
-‐.010
-‐.005
.000
.005
.010
2 4 6 8 10 12 14 16 18 20
Response of DLRWIPSEC to DLPDCTResponse of DLRWIPSEC to DLPDCT
-‐.010
-‐.005
.000
.005
.010
2 4 6 8 10 12 14 16 18 20
Response of DLRWIPSEC to DLCCPIResponse of DLRWIPSEC to DLCCPI
-‐.010
-‐.005
.000
.005
.010
2 4 6 8 10 12 14 16 18 20
Response of DLRWIPSEC to DLRWGSECResponse of DLRWIPSEC to DLRWGSEC
-‐.010
-‐.005
.000
.005
.010
2 4 6 8 10 12 14 16 18 20
Response of DLRWIPSEC to DLRWPSECResponse of DLRWIPSEC to DLRWPSEC
-‐.010
-‐.005
.000
.005
.010
2 4 6 8 10 12 14 16 18 20
Response of DLRWIPSEC to DLRWIPSECResponse of DLRWIPSEC to DLRWIPSEC
Response to Cholesky One S.D. (d.f. adjusted) Innovations ± 2 S.E.Response to Cholesky One S.D. (d.f. adjusted) Innovations ± 2 S.E.
47
Real Wages, Inflation and Labour Productivity: Evidence from the Public and Private Sectors in Sri Lanka
Impulse response functions for the variables are within the dotted lines, implying the significance of the movements towards the time periods. One shock to DLPDCT has initially a noticeable impact on DLPDCT itself in the current period and its minimum level is recorded in the 3rd quarter. In the medium run, growth of the LPDCT fluctuates, which stabilizes in the long-run with a lower level than the original. Therefore, it can be concluded that any shock to growth of the LPDCT leads to a decline in the growth of LPDCT drastically in the short run and in the long run as well. A sudden shock in DLPDCT has a noticeable impact and increases inflation, implying a negative effect between variables. As per the theory and empirical studies, inflation negatively impacts on economic activity and labour productivity as well. Many of the empirical studies(Clark; Bårdsen, Hurn and McHugh; Buck and Fitzroy; Christopoulos and Tsionas; De Gregorio; Narayan and Smyth; Smyth) conclude that there is a negative relationship between inflation and productivity. (Hondroyiannis and Papapetrou “Seasonality-Cointegration and the Inflation, Productivity and Wage Growth Relationship in Greece”) examine the relationship during the period 1975-1992 and found that in the short-run, dynamic results are indicative of a negative effect of inflation on productivity. The finding of the dynamic relationship between inflation and labour productivity in this study using VAR, is in line with empirical studies. Therefore, avoiding negative shock to productivity (GDP/HWPW) leads to managing inflation in the short run.
A shock from DLPDCT has a noticeable impact to decline real wages in all sectors. As per the theory and empirical evidence, a positive relationship between labour productivity and real wages has been established. The positive relationship between real wages and labour productivity is further confirmed by (Kumar, Webber and Perry) in their study on Real wages, inflation and labour productivity in Australia for 1965-2007; it is quantified that a 1% increase in real wages of manufacturing sector is expected to increase productivity between 0.5% and 0.8%, implying a positive significant relationship between wages and productivity while the effect of inflation on manufacturing sector productivity is not significant. In line with the same, (Narayan and Smyth) also confirm that a 1% increase in real wages generates a 0.6% increase in productivity while effects of inflation on productivity are insignificant. (Eryılmaz and Bakır) examine real wages, inflation and labour productivity, an evaluation within the Turkish context during the period of 1988-2012 and reveal that there is a long-term relationship among variables from productivity and inflation towards the real wages. Therefore, the findings of the relationship between real wages and labour productivity are in line with the theory and the empirical evid-ence. In this study findings refer to short run analysis followed by VAR.
Impulses from inflation have a noticeable impact on the decline and volatility of DLPDCT, increase real wages in Government and Informal private sector employees and decrease real wages in private sector employees. Impulses from real wages in Government sector employees are led to decrease and make volatile DLPDCT and inflation while leading real wages in other sectors to increase in the short run. A sudden shock in LRWPSEC has a noticeable impact in terms of increasing inflation and real wages in other sectors in the short run. Impulses from real wages in informal private sector impact to decline labour productivity growth and inflation in the medium run and fluctuate other sector real wages.
Central Bank of Sri Lanka – Staff Studies – Volume 49 Number II - 2019
48 47
In conclusion, the impulses of LPDCT, LCCPI, LRWGSEC, LRWPSE and LRWIPSEC on other variables have a noticeable impact in the short run while shocks die out in the long run. A positive relationship between labour productivity and real wages, and a negative relationship between labour productivity and inflation can be noticed as per the impulse response functions. Further, higher inflation leads to increase in real wages in the Government and informal private sectors while private sector wages marginally increase. Therefore, policy measures must be identified to ensure minimum shock on LPDCT to achieve long-term economic growth. In this, keeping a well-managed lower level inflation will have a minimum impact on other variables since lower inflation causes a higher growth rate, lower growth of real wages in GSEC, IPSEC and minimum shocks to Real wages of PSEC employees.
4.8 Forecast Error Variance Decomposition (FEVD) on main variable This helps to determine the proportion of variation of the dependent variable explained by each of the independent variables. Variance decomposition enables to determine how much of the variability of the independent variable is lagged by its own variance. In addition, it shows you which of the independent variables is ‘stronger’ in explaining the variability in the dependent variables over the period. This evolves over time, so the shocks on time series variables may not be very important in the short-run but very important in the long run. On the other hand, the error variance decomposition shows how the importance of each shock explains the fluctuations in the variables in the model for the above variables. Accordingly, FEVDs are described below.
Real Wages, Inflation and Labour Productivity: Evidence from the Public and Private Sectors in Sri Lanka
48
FEVD indicates the amount of information each variable contributes to the other variables in the VAR model. In Table 1, variance decomposition of growth of LPDCT to other time series is given. It shows that, in the current period, DLPDCT is a strongly endogenous variable. Gradually, total variance is explained, in DRWGSEC, DLCCPI, DLRWIPSEC and DLRWPSEC in the long run, shows a strong influence on other variables. Over the period DLRWGSEC and DLCCPI variables reflect a higher percentage of variation of LPDCT in the long run. Only about 6% of the variance in DLPDCT is explained by DLRWPSEC.
4.9 Forecast error variance decomposition on other variables LCCPI has a strong influence on dependent variables, and therefore, can be identified as a strongly exogenous variable, since its variance reflects around 1-42 per cent in LPDCT and other variables. Variations in LCCPI are explained by LPDCT gradually towards the long run. Real wages of all three sectors have less variance of around 7% in LCCPI variance decomposition compared to LPDCT. Forecast error variance of RWGSEC, RWPSEC and RWIPSEC are in the annexures. As per FEVD of DLRWGSEC, 30-40 per cent variance in DLRWGSEC is explained by inflation and by DLPDCT. Error variance of DLPSEC is explained above 20 per cent by DLPDCT, and the least amount reflects in DLCCPI. About 60 - 40 per cent variance is explained by DLCCPI in FEVD of DLWRIPSEC. Accordingly, real wage increase in the private sector will enhance productivity with a minimum impact on inflation. Real wage increase in the Government sector will be reflected in inflation and in labour productivity.
4.10 Granger causality Direction of causality was examined using the Block exogeneity test. It explains whether lag values of X variable are helpful in explaining Y variable. The null hypothesis of the non - existence of a Granger causality between variables is rejected with p value lower than 0.05 level. Accordingly, the following causality relationships can be identified.
Central Bank of Sri Lanka – Staff Studies – Volume 49 Number II - 2019
50
50
Figure 5: Causal relationship among variables
DLPDCT DLCCPI
DLRWPSECDLRWGSEC
As per Figure 5, one directional causality is identified as productivity growth Granger causes inflation at a 5 per cent significance level. Accordingly, lag values of productivity growth help to better predict inflation. Findings support the view that the productivity Ganger causes inflation in standard economic theory. (Kim, Lim and Park) also finds unidirectional Granger causality from productivity growth to inflation in Korea. (Jarrett and Selody) finds two-way causality from inflation to productivity for aggregate quarterly data in Canada. (Strauss and Wohar) examine the long run relationship between inflation, real wages and productivity in the US and findings were, in the long run, inflation Granger causes productivity and there is a bidirectional Granger causality between real wages and productivity. Further, in this study, there is a one directional causality from inflation towards real wage growth in the private sector, from DLRWGSEC towards DLRWPSEC. Therefore, past values of inflation and DLRWGSEC help to better predict current DLRWPSEC than past values of DLRWPSEC alone.
5. Conclusion and recommendations
The aim of this study is to examine and analyse the relationship among real wages, inflation and labour productivity in Sri Lanka during the period from 2006 to 2019 using secondary data sources. Other objectives are to identify key factors affecting labour productivity with inflation and sector wise real wages (GSEC, PSEC & IPSEC) and to identify the sector wise contribution to the labour productivity separately. In order to examine the static and dynamic relationship among variables, OLS regression and the VAR model were employed. Number of studies on real wages, inflation and labour productivity has been conducted covering developed and developing countries. Findings of the relationships between variables ends with mixed results. Majority of the studies have concluded that real wages positively impact labour
51
Real Wages, Inflation and Labour Productivity: Evidence from the Public and Private Sectors in Sri Lanka
51
productivity while inflation has a negative impact in the short run or long run basis. This study was the initial study on real wages, inflation and labour productivity in Sri Lanka. Accordingly, there is a short run relationship among real wages, inflation and labour productivity. A negative relationship is identified between labour productivity and inflation while a positive relationship is identified between labour productivity and real wages in all three sectors in Sri Lanka during the period.
As per the IRF, a sudden shock in LPDCT has a noticeable impact to decline productivity itself, to increase inflation, and to decline real wages of all sectors by stabilising lower real wages in the long run. Results of the OLS regression are also in line with the findings of the VAR model which are reflected in the dynamic analysis. Accordingly, a negative relationship between labour productivity and inflation, and a positive relationship between real wages and inflation are established. Each of the IRFs on other variables are helpful to identify possible policy measures. Impulses on LPDCT lead to increases in inflation while causing real wages to decline. Impulses on LCCPI lead to decline of LPDCT, increase of real wages in GSEC, IPSEC while RWPSEC employees are not impacted much. Impulses of real wages among sectors are also considered. Impulses on real wages of GSEC and IPSEC employees are positively related with each other reactions. Impulses on RWPSEC are negatively related with the other two. In order to enhance labour productivity, increasing real wages of RWPSEC employees can be considered since there is a positive significant relationship to enhance productivity as quantify in OLS results and real wages of RWPSEC and inflation indicates less volatilities in LPDCT and LCCPI compared to real wages of the other two sectors. This would help to have a minimum impact on inflation while productivity is enhanced. Therefore, increasing real wages of private sector employees can be recommended as one of the policy measures to enhance labour productivity.
As well-established empirical analyses conclude, an increase in real wages leads to an increase in productivity. There is a positive statistically significant relationship between real wages and labour productivity (Narayan and Smyth; Kumar, Webber and Perry; Katovich and Maia). Therefore, the findings are in line with theory and empirical literature. In this analysis, Real wages of GSEC, PSEC and IPSEC were considered to identify the factors affecting labour productivity sector-wise. Accordingly, RWGSEC, RWPSEC and RWIPSEC employees’ contributions are positive in terms of labour productivity. Further, it can be concluded that the impact to the labour productivity by PSEC and IPSEC employees is higher compared to the GSEC employees. As per the OLS results, there is a negative insignificant relationship between labour productivity and real wages of GSEC employees. Therefore, real wages of GSEC employee’s contribution to labour productivity is not significant. In the VAR analysis too, a positive significant dynamic relationship was identified between labour productivity and real wages of PSEC and IPSEC employees compared to RWGSEC employees. Therefore, in order to enhance labour productivity in GSEC employees to a significant level, identifying, introducing and implementing additional assignable work to the GSEC employees should be
Central Bank of Sri Lanka – Staff Studies – Volume 49 Number II - 2019
52
52
considered. Otherwise wage increases of GSEC employees will result in increased inflation and have an adverse impact on productivity too. GSEC employees being 20 per cent to the total employment in Sri Lanka should also have a positive significant impact on labour productivity. In this regard, measures in order to further improve labour productivity in GSEC employees are suggested as identifying and assigning more work allocation as per the Government requirement continuously, introducing to achieve targets for work attended compared with number of works received for the possible sectors. This will bring GSEC employees’ contribution to labour productivity towards a positive significant level as PSEC employees.
Relationship between inflation and labour productivity is identified as negative in the short run dynamic in Sri Lanka. Therefore, any negative shock to productivity will increase inflation immediately up to medium run and after that gradually fluctuate towards a higher level than the original while shocks are dying out throughout the period. Based on the negative relationship between labour productivity and inflation, it can be recommended that keeping a lower level of inflation will manage negative shocks to productivity in the short run. Higher inflation adversely impacts productivity in the short run in three ways: worker purchasing power, mix of factor inputs and impact to the investments plans as specified in empirical literature. Further, the sudden shock of inflation will have a noticeable impact to further increase real wages of GSEC and IPSEC employees as well. Real wages of private sector employees are minimally impacted by impulses on LCCPI. Therefore, as pointed out above, in order to enhance productivity, increasing real wages of PSEC employees can be considered. Further, Department of Census and Statistics, identified, PSEC being 43 per cent of the total employment in Sri Lanka, is the employment generating sector of the economy. Therefore, the Government also can further facilitate PSEC by supporting large scale investment projects, modernizing infrastructure facilities, contributing expenses related to research and development, innovations, and safeguarding the private sector.
As per the FEVD function, LPDCT is a strongly endogenous variable in the short run while all other variables are weakly exogenous in the short run. A higher portion of variance in DLPDCT is explained by DLRWGSE and DLCCPI. Further in FEVD of LCCPI, above 20 per cent of variance is explained by DLPCT. FEVD of Real wages in the private sector is explained above 20 percent of variance in productivity growth while the Government sector and informal private sector reflect higher variance in LCCPI. Therefore, FEVD of RWGSEC and RWIPSEC contributes to inflation highly compared to the RWPSEC that has much contribution to the variance of LPDCT. This close relationship between labour productivity and RWPSEC employees, inflation and RWGSEC, RWIPSEC is well established through IRF, FEVD and Granger causality. The private sector can be identified as a key factor of labour productivity as per the findings of this study. Therefore, growth stimulating policies, well- managed inflation, facilitating modern infrastructures, innovations, expenses on research and developments can be considered to encourage, in addition to increasing real wages of private
53
Real Wages, Inflation and Labour Productivity: Evidence from the Public and Private Sectors in Sri Lanka
53
sector employees to enhance labour productivity. In FEVD of LPDCT, the contribution of real wages in all sectors is far greater than inflation. In the same way, FEVD of LDPCT is reflected mostly in DLRWPSEC while error variance in LCCPI is highly contributed by LPDCT and RWGSEC.
As per the results of the Granger Causality Block Exogeneity test, three one directional causality relationships were identified. Individually, there is one directional relationship from labour productivity towards inflation. A further one directional relationship exists from inflation towards real wages in private sector employees, from real wages in the Government sector towards real wages in the private sector. Other causality relationships were identified from all variables as jointly Granger cause labour productivity growth and inflation. The finding of the Granger causality running among variables and direction of the causality can be used for the better prediction of the variables, DLPDCT, DLCCPI and DLRWPSEC. This study can be further developed considering a new wage rate index for the private sector, incorporating other variables such as capital stock, technological changes and other factors that could enhance labour productivity.
Central Bank of Sri Lanka – Staff Studies – Volume 49 Number II - 2019
54
54
References
Alexander, Carol O. "The changing relationship between productivity, wages and unemployment in the UK." Oxford bulletin of economics and statistics 55.1 (1993): 87-102. Print.
Angeles-Castro, Gerardo, Jonatan Juárez-Cruz, and Miguel Flores-Ortega. "The effect of average wages on the economy: the case of the United States." International journal of business and social science 5.11 (2014). Print.
Annual Report 2018: Central Bank of Sri Lanka, 2018. Print.
Annual Report 2019: Central Bank of Sri Lanka, 2019. Print.
Asian Development Bank, International Labour Organization, and Regional Office for Labour the Pacific. "Sri Lanka: fostering workforce skills through education: employment diagnostic study." (2017). Print.
Bårdsen, Gunnar, Stan Hurn, and Zoë McHugh. "Modelling wages and prices in Australia." Economic record 83.261 (2007): 143-58. Print.
Brida, Juan Gabriel, Wiston Adrián Risso, and Edgar J Sanchez Carrera. "Real wages as determinant of labour productivity in the Mexican tourism sector." European journal of tourism research 3.1 (2010): 67. Print.
Bruno, Michael, and William Easterly. "Inflation crises and long-run growth, data set." 1998. Print.
Buck, Andrew J, and Felix Fitzroy. "Inflation and productivity growth in the Federal Republic of Germany." Journal of post Keynesian economics 10.3 (1988): 428-44. Print.
Cameron, Norman, Derek Hum, and Wayne Simpson. "Stylized facts and stylized illusions: inflation and productivity revisited." Canadian journal of economics (1996): 152-62. Print.
Chowdhury, Anis, and Girijasankar Mallik. "A land locked into low inflation–how far is the promised land?" Economic analysis and policy 28.2 (1998): 233-44. Print.
Christopoulos, Dimitris K, and Efthymios G Tsionas. "Productivity growth and inflation in europe: evidence from panel cointegration tests." Empirical economics 30.1 (2005): 137-50. Print.
Clark, Peter K. "Inflation and the productivity decline." The American economic review 72.2 (1982): 149-54. Print.
55
Real Wages, Inflation and Labour Productivity: Evidence from the Public and Private Sectors in Sri Lanka
55
De Gregorio, José. "Economic growth in Latin America." Journal of development economics 39.1 (1992): 59-84. Print.
Dritsaki, Chaido. "Real wages, inflation, and labor productivity: evidences from Bulgaria and Romania." Journal of economic & financial studies 4.05 (2016): 24-36. Print.
Engle, Robert F, and Clive WJ Granger. "Co-Integration and Error Correction: Representation, estimation, and testing." Econometrica: journal of the econometric society (1987): 251-76. Print.
Erenburg, Sharon J. "Productivity, private and public capital, and real wage in the US." Applied economics letters 5.8 (1998): 491-95. Print.
Eryılmaz, Filiz, and H Bakır. "Real wages, inflation and labor productivity: an evaluation within Turkish context." Hitit University journal of social sciences institute 11.3 (2018): 1946-59. Print.
Feldstein, Martin. "Did wages reflect growth in productivity?" Journal of policy modeling 30.4 (2008): 591-94. Print.
Freeman, Donald G, and David B Yerger. "Does inflation lower productivity? time series evidence on the impact of inflation on labor productivity in 12 OECD nations." Atlantic economic journal 28.3 (2000): 315-32. Print.
Inflation and multifactor productivity growth: A response to smyth. Applied economics letters 5.5 (1998): 271-74. Print.
Gordon, Robert J. "Productivity, wages, and prices inside and outside of manufacturing in the US, Japan, and Europe." European economic review 31.3 (1987): 685-733. Print.
Granger, Clive WJ, Paul Newbold, and J Econom. "Spurious regressions in econometrics." Baltagi, Badi H. A companion of theoretical econometrics (1974): 557-61. Print.
Gujarati, Damodar N. basic econometrics. Tata McGraw-Hill education, 2009. Print.
Hall, Stephen G. "An application of the granger & engle two‐step estimation procedure to United Kingdom aggregate wage data." Oxford bulletin of economics and statistics 48.3 (1986): 229-39. Print.
Hendry, David F. "Modelling UK inflation, 1875–1991." Journal of applied econometrics 16.3 (2001): 255-75. Print.
Central Bank of Sri Lanka – Staff Studies – Volume 49 Number II - 2019
56
56
Hondroyiannis, George, and Evangelia Papapetrou. "Seasonality-cointegration and the inflation, productivity and wage growth relationship in Greece." The social science journal 34.2 (1997): 235-47. Print.
Temporal causality and the inflation-productivity relationship: evidence from eight low inflation oecd countries. International review of economics & finance 7.1 (1998): 117-35. Print.
Hsu, Pi-Fem. "Inter-industry wage premiums and industry-specific productivity in Taiwan." Applied economics 37.13 (2005): 1523-33. Print.
Islam, Rizwanul, Abel Kinyondo, and Joseph Nganga. "Real wages and labour productivity in Tanzania: How do they link?" Journal of African studies and development 7.3 (2015): 81-98. Print.
Jarrett, J Peter, and Jack G Selody. "The productivity-inflation nexus in Canada, 1963-1979." The review of economics and statistics (1982): 361-67. Print.
Johansen, Søren. "Statistical analysis of cointegration vectors." Journal of economic dynamics and control 12.2-3 (1988): 231-54. Print.
Katovich, Erik S, and Alexandre Gori Maia. "The relation between labor productivity and wages in Brazil: A sectoral analysis." Nova economia 28.1 (2018): 7-38. Print.
Kim, Doh-Khul. "Real wage and nominal shock: evidence from Pacific-Rim countries." International advances in economic research 11.3 (2005): 249-55. Print.
Kim, Sangho, Hyunjoon Lim, and Donghyun Park. "Does productivity growth lower inflation in Korea?" Applied economics 45.16 (2013): 2183-90. Print.
Klein, Nir. real wage, labor productivity, and employment trends in South Africa: A closer look. International Monetary Fund, 2012. Print.
Krugman, Paul R. The age of diminished expectations: US economic policy in the 1990s. MIT press, 1997. Print.
Kumar, Saten, Don J Webber, and Geoff Perry. "Real wages, inflation and labour productivity in Australia." Applied economics 44.23 (2012): 2945-54. Print.
Liew, Venus Khim-Sen. "Which lag length selection criteria should we employ?" Economics bulletin 3.33 (2004): 1-9. Print.
57
Real Wages, Inflation and Labour Productivity: Evidence from the Public and Private Sectors in Sri Lanka
57
Maia, Alexandre Gori, and Arthur Sakamoto. "Does wage reflect labor productivity? a comparison between Brazil and the United States." Brazilian journal of political economy 38.4 (2018): 629-49. Print.
Mehra, Yash P. "Wage growth and the inflation process: an empirical note." The American economic review 81.4 (1991): 931-37. Print.
Mora, Toni, Jordi Lòpez-Tamayo, and Jordi Suriñach. "Are wages and productivity converging simultaneously in Euro area countries?" Applied economics 37.17 (2005): 2001-08. Print.
Narayan, Paresh, and Russell Smyth. "The effect of inflation and real wages on productivity: new evidence from a panel of G7 countries." Applied economics 41.10 (2009): 1285-91. Print.
Papapetrou, Evangelia. "The inflation and productivity relationship in Poland." Journal of economics and business 2003.2 (2003): 11-33. Print.
Phillips, Peter CB, and Sam Ouliaris. "Asymptotic properties of residual based tests for cointegration." Econometrica 58.1 (1990): 165-93. Print.
Pruchnik, Kamil, and Jakub Zowczak. Middle-income trap: review of the conceptual framework: ADBI working paper, 2017. Print.
Sbordone, Argia, and Kenneth Kuttner. "Does inflation reduce productivity?" Federal Reserve Bank of Chicago economic perspectives 18.6 (1994): 2-14. Print.
Shapiro, Carl, and Joseph E Stiglitz. "Equilibrium unemployment as a worker discipline device." The American economic review 74.3 (1984): 433-44. Print.
Smyth, David J. "Inflation and total factor productivity in Germany." Weltwirtschaftliches Archiv 131.2 (1995): 403-05. Print.
Strauss, Jack, and Mark E Wohar. "The linkage between prices, wages, and labor productivity: a panel study of manufacturing industries." Southern economic journal (2004): 920-41. Print.
Tang, Chor Foon. "A note on the non-linear wages-productivity nexus for Malaysia." (2010). Print.
Wakeford , Jeremy. "The productivity–wage relationship in South Africa: An empirical investigation." Development Southern Africa 21.1 (2004): 109-32. Print.
Yildirim, Zekeriya. "Relationships among labour productivity, real wages and inflation in Turkey." Economic research-ekonomska istraživanja 28.1 (2015): 85-103. Print.
Central Bank of Sri Lanka – Staff Studies – Volume 49 Number II - 2019