As one of a number of sponsors, Pfi zer Inc. contributed to the study design of the disease-specifi c program by including the Clinical Global Impressions–Improvement scale, Patient Global Impressions–Improvement scale, and a section of confi dential questions asked in a 1-hour, face-to-face physician interview. Medical writing and editing support was provided by Ira Mills, PhD, of Embryon, LLC, A Division of Advanced Health Media, LLC, and Diane Sloan, PharmD, of Peloton Advantage LLC, formerly of Embryon, LLC, and was funded by Pfi zer Inc. The authors thank Adam Roughley of Adelphi Real World for his work on the statistical analysis of the data. This study was sponsored by Wyeth, which was acquired by Pfi zer Inc. in October 2009.
Supplemental digital contents are available for this article. Direct URL citations appear in the
A B S T R A C T Purpose: The purpose of this study was to identify potential discordance between physician and patient ratedmeasures of depression used by primary care physicians and psychiatrists. Primary Practice Setting: This study collected data from primary care physicians and psychiatrists in the United States between October and December 2009. Methodology and Sample: A real-world, cross-sectional study was conducted using the Neuroses Disease–Specifi c Programme (Adelphi Real World, Macclesfi eld, United Kingdom). Treatment practice data were collected by 180 physicians (100 primary care and 80 psychiatrists) who were asked to provide information for the next 15 outpatients presenting prospectively with symptoms of anxiety and/or depression ( n = 2,704 patients). The primary outcome measures were the Clinical Global Impressions–and Patient Global Impressions–Improvement scales, completed by both physicians and their matched patients, respectively. Cohen’s kappa coeffi cient ( κ ) was calculated to assess the level of agreement between the Clinical Global Impressions–and Patient Global Impressions–Improvement scale responses. Results: Physician- and patient-rated overall improvement in illness was 82% and 89%, respectively. Results of the kappa analysis demonstrated fair agreement between patients and physicians regarding overall improvement in illness (44% agreement; κ = 0.23). Physician ratings of patient improvement progressively decreased with increased severity of illness. Implications for Case Management Practice: These real-world data suggest that the degree of reduction in symptoms of anxiety and/or depression may be estimated differently by physicians when compared with their patients. Understanding the potential for disparities between physician- and patient-rated measures in reviewing patient care, particularly in patients with more severe depressive symptoms, can help ensure that treatment plans are aligned with patient needs.
Real-World Disparities Between Patient- and Clinician-Reported Outcomes Results From a Disease-Specifi c Program in Depression and Anxiety
Shannon Lubaczewski , PharmD, MS , Jason Shepherd , BA(Hons), Rana Fayyad , PhD , and
Christine J. Guico-Pabia , MD, MBA, MPH
DOI: 10.1097/NCM.0000000000000015
printed text and are provided in the HTML and PDF versions of this article on the journal’s website ( www.professionalcasemanagementjournal.com ).
S. Lubaczewski and R. Fayyad are Pfi zer Inc. employees; C. J. Guico-Pabia is a former employee of Pfi zer Inc.; J. Shepherd is an employee of Adelphi Real World, who was a paid consultant to Wyeth in conducting this study.
Address correspondence to Shannon Lubaczewski, PharmD, MS, Pfi zer Inc., PCBU Neuroscience, 500 Arcola Road, Collegeville, PA 19426 ( shannon.lubaczewski@pfi zer.com ).
The authors report no confl icts of interest.
PCM-D-12-00021.indd 63PCM-D-12-00021.indd 63 25/01/14 1:03 AM25/01/14 1:03 AM
D epression and anxiety are common and potentially disabling illnesses ( Gelenberg, 2010 ; Hopko et al., 2000 ). The availabil-
ity of multiple treatment options and the lack of objective tests to diagnose and assess severity of symptoms make management of these illnesses a challenge in clinical practice ( Dunlop et al., 2010 ). Results from the Prevention of Recurrent Epi-sodes of Depression With Venlafaxine Extended Release for Two Years trial reported fair rates of agreement between patient and clinician ratings for measures of depression severity ( Dunlop et al., 2010 ); the discrepancy may be greater in clinical practice. Although patient-rated scales are conve-nient and time effi cient, it is important to determine whether patient ratings are consistent with those of clinician-administered rating scales for measuring symptoms. Clinical trials, through repetitive appli-cation of rating scales, provide a source of substan-tial education for patients and serve to align phy-sician and patients in their respective views of an illness. In contrast, clinical practice, which involves much briefer and less-frequent contact, is less likely to benefi t from this educational component, making it likely that agreement in clinical practice would be lower than the published agreement data might suggest.
Disease-specifi c programs (DSPs) are large, mul-tinational studies of clinical practice. They provide robust, real-world data regarding prevalence, sever-ity, and associated treatment practices for a range of common chronic disease areas (Anderson, Benford, Harris, Karavali, & Piercy, 2008). Patient-level data on behavior, attitudes, and treatment outcomes are collected from both physicians and patients, allow-ing for unique comparisons of these two perspectives ( Anderson et al., 2008 ). Disease-specifi c program data comprising real-world observations of clini-cian- and patient-reported outcomes have been used to yield useful information for attaining asthma-treatment goals (Small, Anderson, Vickers, Kay, & Fermer, 2011; Small, Vickers, Anderson, & Kay, 2010).
The current analysis was conducted by Adel-phi Real World (Macclesfi eld, United Kingdom), as part of the Neuroses DSP, a study covering anxiety and depression in clinical practice. The purpose of this analysis was to compare patient-rated and clinician-rated measures of clinical improvement with antidepressant treatment in real-world clini-cal practice. The analysis was designed to address these questions: Is there discrepancy between patients’ and clinicians’ ratings of patient improve-ment with antidepressant treatment, and is the degree of discordance affected by baseline symp-tom severity?
M ETHODS
Study Design
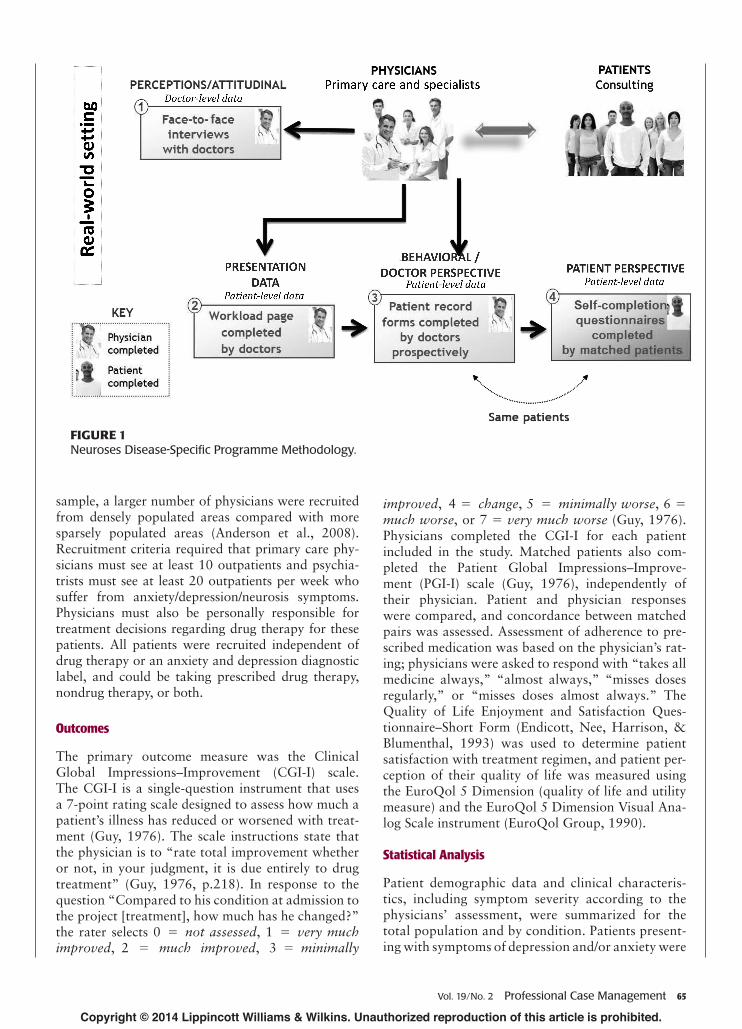
The Neuroses DSP was conducted between October and December 2009 in the United States. The DSP methodology has been described previously in detail ( Anderson et al., 2008 ); an overview of the program is shown in Figure 1 . Informed consent was obtained from all patients before patient-reported information was collected. All data were anonymous; no iden-tifi able physician or patient details were collected. Physicians and patients were assigned study numbers; matched patient/physician study numbers were used to link physician and patient responses ( Anderson et al., 2008 ).
Physicians were recruited from public lists of health care professionals, and eligible patients were invited to participate in the DSP. Data were collected from a mixture of offi ce-based and hospital-based primary care physicians and psychiatrists. Infor-mation, including specialty, practice type, the total number of patients, the number of patients treated for anxiety and/or depression, and responsibility for treatment, was collected from each physician to determine eligibility. Physicians participating in the study were asked to complete patient record forms prospectively for 15 consecutive outpatients pre-senting with symptoms of depression and/or anxi-ety within a 1- to 2-week period ( Anderson et al., 2008 ). Eligible patients could be seeking treatment for other medical illnesses or symptoms but must also present symptoms of depression and/or anxiety. Clinician-reported information regarding demo-graphics, symptoms, diagnosis, treatment approaches, and factors that infl uenced therapy selection was collected for each patient in a diary format (see Table 1, Supplemental Digital Content, available at: http://links.lww.com/PCM/A5). To collect matched patient–physician information, the same patients were then invited to fi ll out a self-completion form, provid-ing their own assessment of symptoms, expectations, and quality of life ( Anderson et al., 2008 ). Patients pro-vided information independently of and without their physician present. Physicians also provided work-load information based on all patient consultations for each of the fi rst 5 days of the study period (see Table 1, Supplemental Digital Content, available at: http://links.lww.com/PCM/A5).
Study Participants
Eligible clinicians included primary care physicians and psychiatrists personally responsible for treatment decisions for patients with anxiety and/or depression symptoms. To generate a nationally representative
PCM-D-12-00021.indd 64PCM-D-12-00021.indd 64 25/01/14 1:03 AM25/01/14 1:03 AM
sample, a larger number of physicians were recruited from densely populated areas compared with more sparsely populated areas ( Anderson et al., 2008 ). Recruitment criteria required that primary care phy-sicians must see at least 10 outpatients and psychia-trists must see at least 20 outpatients per week who suffer from anxiety/depression/neurosis symptoms. Physicians must also be personally responsible for treatment decisions regarding drug therapy for these patients. All patients were recruited independent of drug therapy or an anxiety and depression diagnostic label, and could be taking prescribed drug therapy, nondrug therapy, or both.
Outcomes
The primary outcome measure was the Clinical Global Impressions–Improvement (CGI-I) scale. The CGI-I is a single-question instrument that uses a 7-point rating scale designed to assess how much a patient’s illness has reduced or worsened with treat-ment ( Guy, 1976 ). The scale instructions state that the physician is to “rate total improvement whether or not, in your judgment, it is due entirely to drug treatment” ( Guy, 1976, p.218 ). In response to the question “Compared to his condition at admission to the project [treatment], how much has he changed?” the rater selects 0 = not assessed , 1 = very much improved , 2 = much improved , 3 = minimally
improved , 4 = change , 5 = minimally worse , 6 = much worse , or 7 = very much worse ( Guy, 1976 ). Physicians completed the CGI-I for each patient included in the study. Matched patients also com-pleted the Patient Global Impressions–Improve-ment (PGI-I) scale ( Guy, 1976 ), independently of their physician. Patient and physician responses were compared, and concordance between matched pairs was assessed. Assessment of adherence to pre-scribed medication was based on the physician’s rat-ing; physicians were asked to respond with “takes all medicine always,” “almost always,” “misses doses regularly,” or “misses doses almost always.” The Quality of Life Enjoyment and Satisfaction Ques-tionnaire–Short Form (Endicott, Nee, Harrison, & Blumenthal, 1993) was used to determine patient satisfaction with treatment regimen, and patient per-ception of their quality of life was measured using the EuroQol 5 Dimension (quality of life and utility measure) and the EuroQol 5 Dimension Visual Ana-log Scale instrument (EuroQol Group, 1990).
Statistical Analysis
Patient demographic data and clinical characteris-tics, including symptom severity according to the physicians’ assessment, were summarized for the total population and by condition. Patients present-ing with symptoms of depression and/or anxiety were
FIGURE 1 Neuroses Disease-Specifi c Programme Methodology.
PCM-D-12-00021.indd 65PCM-D-12-00021.indd 65 25/01/14 1:03 AM25/01/14 1:03 AM
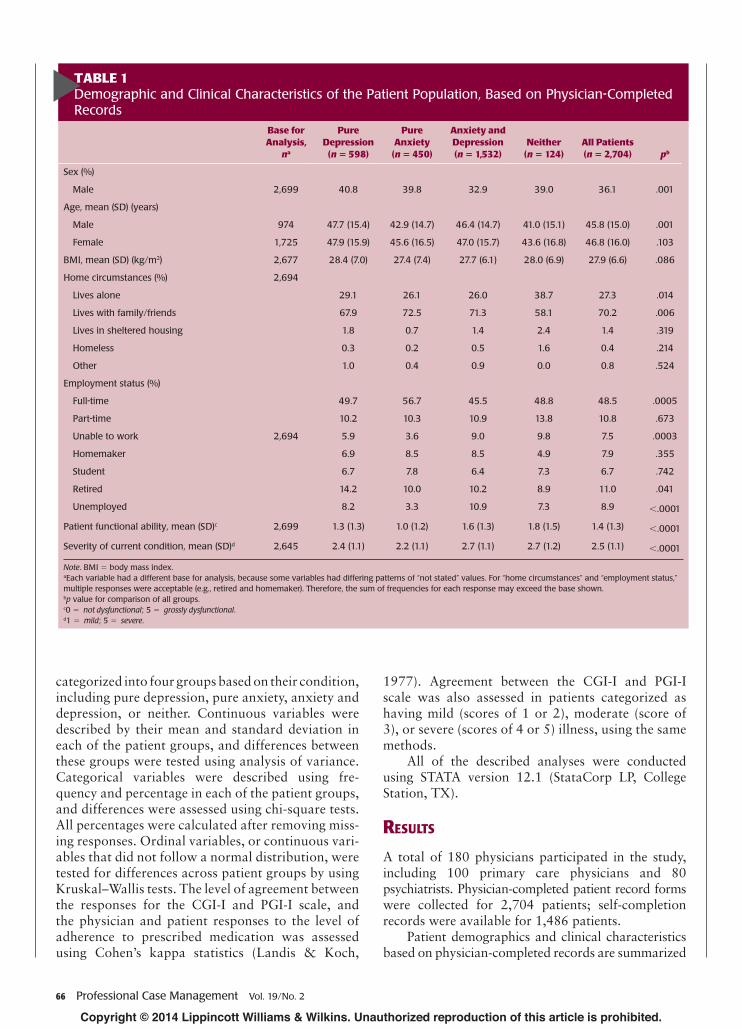
Lives with family/friends 67.9 72.5 71.3 58.1 70.2 .006
Lives in sheltered housing 1.8 0.7 1.4 2.4 1.4 .319
Homeless 0.3 0.2 0.5 1.6 0.4 .214
Other 1.0 0.4 0.9 0.0 0.8 .524
Employment status (%)
Full-time 49.7 56.7 45.5 48.8 48.5 .0005
Part-time 10.2 10.3 10.9 13.8 10.8 .673
Unable to work 2,694 5.9 3.6 9.0 9.8 7.5 .0003
Homemaker 6.9 8.5 8.5 4.9 7.9 .355
Student 6.7 7.8 6.4 7.3 6.7 .742
Retired 14.2 10.0 10.2 8.9 11.0 .041
Unemployed 8.2 3.3 10.9 7.3 8.9 < .0001
Patient functional ability, mean (SD) c 2,699 1.3 (1.3) 1.0 (1.2) 1.6 (1.3) 1.8 (1.5) 1.4 (1.3) < .0001
Severity of current condition, mean (SD) d 2,645 2.4 (1.1) 2.2 (1.1) 2.7 (1.1) 2.7 (1.2) 2.5 (1.1) < .0001
Note . BMI = body mass index. a Each variable had a different base for analysis, because some variables had differing patterns of “not stated” values. For “home circumstances” and “employment status,” multiple responses were acceptable (e.g., retired and homemaker). Therefore, the sum of frequencies for each response may exceed the base shown. b p value for comparison of all groups. c 0 = not dysfunctional ; 5 = grossly dysfunctional . d 1 = mild ; 5 = severe .
categorized into four groups based on their condition, including pure depression, pure anxiety, anxiety and depression, or neither. Continuous variables were described by their mean and standard deviation in each of the patient groups, and differences between these groups were tested using analysis of variance. Categorical variables were described using fre-quency and percentage in each of the patient groups, and differences were assessed using chi-square tests. All percentages were calculated after removing miss-ing responses. Ordinal variables, or continuous vari-ables that did not follow a normal distribution, were tested for differences across patient groups by using Kruskal–Wallis tests. The level of agreement between the responses for the CGI-I and PGI-I scale, and the physician and patient responses to the level of adherence to prescribed medication was assessed using Cohen’s kappa statistics (Landis & Koch,
1977). Agreement between the CGI-I and PGI-I scale was also assessed in patients categorized as having mild (scores of 1 or 2), moderate (score of 3), or severe (scores of 4 or 5) illness, using the same methods.
All of the described analyses were conducted using STATA version 12.1 (StataCorp LP, College Station, TX).
R ESULTS
A total of 180 physicians participated in the study, including 100 primary care physicians and 80 psychiatrists. Physician-completed patient record forms were collected for 2,704 patients; self- completion records were available for 1,486 patients.
Patient demographics and clinical characteristics based on physician-completed records are summarized
PCM-D-12-00021.indd 66PCM-D-12-00021.indd 66 25/01/14 1:03 AM25/01/14 1:03 AM
FIGURE 2 Physician versus patient perception of improvement in illness, matched patients ( n = 1,242), measured using Clinical Global Impressions–Improvement and Patient Global Impressions–Improvement scales. Data represent physician responses by patient response category. Circle size represents the number of patients for each data point. Data labels show percentage of physicians who gave each categorical response within particular single patient response category. CGI-I = Clinical Global Impressions–Improvement; PGI-I = Patient Global Impressions–Improvement.
by presenting symptoms of anxiety and/or depression in Table 1 . Most patients were women (64%); the mean age of all patients in the study was 46 years. A majority of patients lived alone or with family and friends and were employed full-time.
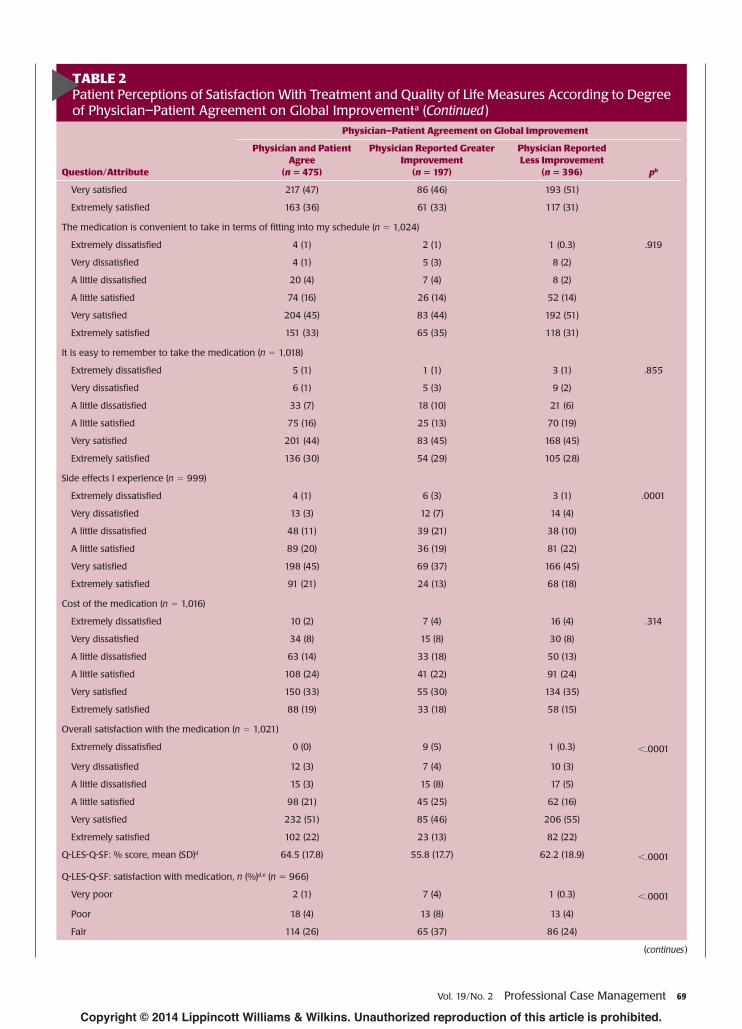
Results of the physician- and patient-rated improve-ment in illness, based on the CGI-I and PGI-I scales, respectively, are shown in Tables 2 and 3, Supplemen-tal Digital Content, available at: http://links.lww.com/PCM/A5. Most physicians (82%) and patients (89%) had an overall impression of improvement when con-sidering all patients with combined mild, moderate, and severe illness. Impression of improvement by physicians progressively decreased with increased severity of ill-ness (i.e., mild, 89%; moderate, 79%; severe, 66%; see Table 2, Supplemental Digital Content, available at: http://links.lww.com/PCM/A5). Patient perception of improvement was similar for mild (92%) and moder-ate disease (89%) and decreased to 80% for patients with severe disease (see Table 3, Supplemental Digital Content, available at: http://links.lww.com/PCM/A5).
Results of the kappa analysis assessing the level of agreement between the responses for the
CGI-I and PGI-I scales demonstrated fair agree-ment between patients and physicians regarding overall impression of improvement in illness (44% agreement; κ = 0.23). Patients reported less satis-faction with treatment compared with physicians when the physician reported high levels of improve-ment (see Figure 2 ). Overall, physician estimates matched patient-reported improvements in 44% of all matched cases, were lower than the patient report in 37% of matched cases, and were higher in 18% of matched cases.
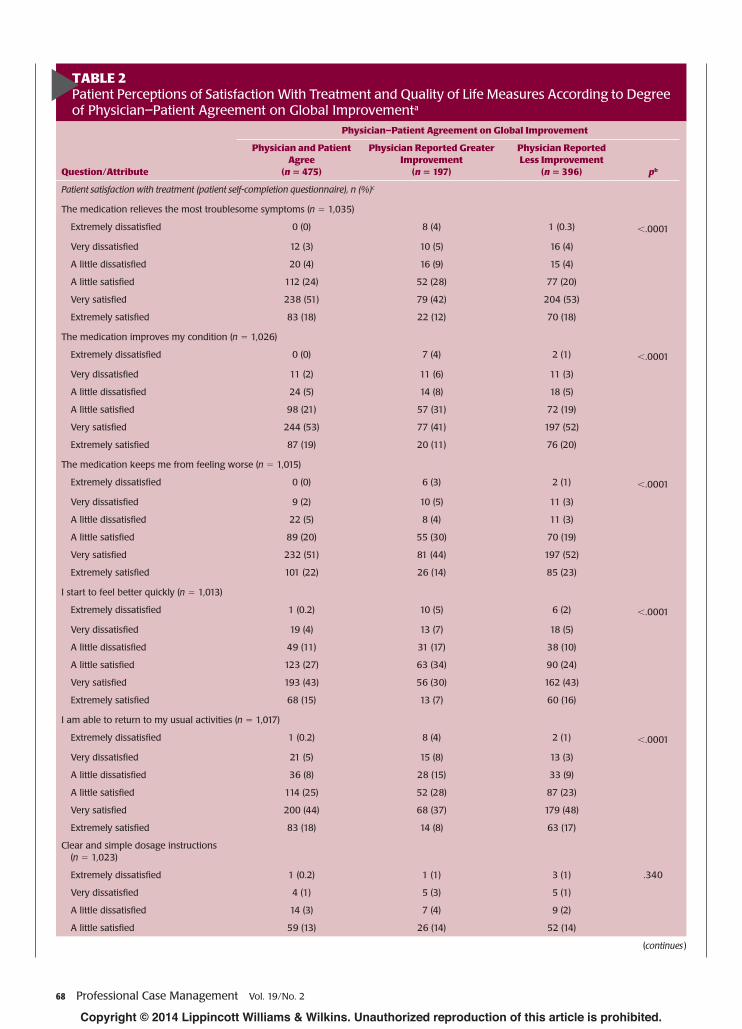
No differences were observed in comparisons of levels of agreement among psychiatrists (45% agreement; κ = 0.25) versus primary care physicians (44% agreement; κ = 0.22). However, psychiatrists reported greater improvement than their patients more frequently than primary care physicians ( p < .05). Patient satisfaction and quality of life as mea-sured by the Quality of Life Enjoyment and Satisfac-tion Questionnaire–Short Form and the EuroQol 5 Dimension indicated that this same group of patients had lower satisfaction with their treatment and reduced quality of life (see Table 2 ).
PCM-D-12-00021.indd 67PCM-D-12-00021.indd 67 25/01/14 1:03 AM25/01/14 1:03 AM
TABLE 2 Patient Perceptions of Satisfaction With Treatment and Quality of Life Measures According to Degree of Physician–Patient Agreement on Global Improvement a
Question/Attribute
Physician–Patient Agreement on Global Improvement
Physician and Patient Agree
( n = 475)
Physician Reported Greater Improvement
( n = 197)
Physician Reported Less Improvement
( n = 396) p b
Patient satisfaction with treatment (patient self-completion questionnaire), n (%) c
The medication relieves the most troublesome symptoms (n = 1,035)
TABLE 2 Patient Perceptions of Satisfaction With Treatment and Quality of Life Measures According to Degree of Physician–Patient Agreement on Global Improvement a (Continued )
Question/Attribute
Physician–Patient Agreement on Global Improvement
Physician and Patient Agree
( n = 475)
Physician Reported Greater Improvement
( n = 197)
Physician Reported Less Improvement
( n = 396) p b
Very satisfi ed 217 (47) 86 (46) 193 (51)
Extremely satisfi ed 163 (36) 61 (33) 117 (31)
The medication is convenient to take in terms of fi tting into my schedule ( n = 1,024)
Extremely dissatisfi ed 4 (1) 2 (1) 1 (0.3) .919
Very dissatisfi ed 4 (1) 5 (3) 8 (2)
A little dissatisfi ed 20 (4) 7 (4) 8 (2)
A little satisfi ed 74 (16) 26 (14) 52 (14)
Very satisfi ed 204 (45) 83 (44) 192 (51)
Extremely satisfi ed 151 (33) 65 (35) 118 (31)
It is easy to remember to take the medication ( n = 1,018)
Extremely dissatisfi ed 5 (1) 1 (1) 3 (1) .855
Very dissatisfi ed 6 (1) 5 (3) 9 (2)
A little dissatisfi ed 33 (7) 18 (10) 21 (6)
A little satisfi ed 75 (16) 25 (13) 70 (19)
Very satisfi ed 201 (44) 83 (45) 168 (45)
Extremely satisfi ed 136 (30) 54 (29) 105 (28)
Side effects I experience ( n = 999)
Extremely dissatisfi ed 4 (1) 6 (3) 3 (1) .0001
Very dissatisfi ed 13 (3) 12 (7) 14 (4)
A little dissatisfi ed 48 (11) 39 (21) 38 (10)
A little satisfi ed 89 (20) 36 (19) 81 (22)
Very satisfi ed 198 (45) 69 (37) 166 (45)
Extremely satisfi ed 91 (21) 24 (13) 68 (18)
Cost of the medication ( n = 1,016)
Extremely dissatisfi ed 10 (2) 7 (4) 16 (4) .314
Very dissatisfi ed 34 (8) 15 (8) 30 (8)
A little dissatisfi ed 63 (14) 33 (18) 50 (13)
A little satisfi ed 108 (24) 41 (22) 91 (24)
Very satisfi ed 150 (33) 55 (30) 134 (35)
Extremely satisfi ed 88 (19) 33 (18) 58 (15)
Overall satisfaction with the medication ( n = 1,021)
TABLE 2 Patient Perceptions of Satisfaction With Treatment and Quality of Life Measures According to Degree of Physician–Patient Agreement on Global Improvement a (Continued )
Question/Attribute
Physician–Patient Agreement on Global Improvement
Physician and Patient Agree
( n = 475)
Physician Reported Greater Improvement
( n = 197)
Physician Reported Less Improvement
( n = 396) p b
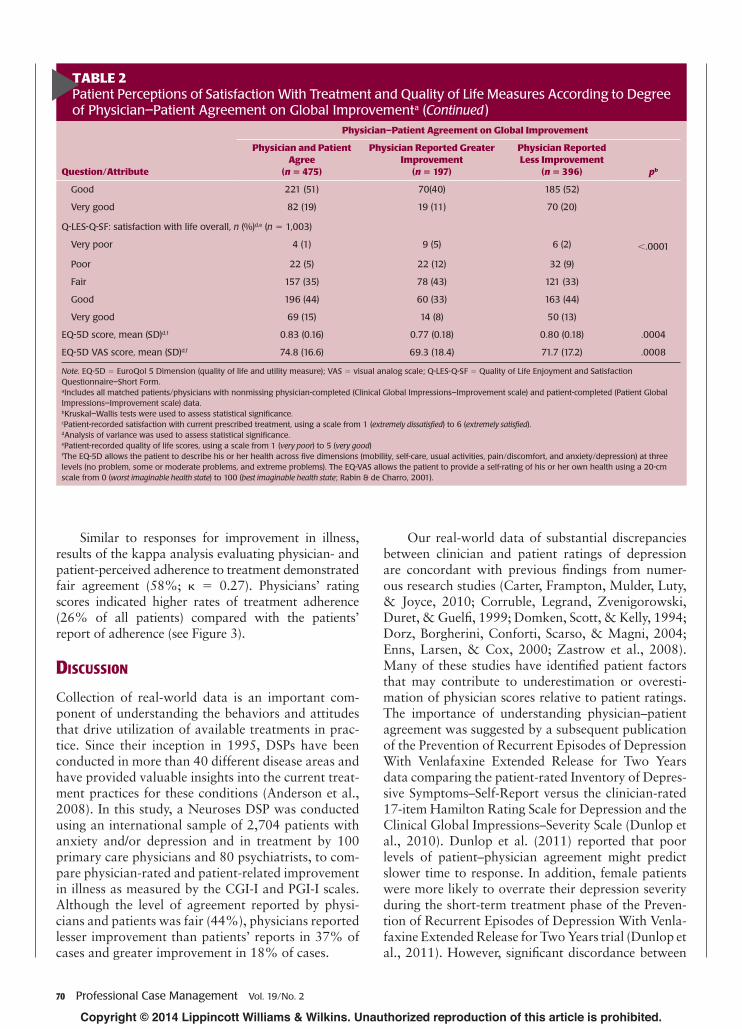
Good 221 (51) 70(40) 185 (52)
Very good 82 (19) 19 (11) 70 (20)
Q-LES-Q-SF: satisfaction with life overall, n (%) d,e ( n = 1,003)
EQ-5D VAS score, mean (SD) d,f 74.8 (16.6) 69.3 (18.4) 71.7 (17.2) .0008
Note. EQ-5D = EuroQol 5 Dimension (quality of life and utility measure); VAS = visual analog scale; Q-LES-Q-SF = Quality of Life Enjoyment and Satisfaction Questionnaire–Short Form. a Includes all matched patients/physicians with nonmissing physician-completed (Clinical Global Impressions–Improvement scale) and patient-completed (Patient Global Impressions–Improvement scale) data. b Kruskal–Wallis tests were used to assess statistical signifi cance. c Patient-recorded satisfaction with current prescribed treatment, using a scale from 1 ( extremely dissatisfi ed ) to 6 ( extremely satisfi ed ). d Analysis of variance was used to assess statistical signifi cance. e Patient-recorded quality of life scores, using a scale from 1 ( very poor ) to 5 ( very good ) f The EQ-5D allows the patient to describe his or her health across fi ve dimensions (mobility, self-care, usual activities, pain/discomfort, and anxiety/depression) at three levels (no problem, some or moderate problems, and extreme problems). The EQ-VAS allows the patient to provide a self-rating of his or her own health using a 20-cm scale from 0 ( worst imaginable health state ) to 100 ( best imaginable health state ; Rabin & de Charro, 2001).
Similar to responses for improvement in illness, results of the kappa analysis evaluating physician- and patient-perceived adherence to treatment demonstrated fair agreement (58%; κ = 0.27). Physicians’ rating scores indicated higher rates of treatment adherence (26% of all patients) compared with the patients’ report of adherence (see Figure 3 ).
D ISCUSSION
Collection of real-world data is an important com-ponent of understanding the behaviors and attitudes that drive utilization of available treatments in prac-tice. Since their inception in 1995, DSPs have been conducted in more than 40 different disease areas and have provided valuable insights into the current treat-ment practices for these conditions ( Anderson et al., 2008 ). In this study, a Neuroses DSP was conducted using an international sample of 2,704 patients with anxiety and/or depression and in treatment by 100 primary care physicians and 80 psychiatrists, to com-pare physician-rated and patient-related improvement in illness as measured by the CGI-I and PGI-I scales. Although the level of agreement reported by physi-cians and patients was fair (44%), physicians reported lesser improvement than patients’ reports in 37% of cases and greater improvement in 18% of cases.
Our real-world data of substantial discrepancies between clinician and patient ratings of depression are concordant with previous fi ndings from numer-ous research studies (Carter, Frampton, Mulder, Luty, & Joyce, 2010; Corruble, Legrand, Zvenigorowski, Duret, & Guelfi , 1999; Domken, Scott, & Kelly, 1994; Dorz, Borgherini, Conforti, Scarso, & Magni, 2004; Enns, Larsen, & Cox, 2000; Zastrow et al., 2008 ). Many of these studies have identifi ed patient factors that may contribute to underestimation or overesti-mation of physician scores relative to patient ratings. The importance of understanding physician–patient agreement was suggested by a subsequent publication of the Prevention of Recurrent Episodes of Depression With Venlafaxine Extended Release for Two Years data comparing the patient-rated Inventory of Depres-sive Symptoms–Self-Report versus the clinician-rated 17-item Hamilton Rating Scale for Depression and the Clinical Global Impressions–Severity Scale ( Dunlop et al., 2010 ). Dunlop et al. (2011) reported that poor levels of patient–physician agreement might predict slower time to response. In addition, female patients were more likely to overrate their depression severity during the short-term treatment phase of the Preven-tion of Recurrent Episodes of Depression With Venla-faxine Extended Release for Two Years trial ( Dunlop et al., 2011 ). However, signifi cant discordance between
PCM-D-12-00021.indd 70PCM-D-12-00021.indd 70 25/01/14 1:03 AM25/01/14 1:03 AM
FIGURE 3 Physician versus patient perception of patient adherence to medication. Circle size and data labels represent percentage of matched pairs at each data point.
PCM-D-12-00021.indd 71PCM-D-12-00021.indd 71 25/01/14 1:03 AM25/01/14 1:03 AM
patient-related and clinician-rated measures is not always evident such that self-rated scales have been advocated as a convenient alternative. Data obtained from the Sequenced Treatment Alternatives to Relieve Depression study demonstrated that the self-rated 16-item Quick Inventory of Depressive Symptomatol-ogy (i.e., patient-rated Quick Inventory of Depressive Symptomatology interactive voice response measures) was a suitable replacement for the clinician-rated 17-item Hamilton Rating Scale for Depression in out-patients with nonpsychotic major depressive disorder without overt cognitive impairment (Rush, Bernstein, et al., 2006).
In this study, physician- and patient-rated overall improvement in illness was 82% and 89%, respec-tively. This includes all phases of improvement as assessed by the CGI-I and PGI-I scales, including “very much improved,” “much improved,” and “minimally improved” for the physician-rated improvement and “very much better,” “much better,” and “a little bet-ter” for patient self-reports. However, these percentages are somewhat less favorable when omitting the “mini-mally improved” from the physician ratings scale and “a little better” from the self-reporting scale. These data are consistent with previous studies that demonstrate a signifi cant percentage of patients who fail to experience clinical improvement (Rush, Trivedi, et al., 2006).
One important observation of this study is that patients completed the patient self-completion ques-tionnaire after their consultation with the physician. Having the patient report ratings after the physician consultation may increase the chance for agreement, specifi cally in patients who presented with symptoms of depression and/or anxiety. One can assume that these patients have shared a conversation about their symptoms with the physician, thus helping bring a shared vision to the situation. However, it is impor-tant to note that these patient–physician conversa-tions may lead to further disparity if the physician assumes that the patient is in agreement with the
One important observation of this study is that patients completed the
patient self-completion questionnaire after their consultation with the
physician. Having the patient report ratings after the physician consultation may increase the chance for agreement, specifi cally in patients who presented with symptoms of depression and/or
anxiety.
proposed treatment plan simply on the basis of these discussions, when in fact the patient may be afraid to disagree with the physician.
This report has several limitations, including potential selection bias, because the analysis for this article involved only those patients being treated by physicians who participated in the DSP, and the study focused on anxiety and depression. In addition, because the study was based on consulting patients, patients who sought consultations more frequently had a greater chance of being included. Other limitations of this report include the lack of a formal diagnostic procedure, and the lack of a control group. Moreover, only a cross-section of data was collected with no abil-ity to identify cause and effect or changes over time.
CONCLUSION
Real-world data suggest that reduction in symptoms of anxiety and/or depression may be estimated differently by physicians when compared with the perception of their patients. This observation may be explained by the physicians’ perception that each patient may achieve a certain amount of improvement from a specifi c drug rather than measuring improvement on a patient-by-patient basis. In addition, the disparity between patients and their physicians may be related to the agreed-upon severity of symptoms during the initial visit. Ultimately, on the basis of an initial miscommuni-cation, the patient may not be diagnosed appropriately and prescribed the optimal therapy, thus leading to dis-crepancies in the perception of improvement.
Implications for Case Management
Overall, these fi ndings are consistent with research reports in the literature and should be considered when assessing treatment and practice patterns. Because these disparities exist between physician- and patient-rated measures of depression in the
… understanding the potential for disparities between physician- and patient-rated measures in reviewing
patient care can help the case manager ensure that treatment plans are aligned
with patient needs. Collaborative care can reduce depressive symptoms
and improve functional outcomes compared with standard care in
depressed patients.
PCM-D-12-00021.indd 72PCM-D-12-00021.indd 72 25/01/14 1:03 AM25/01/14 1:03 AM
clinical setting, it is critical for physicians to examine the tools and methods used for evaluating symptoms and improvement in an effort to maximize treatment adherence and overall patient outcomes. Moreover, understanding the potential for disparities between physician- and patient-rated measures in reviewing patient care can help the case manager ensure that treatment plans are aligned with patient needs. Col-laborative care can reduce depressive symptoms and improve functional outcomes compared with stan-dard care in depressed patients ( Katon et al., 2005 ; Katon & Guico-Pabia, 2011) without signifi cantly increasing overall medical costs ( Katon et al., 2005 , 2008), and effective patient assessment and follow-up are key aspects of the collaborative care model (Katon & Guico-Pabia, 2011). Case management workers trained to use assessment instruments can monitor progress on the basis of both physician and patient perspectives, and fl ag issues to report to pri-mary care physicians or psychiatrists as needed.
R EFERENCES Anderson , P. , Benford , M. , Harris , N. , Karavali , M. ,
& Piercy , J. ( 2008 ). Real-world physician and patient behaviour across countries: Disease-specifi c programmes—a means to understand . Current Medi-cal Research and Opinion , 24 ( 11 ), 3063 – 3072 .
Carter , J. D. , Frampton , C. M. , Mulder , R. T. , Luty , S. E. , & Joyce , P. R. ( 2010 ). The relationship of demo-graphic, clinical, cognitive and personality variables to the discrepancy between self and clinician rated depression . Journal of Affective Disorders , 124 ( 1/2 ), 202 – 206 .
Corruble , E. , Legrand , J. M. , Zvenigorowski , H. , Duret , C. , & Guelfi , J. D. ( 1999 ). Concordance between self-report and clinician’s assessment of depression . Journal of Psychiatric Research , 33 ( 5 ), 457 – 465 .
Domken , M. , Scott , J. , & Kelly , P. ( 1994 ). What factors predict discrepancies between self and observer ratings of depression ? Journal of Affective Disorders , 31 ( 4 ), 253 – 259 .
Dorz , S. , Borgherini , G. , Conforti , D. , Scarso , C. , & Magni , G. ( 2004 ). Comparison of self-rated and clinician-rated measures of depressive symptoms: A natural-istic study . Psychology and Psychotherapy , 77 ( Pt 3 ), 353 – 361 .
Dunlop , B. W. , Li , T. , Kornstein , S. G. , Friedman , E. S. , Rothschild , A. J. , Pedersen , R. , … Keller , M. ( 2010 ). Correlation between patient and clinician assessments of depression severity in the PREVENT study . Psychia-try Research , 177 ( 1/2 ), 177 – 183 .
Dunlop , B. W. , Li , T. , Kornstein , S. G. , Friedman , E. S. , Rothschild , A. J. , Pedersen , R. , … Trivedi , M. H . ( 2011 ). Concordance between clinician and patient ratings as predictors of response, remission, and recur-rence in major depressive disorder . Journal of Psychi-atric Research , 45 ( 1 ), 96 – 103 .
Endicott , J. , Nee , J. , Harrison , W. , & Blumenthal , R. ( 1993 ). Quality of Life Enjoyment and Satisfaction Questionnaire: A new measure . Psychopharmacology Bulletin , 29 ( 2 ), 321 – 326 .
Enns , M. W. , Larsen , D. K. , & Cox , B. J. ( 2000 ). Discrep-ancies between self and observer ratings of depression. The relationship to demographic, clinical and person-ality variables . Journal of Affective Disorders , 60 ( 1 ), 33 – 41 .
EuroQol Group . ( 1990 ). EuroQol—a new facility for the measurement of health-related quality of life . Health Policy , 16 ( 3 ), 199 – 208 .
Gelenberg , A. J. ( 2010 ). The prevalence and impact of depression . Journal of Clinical Psychiatry , 71 ( 3 ), e06 .
Guy , W. ( 1976 ). Clinical global impressions . In ECDEU assessment manual for psychopharmacology (pp. 217 – 222 ). Rockville, MD : U.S. Department of Health, Education, and Welfare .
Hopko , D. R. , Bourland , S. L. , Stanley , M. A. , Beck , J. G. , Novy , D. M. , Averill , P. M. , & Swann , A. C . ( 2000 ). Generalized anxiety disorder in older adults: Examin-ing the relation between clinician severity ratings and patient self-report measures . Depression and Anxiety , 12 ( 4 ), 217 – 225 .
Katon , W. , & Guico-Pabia , C. J. ( 2011 ). Improving quality of depression care using organized systems of care: A review of the literature . The Primary Care Companion to CNS Disorders , 13 ( 1 ). doi: 10.4088/PCC.10r01019blu.
Katon , W. J. , Russo , J. E. , Von , K. M. , Lin , E. H. , Ludman , E. , & Ciechanowski , P. S. ( 2008 ). Long-term effects on medical costs of improving depression outcomes in patients with depression and diabetes . Diabetes Care , 31 ( 6 ), 1155 – 1159 .
Katon , W. J. , Schoenbaum , M. , Fan , M. Y. , Callahan , C. M. , Williams , J. , Jr., Hunkeler , E. , … Unützer , J. ( 2005 ). Cost-effectiveness of improving primary care treatment of late-life depression . Archives of General Psychiatry , 62 ( 12 ), 1313 – 1320 .
Landis , J. R. , & Koch , G. G. ( 1977 ). The measurement of observer agreement for categorical data . Biometrics , 33 ( 1 ), 159 – 174 .
Rabin , R. , & de Charro , F. ( 2001 ). EQ-5D: A measure of health status from the EuroQol Group . Annals of Medicine , 33 ( 5 ), 337 – 343 .
Rush , A. J. , Bernstein , I. H. , Trivedi , M. H. , Carmody , T. J. , Wisniewski , S. , Mundt , J. C. , & Fava , M. ( 2006 ). An evaluation of the Quick Inventory of Depressive Symptomatology and the Hamilton Rating Scale for depression: A sequenced treatment alternatives to relieve depression trial report . Biological Psychiatry , 59 ( 6 ), 493 – 501 .
Case management workers trained to use assessment instruments can
monitor progress on the basis of both physician and patient perspectives, and
fl ag issues to report to primary care physicians or psychiatrists as needed.
PCM-D-12-00021.indd 73PCM-D-12-00021.indd 73 25/01/14 1:03 AM25/01/14 1:03 AM
Rush , A. J. , Trivedi , M. H. , Wisniewski , S. R. , Nierenberg , A. A. , Stewart , J. W. , Warden , D. , … Fava , M. ( 2006 ). Acute and longer-term outcomes in depressed out-patients requiring one or several treatment steps: A STAR*D report . American Journal of Psychiatry , 163 ( 11 ), 1905 – 1917 .
Small , M. , Anderson , P. , Vickers , A. , Kay , S. , & Fermer , S. ( 2011 ). Importance of inhaler-device sat-isfaction in asthma treatment: Real-world observa-tions of physician-observed compliance and clinical/patient-reported outcomes . Advances in Therapy , 28 ( 3 ), 202 – 212 .
Small , M. , Vickers , A. , Anderson , P. , … Kay , S. ( 2010 ). The patient–physician partnership in asthma: Real-world observations associated with clinical and patient-reported outcomes . Advances in Therapy , 27 ( 9 ), 591 – 599 .
Zastrow , A. , Faude , V. , Seyboth , F. , Niehoff , D. , Herzog , W. , & Lowe , B. ( 2008 ). Risk factors of symptom underestimation by physicians . Journal of Psychoso-matic Research , 64 ( 5 ), 543 – 551 .
Shannon Lubaczewski’s, PharmD, MS, 15-year career in the pharmaceutical industry includes diverse experiences such as drug manufacturing and packaging, project management, vendor manage-ment, clinical quality auditing, pharmacovigilance auditing, clinical pharmacy, and clinical study management from initial planning through coauthoring of the clinical manuscript. Shannon earned a bachelors degree in pharmacy at the Philadelphia College of Pharmacy and Science. She completed a master’s degree in quality assurance and regulatory affairs from Temple University. She also earned a doctorate in pharmacy from the University of the Sciences in Philadelphia. She maintains licen-sure in the state of Pennsylvania.
Jason Shepherd, Project Director, Adelphi Real World, joined Adel-phi in 2001 after previous marketing research roles with the Medical Research Council, The Research Business International, and NOP in London. He has worked across many therapy areas and is currently responsible for the Neuroses Disease-Specifi c Programme for Adelphi Real World.
Rana Fayyad, PhD, is a statistician with 20 years in the Pharma-ceutical industry. Rana has been an employee of Pfi zer Inc. for 14 years and, during her career, worked on multiple therapeutic areas, including cardiovascular, oncology, neuroscience, and ophthalmology, covering phases II–IV, as well as publications, and regulatory responses. Rana obtained her PhD in statistics from Colorado State University.
Christine J. Guico-Pabia, MD, MBA, MPH, is a physi-cian executive with diverse health care management experience in pharmaceutical, managed care, public health, and medical delivery environments. Christine has a sustained track record of effectively developing and launching innovative pharmaceutical, medical infor-matics, and managed care products with particular expertise in neu-roscience and women’s health. She joined Wyeth Pharmaceuticals, now Pfi zer Inc., more than 6 years ago as Director and later as Senior Director, Global Medical Affairs, after 10 years at Merck & Company, Inc., where she held increasing responsibilities in Global Outcomes Research and Clinical Research & Development. Christine received her medical degree from the University of Santo Tomas and completed her research fellowship at the Children’s Hospital of Philadelphia. She also completed an MBA in health care administration from Temple University and a master of public health in epidemiology from Johns Hopkins University.
PCM-D-12-00021.indd 74PCM-D-12-00021.indd 74 25/01/14 1:03 AM25/01/14 1:03 AM