Page 1
REALE ESTATE MARKET IN CHINA:
HOUSING REFORM AND AFFORDABILITY
BY
XIE YUFEI
STUDENT NO. 12050652
A PROJECT SUBMITTED IN PARTIAL FULFILLMENT OF THE
REQUIREMENT FOR THE DEGREE OF
BACHELOR OF SOCIAL SCIENCE (HONOURS) DEGREE IN CHINA STUDIES
ECONOMICS CONCENTRATION
HONG KONG BAPTIST UNIVERSITY
APRIL 2015
Page 2
2
HONG KONG BAPTIST UNIVERSITY
April 2015
We hereby recommend that the Project by Mr. XIE YUFEI entitled “Real estate market
in China: housing reform and affordability” be accepted in partial fulfillment of the
requirements for the Bachelor of Social Sciences (Honours) Degree in China studies in
Economics.
____________________ _____________________
Dr. Chan Hing Lin
Project Supervisor Second Examiner
Page 3
3
Acknowledgements
I would like to thank my supervisor Dr. Chan Hing Lin for guiding me through the
entire study. Thanks are also due to my family and friends for their meticulous care
and kindly encouragement.
___________________________________
Student’s signature
China Studies Degree Course
(Economics Concentration)
Hong Kong Baptist University
Date: ____________________________
Page 4
4
Table of Contents
1. Introduction................................................................................................................ 5
2. Housing Market Development in China.................................................................... 6
2.1 Chinese Housing Market before Economic Reform......................................... 6
2.2 Chinese Housing Market after Economic Reform............................................ 8
2.2.1 The First Stage (1979-1991)................................................................. 8
2.2.2 The Second Stage (1992-1997)...........................................................10
2.2.3 The Third Stage (1998-now) ............................................................. 15
3. Housing Affordability Issue..................................................................................... 18
3.1 Housing Finance Market for Individuals........................................................ 18
3.1.1 Housing Provident Fund System........................................................ 18
3.1.2 Commercial bank mortgage loan........................................................ 21
3.2 Evidence of the Rapidly Increasing Price of the Residential Housing........... 22
3.3 Reasons for the Skyrocket up of the Housing Price........................................ 23
3.4 Housing Price-to-Income Ratio Analysis....................................................... 29
3.5 Harms Caused by High Housing Price........................................................... 35
4. Major Findings and Conclusion............................................................................... 39
5. Appendix.................................................................................................................. 41
5.1 Figures............................................................................................................. 41
5.2 Tables.............................................................................................................. 43
6. References................................................................................................................ 52
Page 5
5
1. Introduction
China's housing market plays a very important role in the Chinese economy. In
recent years, the boom in real estate market surprised both the Chinese government and
the Chinese citizens. On one hand, the rapid development in housing market drives the
economy going forward, providing better residential properties to the people. On the
other hand, the affordability issue becomes a major concern by the policy makers. The
first part of this article will review the development of the Chinese real estate market
from 1949 to present. The second part of the paper will be given a detailed discussion
about the housing affordability issue.
Page 6
6
2. Housing Market Development in China
Since the founding of the New China, the housing market has always been one
of the major policy concerns to the Chinese government. The development of the real
estate market experienced two major periods. The watershed was in 1978, when the
market-oriented economic reform took place. As China was transformed from a
centrally planned economy to a market economy, the social welfare function of housing
slowly disappeared, and the nature of the housing resources gradually changed from
public goods to commodities. The Chinese government set up a lot of experimental
areas to initiate the new policies and laws, and implement the new governance to the
whole nation. The real estate market was fully privatized in 1998, marking a milestone
in the history of housing development.
2.1 Chinese Housing Market before Economic Reform
The Chinese Communist Party (CCP) came to power in 1949. In the first 30
years of the country's founding, the Chinese economy was centrally planned. Under
socialism, the work unit system (dan wei zhi) was established in the urban areas as the
principal methods of social mobilization and social control. Each work unit was
Page 7
7
strongly associated with its workers in the sense that almost everything people depend
on for a living was provided by the work unit system. Housing was one of the social
welfares that was created and distributed directly by work units to its employees. There
was no market for properties since urban land was totally owned by the state, and the
government controlled all the transactions of the lands. Thus, citizens did not buy their
housing in the market but apply for it in their work units. Work units then distributed the
housing resources according to the seniority and merits of the applicants. This process
increased the inequality among citizens since the standard of housing distribution was
not well established (Liu & Wang, 1999). Housing was not a commodity but public
goods and services, which were embedded in the social welfare system. Because of the
nature of the housing resources and its allocation process, the government invested huge
amount of money for 30 years with no return. For the housing owners, the rent was as
low as about 1 per cent of the employers' income, which was too low to cover the
maintenance cost, resulting in an increasing number of decrepit houses (Liu & Wang,
1999). Meanwhile, the government had to face the increasing financial burden. In late
1970s, the supply of housing was in severe shortage with huge amount of land being
Page 8
8
misused or left unused. People tried to apply for as many land as possible, since land
use was actually free of charge with no time limit in usage. The chaos in the housing
market created many problems. Because of the heavy financial burden, the
infrastructure constructions such as transportation, telecommunication, and water
supply and drainage was left underdeveloped in city areas, lowered the living conditions
of urban residents (Man, 2011). The result indicates that the government was not able to
supply cheap and well-built housing for its citizens in the long run. The housing market
needed changes urgently.
2.2 Chinese Housing Market after Economic Reform
1978 is a critical year for Chinese economy. Deng Xiaoping launched the
market-oriented economic reform, which brought dramatic changes to the country's
economy in every aspect. Since then, the real estate market gradually formed with the
commercialization of housing development, allocation, distribution, exchange and
maintenance. The process of the housing market reform can be separated into three
stages.
2.2.1 The First Stage (1979-1991)
Page 9
9
In 1979, the central government selected 5 pilot cities to do the initial housing
reform experiment by selling newly built public housing to residents at the construction
cost. In 1980, the central government passed the proposal, which allows private housing
ownership, building and purchasing. Transactions were allowed for both newly
constructed housing and existing ones. In the same year, Shenzhen acted as the first
special economic zone to implement the time limit of land use period with the
imposition of land use fees (Liu & Wang 1999). Guangdong provincial government
classified the land in Shenzhen into different grades, each with a certain standard of
charging (Chai, 2008). The positive result led to the imitations of another several pilot
zones including Guangzhou and Fushun in the following years, indicating a nationwide
commercialization of urban housing system (Liu & Wang, 1999). In 1984, the Chinese
government classified the real estate industry as an independent industry in the official
document titled Economic Industrial Classification Codes and Standards (Chai, 2008).
Since then, the foundation of the real estate market was established.
In addition to imposing fees on the use of land, the paid transfer of the right to
land use was further allowed in 1988 due to the amendment of the constitution and the
Page 10
10
Land Management Law. The experiments were undertaken in Shenzhen, Shanghai and
Guangzhou, where the rights to state-owned land use were traded between the
government and both the domestic and foreign real estate developers in forms of auction,
bidding and agreement (Liu & Wang, 1999). Cities such as Zhuhai and Xiamen
followed the trend, starting transfer the right to land use. They also made specific laws
in order to bring order to the right transferring market (Chai, 2008).
In September 1988, the State Council imposed the experimental urban land use
tax. All corporates and individuals who involve in the use of state-owned lands should
pay the tax. Some additional regulations related to the housing market were issued by
the State Council in 1990, forming the legal basis and framework of future reform (Chai,
2008). However, in 1989, the political environment in China was highly unstable. The
economic development in China was negatively affected by some social movements and
its side effects. The housing market also cooled down in 1989 and 1990 compare to the
previous years.
2.2.2 The Second Stage (1992-1997)
Page 11
11
The second stage of the evolution is from 1992 to 1997. In this era, the
economic downturn recovered rapidly as the social and political environment became
more stable. Although work unit still partially participated in the construction and
distribution process of housing to their employees, the commercializing of property
market was regarded as the main trend of the real estate market development. Overall,
the development was overheated at first, and then became more steadily after 1994.
In 1992, Deng Xiaoping's famous Southern Tour Speech accelerated the
development of the Chinese housing market. According to Deng, China would continue
to open its economy, and the real estate market was one of the major focuses in the
tertiary industry. His speech brought a turning point to the Chinese housing market. As
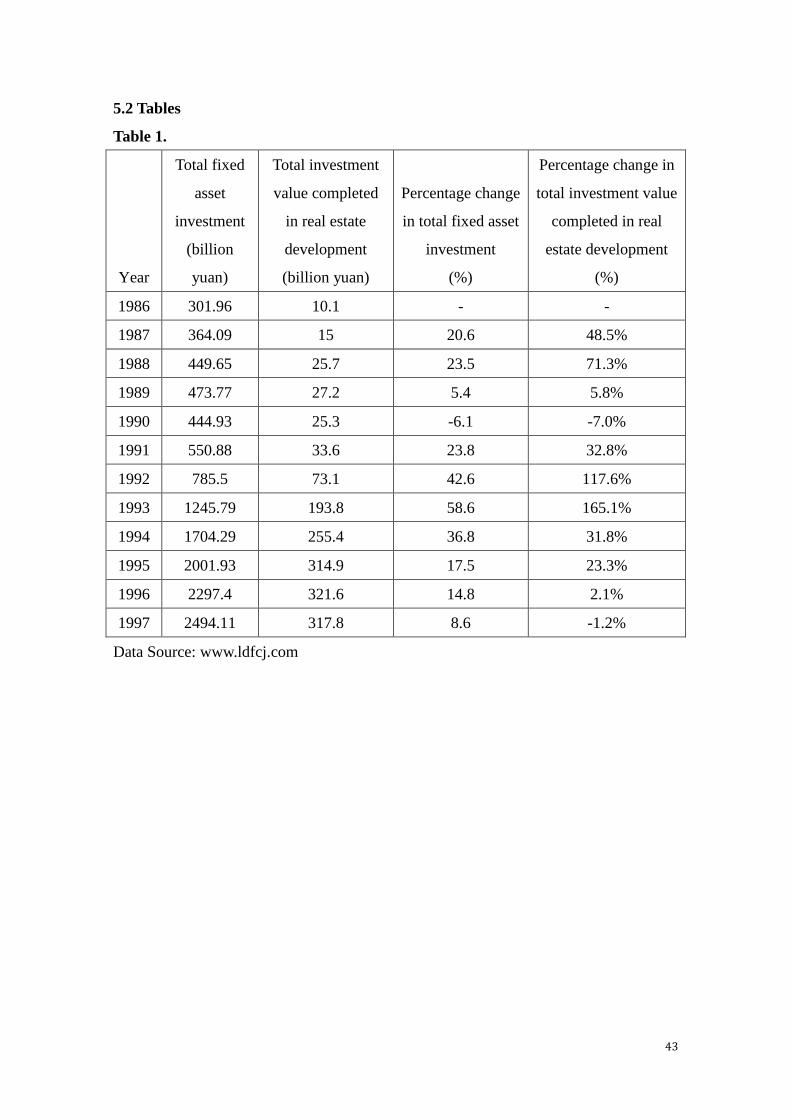
refer to Table 1, the average investment value in housing development was 22.8 billion
yuan from 1986 to 1991. Only three years after Deng's announcement, the figure
skyrocketed to 314.9 billion yuan in 1995, which was 15 times larger than that of 1991.
The annual growth rate of the housing investment was 117.6 per cent in 1992 and
reached its peak at 165.1 per cent in the following year. Compare to the annual growth
rate of total fixed asset investment in the same period, the housing sector outperformed
Page 12
12
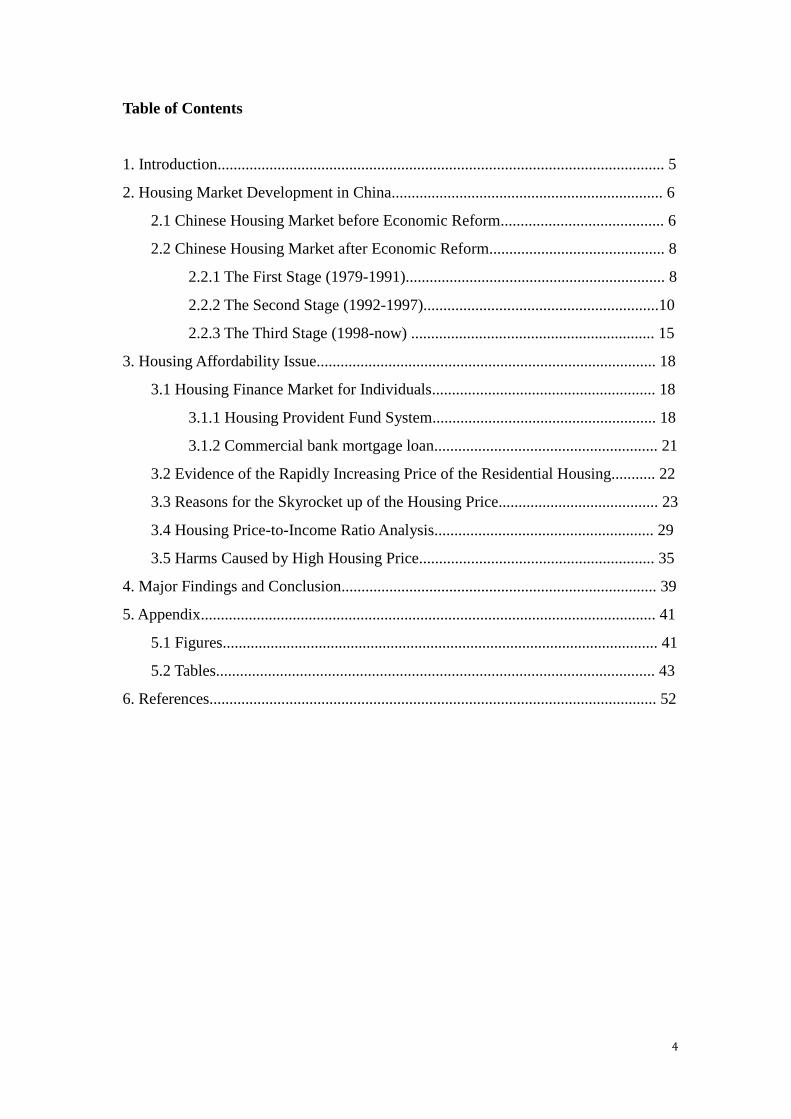
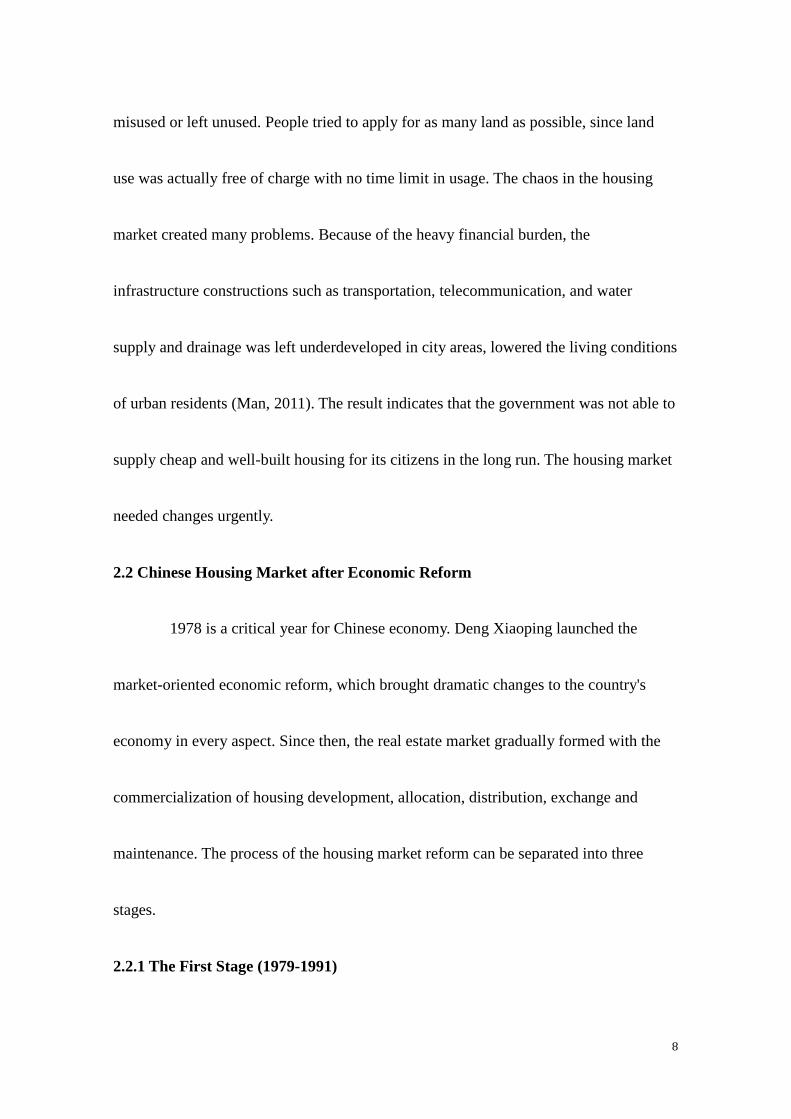
with a huge gap. The changes in total investment value completed in real estate
development for year 1986 to 1997 is illustrated in Figure 1. A huge jump in investment
value can be easily observed during 1991 to 1995. The trend both before and after the
over-heating period is relatively steady. To better observe the abnormal development
speed of the housing market, another comparison between the year on year changes of
the total investment completed in real estate industry and the total fixed asset
investment is plotted in Figure 2. The red line, which represents the property market, is
significantly higher than the blue line between 1992 and 1994.
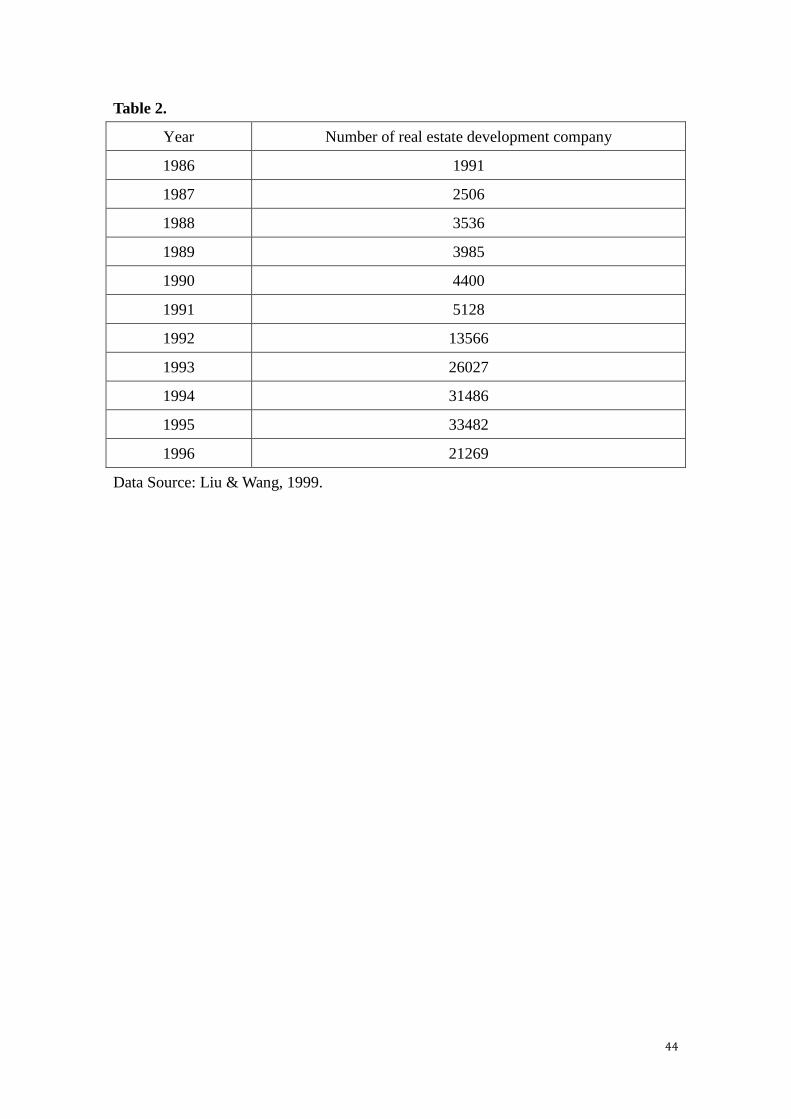
In addition to the investment heat, the number of company involving in
property development also increased dramatically. According to Wang and Liu (1999),
there were only 5128 real estate developers at the end of 1991 in China. However, more
than 8000 housing development companies were established within one year. In 1994, a
total of 31486 corporations were in the housing market across the nation. The detailed
number of real estate development company is listed in Table 2.
The evidences above clearly show a sign of overheats in China's housing
market after 1992. It is a result of both the long absence of the Chinese housing market
Page 13
13
and the further implementation of the opening reform. In practice, the rapid growth
brought some negative externalities. First, the abnormal boom in housing market
created housing bubbles. No economy could grow as fast as Chinese property market,
which means the allocation of capital was highly biased towards real estate industry.
Thus, there was an increase in the demand of construction materials like Steel, cement
and wood, resulting in higher prices of the materials. The rapid changes in prices would
further influence the demand and supply of many other commodities, making the
economy unbalanced. Second, because they are appeared overnight, most of the real
estate companies were small in size and poor in management. They allocated separately
along the coastal areas, resulting in diseconomies of scale. In order to generate higher
profit, those companies focused on the development of commercial buildings instead of
residential properties. However, the demand in office buildings was not aligned with the
supply, foreshadowing a high housing vacancy rate in the future (Wang & Liu, 1999).
Third, the behavior in the real estate market was highly irregular. The booming of the
market did not company with a sound regulatory mechanism. Many property
development companies did not focus on the needs of the society but keen on
Page 14
14
speculation. In some cases, developers did not aim to conduct construction on the land
in the first place. They simply want to resale the land to gain easy profit. Speculations
largely raised the price of housing, making the real estate market very unhealthy. The
revenue generated in the property market went mainly to the developers' hands while
affordability problem rose among coastal areas (Chai, 2008).
After 1994, the Chinese government tried to control the development of the
housing market by strengthening the macroeconomic regulations. As shown in Figure 2,
both the total investment in fixed asset and in real estate development cooled down. In
1994, 1996 and 1997, the annual growth rate of completed housing investment was
lower than that of the total investment in fixed asset, which means the real estate section
had changed from an overheating industry to a relatively normal or unpopular one. In
1997, the value of completed investment in real estate development was recorded a
negative growth of 1.2 per cent. Overall, the Chinese housing market had a relatively
stable development after 1994 till 1997.
In conclusion, the real estate market was gradually formed during the second
stage of the housing market reform. The Chinese government accumulated some
Page 15
15
experience in the housing regulation and governance, and was able to make the market
environment healthier. In people's mind, the essence of housing has been transforming
from public goods and social welfare distributed among urban employees, to
commodities that can be purchased and exchanged in the market.
2.2.3 The Third Stage (1998-now)
The third stage of the housing reform began with the total abandonment of
work unit housing distribution system in 1998. According to the State Council
Document No. 23, employers were only allowed to provide relevant subsidies to their
newly employed workers but direct involvement in the construction and allocation of
housing resources were no longer permitted. Selected middle- and low-income urban
residents could live in subsidized or public rental housing, while high-income families
should relied on mortgage financing to purchase private housing in the market (Man,
2011). Since then, the real estate market in China was fully commercialized.
In addition to the determination of the central government to form a market-driven
real estate market, the other reason for the Chinese government to speed up the housing
reform is to "foster a new point of economic growth. The idea was first proposed by
Page 16
16
Premier Zhu Rongji in June 1996, who further emphasized the residential housing
market to be the major focus point (Chai, 2008).
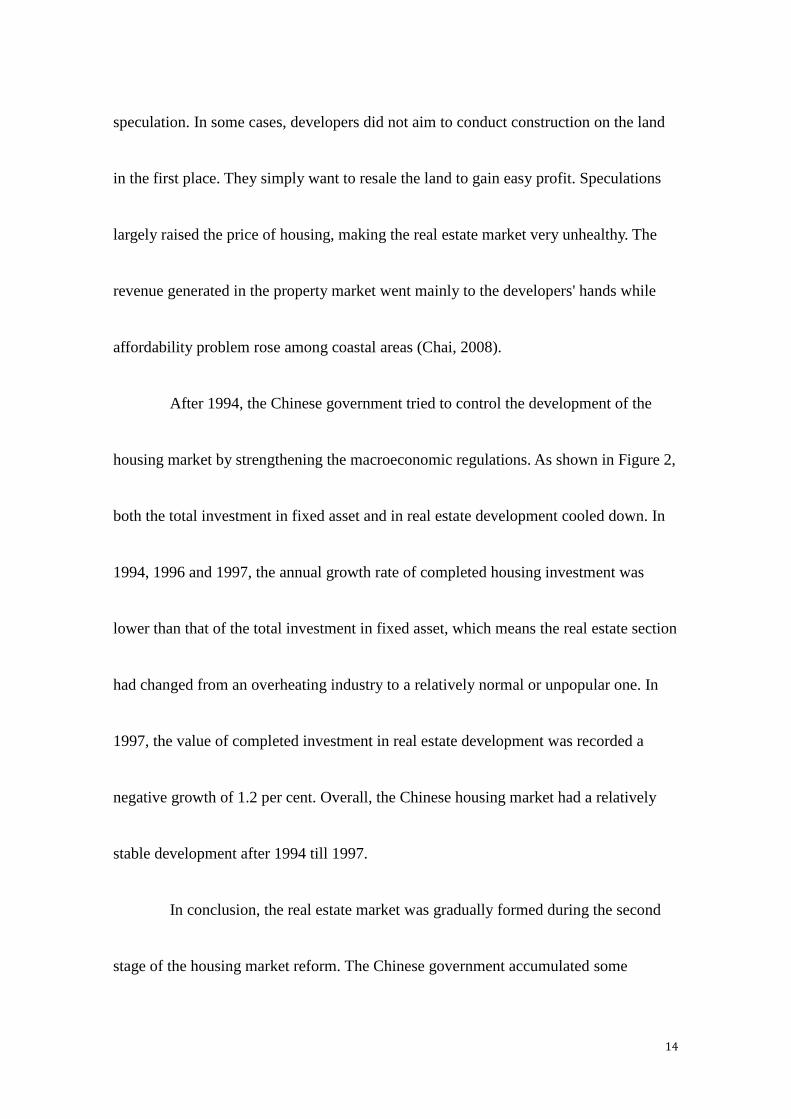
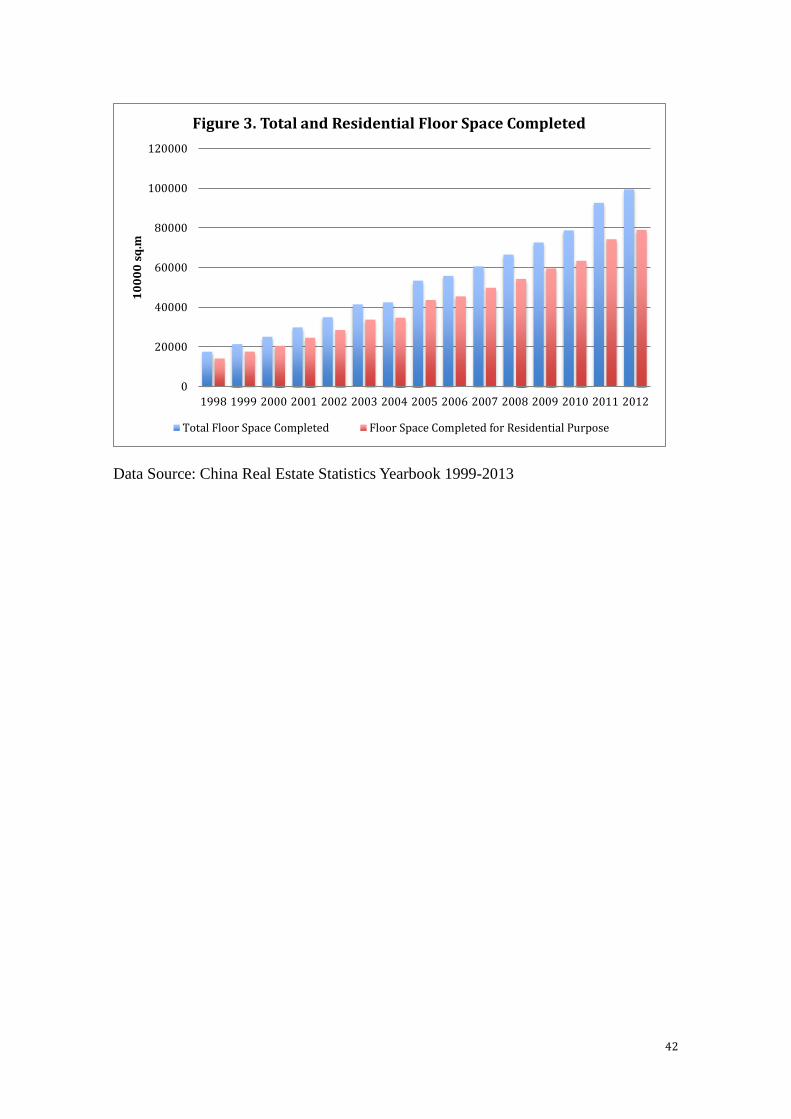
Following the government's strategy, the majority of housing construction in this
era is for residential purpose. Table 3 listed the relationship between the total real estate
development and housing construction completed for residential purpose. From 1998,
the residential housing dominated the whole real estate market. The ratio of residential
housing floor space completed has been at a very steady 80 per cent of total property
construction. The government also advocated the purchase of the new homes by
deducting several taxes charged when purchasing new estates and selling the old ones
(Chai, 2008). Due to the policy support, the figure of residential floor space completed
recoded a 13.3 per cent average annual growth rate between 1998 and 2012. A closer
look of the relationship is illustrated in Figure 3. The housing market had been
developing in a steady speed. On the other hand, the sales of residential housing had
also been increasing since 1998. Due to data limitations, Table 4 lists the sales data of
residential housing from 1998 to 2004. Each year, Chinese people buy more residential
housing than before. The sale in 2004 was 2.6 times of the number in 1998. Compare to
Page 17
17
the situation before the economic reform, urban and rural households see huge
improvement of their living conditions due to this mass provision of private housing.
The housing market in China experienced dramatic changes in the past 60 years.
The Chinese government successfully set up a privatized real estate market through its
housing market reform. The living conditions of the citizens improved a lot, and the
government no longer bears heavy burdens caused by housing resources provision. In
many sense, the housing market reform is successful.
Page 18
18
3. Housing Affordability Issue
The boom in Chinese housing market is like the two sides of a coin. On one
hand, the construction of the housing drives the economy moving forward. Urbanization
creates a lot of job opportunities for the migrant workers. The expansions in
constructions stimulate the domestic demand. On the other hand, real estate and
residential housing prices have been increasing for nearly 10 years. Many of the middle-
to low-income families are not able to afford a decent home, driving down their sense of
happiness. The second part of this article will first introduce the housing finance system
for individuals, and then discuss the evidence and reasons for the rapid increasing
housing price. Next, an evaluation of the housing affordability will be conducted by
calculating housing price-to-income ratios in 31 provinces. Finally, the article will
analyze the harms done by the high housing price.
3.1 Housing Finance Market for Individuals
3.1.1 Housing Provident Fund System
Based on Singapore's experience, housing provident fund system was set up by
Shanghai provincial government in May 1991. With the good results in Shanghai, the
Page 19
19
State Council announced the nationwide implementation of the housing provident fund
(HPF) system in China on November 23, 1994. In 1997, President Jiang Zemin
emphasized on improving the housing provident fund system during the 15th People's
Congress, making the HPF the core of policy housing finance system. Since then, the
housing provident fund was regarded as the main policy tool to enhance housing
affordability for Chinese citizens (Liu & Wang, 1999).
HPF refers to the long-term housing savings scheme deposited by the state
organs, state-owned enterprises, foreign-invested enterprises, collectively owned
enterprises, private enterprises, and other township and village enterprises, institutions
and the in-service workers. The scheme is mandatory, and all the corporates and
individuals must save into the HPF account in order to fulfill the law obligation. The
payment of HPF is on a monthly basis. The amount each worker should deposit into the
HPF account is calculated as the individual housing provident fund deposit ratio times
his or her previous year's average monthly wage. The amount each institution should
deposit into the worker's HPF account is calculated as the housing provident fund
deposit ratio of the institution times the worker's average monthly wage of last year.
Page 20
20
According to the law, both ratios should not be lower than 5 per cent (Lu, Li, & Mi,
2013). Thus, the HPF account is contributed by both the employers and the employees,
and all the money in the account belongs to the worker. Employees contributing to the
fund are eligible in provident mortgage loans applications. If the workers leave the
office or retire, the fund will be fully returned to the workers (Burell, 2006).
The housing provident fund system was set up to increase the portion of
property consumption embedded in the worker's wages in order to improve the
purchasing power when people buy the properties. However, the system has several
problems.
First, the HPF coverage is relatively low. According to Lu, Li, & Mi (2013),
about 70 per cent of the in-service workers and employees participate in the scheme all
over China in 2008. First-tier cities have better coverage rate than second- and third-tier
cities. For example, the HPF coverage rate in Beijing was nearly 100 per cent in 2010,
while in some undeveloped areas the rate was lower than 50 per cent. The reason is that
the law does not force self-employed workers and freelancers to deposit into the HPF
when they were included in the scheme in 2005. Many private and foreign enterprises
Page 21
21
also avoid contributing to the HPF, and some enterprises are unable to make regular
payments due to their financial weakness (Burell, 2006). HPF is also irrelevant to the
people who are unemployed or marginally employed, and they are actually the people
who need financial assistant the most.
Second, the value of the housing provident fund is hard to preserve. If one
chooses not to use the fund to apply for HPF loan or rant a property, the only other way
of using the money is to invest in treasury bonds. Either keep the money in the account
or buy government bonds, the real return of the fund is very low when considering the
inflation in China.
Third, HPF is not effectively used. In the end of 2011, only 65 per cent of the
fund is used to be part of the HPF loans (Lu, Li, & Mi, 2013). In other words, huge
amount of money were not used in proper ways by the citizens. Since the funds are not
allowed to pay for the down payment of the housing, people who cannot afford the
down payment will not be able to apply for mortgage loans and use the money in the
HPF account. As the funds stand idle, people do not benefit from the HPF scheme.
3.1.2 Commercial bank mortgage loan
Page 22
22
Another way Chinese citizens can use to finance their home purchase is
through commercial bank mortgage loan. Mortgage is the most popular type of housing
finance around the world. In China, it also plays the most significant role as more than
90% of mortgage loan is used for home purchasing (Gu, 2005).
The framework of mortgage lending for housing finance was set up in May
1998. The People's Bank of China issued the Regulations for Managing Individual
Housing Mortgage Loans (ge ren zhu fang dai kuan guan li ban fa) to all the Chinese
banks. The document stated the requirements about the eligibility of borrowers, down
payments, mortgage interest rates, loan terms, mortgage insurance, and application
procedures (Tang, Liu, & Wong, 2006).
3.2 Evidence of the Rapidly Increasing Price of the Residential Housing
In the case of China, the affordability issue is highly concerned by the officials
in central government, who tries to stabilize the macroeconomic environment. Although
the average disposable income among Chinese citizens has been increasing due to the
rapid economic growth in the past 37 years, people also witnessed a continuous rise in
housing price. The recent data extracted from China Statistical Yearbook 2014 showed
Page 23
23
the residential housing price in 2013 was 5850 yuan per square meter, which was 7 per
cent more than that of 2012. In big cities like Shanghai, the price increased more sharply.
The average residential housing price in Shanghai was already at a very high level of
13870 yuan per square meter in 2012, ranking number two in China right after Beijing.
In 2013, the average price further increased by 16.7 per cent, to 16192 yuan per square
meter. At national level, the price of residential properties increased by almost 200 per
cent from 1998 to 2012, as shown in Table 5. Among these 15 years, four was recorded
with annual growth rates of more than 10 per cent each. In 2009, the increase in housing
price was as high as 24.7 per cent. In summary, the residential housing experienced a
long period of high-speed price increase.
3.3 Reasons for the Skyrocket up of the Housing Price
There are several reasons caused the dramatic increase in residential housing
price.
First, rapid urbanization and fast expansion of urban population formed strong
demand over the residential housing market. Due to the former strategy in Mao
Zedong's era, the country experienced a rapid population growth. According to the
Page 24
24
census conducted in 1953, China has a total population of 582 million. However, in the
most recent census conducted in 2010, the total population in China was nearly 1.4
billion. In terms of urban areas, the population has increased very sharply. According to
the data of the World Bank, in 1980, there were only 191.4 million people, or 19 per
cent of the total population lived in the urban areas in China. By 2000, it had increased
to 459.1 million, or 36.22% of the total population. In 2013, more than half of the
Mainland Chinese lived in the cities.
Due to the rapid economic growth and the relaxation in hukou system in the
1990s, a considerable amount of people entered the cities as migrant workers. Those
workers were officially categorized as agricultural residents in the hukou system, but
work in urban areas for a living. In 2012, there were more than 262 million migrant
workers all over China. The number was 9 million more than the previous year's record.
Migrant workers serve in factories or service industries. Since they come from rural
areas, they need places to settle down near their work places. A report published by
McKinsey & Company in 2008 forecasted that more than 900 million people would be
living in urban areas in year 2025, occupying 66 per cent of total population. There
Page 25
25
would also be 23 cities, and each of them has a population of more than 5 million.
Among them, 8 cities would be called megacities with more than 10 million populations.
They also forecast that the total population in Chinese urban areas would achieve 1
billion in 2030.1 The huge increase in urban population unavoidably brought equally or
even stronger demand for residential housing, which in turn drives the housing price
higher.
Second, Chinese citizens regard real estate as a major way of investment. In
China, the deposit rate is rather low. However, the cost of living has been increasing
overtime. Many people need to do some investment to keep the value of the money they
earned. Among many channels of investment, like the stock and bond market, the real
estate market is a very attractive one. Housing, unlike stock or bond, is a fixed asset. It
is also different from common goods, which will most likely depreciate from the
moment they were bought by the consumers. By investing in the real estate market, one
can rent the property out, or sell it when the price becomes higher. Thus, the risk of the
investment is nearly zero as long as the housing bubble does not burst. People who have
surplus of funds looking for a proper investment opportunity are willing to put their
1中國城市人口 2030 年將超 10 億. (n.d.). Retrieved from http://www.china.com.cn/aboutchina/zhuanti/zgrk/2008-04/18/content_14975434.htm
Page 26
26
money in the projects with higher return but lower risk. The real estate market seems to
be an appropriate choice for them since the price has been increasing sharply over the
years and it does not seem to be highly risky considering a strong government doing the
backup. Because the growing in housing price is considerably strong, people expect it to
keep increasing in the future. As a result, more and more people invest their money into
the real estate market. Another group of people who do not have a surplus of fund also
try to buy properties. In most of the cases, they buy the home not for themselves but for
their children. They afraid a higher property price would cause higher unaffordability
issues in the future. The excessive investment demand together with rigid needs finally
makes the housing price higher, which in turn stimulates both of the demand to be
increased again.
Third, local governments depend on the property market to generate tax
income in order to help local finance. In 1994, China conducted the tax reform. Before
the reform, there were complaints about local government keeping too much of the tax
revenue while the central government keeping too little. At that time, local governments
were required to remit a fixed amount of money to the central government for several
Page 27
27
years. Because of the rapid economic growth and high inflation rate, the central
government's share of tax revenue would certainly decrease overtime. The 1994 tax
reform aimed to enlarge the portion that central government could share in the tax
system. Value-added tax was created to replace some multiple-rated turnover taxes,
which was considered inefficient. A new tax-sharing system was adopted by the policy
makers, making clear the tax revenue sharing between central and local government.
The central government was able to get as much as 75 per cent of the value-added tax
and all consumption tax, with some transfers and rebates back to local government. In
other words, the local governments could no longer keep large amount of tax revenues
as before. However, the expenditure side of the local government was not changed
much. Local governments were responsible for about the same level of social welfare
provision, infrastructure construction, educational investment, and so on. Thus, there
was a mismatch in local expenditure and income. Under this circumstance, local
governments could either reduce their expenditures or find new ways to finance their
fiscal budgets to avoid issuing huge amount of local government debt.
Page 28
28
It turns out that the local governments rely on their real estate markets very
much. From 2000 to 2009, the nationwide land transfer income recorded a 49 per cent
increase, soaring from 29.258 billion to 1.594 trillion. The ratio of land income to total
income of the local governments increased from less than 10 per cent to 49 percent (An
2011). The heavy burdens bore by local governments creates incentives to the local
officials to develop real estate market. With the governments' backup, property
developers tried to deliberately make the housing price higher. In some cases, real estate
companies spread information containing the huge demand and the shortage of supply
in the market, which was in fact not true. At the same time, they held the housing
resources and sell them slowly. Take Hangzhou for instance, there were 3500 acres of
land provided by the local government for housing constructions in 2003. The amount
was considered to be enough at that time. However, lots of lands were left unused.
Some buildings were not on sale even after the construction has finished already.
Housing developers acted as monopolies to control the supply of housing at a low level.
Then they spread the information to distort the market. After successfully fooled the
Page 29
29
consumers, they began to sell the properties slowly and step by step at higher price.2
The aftermath of this kind of action was naturally an unusual increase in property price.
3.4 Housing Price-to-Income Ratio Analysis
Among many research methods, the most commonly used one is the housing
price-to-income ratio (PIR). According to United Nations Human Settlements
Programme (UN-HABITAT), the housing price-to-income ratio is "the ratio of median
free-market price of a dwelling unit and the median annual household income".3 In
other words, a higher PIR indicates higher housing price relative to the household's
income and lower affordability of housing in a chosen region within a certain period of
time. Under the standard of UN-HABITAT, a ratio of 3 to 5 is considered reasonable. In
detail, the measurement of housing affordability is divided into four categories: If PIR is
under 3, the housing is rated as "Affordable"; if PIR is between 3.1 to 4.0, the housing is
then "Moderately Unaffordable"; if the PIR is between 4.1 to 5.0, the housing is
considered as "Seriously Unaffordable"; and if PIR is equal or larger than 5.1, the
housing is "Severely Unaffordable".
2 Price level catch up Paris, heated Hangzhou housing market. (2003, November 22). People Daily [Beijing].
3 Urban indicators. (n.d.). Retrieved from http://ww2.unhabitat.org/programmes/guo/guo_guide.asp#ind3
Page 30
30
Although the housing price-to-income ratio seems to be both easy to
understand and calculate, some difficulties exist when applying it to the case of China.
First, the measurement of housing price is different between China and western
countries. Foreign countries set the price of housing to each individual unit according to
its condition, location, and many other terms. The record of housing transactions is
relatively easy to be collected by the government. In China, the housing price is defined
as the product of the price per square meter and the total floor area of the property.
Second, the definition of the PIR is using median number of both housing price
and family income. In China, the National Bureau of Statistics only publishes the
average number of the two items in each of the China Statistical Yearbook. Thus,
applying PIR to China is not applicable simply because of the lack of appropriate data.
Chinese scholars always use the average value as the alternative way to
calculate PIR in order to accommodate the situations in China. Base on the research
conducted by Zhang (2011), the using of average number is actually quite acceptable.
As stated in his article, in terms of housing price, the median number is about 72 per
cent of the average, while the median number of household's disposable income is about
Page 31
31
75 per cent of the average. Because the two ratios are close to each other, calculating
PIR using average number should also be close to the PIR calculated by median
number.
As mentioned above, the international definition of PIR is the ratio of the
median price of each unit sold in a particular area to the median annual household
disposable income. In China, due to the limitation of data, average numbers are used
instead of median number. Thus, PIR in China is calculated as the ratio of average price
per unit of housing and the average annual household disposable income, within a
particular region. In practice, the first number can be obtained by using average housing
price per square meter multiply by average floor space sold; the second number can be
obtained by using per capita disposable income multiply by average number of people
per household. The average floor space sold is not listed as an item in the China
Statistical Yearbook. However, it can be calculated by using total floor space sold
divided by total units sold. The number of average people per household is standardized
to 2.87.4
4 Wang, W. (2013). Wo men jiu jing que bu que zhu fang. Retrieved from
http://paper.people.com.cn/rmwz/html/2013-08/01/content_1295181.htm
Page 32
32
The following paragraph will analyze the affordability in Chinese housing
market among 31 provinces in 2012. The data are obtained from China Statistical
Yearbook 2013 and China Real Estate Statistics Yearbook 2013. Table 6-1 to 6-3
concludes the PIRs in different provinces in 2012. The minimum and maximum value
of the housing price-to-income ratio are 5.8 and 15.9, respectively. It is noticeable that
even the minimum value of PIR goes beyond the normal or satisfactory range of PIR
according to UN-HABITAT, indicating a severely unaffordable housing price all over
China. The maximum value is observed in Beijing, whose housing price is about 16
times of the average annual household disposable income. Besides Beijing, another 4
provinces and municipalities have PIRs greater than 10. Zhejiang ranks the second place
as the most unaffordable housing in China with a PIR of 12.7. Hainan, Shanghai, and
Fujian follow Zhejiang, ranking number 3 to number 5 most unaffordable housing in
China. These five provinces are where the highest housing prices can be found all
around China. They are also categorized into the coastal areas of China, making the
eastern China records an average 10.5 housing price-to-income ratio.5 Thus, citizens
5 The eastern coastal area of China contains Beijing, Tianjin, Hebei, Shanghai, Jiangsu, Zhejiang, Fujian, Shandong, Guangdong and Hainan.
Page 33
33
living in coastal China are facing extremely unaffordable housings nowadays. By
looking into the price-to-income ratio for Central China, the average value of PIR in
2012 is 7.6.6 It is still a very large number, but much lower than that of the eastern part
of China. Among the six provinces in central China, the difference in PIR is small
compare to the 10 provinces in the coastal region. That means the housing market in
central China has a relatively balanced development. The western part of China is less
developed, and the PIR in western China is relatively low with 7.2 on average.7
Surprisingly, the lowest average housing price-to-income ratio is observed in the
northeast China.8 The PIR in Heilongjiang, Jilin and Liaoning are 6.3, 5.9 and 6.4,
respectively, all below 7. According to the calculation, residential housings in China are
highly unaffordable. By separating the 31 provinces into 4 parts, it can be conclude that
the housing market in China developed unevenly. The coastal areas are more developed
than inland areas, making the affordability issue more severe.
Internationally, the housing price-to-income ratio is the most frequently used
index when analyzing the housing affordability issues. However, one should notice that
6 The central China contains Shanxi, Anhui, Jiangxi, Henan, Hubei and Hunan. 7 The western China contains Inner Mongolia, Guangxi, Chongqing, Sichuan, Guizhou, Yunnan, Tibet, Shaanxi, Gansu, Qinghai, Ningxia and Xinjiang. 8 The northeast China contains Heilongjiang, Jilin and Liaoning.
Page 34
34
using PIR as a benchmark to measure the housing affordability in China has some
limitations.
First, each province is large in size and developed unevenly. The housing price
within a certain province may vary in a wide range, so as the household disposable
income. The housing price-to-income ratio may not be at the same level of accuracy
when applying to different provinces.
Second, Chinese citizens have explicit and implicit income. Both incomes were
used to do the consumption and investment, including purchasing real estate properties.
The statistics only include the explicit incomes since the implicit ones are not easy to
calculate. However, implicit income should not be ignored due to its large size.
According to Wang (2013), Chinese residents' implicit incomes in 2011 were 6.2 trillion
yuan, accounting for 12% of GDP. In addition, high- and middle-to-high-income
households held most of the implicit incomes. Thus, the price-to-income ratio may not
be so accurate in the sense that the disposable income is only a part of household's
actual income, and the affordability issue may not be as severe as indicated by PIR.
Page 35
35
Third, parents in China will usually finance their children for purchasing a
property. Due to the one child policy, Chinese parents tend to pay all their attention to
their only child. When a newly married couple buying a new home, it is not only the
couple themselves paying for the house. Both the bride's and the bridegroom's parents
will also partially pay for the house. In fact, the property is purchased by three families,
instead of one. As a result, using one household's disposable income may not be
appropriate in some cases, and the housing affordability issue is overstated.
In summary, the housing price-to-income ratio is a way to evaluate the housing
affordability in China. However, one should notice that the PIR couldn’t fully reflect the
real capacity of the Chinese families to pay for their urban properties due to its
limitations. The housing affordability issue may not be as severe as the PIR indicates.
Despite of the limitations observed in data and the PIR model, the very high PIR gives
no doubt about a highly unaffordable residential housing in China, especially in some
big cities such as Beijing and Shanghai.
3.5 Harms Caused by High Housing Price
Page 36
36
Housing is a life necessity since everyone needs a place to live. The price of
housing is highly relevant to the wellbeing of the people and the economic development.
As mentioned above, high housing price in China causes affordability issues, which in
turn downgrades the citizens' standard of living and. Besides, the Chinese economy is
also negatively influenced by the highly unaffordable housing prices in several aspects.
For citizens, a small change in housing price always means a big change in
their sense of happiness. Since properties are already highly unaffordable, people need
to save for several years in order to pay for the down payment. After the purchasing of
the house, the mortgage payment will become the major burden of a typical family in
the following 10 to 30 years. High housing price contributes a lot to a high cost of living
for the citizens. The more people spend on their properties, the less they consume on
other goods and services. In other words, people's ability to consume will be lower as
the housing price goes up. As people reduce their expenditures on other goods and
services, their wellbeing will also be decreased. Besides consumption, young people
may tend to invest less in their education, reducing opportunities for personal
development. What's more, due to the high property price in central city, many people
Page 37
37
choose to locate their homes in suburbs, where the housing prices are relatively lower.
The decisions add extra pressures to the city's transportation net, which in turn causes
environmental problems, resulting in crowded roads and poor air quality. All of the
above reduce people's standard of living and their sense of happiness.
For the economy, high housing price causes more problems. Since people
consume less on other goods and services besides housing, the overall domestic demand
drops. The reduction in demand negatively affects the secondary and tertiary industries,
which are the major contributors to the Chinese economy nowadays. As young people
pay less attention to their education, the accumulation of human capital will also be
slower. In the long run, low human capital will result in poorer quality of the economic
development. High housing price also distorts the investors' behaviors. In recent years,
many real estate speculators groups deliberately drove the housing price up in several
big cities. Their behaviors created huge housing bubbles and weakened the risk
tolerance ability of the society. People who need a place to live will not be able to afford
the housing in those cities, bringing unstable factors to the society. In some other cities,
the housing development companies over produce residential housings because of the
Page 38
38
rapid increasing price. However, the demand for residential housing is mismatched with
the supply, and the result of the excess supply of housing is high vacancy rate. In recent
years, ghost city becomes a phenomenon. Those cities are always well built with high
quality residential and office buildings. Each of the ghost cities has a very promising
original plan, however, none of them turns out to be successful. In daytime, no human
activities can be seen in the cities. At night, it becomes completely dark with no
artificial light. Therefore, they are called "ghost cities".9 In addition to the high vacancy
rate, the high housing price also increases the cost to corporates. Companies do
profit-making business. The higher cost in production will eventually transfer to the
consumers. The rapid increase in price may bring inflation pressure to the economy,
which shrinks people's wealth. In conclusion, unreasonably high housing price makes
the economy unhealthy and dangerous.
9 2014 中國鬼城你知多少. (n.d.). Retrieved from http://mall.fang.com/mall/201403/zgxgcpd.html
Page 39
39
4. Major Findings and Conclusion
The Chinese housing market has experience dramatic changes since the
foundation of the New China. Before 1978, housing was considered a social welfare,
which is constructed and distributed by the work unit. The housing market did not exist,
and the government bore heavy burden on the financing of urban housing. After the
market-orientated economic reform, the housing market also started the reform. The
Chinese government adopted the gradualism methodology when conducting the reform,
and the real estate market slowly privatized. New laws as well as taxations were
implemented step by step. After Deng's Southern Tour Speech in 1992, the Chinese
housing market overheated, and cooled down in 1997. After the first two stages of
development, the real estate market back to a steady growing trend. With the total
abandonment of welfare housing system in 1998, the Chinese housing market fully
commercialized. Residential housing dominated the construction of fix assets, and
Chinese people saw a big jump in terms of the standard of living. However, the
development in the real estate market brought many problems. The major concern for
the Chinese people and policy makers is the housing affordability issue.
Page 40
40
Housing price has been increasing for the last 15 years. Nationally, the price
tripled from 1998 to 2012. There are several contributors to the rapid increasing price.
Urbanization and the relaxation in hukou system brought strong demand for residential
housing. Chinese citizens also keen on real estate investment, driving the demand even
higher. The local governments rely on the housing market to finance their expenditures
since the 1994 tax reform. Irregular behaviors of the housing speculation groups also
force the housing price to go up in many cities. By conducting the housing
price-to-income analysis, it can be conclude that the residential housing in China is
highly unaffordable under international standards. In first-tier cities like Beijing and
Shanghai, the unaffordability is more severe. Housing as an important part of the
economy, highly related to people's stand of living. Heavy burden caused by high
housing price will squeeze people's consumption on other goods and services, lower
domestic demand. It may also affect the citizen's individual development, and influence
the human capital accumulation. Therefore, the abnormal high housing price in China
will finally cause negative effects to the Chinese economy in the long run.
Page 41
41
5. Appendix
5.1 Figures
Data Source: www.ldfcj.com
Data Source: www.ldfcj.com
0
50
100
150
200
250
300
350
1986 1987 1988 1989 1990 1991 1992 1993 1994 1995 1996 1997
Bil
lio
n Y
ua
n
Figure 1. Total Investment Value Completed in Real Estate Development
-50.0%
0.0%
50.0%
100.0%
150.0%
200.0%
1987 1988 1989 1990 1991 1992 1993 1994 1995 1996 1997
Figure 2. Growth Rate of Total Fixed Asset Investment and Total Investment Completed in Real Estate Development
Total fixed asset investment
Total Investment Completed in Real Estate Development
Page 42
42
Data Source: China Real Estate Statistics Yearbook 1999-2013
0
20000
40000
60000
80000
100000
120000
1998 1999 2000 2001 2002 2003 2004 2005 2006 2007 2008 2009 2010 2011 2012
10
00
0 s
q.m
Figure 3. Total and Residential Floor Space Completed
Total Floor Space Completed Floor Space Completed for Residential Purpose
Page 43
43
5.2 Tables
Table 1.
Year
Total fixed
asset
investment
(billion
yuan)
Total investment
value completed
in real estate
development
(billion yuan)
Percentage change
in total fixed asset
investment
(%)
Percentage change in
total investment value
completed in real
estate development
(%)
1986 301.96 10.1 - -
1987 364.09 15 20.6 48.5%
1988 449.65 25.7 23.5 71.3%
1989 473.77 27.2 5.4 5.8%
1990 444.93 25.3 -6.1 -7.0%
1991 550.88 33.6 23.8 32.8%
1992 785.5 73.1 42.6 117.6%
1993 1245.79 193.8 58.6 165.1%
1994 1704.29 255.4 36.8 31.8%
1995 2001.93 314.9 17.5 23.3%
1996 2297.4 321.6 14.8 2.1%
1997 2494.11 317.8 8.6 -1.2%
Data Source: www.ldfcj.com
Page 44
44
Table 2.
Year Number of real estate development company
1986 1991
1987 2506
1988 3536
1989 3985
1990 4400
1991 5128
1992 13566
1993 26027
1994 31486
1995 33482
1996 21269
Data Source: Liu & Wang, 1999.
Page 45
45
Table 3.
Year
Total floor space completed
(10,000 square meters)
Residential floor space
completed
(10,000 square meters)
Proportion
(%)
1998 17566.6 14125.7 80.4
1999 21410.8 17640.7 82.4
2000 25104.9 20603.3 82.1
2001 29867.4 24625.4 82.4
2002 34975.8 28524.7 81.6
2003 41464.1 33774.6 81.5
2004 42464.9 34677.2 81.7
2005 53417 43682.9 81.8
2006 55830.9 45471.8 81.4
2007 60606.7 49831.3 82.2
2008 66544.8 54334.1 81.7
2009 72677.4 59628.7 82.0
2010 78743.9 63443.1 80.6
2011 92619.9 74319.1 80.2
2012 99425 79043.2 79.5%
Data Source: China Real Estate Statistics Yearbook 1999-2013
Page 46
46
Table 4.
Year
Commercial
housing sold
(10000 square
meters)
Residential
housing sold
(10000 square
meters)
Percentage change
in commercial
housing sales
(%)
Percentage change
in residential
housing sales
(%)
1998 12185.33 10827.08 - -
1999 14556.53 12997.87 19.5% 20.0%
2000 18637.13 16570.28 28.0% 27.5%
2001 22411.9 19938.75 20.3% 20.3%
2002 26808.29 23702.31 19.6% 18.9%
2003 33717.63 29778.85 25.8% 25.6%
2004 38231.64 33819.89 13.4% 13.6%
Data Source: China Real Estate Statistics Yearbook 1999-2005
Page 47
47
Table 5.
Year
National average residential housing
price (yuan per square meter)
Percentage change
(%)
1998 1854 -
1999 1857 0.2
2000 1948 4.9
2001 2017 3.5
2002 2092 3.7
2003 2197 5.0
2004 2608 18.7
2005 2937 12.6
2006 3119 6.2
2007 3645 16.9
2008 3576 -1.9
2009 4459 24.7
2010 4725 6.0
2011 4993 5.7
2012 5430 8.8
Data Source: China Real Estate Statistics Yearbook 1999-2013
Page 48
48
Table 6-1
Province
Average housing price
per square meter (yuan
per square meter)
Total floor space sold
(residential) (square meter) Units sold
Beijing 16553 14833746 147153
Tianjin 8010 15114032 153686
Hebei 4142 46224637 444959
Shanxi 3691 13904422 122431
Inner Mongolia 3656 21042187 198073
Liaoning 4717 76553988 840520
Jilin 3875 21594307 245525
Heilongjiang 3726 32262165 373563
Shanghai 13870 15926284 164759
Jiangsu 6432 79233670 705029
Zhejiang 10680 33162270 282224
Anhui 4495 42754287 418989
Fujian 8366 27419567 249314
Jiangxi 4381 21258981 189254
Shandong 4557 77458724 714514
Henan 3511 54555010 489310
Hubei 4668 36200951 340340
Hunan 3670 46640816 400490
Guangdong 7668 71576276 644541
Guangxi 3910 25469557 235237
Hainan 7811 8983484 97242
Chongqing 4805 41051083 438391
Sichuan 4959 56793338 573537
Guizhou 3695 20023965 190506
Yunnan 3861 27896760 239631
Tibet 2982 206486 1830
Shaanxi 4803 25308411 245420
Gansu 3376 8933551 88808
Page 49
49
Qinghai 3692 2468539 22913
Ningxia 3621 7075675 66329
Xinjiang 3594 12747965 121906
Data Source: China Statistical Yearbook 2013 and China Real Estate Statistics Yearbook
2013.
Table 6-2
Province
Average floor space sold
(square meter)
Average housing price
(yuan per unit)
Beijing 100.8 1668623.8
Tianjin 98.3 787732.1
Hebei 103.9 430292.3
Shanxi 113.6 419184.9
Inner Mongolia 106.2 388393.3
Liaoning 91.1 429621.1
Jilin 88.0 340812.3
Heilongjiang 86.4 321790.0
Shanghai 96.7 1340731.4
Jiangsu 112.4 722851.1
Zhejiang 117.5 1254936.0
Anhui 102.0 458676.8
Fujian 110.0 920093.1
Jiangxi 112.3 492119.6
Shandong 108.4 494013.3
Henan 111.5 391454.6
Hubei 106.4 496521.2
Hunan 116.5 427405.9
Guangdong 111.0 851531.4
Guangxi 108.3 423343.1
Page 50
50
Hainan 92.4 721601.7
Chongqing 93.6 449941.8
Sichuan 99.0 491054.9
Guizhou 105.1 388379.1
Yunnan 116.4 449480.2
Tibet 112.8 336470.6
Shaanxi 103.1 495299.1
Gansu 100.6 339605.3
Qinghai 107.7 397758.7
Ningxia 106.7 386271.8
Xinjiang 104.6 375832.1
Data Source: China Statistical Yearbook 2013 and China Real Estate Statistics Yearbook
2013.
Table 6-3
Province
Per capita disposable
income (yuan)
Annual household disposable
income (yuan) PIR
Beijing 36468.8 104665.3 15.9
Tianjin 29626.4 85027.8 9.3
Hebei 20543.4 58959.7 7.3
Shanxi 20411.7 58581.6 7.2
Inner Mongolia 23150.3 66441.2 5.8
Liaoning 23222.7 66649.1 6.4
Jilin 20208.0 57997.1 5.9
Heilongjiang 17759.8 50970.5 6.3
Shanghai 40188.3 115340.5 11.6
Jiangsu 29677.0 85172.9 8.5
Zhejiang 34550.3 99159.4 12.7
Anhui 21024.2 60339.5 7.6
Page 51
51
Fujian 28055.2 80518.5 11.4
Jiangxi 19860.4 56999.2 8.6
Shandong 25755.2 73917.4 6.7
Henan 20442.6 58670.3 6.7
Hubei 20839.6 59809.6 8.3
Hunan 21318.8 61184.8 7.0
Guangdong 30226.7 86750.7 9.8
Guangxi 21242.8 60966.8 6.9
Hainan 20917.7 60033.8 12.0
Chongqing 22968.1 65918.6 6.8
Sichuan 20307.0 58281.1 8.4
Guizhou 18700.5 53670.5 7.2
Yunnan 21074.5 60483.8 7.4
Tibet 18028.3 51741.3 6.5
Shaanxi 20733.9 59506.2 8.3
Gansu 17156.9 49240.3 6.9
Qinghai 17566.3 50415.2 7.9
Ningxia 19831.4 56916.1 6.8
Xinjiang 17920.7 51432.4 7.3
Data Source: China Statistical Yearbook 2013 and China Real Estate Statistics Yearbook
2013.
Page 52
52
6. References
Burrell, M. (2006). China's housing provident fund: its success and limitations. Housing
Finance International, 20(3), 38-49. Retrieved from
http://search.proquest.com/docview/216195740?accountid=11440
Chai, Q. (2008, September 26). Wo guo fang di chan zhi du gai ge yu shi chang fa zhan
de li cheng. Retrieved from
http://theory.people.com.cn/GB/49154/49155/8108609.html
Gu, G. W. (2005). The empirical study of the price mechanism in the Chinese housing
market. Retrieved from
https://kobra.bibliothek.uni-kassel.de/handle/urn:nbn:de:hebis:34-2884
Liu, Z., & Wang, Y. (1999). Zhongguo fang di chan shi chang. Wuhan: Hubei ren min
chu ban she.
Lu, J., Li, Y., & Mi, Y. (2013). Study on the development situation and strategy of
China's housing accumulation fund system. Journal of Graduate School of
Chinese Academy of Social Sciences, 1(193).
Man, Y. J. (2011). Housing policy and housing markets: trends, patterns, and
affordability. In China's housing reform and outcomes (pp. 3-18). Cambridge,
MA: Lincoln Institute of Land Policy.
National Bureau of Statistics of China. (2011, June 13). Dong xi zhong bu he dong bei
di qu hua fen fang fa. Retrieved from
http://www.stats.gov.cn/ztjc/zthd/sjtjr/dejtjkfr/tjkp/201106/t20110613_71947.ht
m
Price level catch up Paris, heated Hangzhou housing market. (2003, November 22).
People Daily [Beijing].
Page 53
53
Tang, B., Liu, S., & Wong, S. (2006). Housing Mortgage and Housing Transaction in
China: Bridging the Missing Links.
Urban indicators. (n.d.). Retrieved from
http://ww2.unhabitat.org/programmes/guo/guo_guide.asp#ind3
Urban population (% of total). (n.d.). Retrieved from
http://data.worldbank.org/indicator/SP.URB.TOTL.IN.ZS?page=6
Wang, W. (2013). Wo men jiu jing que bu que zhu fang. Retrieved from
http://paper.people.com.cn/rmwz/html/2013-08/01/content_1295181.htm
Wang, X. (2013, September 28). Implicit income accounts for about 12% of GDP and is
still expanding. Retrieved from
http://finance.sina.com.cn/zl/china/20130928/005816875784.shtml
Wo guo fang di chan zhou qi fen xi yu yu ce. (n.d.). Retrieved from
http://www.ldfcj.com/rock_news_view.asp?ArticleID=17852
Zhang, Q. (2011). The origin, calculation and application of housing price to income
ratio: an analysis based on literature. Finance & Trade Economics, 12(2011).
中國城市人口 2030 年將超 10 億. (n.d.). Retrieved from
http://www.china.com.cn/aboutchina/zhuanti/zgrk/2008-04/18/content_1497543
4.htm
2014 中國鬼城你知多少. (n.d.). Retrieved from
http://mall.fang.com/mall/201403/zgxgcpd.html
安體富,竇欣,. 論土地財政與房地產市場調控[J]. 地方財政研究,2011,(2).
陳春霞,. 論我國高房價的危害、成因及對策[J]. 特區經濟,2012,(1).
Page 54
54
傅東平,. 高房價及其對中國經濟的影響研究[J]. 特區經濟,2010,(8).
黃萬成,. 個人住房貸款政策對房地產市場的影響研究[J]. 價值工程,2014,(21).
李超,匡耀求,. 人口集聚過程中的我國房價收入比[J]. 學術研究,2013,(2).
李智,. 我國住房公積金制度發展概況、存在的問題及改革建議[J]. 經濟視角(上旬
刊),2014,(3).
錢楓林,鄧予蘭,. 我國商業銀行個人住房貸款風險的分析及防範[J]. 科學經濟社
會,2011,(1).
夏剛,. 房價收入比來源、用途及局限性[J]. 經濟研究導刊,2009,(27).
張運峰,劉曉星,黃鶯,. 美國房價收入比的經濟解釋及對我國的啓示[J]. 南京財經大
學學報,2011,(5).