Remote Electronic Alcohol Monitoring 2004 Report January 2004 Minnesota Department of Corrections 1450 Energy Park Drive, Suite 200 St. Paul, Minnesota, 55108-5219 (651) 642-0200 TTY (651) 643-3589 This information will be made available in alternative format upon request. Printed on recycled paper with at least 10 percent post-consumer waste. The total cost of salaries, printing, and supplies incurred in the development and preparation of this report is $1,809 (report required by M.S. 3.197).
Transcript
Remote Electronic Alcohol Monitoring
2004 Report
January 2004
Minnesota Department of Corrections 1450 Energy Park Drive, Suite 200
St. Paul, Minnesota, 55108-5219 (651) 642-0200
TTY (651) 643-3589
This information will be made available in alternative format upon request. Printed on recycled paper with at least 10 percent post-consumer waste.
The total cost of salaries, printing, and supplies incurred in the development
and preparation of this report is $1,809 (report required by M.S. 3.197).
Figures Pre-Sentence Participants Figure 1 Offenders’ Race............................................................................................................. 6 Figure 2 Whether Offender is Hispanic........................................................................................ 6 Figure 3 Marital Status................................................................................................................. 7 Figure 4 Monthly Gross Income................................................................................................... 7 Figure 5 Gender........................................................................................................................... 8 Figure 6 Number of Dependents ................................................................................................. 8 Figure 7 Employment Status at REAM Enrollment...................................................................... 9 Figure 8 Employment Status at REAM Discharge....................................................................... 9 Figure 9 Offense Level .............................................................................................................. 10 Figure 10 DUI Level................................................................................................................... 10 Figure 11a Number of Prior Alcohol-Related Driving Offenses 2002 ........................................ 11 Figure 11b Number of Prior Alcohol-Related Driving Offenses 2003 ........................................ 11 Figure 12 Whether Offender Received a Public Defender ........................................................ 12 Figure 13 Type of REAM Payment ............................................................................................ 12 Figure 14 Whether Offender had Violations While on Monitoring.............................................. 13 Figure 15 Types of Violations While on Monitoring ................................................................... 14 Figure 16 Types of Arrests While on Monitoring........................................................................ 14 Figure 17 County Response to Violations & Arrests.................................................................. 15 Figure 18 Type of Discharge ..................................................................................................... 16 Figure 19 Length of REAM Enrollment ...................................................................................... 17 Post-Sentence Participants Figure 20 Offenders’ Race......................................................................................................... 18 Figure 21 Whether Offender is Hispanic.................................................................................... 18 Figure 22 Marital Status............................................................................................................. 19 Figure 23 Monthly Gross Income............................................................................................... 19 Figure 24 Gender....................................................................................................................... 20 Figure 25 Number of Dependents ............................................................................................. 20 Figure 26 Employment Status at REAM Enrollment.................................................................. 21 Figure 27 Employment Status at REAM Discharge................................................................... 21 Figure 28 Offense Level ............................................................................................................ 22 Figure 29 DUI Level................................................................................................................... 22 Figure 30a Number of Prior Alcohol-Related Driving Offenses 2002 ........................................ 23 Figure 30b Number of Prior Alcohol-Related Driving Offenses 2003 ........................................ 23 Figure 31 Whether Offender Received a Public Defender ........................................................ 24 Figure 32 Type of REAM Payment ............................................................................................ 24 Figure 33 Number of Months of Probation Ordered ................................................................ 25 Figure 34 Whether Offender Participated in an Intensive Probation Program for DUI Offenders............................................................................................................ 25 Figure 35 Whether Offender had Violations While on Monitoring.............................................. 26 Figure 36 Types of Violations While on Monitoring ................................................................... 27 Figure 37 Types of Arrests While on Monitoring........................................................................ 27 Figure 38 County Response to Violations & Arrests.................................................................. 28 Figure 39 Type of Discharge ..................................................................................................... 29 Figure 40 Length of REAM Enrollment ...................................................................................... 30
2004 REAM Report Research & Evaluation Unit 1
Executive Summary This report fulfills the legislative mandate requiring the Department of Corrections (DOC) to submit a report on the effectiveness of REAM (Remote Electronic Alcohol Monitoring) programming (M.S. 169A.73, subd. 4). This report answers two primary questions: Who participates in REAM programming, and what happens when a person on REAM commits a program violation or is arrested?
This report is organized into two sections. The first section reports the information on those offenders who are assigned to REAM prior to sentencing. The second section is based on offenders who are assigned to REAM after their sentencing. It is important to note that this report includes all participants in REAM programming, not just offenders who receive cost subsidies from counties. Pre-Sentence REAM Participants ♦ The majority of pre-sentence REAM participants are white non-Hispanic males with an average monthly
gross income of $1,896. On average, pre-sentence participants were enrolled in REAM for 48 days. ♦ One goal of REAM is to keep people out of jails and able to maintain their employment. More than two-
thirds (68%) of participants were employed either full or part-time at REAM enrollment. And an almost equal percentage (64%) was employed at discharge.
♦ Most (92%) 2003 pre-sentence participants were arrested for a gross misdemeanor offense; 29 percent
were arrested for 1st degree Driving Under the Influence (DUI), while 39 percent were arrested for 2nd degree DUI. The arrest rate for 1st degree DUI has shifted from the 2002 report in which 42 percent of the pre-sentence participants were arrested for a 1st degree DUI.
♦ Prior alcohol-related driving offenses for pre-sentence REAM participants were captured and it was found
that, similar to 2002, forty-three percent of 2003 participants had one or two prior DUI offenses (degree unknown). Nine percent had at least three prior DUI offenses (degree unknown). Less than one in ten REAM participants in 2003 had at least one prior 1st degree DUI offense (4%), 2nd degree DUI offense (5%), or 3rd degree DUI offense (7%).
♦ REAM legislation stipulates that funds be available to help indigent offenders pay for the cost of the
monitoring. Because the legislation does not define indigent, many counties assume that if an offender receives a public defender, he or she is eligible for a subsidy. As in 2002, more than one-third (36%) of pre-sentence participants received a public defender. Of those that received a public defender, 48 percent received a partial subsidy to cover their REAM costs and 24 percent received a full subsidy. Slightly over half (51%) of all 2003 pre-sentence participants fully paid their REAM cost themselves. Less than two in ten (15%) had their cost fully subsidized by the county.
♦ In studying REAM, it is important to determine participants’ level of program violations and arrests. Slightly
less than two in ten (19%) 2003 pre-sentence participants committed some type of program violation or were arrested while on monitoring. This resulted in a total of 970 violations or arrests. Forty-four percent of the total violations were alcohol-related and 35 percent were for electronic monitoring violations (alcohol-related includes having alcohol on breath during a check, and electronic monitoring violations include things such as missing a test, an incomplete test, or not paying costs). In addition, very few offenders were arrested for a new DUI offense while participating in the program.
♦ A major tenet of REAM programs is that program response to violations and arrests is swift and certain. All
of the 2003 violations or arrests received some type of official county response. Almost four in ten (39%) resulted in a warrant request to the court. Other responses include verbal warnings (17%), referrals to court or prosecution (15%), and apprehension and detention holds (10%). On average, the county response
2004 REAM Report Research & Evaluation Unit 2
occurred within four days of the violation, with almost half (46%) of the responses occurring on the same day as the actual violation.
♦ Overall, three-quarters (75%) of 2003 pre-sentence REAM participants successfully completed their REAM
program. Less than one in ten (6%) were removed because they posted bail in lieu of monitoring or because they had alcohol-related program violations (7%).
Post-Sentence REAM Participants ♦ The highest percentages of post-sentence REAM participants are white non-Hispanic males. Forty-four
percent are single and slightly more than one-quarter (27%) do not have any monthly income. In addition, 44 percent earn less than $2,000 a month while almost one-quarter (24%) earn more than $2,000 monthly. On average, post-sentence REAM participants have two dependents (including themselves) and earn $1,724 a month. Participants spent an average of 47 days enrolled in REAM.
♦ Sixty-three percent of 2003 post-sentence REAM participants were employed full or part-time at REAM
enrollment and maintained that employment through discharge. The unemployment rate remained constant at enrollment (21%) and at discharge (19%).
♦ Almost nine in ten (89%) participants were arrested for a gross misdemeanor. More than one-quarter
(27%) were arrested for a 1st degree DUI, while almost four in ten (38%) were arrested for a 2nd degree DUI. Information on post-sentence participants’ prior alcohol-related driving offenses was also collected. More than three in ten (31%) had one or two prior DUIs (degree unknown) while almost two in ten (17%) had one or two prior 3rd degree DUIs. Less than one in ten had one prior 1st (7%) or 2nd degree DUI (8%).
♦ As in 2002, almost half (49%) of 2003 participants received a public defender. Of those that received a
public defender, 60 percent received a partial subsidy from the county to pay their REAM costs while 15 percent received a full subsidy. Overall, almost half (49%) of all 2003 post-sentence REAM participants fully paid their REAM costs while more than one-third (38%) received partial payment and 13 percent received a full subsidy from the county. There seems to be shift since 2002 in moving away from full-county payments toward participants paying all or some of their REAM fees.
♦ Most post-sentence REAM participants participated in the REAM program in conjunction with probation.
Approximately four in ten (41%) post-sentence REAM participants received between 24 and 36 months of probation, while two in ten (19%) received 48 months. While 14 percent received no probation at all, 19 percent received 60 months or more. Slightly more than two in ten (22%) participants were involved in an intensive probation program for DUI offenders while they were enrolled in REAM. There is no difference between the rate of violations or arrests while on REAM for offenders who participated in an intensive probation program when compared to those who did not participate.
♦ Overall, slightly more than one in ten (14%) post-sentence participants had a violation or arrest while
enrolled in REAM. This resulted in 331 violations, more than a quarter (26%) of which were alcohol-related. Sixty-three percent of the violations were for electronic monitoring infractions (missing a test, incomplete test, etc.). Very few of the violations or arrests were for any type of alcohol-related driving offense; two percent of violations or arrests were for a new 1st degree DUI and an additional two percent were for a new 2nd degree DUI. One percent each of violations or arrests were for a DUI (degree unknown) or for another type of alcohol-related driving offense.
♦ Approximately one-third (37%) of the 331 violations/arrests resulted in verbal warning, while 18 percent
resulted in increased probation supervision. More than one in ten (14%) violations or arrests resulted in a warrant request to the court while 10 percent warranted an apprehension and detention hold. Fourteen percent of the violations resulted in no response at all. On average, the program response came four days after the violation or arrest occurred. However, almost half (48%) of the program responses came on the same day as the violation or arrest.
2004 REAM Report Research & Evaluation Unit 3
♦ Overall, 94 percent of the 2003 post-sentence participants successfully completed their REAM
programming. This percentage is similar to the 92 percent success rate in 2002.
2004 REAM Report Research & Evaluation Unit 4
Introduction What is REAM? REAM programs pair traditional electronic monitoring with a breath analyzer unit similar to those used by law enforcement personnel. This allows monitoring of both the identity and location of offenders, as well as, their alcohol concentration level. Offenders are phoned randomly during the time they are required to be home. The offender then responds to the call using the in-home equipment to verify his or her identity. Once the offender’s identity has been verified, the offender performs a breath test over the phone using the analyzer equipment. If the breath analysis test indicates the offender’s alcohol concentration is .03 or higher, a second test is completed. If a violation is determined, the electronic monitoring company will report the violation to the probation officer for follow-up. Legislative History of REAM Judge James Dehn of the Tenth Judicial District pioneered the use of REAM in Minnesota. In 1995, the Minnesota legislature set aside $250,000 in grants to be awarded for a three-year pilot project to judicial districts interested in establishing REAM programs. The pilot programs were to ensure swift consequences for violating the court order to remain abstinent and, unless they were indigent, the offenders were to pay the per diem cost of monitoring. If the offender was indigent, the DOC was required to reimburse the district for monitoring costs incurred. The project received $235,000 a year during the three-year pilot (1996,1997, and 1998). An evaluation of the pilot project was completed in 1998, and the legislature appropriated $765,000 in base funding for REAM. This base funding was awarded on a competitive basis to counties and judicial districts. In FY02, 21 counties were funded by the REAM grant. Currently, 39 counties are being funded at a total cost of $607,224. Prior Evaluation & Current Research Methods This is the third evaluation of the REAM program. A 1998 evaluation was completed after the three-year pilot project and an additional evaluation was completed in 2002. After the pilot project evaluation, the DOC determined that ethical considerations prohibited the construction of a control group to compare to REAM participants. Some offenders (especially indigent offenders) would spend more time in jail if they were assigned to the control group. Instead, the DOC developed five research questions based on other intended goals of REAM programming:
♦ Do persons arrested for or convicted of a DWI maintain (or obtain) gainful employment while on REAM?
♦ How effective is REAM in preventing drinking and driving behavior and other criminal behavior while on REAM monitoring?
♦ Are sanctions for REAM violations swift and certain? ♦ What percentage of the offenders who successfully complete a REAM program are re-arrested for an
alcohol-related driving offense? ♦ Can the availability of grant funds increase the use of REAM among indigent offenders?
The 1998 program evaluation found that 945 offenders had been assigned to one of the REAM pilot projects either as pre-sentence or post-sentence participants. The majority of these offenders were white males with an average age of 35 years. The study also found that 85 percent of the pre-sentence offenders completed REAM successfully while 95 percent of the post-sentence offenders successfully completed the program. The pilot also found that offenders retained the same level of employment at the beginning and end of the program. In addition, the program found that only nine offenders were re-arrested for any type of driving-related crime. Of these, eight of these offenses did not include alcohol. Finally, the report found that sanctions for program violations were swift and certain and the program provided a much-needed alternative to jail for indigent offenders.
2004 REAM Report Research & Evaluation Unit 5
While the 1998 report was able to answer the five questions listed above, the data collection process was difficult for both the counties and the DOC, the data was often unusable or not necessary to answer the research questions, and the method for sending the data to the DOC was outdated. When legislation was introduced requiring submission of a report on REAM in 2002, the DOC decided to implement changes in how the data was collected and the type of data collected. The first step in producing the outcome evaluation was to meet with REAM providers and county staff to develop better data collection methods. It was determined that a web-based reporting tool was needed that accomplished the following:
♦ Standardized data definitions and responses ♦ Ability to delete and edit records in the database ♦ Easy way to download individual county and aggregate data for research purposes ♦ Eliminate the need to send data to the DOC each quarter
Variables for the web-based data collection were determined with REAM providers and county staff based on the questions on page four. The website went into effect July 1, 2001, and the data from the website was used to complete the 2002 evaluation report, as well as this current report. It is important to note that this evaluation is based on those offenders whose data has been entered into the new web-based reporting site and who completed their REAM participation by December 2003. Currently, there are 3011 pre-sentence program completers and 1471 post-sentence program completers. Please note that this report is cumulative, in that it includes everyone who was discharged from REAM during or before December 2003, including those participants on which the 2002 report is based. This report is organized into two main sections: pre-sentence completers and post-sentence completers and contains both the current 2003 data and the 2002 data from the last report. The overall data for the groups is followed by a conclusion discussing whether the REAM program is successful in helping offenders maintain employment, keeps offenders on monitoring from committing further crimes, provides swift and certain sanctions for program violators, and allows indigent offenders access to the program. A Note about Recidivism It was hoped that recidivism information, including a comparison to a group of DUI offenders who did not receive REAM, would be included in this report. Unfortunately, there is no reliable way to identify DUI offenders who did not receive REAM to use as a comparison group. In addition, it was not possible to determine the recidivism rates for offenders participating in REAM because the Bureau of Criminal Apprehension (BCA), which maintains that information, relies on a unique identifier, which is not available in the REAM database. The DOC’s Research & Evaluation and Information & Technology units will work together to incorporate the BCA’s unique identifier into the REAM database.
2004 REAM Report
Overall Summary of Findings
FIGURE 1 Offenders' Race
78%
9% 7%
1%
80%
9%6%
White Black American Indian/Alaskan Native
AsiaPacific Is
0%
20%
40%
60%
80%
100%
2002 (N = 594) 2003
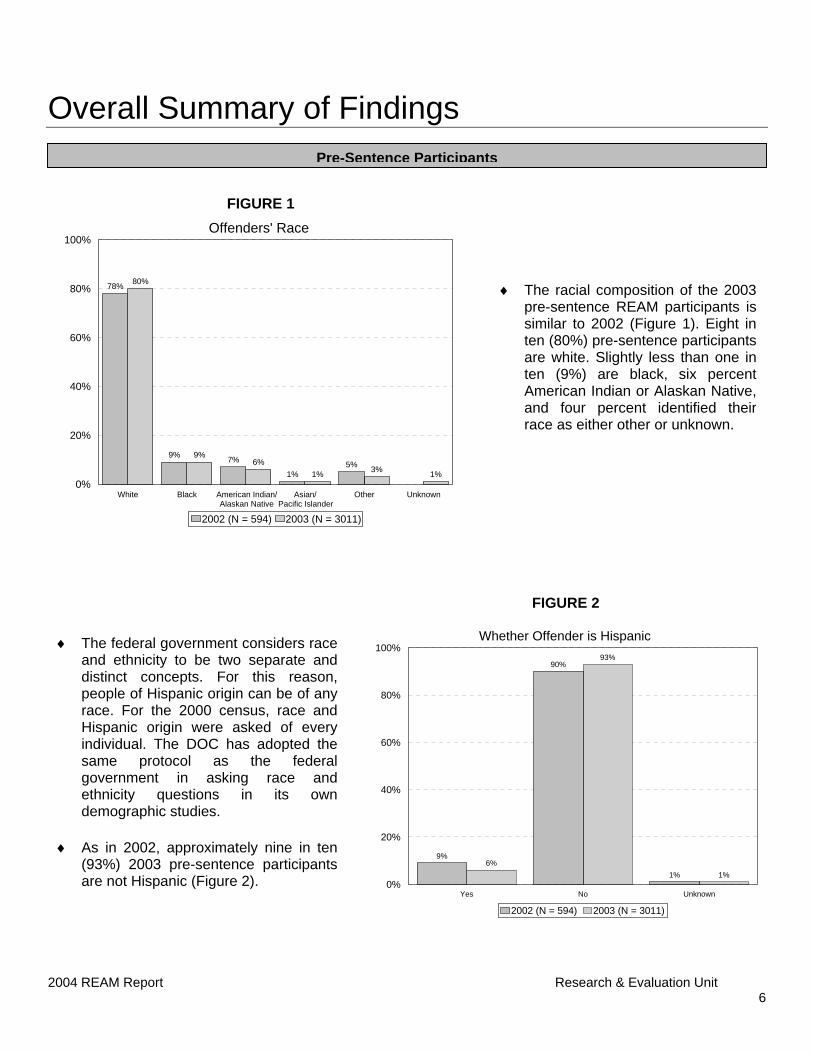
♦ The federal government considers and ethnicity to be two separate distinct concepts. For this reapeople of Hispanic origin can be ofrace. For the 2000 census, race Hispanic origin were asked of eindividual. The DOC has adoptedsame protocol as the fedgovernment in asking race ethnicity questions in its demographic studies.
♦ As in 2002, approximately nine in
(93%) 2003 pre-sentence participare not Hispanic (Figure 2).
Pre-Sentence Participants
Research & Evaluation Unit 6
5%1% 3% 1%
n/lander
Other Unknown
(N = 3011)
♦ The racial composition of the 2003pre-sentence REAM participants issimilar to 2002 (Figure 1). Eight inten (80%) pre-sentence participantsare white. Slightly less than one inten (9%) are black, six percentAmerican Indian or Alaskan Native,and four percent identified theirrace as either other or unknown.
FIGURE 2
raceandson, anyandvery theeralandown
tenants
Whether Offender is Hispanic
9%
90%
1%6%
93%
1%
Yes No Unknown0%
20%
40%
60%
80%
100%
2002 (N = 594) 2003 (N = 3011)
2004 REAM Report Research & Evaluation Unit 7
FIGURE 3
Offenders' Marital Status
11%
2%
9%
19%
1%
57%
1%
14%
3%
14%
35%
1%
33%
0%
Married Co-habitating Separated/Divorced
Single Widowed Unknown Other 0%
10%
20%
30%
40%
50%
60%
70%
2002 (N = 594) 2003 (N = 3011)
♦ Figure 3 shows that in 2003, themarital status of one-third (33%) ofthe REAM participants is unknown.More than three in ten (35%)participants are single while anequal percentage are eitherdivorced (14%) or married (14%).
FIGURE 4
Offenders' Monthly Gross Income*
*If offender is married, spouse's income is included in total
18%
8%
36%
27%
7%
4%
25%
14%
32%
22%
6%
1%
No income Less than $1000
$1,000 to $1,999
$2,000 to $3,999
$4,000 to $5,999
$6,000 or more
0%
10%
20%
30%
40%
2002 (N = 594) 2003 (N = 3011)
♦ In 2003, one-quarter (25%) of pre-sentence REAM participants do nothave a monthly income (Figure 4).Almost half (46%) earn less than$2,000 a month, while almost three inten (29%) earn $2,000 or more eachmonth.
♦ The average monthly income for pre-
sentence participants in 2003 is$1,896.29.
2004 REAM Report Research & Evaluation Unit 8
FIGURE 6
FIGURE 5
♦ The gender of the 2003 pre-sentence REAM participantsremains unchanged from 2002.
♦ Eight in ten (80%) are male
while two in ten (20%) arefemale (Figure 5).
♦ Figure 6 shows the number ofdependents for pre-sentenceREAM participants. Little changeis noted between the two years.
Slightly less than six in ten (58%)
Pre-sentence participants in 2003
Gender
♦have no dependents other thanthemselves.
♦have an average of twodependents.
80%
20%
80%
20%
Male Female 0%
20%
40%
60%
80%
100%
2002 (N = 594) 2003 (N = 3011)
Number of Dependents*
*Includes the offender
61%
18%
11%
6%3%
1%
58%
18%
12%
7%3% 2%
One Dependent
Two Dependents
Three Dependents
Four Dependents
Five Dependents
Six or more Dependents
0%
10%
20%
30%
40%
50%
60%
70%
2002 (N = 594) 2003 (N = 3011)
2004 REAM Report Research & Evaluation Unit 9
FIGURE 8
FIGURE 7
♦ One of the goals of REAM is to allowpeople arrested for DUI to retain theiremployment. To understand if thisgoal is being met, employment statusat the beginning and end of anoffender’s REAM participation mustbe captured.
♦ Figure 7 shows that about two-thirds
(68%) of 2003 participants wereemployed either full or part-time atthe beginning of their REAMparticipation. This is slightly less thanin 2002.
Employment Status at REAM Enrollment
64%
9%
19%
1% 0%2% 1% 1%
3%
57%
11%
22%
2% 1% 2% 1% 2% 2%
Full-time Employment
Part-time Employment
Unemployed Student Homemaker Disabled Retired Other Unknown/Missing
0%
10%
20%
30%
40%
50%
60%
70%
2002 (N = 594) 2003 (N = 3011)
Employment Status at REAM Discharge
63%
9%
20%
1% 0% 1% 1% 0%
5%
55%
9%
22%
2% 1% 2% 1% 1%
7%
Full-time Employment
Part-time Employment
Unemployed Student Homemaker Disabled Retired Other Unknown/Missing
0%
10%
20%
30%
40%
50%
60%
70%
2002 (N = 594) 2003 (N = 3011)
♦ Figure 8 shows that there is little
Sixty-four percent of the 2003
difference between the two years inemployment status at REAMdischarge.
♦participants were employed eitherfull or part-time at discharge.
2004 REAM Report Research & Evaluation Unit 10
FIGURE 10
FIGURE 9
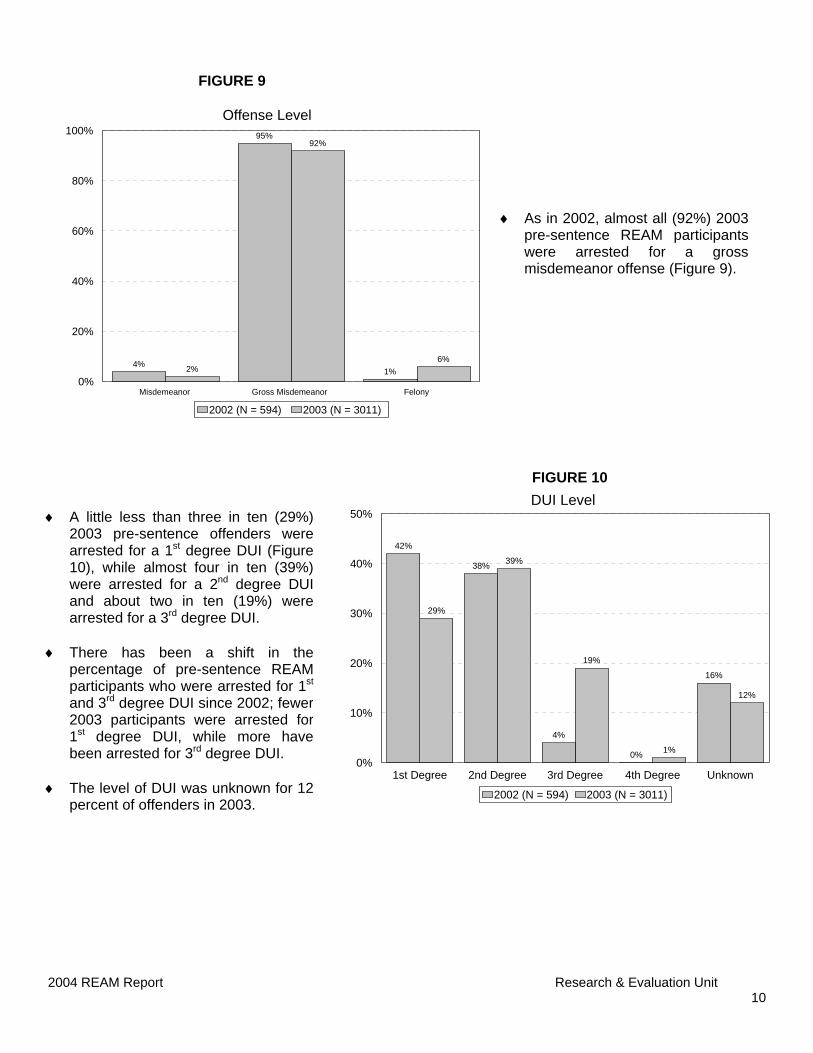
♦ As in 2002, almost all (92%) 2003pre-sentence REAM participantswere arrested for a grossmisdemeanor offense (Figure 9).
♦ A little less than three in ten (29%)
There has been a shift in the
2003 pre-sentence offenders werearrested for a 1st degree DUI (Figure10), while almost four in ten (39%)were arrested for a 2nd degree DUIand about two in ten (19%) werearrested for a 3rd degree DUI.
♦percentage of pre-sentence REAMparticipants who were arrested for 1st
and 3rd degree DUI since 2002; fewer2003 participants were arrested for1st degree DUI, while more havebeen arrested for 3rd degree DUI.
Number of Prior Alcohol Related Driving Offenses 2002(N = 594)
98% 96%91%
39%
96% 96% 96% 99%
2% 3%7%
23%
3% 3% 3% 1%1% 2%
23%
1% 1% 1%
10%2%3%
DUI1st Degree
DUI2nd Degree
DUI3rd Degree
DUI DegreeUnknown
CarelessDriving
Underage Drinking& Driving
Open Bottle Other 0%
20%
40%
60%
80%
100%
No prior offenses One prior offense Two prior offensesThree prior offenses Four prior offenses More than four prior offenses
FIGURE 11b
Number of Prior Alcohol Related Driving Offenses 2003(N = 3011)
95% 94% 92%
42%
97% 96% 97% 99%
4% 5% 7%
24%
3% 3% 2% 1%1% 1% 1%
19%
1% 1%
9%
3%3%
DUI1st Degree
DUI2nd Degree
DUI3rd Degree
DUI DegreeUnknown
CarelessDriving
Underage Drinking& Driving
Open Bottle Other 0%
20%
40%
60%
80%
100%
No prior offenses One prior offense Two prior offensesThree prior offenses Four prior offenses More than four prior offenses
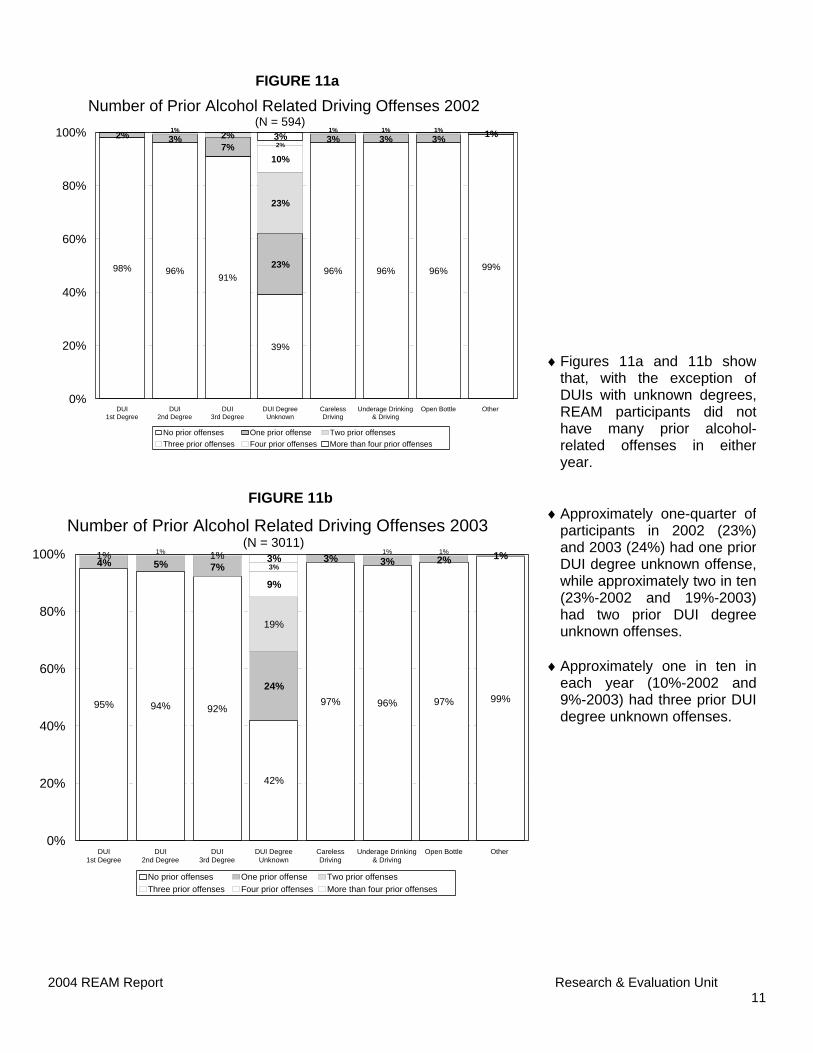
Figures 11a and 11b showthat, with the exception ofDUIs with unknown degrees,REAM participants did nothave many prior alcohol-related offenses in eitheryear.
Approximately one-quarter ofparticipants in 2002 (23%)and 2003 (24%) had one priorDUI degree unknown offense,while approximately two in ten(23%-2002 and 19%-2003)had two prior DUI degreeunknown offenses.
Approximately one in ten ineach year (10%-2002 and9%-2003) had three prior DUIdegree unknown offenses.
Research & Evaluation Unit 11
2004 REAM Report Research & Evaluation Unit 12
FIGURE 12
♦ One of the goals of REAM is to ensureindigent offenders have a chance toparticipate in jail alternatives, live in thecommunity, and maintain employment.Because the legislation that funds theREAM grant does not define indigency,each county developed indigencycriteria to determine who is eligible forthe grant. For many counties, if anoffender is eligible for a public defenderhe or she is also eligible for the REAMgrant.
♦ Figure 12 shows little change between
the two years in the percentage ofoffenders receiving a public defender;more than one-third of 2002 (37%) and2003 (36%) participants received apublic defender.
Whether Offender Received A Public Defender
37%
48%
15%
36%
50%
14%
Yes No Unknown0%
10%
20%
30%
40%
50%
60%
2002 (N = 594) 2003 (N = 3011)
FIGURE 13
Type of REAM Payment
53%
29%
18%
51%
34%
15%
Full PaymentOffender
Partial Payment Full PaymentCounty
0%
10%
20%
30%
40%
50%
60%
2002 (N = 594) 2003 (N = 3011)
♦ As shown in Figure 13, over half(51%) of 2003 participants fully paidfor their REAM participation. Moreone-third (34%) of 2003 REAM pre-sentence participants partially paidfor their REAM participation, while 15percent of REAM participants’ costswere fully paid by the county.
♦ There has been a slight increase
between 2002 and 2003 of thepercentage of participants who arepartially paying for REAM.
2004 REAM Report Research & Evaluation Unit 13
FIGURE 14
Whether Offender Had Violations While On Monitoring
15%
85%
19%
81%
Yes No0%
20%
40%
60%
80%
100%
2002 (N = 594) 2003 (N = 3011)
♦ Similar to 2002, the majority (81%) of 2003 pre-sentence REAM participants did not have any violations (either program violations or new arrests) while participating in the REAM program (Figure 14).
2004 REAM Report Research & Evaluation Unit 14
FIGURE 15
Types of Violations While on Monitoring*
*There were 569 offenders with violations while on REAM. These offenders had a total of 970 violations; therefore, percents do not equal 100. This question was also asked only of those offenders who had violations.
50%
4%
48%
0%5% 5% 4%
44%
3%
35%
0%
9%6%
23%
AlcoholRelated
DrugRelated
ElectronicMonitoring
TreatmentViolation
Failure toReport
Abscond Other0%
20%
40%
60%
80%
100%
2002 (N = 153) 2003 (N = 970)
♦ Figure 15 shows that of the 9702003 participants who had a violationor arrest while on monitoring, slightlymore than four in ten (44%) had analcohol-related violation (positive foralcohol when calling in) while aboutone-third (35%) had some type ofelectronic monitoring violation (i.e.,incomplete test, missed phone call,failure to pay monitoring costs, etc.).
FIGURE 16 Types of Arrests While on Monitoring*
*Offenders could have more than one arrest. Therefore, percents do not equal 100 and are based on the number of arrests, not the number of offenders. This question was also asked only of those offenders with arrests.
♦ As in 2002, very few 2003 participantswho had a violation or arrest while onREAM were arrested for a new offenseduring their participation (Figure 16).Three percent of these participantswere arrested for a 1st degree DUI, twopercent for a 2nd degree, one percentfor a 3rd degree and one percent for alevel-unknown DUI during their REAMparticipation.
2004 REAM Report Research & Evaluation Unit 15
FIGURE 17
County Response to Violations & Arrests
*Counties could impose more than one response for offender violations or arrests. Therefore, percents do not equal 100 and are based on the number of violations and arrests, not the number of offenders.
13%
39%
1% 1%6%
24%18%
14%
2%
10%
39%
1% 0%4%
15% 17%11%
0%
Apprehension&Detention
Hold
WarrantRequestto Court
IncreasedUA/BATesting
Referredto
Treatment
WarrantlessArrest ofReleaseViolation
Referral to Court or
Prosecution
VerbalWarning
OtherResponse
No Response0%
20%
40%
60%
80%
100%
2002 (N = 153) 2003 (N = 970)
♦ Often, counties do not know the final outcome of a REAM participant’s program violation or arrest because their involvement ends with a warrant request or a referral to court. The court’s outcome is often not communicated to the county. Because of this, only the REAM program’s response to the violation or arrest is reported here. Figure 17 shows a warrant request was submitted to the court for 39 percent of participants who had some type of violation or arrest during their participation. Almost two in ten (17%) received a verbal warning in response to their violation or arrest. One in ten or more participants who had a violation or arrest receive a referral to court or prosecution (15%) or an apprehension and detention hold (10%).
♦ Eleven percent of participants received some other response to their violation or arrest. These other
responses include maximum bail imposed, terminated from monitoring, violation information sent to prosecutor, and having the violation information forwarded to the probation officer.
♦ One of the goals of REAM is to ensure that participants receive swift and certain responses to program
violations and arrests that occur while on monitoring. As indicated in Figure 17, all 2003 participants with a violation received some type of county response to their violation or arrest. In addition, there was an average of four days between the actual violation or arrest occurring and the subsequent program response. This is a decrease in one day from 2002. In 46 percent of the cases, the program response occurred on the same day as the violation and 34 percent of the 2003 violations received a program response within one to two days after it occurred.
2004 REAM Report Research & Evaluation Unit 16
FIGURE 18
Type of Discharge
77%
6% 1% 1%
8%3% 4%
75%
7% 1% 2%
6% 4% 5%
Successful Completion
Removed for
Alcohol-Related Program Violation
Removed/Arrested for
NewOffense
Moved toPost Trial
Participation
PostedBail in Lieu of
Monitoring
Removed for Non-Alcohol
Program Violation Other
Discharge Reason
0%
20%
40%
60%
80%
100%
2002 (N = 594) 2003 (N = 3011)
♦ There is little change in the type of discharge participants received from the REAM program in 2002 and 2003 (Figure 18). Three-quarters (75%) of 2003 pre-sentence REAM participants successfully completed the REAM program while six percent did not complete the program because they posted bail in lieu of monitoring. Less than one in ten (7%) were removed for an alcohol-related violation while only one percent was removed for a new offense.
♦ Five percent of the participants received some other type of discharge not listed in the web-based data
collection instrument. These other discharges included termination due to enrollment in in-patient treatment programs, marginally successful (balance still owing), equipment did not work on participant’s phone line, and case dismissed.
*Some offenders' enrollment and discharge dates were inaccurate; therefore, length of enrollment could not be determined. These offenders are excluded from this data.
♦ Figure 19 shows that the number of days 2003 participants spent on pre-sentence REAM monitoring is very similar to the number of days 2002 participants remained on REAM. Three-quarters (75%) of participants spent between 60 days or less on REAM, while one-quarter (25%) spent more than 60 days on pre-trial REAM.
♦ The average number of days on REAM for 2003 pre-sentence participants is 48. This is an increase
from the 2002 average of 40 days. The highest number of days reported on pre-sentence REAM in 2003 is 1104. This, too, is an increase from the 2002 highest number of 515.
2004 REAM Report Research & Evaluation Unit 18
♦
Post-Sentence Participants FIGURE 20
Offenders' Race
89%
1%
9%
1% 0% 0%
87%
2%
10%
1% 0% 0%
White Black American Indian/Alaskan Native
Asian/Pacific Islander
Other Unknown0%
20%
40%
60%
80%
100%
2002 (N = 273) 2003 (N = 1471)
♦ The racial composition of thepost-sentence REAM participantshas remained the same between2002 an 2003; almost nine in ten(87%) 2003 post-sentence REAMparticipants are white (Figure 20).One in ten (10%) are AmericanIndian or Native Alaskan while farfewer are black (2%) orAsian/Pacific Islander (1%).
FIGURE 21 ♦ The federal government considers
race and Hispanic ethnicity to betwo separate and distinct concepts.For this reason, people of Hispanicorigin can be of any race. For the2000 census, race and Hispanicorigin were asked of everyindividual. The DOC has adoptedthe same protocol as the federalgovernment in asking race andethnicity questions in its owndemographic studies.
♦ Figure 21 shows that as in 2002,
almost all of the 2003 participants(95%) are not Hispanic.
Whether Offender is Hispanic
3%
96%
1%4%
95%
1%
Yes No Unknown0%
20%
40%
60%
80%
100%
2002 (N = 273) 2003 (N = 1471)
2004 REAM Report Research & Evaluation Unit 19
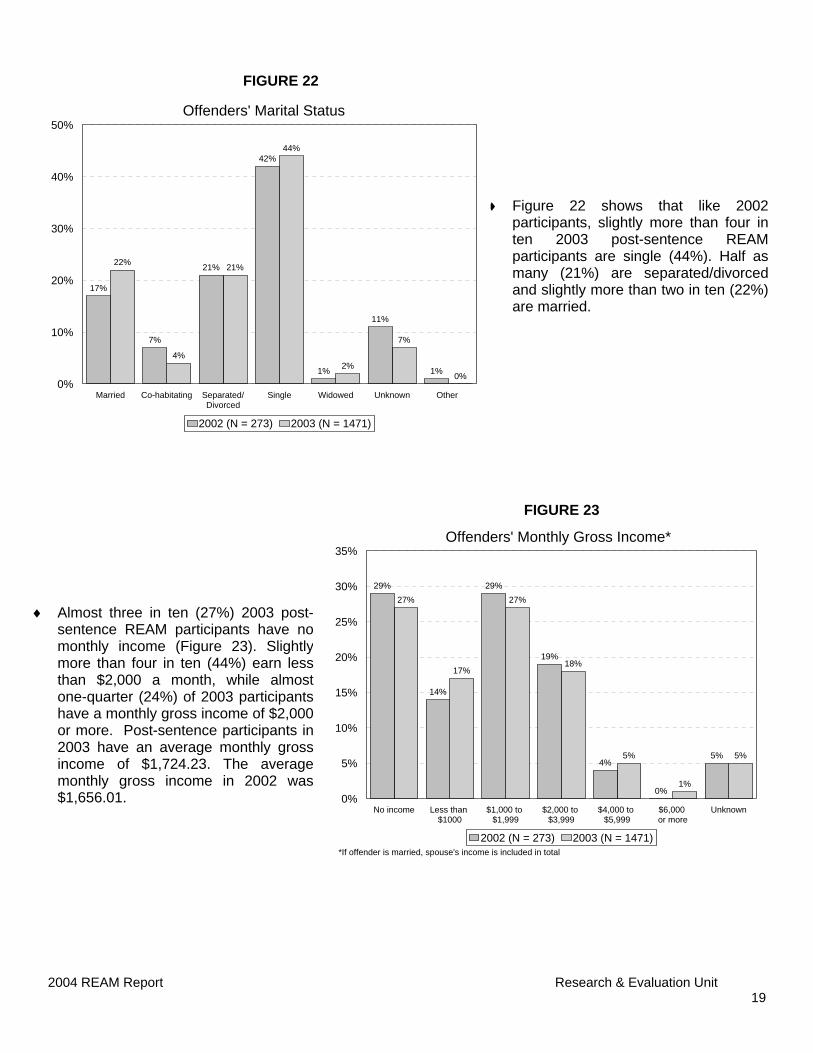
FIGURE 22
♦ Figure 22 shows that like 2002participants, slightly more than four inten 2003 post-sentence REAMparticipants are single (44%). Half asmany (21%) are separated/divorcedand slightly more than two in ten (22%)are married.
Offenders' Marital Status
17%
7%
21%
42%
1%
11%
1%
22%
4%
21%
44%
2%
7%
0%
Married Co-habitating Separated/Divorced
Single Widowed Unknown Other 0%
10%
20%
30%
40%
50%
2002 (N = 273) 2003 (N = 1471)
FIGURE 23
Offenders' Monthly Gross Income*
*If offender is married, spouse's income is included in total
29%
14%
29%
19%
4%
0%
5%
27%
17%
27%
18%
5%
1%
5%
No income Less than $1000
$1,000 to $1,999
$2,000 to $3,999
$4,000 to $5,999
$6,000 or more
Unknown0%
5%
10%
15%
20%
25%
30%
35%
2002 (N = 273) 2003 (N = 1471)
♦ Almost three in ten (27%) 2003 post-sentence REAM participants have nomonthly income (Figure 23). Slightlymore than four in ten (44%) earn lessthan $2,000 a month, while almostone-quarter (24%) of 2003 participantshave a monthly gross income of $2,000or more. Post-sentence participants in2003 have an average monthly grossincome of $1,724.23. The averagemonthly gross income in 2002 was$1,656.01.
2004 REAM Report Research & Evaluation Unit 20
FIGURE 25
FIGURE 24
Gender
75%
25%
75%
25%
Male Female 0%
20%
40%
60%
80%
100%
2002 (N = 273) 2003 (N = 1471)
♦ There is no change in the gendercomposition of the post-sentenceREAM participants in 2002 an2003; three-quarters (75%) of2003 post-sentence REAMparticipants are male while one-quarter (25%) are female (Figure24).
*Includes the offender
60%
17%
9% 9%
3% 2%
58%
19%
10% 9%
2% 2%
One Dependent
Two Dependents
Three Dependents
Four Dependents
Five Dependents
Six or more Dependents
0%
10%
20%
30%
40%
50%
60%
70%
2002 (N = 273) 2003 (N = 1471)
Number of Dependents*
♦ Almost six in ten (58%) 2003 post-
2003 post-sentence participants
sentence REAM participants haveno dependents other thanthemselves (Figure 25).
♦have an average of twodependents.
2004 REAM Report Research & Evaluation Unit 21
FIGURE 26
Employment Status at REAM Enrollment
51%
11%
18%
2%0%
3%1% 2%
12%
53%
10%
21%
1% 0%3%
1% 1%
10%
Full-time Employment
Part-time Employment
Unemployed Student Homemaker Disabled Retired Other Unknown/Missing
0%
10%
20%
30%
40%
50%
60%
2002 (N = 273) 2003 (N = 1471)
♦ Figure 26 shows that similar toparticipants in 2002, 63 percent of2003 post-sentence REAMparticipants were employed full orpart-time at REAM enrollment.
♦ Approximately two in ten (21%)
participants were unemployed atenrollment.
FIGURE 27
Employment Status at REAM Discharge
51%
11%
17%
2%0%
3%1% 1%
14%
53%
9%
19%
1% 0%3%
1% 1%
13%
Full-time Employment
Part-time Employment
Unemployed Student Homemaker Disabled Retired Other Unknown/Missing
0%
10%
20%
30%
40%
50%
60%
2002 (N = 273) 2003 (N = 1471)
♦ Figure 27 shows that the employmentrate for 2003 participants at dischargewas very similar to employment ratesat REAM enrollment; 62 percent of2003 participants were employed eitherfull or part-time at discharge, while 19percent were unemployed.
2004 REAM Report Research & Evaluation Unit 22
FIGURE 28
♦ As in 2002, almost nine in ten(89%) 2003 post-sentence REAMparticipants were placed on REAMfor a gross misdemeanor offense(Figure 28).
♦ There has been a shift in the level ofDUI offense for which post-sentenceparticipants were placed on REAM(Figure 29). This shift is mostly likelydue the decrease in unknown DUIlevels (43%-2002 to 22%-2003).Almost four in 10 (38%) 2003 post-sentence participants were placed onREAM for a 2nd degree DUI, whilemore than one-quarter (27%) wereplaced on REAM for a 1st degree DUIoffense.
♦ The percentage of post-degree
REAM participants with 3rd degreeDUI offenses increased from sixpercent in 2002 to 12 percent in2003.
2004 REAM Report Research & Evaluation Unit 23
FIGURE 30a Number of Prior Alcohol-Related Driving Offenses 2002
(N = 273)
92%87%
81%
51%
96% 95% 94% 98%
7%8%
14%
20%
4% 4% 5%2%1%
3% 4%
9%
1% 1%1%
11%
1%
4%
1%
5%
DUI1st Degree
DUI2nd Degree
DUI3rd Degree
DUI DegreeUnknown
CarelessDriving
Underage Drinking& Driving
Open Bottle Other 0%
20%
40%
60%
80%
100%
No prior offenses One prior offense Two prior offensesThree prior offenses Four prior offenses More than four prior offenses
FIGURE 30b
Number of Prior Alcohol Related Driving Offenses 2003(N = 1471)
92% 88%83%
51%
96% 95% 95% 98%
7%8%
13%
20%
4% 4% 4% 2%1%3% 4%
11%
1% 1%1%
10%
4%4%
DUI1st Degree
DUI2nd Degree
DUI3rd Degree
DUI DegreeUnknown
CarelessDriving
Underage Drinking& Driving
Open Bottle Other 0%
20%
40%
60%
80%
100%
No prior offenses One prior offense Two prior offensesThree prior offenses Four prior offenses More than four prior offenses
♦ Figures 30a and 30b show the types of alcohol-related driving offenses for which the post-sentence REAM
participants have been arrested in 2002 and 2003. Participants in these two years have similar alcohol-related driving offense histories. Slightly more than one in ten post-sentence participants in both 2002 and 2003 had one prior 3rd degree DUI offense (14%-2002 and 13%-2003). Equal percentages in 2002 and 2003 had one 1st or 2nd degree prior DUI offense (7%-1st degree both years and 8%-2nd degree in both years). Two in ten (20%) post-sentence REAM participants in both years had one prior unknown DUI offense while approximately one in ten (9%-2002 and 11%-2003) had two prior DUIs with an unknown degree. Similar percentages had three prior unknown degree DUIs (11%-2002 and 10%-2003).
2004 REAM Report Research & Evaluation Unit 24
FIGURE 31
FIGURE 32
♦ Figure 31 shows that as in 2002,almost half (49%) of 2003 participantsreceived a public defender. Slightlymore than three in ten (31%) 2003participants did not receive a publicdefender.
♦ Figure 32 shows that the almost half(49%) of 2003 post-sentence REAMparticipants fully paid their REAM costswhile almost four in ten (38%) partiallypaid for their REAM participation.
♦ The percentage of participants whose
REAM costs were fully subsidized fromthe county decreased from 24 percentin 2002 to 13 percent in 2003.
Type of REAM Payment
42%
34%
24%
49%
38%
13%
Full PaymentOffender
Partial Payment Full PaymentCounty
0%
10%
20%
30%
40%
50%
60%
2002 (N = 273) 2003 (N = 1471)
Whether Offender Received A Public Defender
49%
27%24%
49%
31%
20%
Yes No Unknown0%
10%
20%
30%
40%
50%
60%
2002 (N = 273) 2003 (N = 1471)
2004 REAM Report Research & Evaluation Unit 25
FIGURE 33
♦ Figure 33 shows the probationordered for post-sentence REAMparticipants. As in 2002, slightlymore that one in ten (14%) 2003post-sentence REAM participants didnot receive any probation as a resultof their DUI conviction. Since 2002,the percentage of participantsreceiving 24 months of probation hasdecreased from 31 percent to 24percent while the percentagereceiving 72 months has increasedfrom 10 percent in 2002 to 15 percentin 2003.
Number of Months of Probation Ordered
13%
4%
31%
18%19%
3%
10%
0%2%
14%
7%
24%
17%19%
3%
15%
1%0%
NoProbationOrdered
Up to 12Months
24Months
25 to 36Months
48Months
60Months
72Months
73 to 119Months
120Monthsor More
0%
5%
10%
15%
20%
25%
30%
35%
2002 (N = 273) 2003 (N = 1471)
FIGURE 34
Whether Offender Participated in an Intensive Probation Program for DUI Offenders
21%
79%
22%
78%
Yes No0%
20%
40%
60%
80%
100%
2002 (N = 273) 2003 (N = 1471)
♦ Figure 34 shows that similarpercentages of REAM participantsin 2002 and 2003 participated in anintensive probation program for DUIoffenders (21%-2002 and 22%-2003).
2004 REAM Report Research & Evaluation Unit 26
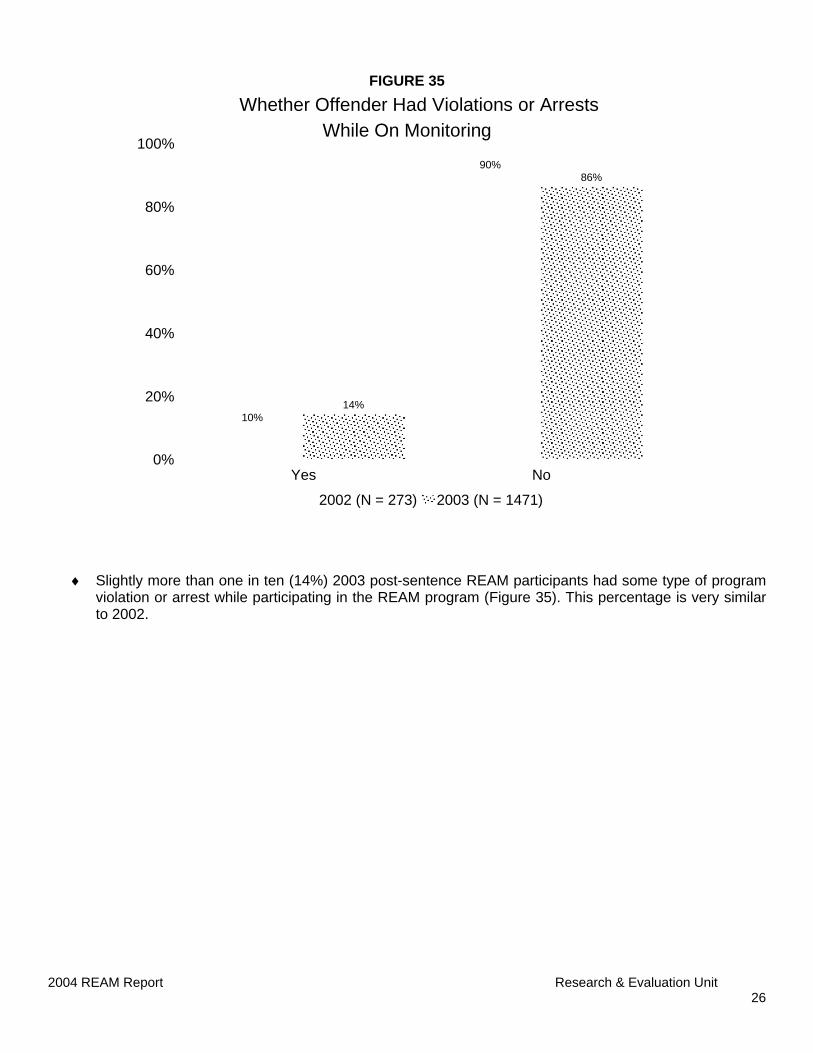
FIGURE 35 Whether Offender Had Violations or Arrests
While On Monitoring
10%
90%
14%
86%
Yes No0%
20%
40%
60%
80%
100%
2002 (N = 273) 2003 (N = 1471)
♦ Slightly more than one in ten (14%) 2003 post-sentence REAM participants had some type of program violation or arrest while participating in the REAM program (Figure 35). This percentage is very similar to 2002.
♦ In 2003 there was a total of 331violations. More than six in ten(63%) were for electronicmonitoring violations, while morethan one-quarter of the totalviolations were alcohol-related(26%). Far fewer violations weredrug related (3%), absconding(3%), or for failure to report (2%).
♦ Although there appears to be a
change in the types of violationscommitted between 2002 and2003, the number of totalviolations in 2002 (N = 37) is toosmall to draw any accurateconclusions.
Types of Violations While on Monitoring*
*There were 207 offenders with violations while on REAM. These offenders had a total of 331 violations; therefore, percents do not equal 100. This question was also asked only of those offenders who had violations.
54%
8%
32%
0%5%
14%
0%
26%
3%
63%
2% 2% 3% 4%
AlcoholRelated
DrugRelated
ElectronicMonitoring
TreatmentViolation
Failure toReport
Abscond Other0%
20%
40%
60%
80%
100%
2002 (N = 37) 2003 (N = 331)
FIGURE 37
Types of Arrests While on Monitoring*
*Offenders could have more than one arrest. Therefore, percents do not equal 100 and are based on the number of arrests, not the number of offenders. This question was also asked only of those offenders with arrests.
5%0%
3% 3%0%
3%0% 2% 2% 1% 1% 0%
DrivingOffense
(non-alcohol)
DUI1st
Degree
DUI2nd
Degree
DUIDegreeUnkown
DrivingOffense(Alcohol)
FelonyPersonOffense
0%
20%
40%
60%
80%
100%
2002 (N = 37) 2003 (N = 331)
♦ Very small percentages of the 331arrests and violations committed bythe 2003 post-sentence REAMparticipants while on monitoringwere for a new DUI offense (Figure37). Just two percent each of thearrests were for a 1st or a 2nd
degree DUI.
2004 REAM Report Research & Evaluation Unit 28
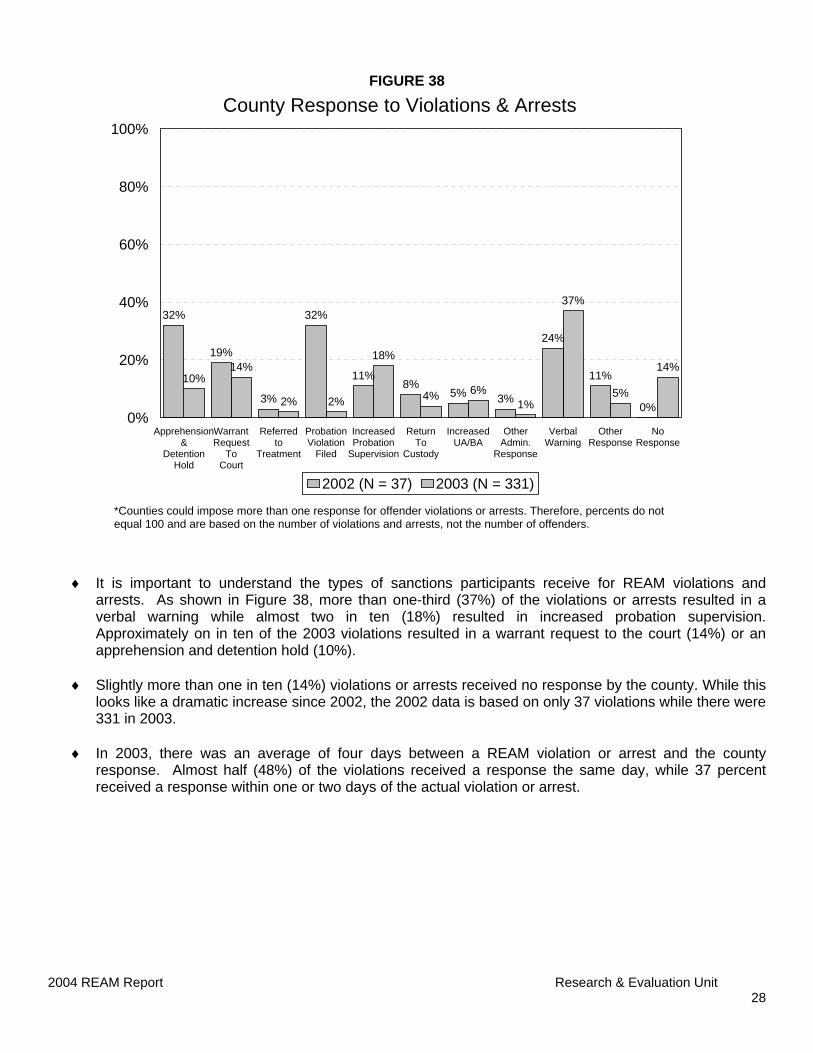
FIGURE 38
County Response to Violations & Arrests
*Counties could impose more than one response for offender violations or arrests. Therefore, percents do not equal 100 and are based on the number of violations and arrests, not the number of offenders.
32%
19%
3%
32%
11%8%
5% 3%
24%
11%
0%
10%14%
2% 2%
18%
4% 6%1%
37%
5%
14%
Apprehension&
DetentionHold
WarrantRequest
ToCourt
Referredto
Treatment
ProbationViolation
Filed
IncreasedProbation
Supervision
ReturnTo
Custody
IncreasedUA/BA
OtherAdmin.
Response
VerbalWarning
OtherResponse
NoResponse
0%
20%
40%
60%
80%
100%
2002 (N = 37) 2003 (N = 331)
♦ It is important to understand the types of sanctions participants receive for REAM violations and arrests. As shown in Figure 38, more than one-third (37%) of the violations or arrests resulted in a verbal warning while almost two in ten (18%) resulted in increased probation supervision. Approximately on in ten of the 2003 violations resulted in a warrant request to the court (14%) or an apprehension and detention hold (10%).
♦ Slightly more than one in ten (14%) violations or arrests received no response by the county. While this
looks like a dramatic increase since 2002, the 2002 data is based on only 37 violations while there were 331 in 2003.
♦ In 2003, there was an average of four days between a REAM violation or arrest and the county
response. Almost half (48%) of the violations received a response the same day, while 37 percent received a response within one or two days of the actual violation or arrest.
2004 REAM Report Research & Evaluation Unit 29
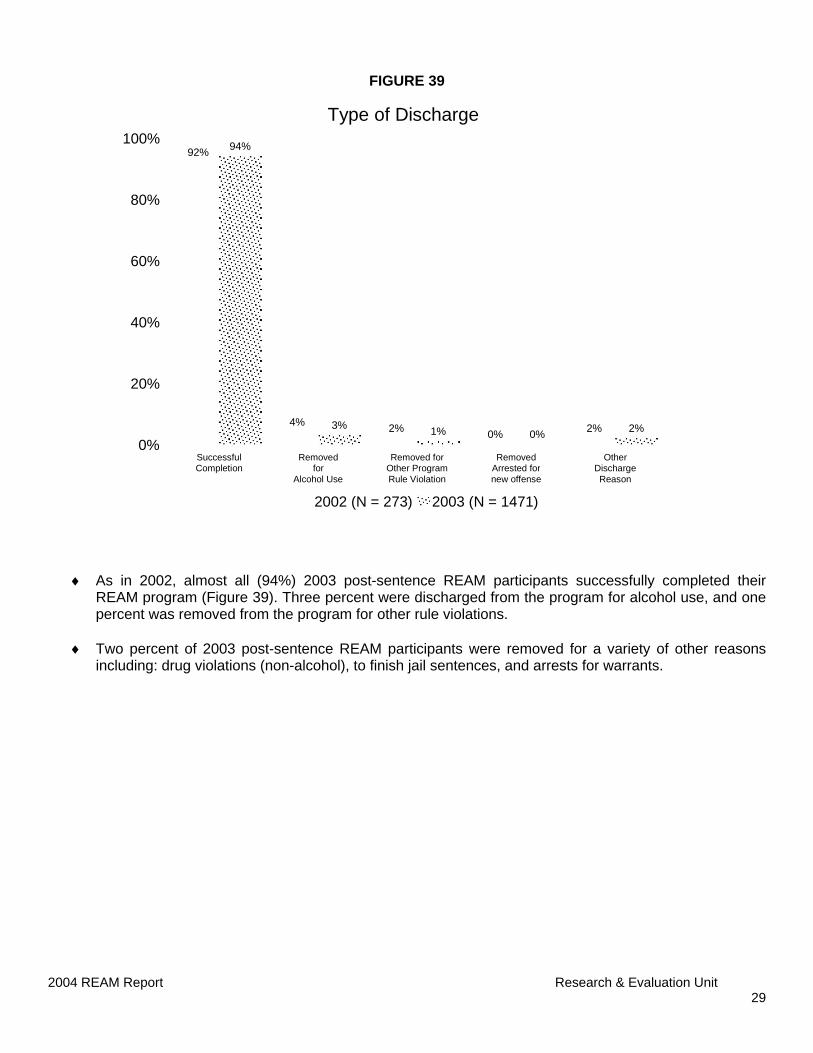
FIGURE 39 Type of Discharge
92%
4% 2% 0% 2%
94%
3% 1% 0% 2%
Successful Completion
Removedfor
Alcohol Use
Removed forOther ProgramRule Violation
RemovedArrested fornew offense
Other Discharge Reason
0%
20%
40%
60%
80%
100%
2002 (N = 273) 2003 (N = 1471)
♦ As in 2002, almost all (94%) 2003 post-sentence REAM participants successfully completed their
REAM program (Figure 39). Three percent were discharged from the program for alcohol use, and one percent was removed from the program for other rule violations.
♦ Two percent of 2003 post-sentence REAM participants were removed for a variety of other reasons
including: drug violations (non-alcohol), to finish jail sentences, and arrests for warrants.
.:...
2004 REAM Report Research & Evaluation Unit 30
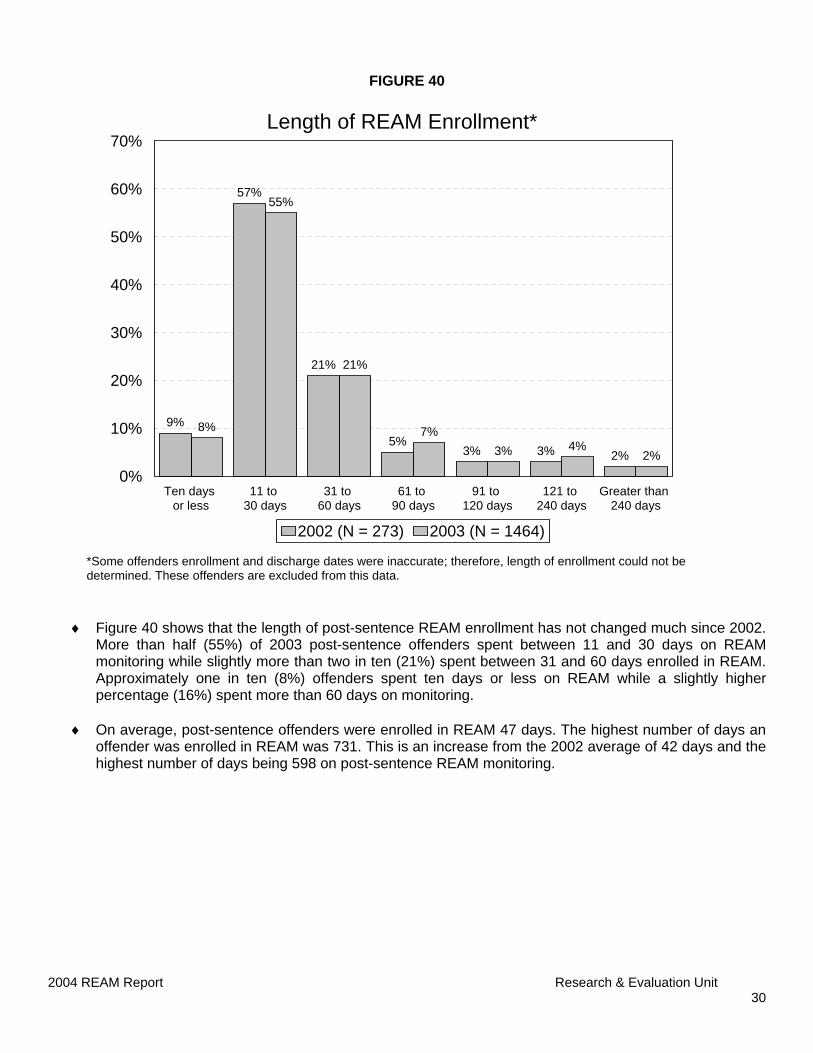
igure 40 shows that the length of post-sentence REAM enrollment has not changed much since 2002.
♦ On average, post-sentence offenders were enrolled in REAM 47 days. The highest number of days an
ffender was enrolled in REAM was 731. This is an increase from the 2002 average of 42 days and the
FIGURE 40
Length of REAM Enrollment*
9%
57%
21%
5%3% 3% 2%
8%
55%
21%
7%3% 4%
2%
Ten days or less
11 to 30 days
31 to 60 days
61 to 90 days
91 to 120 days
121 to 240 days
Greater than 240 days
0%
10%
20%
30%
40%
50%
60%
70%
2002 (N = 273) 2003 (N = 1464)
*Some offenders enrollment and discharge dates were inaccurate; therefore, length of enrollment could not be determined. These offenders are excluded from this data.
♦ FMore than half (55%) of 2003 post-sentence offenders spent between 11 and 30 days on REAM monitoring while slightly more than two in ten (21%) spent between 31 and 60 days enrolled in REAM. Approximately one in ten (8%) offenders spent ten days or less on REAM while a slightly higher percentage (16%) spent more than 60 days on monitoring.
ohighest number of days being 598 on post-sentence REAM monitoring.
2004 REAM Report Research & Evaluation Unit 31
Conclusion Overall, the REAM program appears to be meeting its intended goals. Offenders who are indigent (as determine by individual counties) are being given the opportunity to participate in REAM and are receiving subsidies to offset the cost of programming. In addition, it appears that participants are able to maintain their current level of employment while enrolled in REAM. Overall, the rate of program violations and arrests while on REAM also seems to be minimal; 19 percent of pre-sentence participants had violations or arrests while enrolled and 14 percent of post-sentence participants violated or were arrested during their REAM monitoring. While these violations tend to be alcohol or monitoring-related, very few arrests for new DUIs occurred while on REAM. When the violations did occur, the program response was swift and certain; for pre-sentence participants all of the violations had some type of response. In addition, slightly more than one in ten post-sentence violations did not receive some type of county response. However, the responses to violations or arrests came quickly; almost half of the pre- and post-sentence violations/arrests received a response the same day the violation occurred. Overall, the REAM program seems successful in keeping offenders out of jail and employed, the rate of violations and arrests while on monitoring is minimal, participants are receiving swift and certain program responses to violations and arrests, and participants are successfully completing the program.


![Arizona DUI Driver s License Suspension Guide [2017 Edition] · In addition to the 90 day suspension discussed above, if you are ultimately convicted of: 1) a second DUI offense within](https://static.documents.pub/doc/80x56/60350bd9b10109540f13bd8e/arizona-dui-driver-s-license-suspension-guide-2017-edition-in-addition-to-the.jpg)


