Reasoning about spreadsheets with labels and dimensions $ Chris Chambers , Martin Erwig Oregon State University, USA article info Keywords: Spreadsheet Dimension Unit of measurement Static analysis Inference rule Error detection abstract Labels in spreadsheets can be exploited for finding formula errors in two principally different ways. First, the spatial relationships between labels and other cells express simple constraints on the cells usage in formulas. Second, labels can be interpreted as units of measurements to provide semantic information about the data being combined in formulas, which results in different kinds of constraints. In this paper we demonstrate how both approaches can be combined into an integrated analysis, which is able to find significantly more errors in spreadsheets than each of the individual approaches. In particular, the integrated system is able to detect errors that cannot be found by either of the individual approaches alone, which shows that the integrated system provides an added value beyond the mere combination of its parts. We also compare the effectiveness of this combined approach with several other conceivable combinations of the involved components and identify a system that seems most effective to find spreadsheet formula errors based on label and unit-of- measurement information. & 2010 Elsevier Ltd. All rights reserved. 1. Introduction Spreadsheets are widely used [1] end-user programs that contain many errors [2]. To improve the quality of spreadsheets a variety of approaches to prevent, detect, and remove errors from spreadsheets have been investi- gated. Since preventive approaches, in principle, have to interfere with the creation process that makes spread- sheets so attractive to end users, much research has instead focused on the detection and removal of errors. One type of error that can be detected in spreadsheets is dimension errors, which occur when units of measure- ment are used incorrectly in formulas. Units of measure- ments can be employed as a concrete notion of types that is well known among end users [3], and are used to characterize different kinds of values, much like tradi- tional, more abstract, type systems used in general- purpose programming languages. For example, a floating point number, which has just one type, can nevertheless represent different kinds of quantities, such as length or time values. Several systems [4,5,3] have been developed in order to deal with dimension errors. Among these dimension inference [4] is a method that can be used to automati- cally find dimension errors in spreadsheets. This approach has been shown to work reliably and effectively in many cases, however, it does not take full advantage of the information provided in the spreadsheet as it does not utilize the structure of the spreadsheet and focuses on ensuring that formulas are dimension correct. In contrast, there are several systems that are designed to directly take advantage of the labels and the structure of spreadsheets. These purely label-based approaches, such as UCheck [6] or the system described in [7], are designed to find formula errors caused by inconsistent label usage. This technique operates in two distinct analysis phases. The first phase defines header or label Contents lists available at ScienceDirect journal homepage: www.elsevier.com/locate/jvlc Journal of Visual Languages and Computing 1045-926X/$ - see front matter & 2010 Elsevier Ltd. All rights reserved. doi:10.1016/j.jvlc.2010.08.004 $ This work is partially supported by the National Science Foundation under the Grant ITR-0325273 and by the EUSES Consortium (http:// EUSESconsortium.org). Corresponding author. E-mail addresses: [email protected](C. Chambers), [email protected] (M. Erwig). Journal of Visual Languages and Computing 21 (2010) 249–262
Transcript
Contents lists available at ScienceDirect
Journal of Visual Languages and Computing
Journal of Visual Languages and Computing 21 (2010) 249–262
1045-92
doi:10.1
$ Thi
under t
EUSESc� Cor
E-m
erwig@
journal homepage: www.elsevier.com/locate/jvlc
Reasoning about spreadsheets with labels and dimensions$
Labels in spreadsheets can be exploited for finding formula errors in two principally
different ways. First, the spatial relationships between labels and other cells express
simple constraints on the cells usage in formulas. Second, labels can be interpreted as
units of measurements to provide semantic information about the data being combined
in formulas, which results in different kinds of constraints.
In this paper we demonstrate how both approaches can be combined into an
integrated analysis, which is able to find significantly more errors in spreadsheets than
each of the individual approaches. In particular, the integrated system is able to detect
errors that cannot be found by either of the individual approaches alone, which shows
that the integrated system provides an added value beyond the mere combination of its
parts. We also compare the effectiveness of this combined approach with several other
conceivable combinations of the involved components and identify a system that
seems most effective to find spreadsheet formula errors based on label and unit-of-
measurement information.
& 2010 Elsevier Ltd. All rights reserved.
1. Introduction
Spreadsheets are widely used [1] end-user programsthat contain many errors [2]. To improve the quality ofspreadsheets a variety of approaches to prevent, detect,and remove errors from spreadsheets have been investi-gated. Since preventive approaches, in principle, have tointerfere with the creation process that makes spread-sheets so attractive to end users, much research hasinstead focused on the detection and removal of errors.
One type of error that can be detected in spreadsheetsis dimension errors, which occur when units of measure-ment are used incorrectly in formulas. Units of measure-ments can be employed as a concrete notion of types thatis well known among end users [3], and are used to
All rights reserved.
Science Foundation
onsortium (http://
du (C. Chambers),
characterize different kinds of values, much like tradi-tional, more abstract, type systems used in general-purpose programming languages. For example, a floatingpoint number, which has just one type, can neverthelessrepresent different kinds of quantities, such as length ortime values.
Several systems [4,5,3] have been developed in orderto deal with dimension errors. Among these dimensioninference [4] is a method that can be used to automati-cally find dimension errors in spreadsheets. This approachhas been shown to work reliably and effectively in manycases, however, it does not take full advantage of theinformation provided in the spreadsheet as it does notutilize the structure of the spreadsheet and focuses onensuring that formulas are dimension correct.
In contrast, there are several systems that are designedto directly take advantage of the labels and the structureof spreadsheets. These purely label-based approaches,such as UCheck [6] or the system described in [7], aredesigned to find formula errors caused by inconsistentlabel usage. This technique operates in two distinctanalysis phases. The first phase defines header or label
C. Chambers, M. Erwig / Journal of Visual Languages and Computing 21 (2010) 249–262250
information for the entire spreadsheet. UCheck is able toinfer this while most others require users to annotate thelabels for every cell. Once the headers are determined fora sheet, labels are assigned to cells based on headers andformulas. In the second phase this information is analyzedto find errors in formulas by identifying inconsistentlabels.
One thing to note when looking at UCheck anddimension inference is that both systems rely on headerand label information. However, this information is usedquite differently by the two systems. By combiningdimension analysis with the purely label-based ap-proaches the structure of the spreadsheet could be usedto help strengthen the reasoning of the system. To somedegree this was already tried in the SLATE approach [5].However, SLATE only transforms labels and dimensionsand does not identify errors. Moreover, the fact that SLATEis a stand-alone spreadsheet system that cannot beintegrated into Excel together with the additional timerequired of a user to annotate a spreadsheet renders theapproach currently impractical.
In recent work [8] we have designed an integratedsystem that combines label-based reasoning with dimen-sion inference. This approach was achieved by gatheringboth label and dimension information about a cell. Inmany cases a spreadsheet contains dimensions on onlyone axis, with the labels on the dimension free axis goingunused in dimension inference. These unused labels canhelp to provide structural information that can beexploited by the reasoning system behind UCheck, andcreate a system that can check a spreadsheet for unit ofmeasurement errors as well as detect label errors.
When run on the EUSES repository this combinedsystem was able to detect several errors that neitherUCheck nor dimension inference were able to discover.This brief evaluation shows the validity of a combinedlabel and dimension checking system, but was this thebest possible combination?
In previous work [9], a system architecture wasdeveloped to study how two specific systems could beintegrated, in this case, WYSIWYT and UCheck. In thiswork, errors are introduced into spreadsheets and severalcombinations of the systems are tested to determinethe best possible combination of reasoning systems. Theprocess showed that when systems are combined theresults are positive and more errors can be detected.
In this paper we will describe several different options,along with the original integrated label and dimensionanalysis [8], that can be pursued to check a spreadsheetfor label and dimension errors. We will evaluate thesedifferent systems by running them on the 487 dimensionand formula contained sheets in the EUSES corpus, asdetermined in, [4] and determine the efficiency andcorrectness for each combination.
The rest of this paper is structured as follows. InSection 2 we illustrate the issues involved in adding labelreasoning to dimension inference with a small example.In Section 3 we formalize spreadsheets and presentmodels of dimensions and labels. The original combinedanalysis method is described in Section 4. In Section 5 wedescribe the different modifications made to the system.
Section 6 reports on the evaluation of these prototypicalimplementations. We discuss related work in Section 7and give conclusions in Section 8.
2. A motivating example
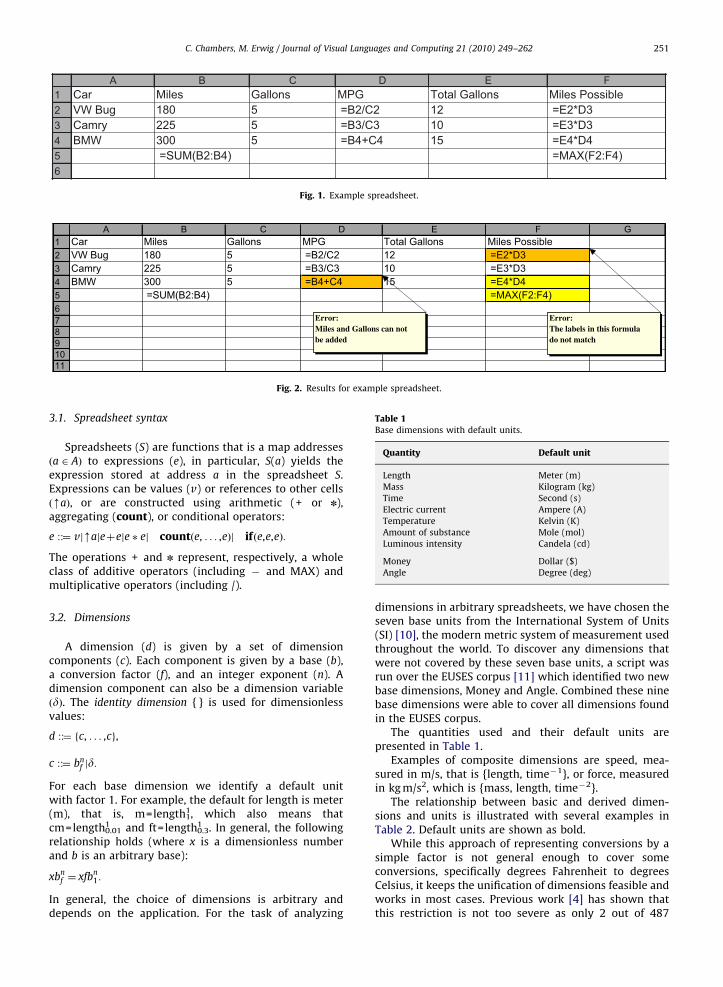
To explain how the integration of spatial and semanticlabel analysis works, we will show how both dimensioninference and the integrated system work on thespreadsheet in Fig. 1. This spreadsheet is calculatinghow far specific cars can travel on a full tank of gas basedon the result of a drive using only five gallons of gas.
When the spreadsheet is checked with dimensioninference, it would first identify the headers for all cells.When the headers are analyzed for dimension informa-tion, B1, C1, D1, E1, and F1 all map to a valid dimension.This would allow the system to check all formulas in thisspreadsheet for dimension correctness. In this case, thesystem would detect that there is an error in cell D4where the formula is trying to add miles and gallons.
Upon further inspection it could be noted that thespreadsheet contains another error. In this particularexample, the cell F2 has the formula E2*D3. The dimen-sion for E2 is Gallons, and the dimension for D3 is Milesper Gallon, which, when multiplied together result in thedimension Miles. This result contains no dimensionerrors, but it does not seem right. E3 is actually totalGallons for the Camry, while D2 is the MPG for the VWBug. Logically, the result does not make sense, however,plain dimension inference would have no way to catchthis.
By integrating label reasoning and checking thatformulas are both dimension and label correct, the systempresented in this paper is able to identify a previouslyunnoticed error. The first step is to determine whichheader axis (row or column) will be used as the dimensionaxis. In this case there are several dimensions on thehorizontal axis (row 1), but dimensionless labels on thevertical axis (column A). Therefore, the system thenidentifies labels and dimensions for each cell. Forexample, the cells in row 2 would have the label ‘‘VWBug’’.
With this information assigned, the system can thencheck to ensure that formulas are dimension and labelcorrect. When the system checks the formula in F2 it canidentify that it is multiplying a cell, E2, with the unitGallons and the label ‘‘VW Bug’’ with the cell D2, whichhas the unit ‘‘Miles/Gallon’’ and the label ‘‘Camry’’. Whilethe dimensions work out in this formula, the system willidentify an inconsistency with the labels and be able toreport this to the user, as shown in Fig. 2. The cells F4 andF5 are shaded yellow to indicate problems caused by thepropagation of errors.
3. Representations for spreadsheet analysis
In this section, we will formalize the notions ofspreadsheets, dimensions, and labels in preparation forthe formal rule system that is discussed in Section 4.4.
A B C D E F1 Car Miles Gallons MPG Total Gallons Miles Possible2 VW Bug 180 5 =B2/C2 12 =E2*D33 Camry 225 5 =B3/C3 10 =E3*D34 BMW 300 5 =B4+C4 15 =E4*D45 =SUM(B2:B4) =MAX(F2:F4)6
Fig. 1. Example spreadsheet.
A B C D E F G1 Car Miles Gallons MPG Total Gallons Miles Possible2 VW Bug 180 5 =B2/C2 12 =E2*D33 Camry 225 5 =B3/C3 10 =E3*D34 BMW 300 5 =B4+C4 15 =E4*D45 =SUM(B2:B4) =MAX(F2:F4)67891011
Error:The labels in this formula do not match
Error:Miles and Gallons can not be added
Fig. 2. Results for example spreadsheet.
Table 1Base dimensions with default units.
Quantity Default unit
Length Meter (m)
Mass Kilogram (kg)
Time Second (s)
Electric current Ampere (A)
Temperature Kelvin (K)
Amount of substance Mole (mol)
Luminous intensity Candela (cd)
Money Dollar ($)
Angle Degree (deg)
C. Chambers, M. Erwig / Journal of Visual Languages and Computing 21 (2010) 249–262 251
3.1. Spreadsheet syntax
Spreadsheets (S) are functions that is a map addressesða 2 AÞ to expressions (e), in particular, S(a) yields theexpression stored at address a in the spreadsheet S.Expressions can be values (v) or references to other cellsðmaÞ, or are constructed using arithmetic (+ or n),aggregating (count), or conditional operators:
e ::¼ vjmajeþeje � ej countðe, . . . ,eÞj ifðe,e,eÞ:
The operations + and n represent, respectively, a wholeclass of additive operators (including � and MAX) andmultiplicative operators (including /).
3.2. Dimensions
A dimension (d) is given by a set of dimensioncomponents (c). Each component is given by a base (b),a conversion factor (f), and an integer exponent (n). Adimension component can also be a dimension variableðdÞ. The identity dimension { } is used for dimensionlessvalues:
d ::¼ fc, . . . ,cg,
c ::¼ bnf jd:
For each base dimension we identify a default unitwith factor 1. For example, the default for length is meter(m), that is, m=length1
1, which also means thatcm=length0.01
1 and ft=length0.31 . In general, the following
relationship holds (where x is a dimensionless numberand b is an arbitrary base):
xbnf ¼ xfbn
1:
In general, the choice of dimensions is arbitrary anddepends on the application. For the task of analyzing
dimensions in arbitrary spreadsheets, we have chosen theseven base units from the International System of Units(SI) [10], the modern metric system of measurement usedthroughout the world. To discover any dimensions thatwere not covered by these seven base units, a script wasrun over the EUSES corpus [11] which identified two newbase dimensions, Money and Angle. Combined these ninebase dimensions were able to cover all dimensions foundin the EUSES corpus.
The quantities used and their default units arepresented in Table 1.
Examples of composite dimensions are speed, mea-sured in m/s, that is {length, time�1}, or force, measuredin kg m/s2, which is {mass, length, time�2}.
The relationship between basic and derived dimen-sions and units is illustrated with several examples inTable 2. Default units are shown as bold.
While this approach of representing conversions by asimple factor is not general enough to cover someconversions, specifically degrees Fahrenheit to degreesCelsius, it keeps the unification of dimensions feasible andworks in most cases. Previous work [4] has shown thatthis restriction is not too severe as only 2 out of 487
Table 2Basic and derived dimensions and corresponding units.
Dimension Units
Basic Length m, cm, km, ft, y
Time s, min, h,y
Mass kg, pounds, y
y y
Derived Speed m
s,
km
h,y
Force kg m
s2= Newton, dyne, y
Pressure kg
m s2= Pascal, psi, atm,y
y y
C. Chambers, M. Erwig / Journal of Visual Languages and Computing 21 (2010) 249–262252
spreadsheets contained dimensions that could not beconverted using the model presented above.
3.3. Labels
The labeling structure in this integrated system is asimplified version of the formal model presented in [12].In particular, since labels will be used only for one axis,we can omit the concept of AND labels, which leads tomuch simplified rules for combining labels.
The syntax that we use for labels is shown below.(Note the difference between an OR-label ‘1j ‘2 and thevertical bar j to separate grammar alternatives.):
‘ ::¼ vj‘1½‘2� j‘1j ‘2j1:
To show the different possible types of labels we will lookat several cells in Fig. 1. A chain of labels, ‘1½‘2�, representscells that may have a second level label. In this example,the cell B3 has the header A3, which contains the label‘‘Camry’’. Since A3 has as its header the cell A1 with label‘‘Car’’, the label associated with B3 is ‘‘Car[Camry]’’.
An OR label is used when cells with labels are addedtogether. In general, when two cells are added together,their labels are ORed to produce a resulting label. The cellB5 is a SUM, which adds the three value cells in column B.The three labels used in this formula are ‘‘Car[VW Bug]’’,‘‘Car[Camry]’’, and ‘‘Car[BMW]’’. The resulting label is‘‘Car½VW Bug�j Car½Camry�j Car½BMW�’’ . Since OR distri-butes over label chains [12], we can factor this expressionto ‘‘Car½VW Bugj Camryj BMW�’’ . This label expressioncan be generalized to ‘‘Car’’ [6].
The ADD rule requires a compatibility of labelsexpressed by the following label simplification rule,‘w‘-‘, defined as follows:
‘w‘-‘,
‘w‘½‘1�-‘,
‘½‘1�w‘-‘:
This operation works only for specific arguments, and if itfails in the premise of an inference rule, then a label errorhas been identified.
3.4. On semantic vs. syntactic label analysis
Before we describe our integrated reasoning tool, wewant to point out a principal difference of the twounderlying approaches, because even though both UCheckand dimension inference use labels to determine errors,they use this information in quite different ways.
UCheck essentially exploits the relative position oflabels, but it does not actually interpret labels. This meansthat we can rename labels without changing the function-ality of the system (at least if the renaming is donesystematically). For example, the labels Camry or BMWhave no meaning to the system and could be replaced byany other strings. It is how these labels are combined withother labels in formulas that forms the basis of errordetection.
Dimension inference, on the other hand, derives somemeaning from labels. Instead of treating labels as simplestrings, labels in dimension inference actually are inter-preted to have some extrinsic semantics. This means thatrenaming a label could cause errors in a spreadsheet.Using the sheet in Fig. 1, if the label in cell C1 isrenamed to ‘‘Hours’’, the formulas in column D will notbe dimension correct as the label for that column is‘‘Miles/Gallon’’, but the resulting dimension is‘‘Miles/Hours’’. To keep the formula dimension correctthe labels in D1 and E1 would have to be renamed as well.
The simple act of changing these three labels, to thesheet shown in Fig. 3, now changes the entire meaning ofthe spreadsheet. Despite the fact that no values werechanged the data now represents something entirelydifferent, as the spreadsheet is now calculating how manymiles a car can drive based on the speed measured over ashorter sample distance. This simple example shows howdimension inference uses the meanings of labels to gatherinformation and how a label change can make a largeimpact on the meaning of a spreadsheet.
4. Integrated label and dimension analysis
Integrated label and dimension analysis (or LD analysisfor short), while strongly based on both UCheck anddimension inference, has been designed as an add-on todimension inference. As an add-on, LD analysis goesthrough much the same process as dimension inference,with a few changes. The five distinct steps that the LDanalysis performs while checking a spreadsheet areshown below and discussed in greater detail in thissection:
1.
header inference; 2. label interpretation; 3. identification of dimension and label axes; 4. combination of label and dimension inference; and 5. dimension instantiation.
Header inference, label interpretation, and dimensioninstantiation are components that we have adoptedunchanged from our previous work [4], and they aretherefore only briefly described here. Steps 3 and 4 will be
A B C D E F1 Car Miles Hours MPH Total Hours Miles Possible2 VW Bug 180 5 =B2/C2 12 =E2*D33 Camry 225 5 =B3/C3 10 =E3*D34 BMW 300 5 =B4+C4 15 =E4*D45 =SUM(B2:B4) =MAX(F2:F4)6
Fig. 3. An example demonstrating the meaning of labels.
A B C D E F1 Car Miles Gallons MPG Total Gallons Miles Possible2 VW Bug 180 5 =B2/C2 12 =E2*D33 Camry 225 5 =B3/C3 10 =E3*D34 BMW 300 5 =B4+C4 15 =E4*D45 =SUM(B2:B4) =MAX(F2:F4)6
Fig. 4. Example headers.
C. Chambers, M. Erwig / Journal of Visual Languages and Computing 21 (2010) 249–262 253
described in greater detail in the following. The last stepapplies only in those cases when the step 4 producesunderspecified dimensions, that is, when it results ininferred dimensions that contain dimension variables.
4.1. Header inference
Header inference analyzes the structure of a spread-sheet and returns a set of headers for each cell. A header issimply the address of another cell. Therefore, headerinference produces a binary relation HDA� A such thatða,auÞ 2 H says that au is a header of a. In general, one cellcan be a header for many cells, and any particular cell canhave zero, one, or more headers.
Fig. 4 shows the identified headers, outlined in blue,for the example in Fig. 1. Looking at specific cells, B1 is aheader for B2, B3, and B4, that is, H�1(B1)={B2, B3, B4},and A2 and B1 are headers of B2, that is, H(B2)={A2, B1}.These specific relationships are shown with the arrows inFig. 4.
Header inference essentially works by analyzing thespatial relationships between different kinds of formulas.It can also take into account layout information. Techni-ques for header inference have been described in detailelsewhere [13,6]. In the context of this paper we simplyreuse those techniques.
4.2. Label interpretation
In the second phase of LD analysis we try to derive adimension for each label contained in a cell that hasbeen identified as a header by header inference. Thisprocess works by (a) splitting labels into separate words,(b) removing word inflections, (c) mapping word stems todimensions, and (d) combining dimensions into onedimension.
For example, cell E1 in Fig. 1 is a header cell and istherefore subject to label interpretation. Its value can be
split into the two words ‘‘Total’’ and ‘‘Gallons’’, and theplural of ‘‘Gallons’’ can be removed. The resulting ‘‘Gallon’’can then be mapped to the dimension ‘‘Gallon’’. Incontrast, ‘‘Total’’ cannot be mapped into any dimensionand will thus be mapped to { }. Finally, the combination ofboth dimensions yields ‘‘Gallons’’. If no part of a headerlabel can be mapped to a dimension other than { }, thelabel is mapped to a dimension variable d, which indicatesthat the dimension is at this time unknown.
4.3. Identification of dimension and label axes
The goal of our system is to exploit one axis fordimension checking and the other for label checking. Inthe formal rule system, this separation of analysis isreflected by two new judgments, S,L ‘ a : ‘ and S,D ‘ a : d.These judgments specify how the integrated system getslabels and dimensions for each cell. The header relation-ship H identified in the header inference phase has to bepartitioned into two parts H¼ L [ D where:
�
L is the set of headers that define labels and � D is the set of headers that define dimensions
If a cell has two headers, one defining dimensions and theother defining a plain label, both of these pieces ofinformation are exploited to make the inference stronger,as can be seen in the ComboHdr rule in Fig. 6.
To facilitate the partitioning of the header relationship,we have to identify table regions in a spreadsheet and foreach table its horizontal and vertical label axes. Theinformation provided by label interpretation allows us tothe identify the following three cases for axes:
1.
no dimension axis; 2. one dimension axis; and 3. two dimension axes.
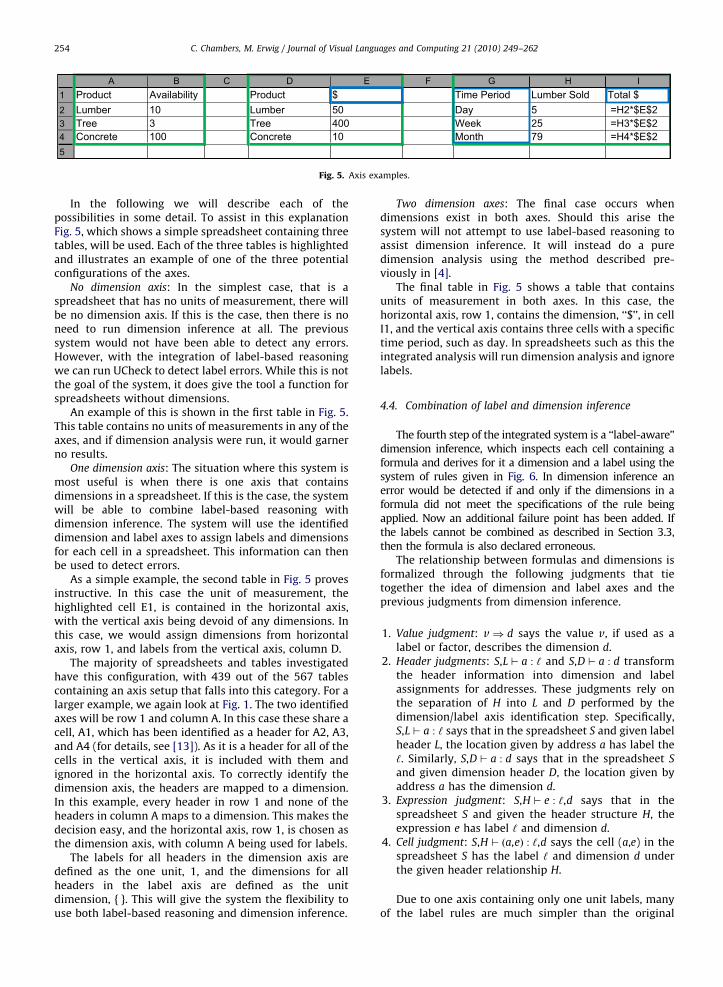
A B C D E F G H I1 Product Availability Product $ Time Period Lumber Sold Total $ 2 Lumber 10 Lumber 50 Day 5 =H2*$E$23 Tree 3 Tree 400 Week 25 =H3*$E$24 Concrete 100 Concrete 10 Month 79 =H4*$E$25
Fig. 5. Axis examples.
C. Chambers, M. Erwig / Journal of Visual Languages and Computing 21 (2010) 249–262254
possibilities in some detail. To assist in this explanationFig. 5, which shows a simple spreadsheet containing three
In the following we will describe each of the
tables, will be used. Each of the three tables is highlightedand illustrates an example of one of the three potentialconfigurations of the axes.
No dimension axis: In the simplest case, that is aspreadsheet that has no units of measurement, there willbe no dimension axis. If this is the case, then there is noneed to run dimension inference at all. The previoussystem would not have been able to detect any errors.However, with the integration of label-based reasoningwe can run UCheck to detect label errors. While this is notthe goal of the system, it does give the tool a function forspreadsheets without dimensions.
An example of this is shown in the first table in Fig. 5.This table contains no units of measurements in any of theaxes, and if dimension analysis were run, it would garnerno results.
One dimension axis: The situation where this system ismost useful is when there is one axis that containsdimensions in a spreadsheet. If this is the case, the systemwill be able to combine label-based reasoning withdimension inference. The system will use the identifieddimension and label axes to assign labels and dimensionsfor each cell in a spreadsheet. This information can thenbe used to detect errors.
As a simple example, the second table in Fig. 5 provesinstructive. In this case the unit of measurement, thehighlighted cell E1, is contained in the horizontal axis,with the vertical axis being devoid of any dimensions. Inthis case, we would assign dimensions from horizontalaxis, row 1, and labels from the vertical axis, column D.
The majority of spreadsheets and tables investigatedhave this configuration, with 439 out of the 567 tablescontaining an axis setup that falls into this category. For alarger example, we again look at Fig. 1. The two identifiedaxes will be row 1 and column A. In this case these share acell, A1, which has been identified as a header for A2, A3,and A4 (for details, see [13]). As it is a header for all of thecells in the vertical axis, it is included with them andignored in the horizontal axis. To correctly identify thedimension axis, the headers are mapped to a dimension.In this example, every header in row 1 and none of theheaders in column A maps to a dimension. This makes thedecision easy, and the horizontal axis, row 1, is chosen asthe dimension axis, with column A being used for labels.
The labels for all headers in the dimension axis aredefined as the one unit, 1, and the dimensions for allheaders in the label axis are defined as the unitdimension, { }. This will give the system the flexibility touse both label-based reasoning and dimension inference.
Two dimension axes: The final case occurs whendimensions exist in both axes. Should this arise thesystem will not attempt to use label-based reasoning toassist dimension inference. It will instead do a puredimension analysis using the method described pre-viously in [4].
The final table in Fig. 5 shows a table that containsunits of measurement in both axes. In this case, thehorizontal axis, row 1, contains the dimension, ‘‘$’’, in cellI1, and the vertical axis contains three cells with a specifictime period, such as day. In spreadsheets such as this theintegrated analysis will run dimension analysis and ignorelabels.
4.4. Combination of label and dimension inference
The fourth step of the integrated system is a ‘‘label-aware’’dimension inference, which inspects each cell containing aformula and derives for it a dimension and a label using thesystem of rules given in Fig. 6. In dimension inference anerror would be detected if and only if the dimensions in aformula did not meet the specifications of the rule beingapplied. Now an additional failure point has been added. Ifthe labels cannot be combined as described in Section 3.3,then the formula is also declared erroneous.
The relationship between formulas and dimensions isformalized through the following judgments that tietogether the idea of dimension and label axes and theprevious judgments from dimension inference.
1.
Value judgment: v) d says the value v, if used as alabel or factor, describes the dimension d.
2.
Header judgments: S,L ‘ a : ‘ and S,D ‘ a : d transformthe header information into dimension and labelassignments for addresses. These judgments rely onthe separation of H into L and D performed by thedimension/label axis identification step. Specifically,S,L ‘ a : ‘ says that in the spreadsheet S and given labelheader L, the location given by address a has label the‘. Similarly, S,D ‘ a : d says that in the spreadsheet S
and given dimension header D, the location given byaddress a has the dimension d.
3.
Expression judgment: S,H ‘ e : ‘,d says that in thespreadsheet S and given the header structure H, theexpression e has label ‘ and dimension d.
4.
Cell judgment: S,H ‘ ða,eÞ : ‘,d says the cell (a,e) in thespreadsheet S has the label ‘ and dimension d underthe given header relationship H.
Due to one axis containing only one unit labels, manyof the label rules are much simpler than the original
C. Chambers, M. Erwig / Journal of Visual Languages and Computing 21 (2010) 249–262 255
UCheck system. Instead of having to determine if theresulting label is well formed, we can simply check if thelabels are the same. If they are, then no error can bedetected, if they are different, then an error is reported.
This is particularly useful for multiplication formulas.UCheck was unable to properly handle multiplication andrequired that all but one label involved had to be the oneunit. By integrating labels with dimension inference, thisis loosened, and the only restrictions are that all the labelsare the same and that the resulting dimension is valid.
To show how these rules are applied to a spreadsheet,we will investigate how they are used on the two errorcontaining cells in Fig. 1.
The first erroneous cell is D4. This cell contains anaddition formula and thus will be checked using the Addrule, shown below.
Add
S,H ‘ e1 : ‘1,fbnf1g [ d S,H ‘ e2 : ‘2,fbn
f2g [ d ‘1w‘2-‘ c1 ¼ f1=f c2 ¼ f2=f
S,H ‘ c1 � e1þc2 � e2 : ‘,fbnf g [ d
When this rule is applied to D4 we get:
S,H ‘ B4 : Car½BMW�,fMilesg [ fg
S,H ‘ C4 : Car½BMW�,fGallonsg [ fg
Car½BMW�wCar½BMW�-Car½BMW� c1 ¼ f1=f c2 ¼ f2=f
S,H ‘ B4þC4 : BMW,?
Since the dimensions in this formula are not compatible,namely ‘‘Miles’’ and ‘‘Gallons’’ cannot be added, adimension cannot be derived, and an error is reported.
The behavior of multiplication errors can be seen bylooking at the cell F2, for which the rule Mult is employed:
The application of this rule shows that the dimensionsin this multiplication are acceptable. When ‘‘Gallons’’ and‘‘Miles/Gallon’’ are multiplied, the resulting dimensionis ‘‘Miles’’, which is a valid dimension and will notcause an error. However, the labels ‘‘Car[VW Bug]’’ and‘‘Car[Camry]’’ are not compatible, or in this case they donot match. Thus an error has been identified. For thisformula to be correct D3 would have to be changed to D2,which also has the label ‘‘Car[VW Bug]’’.
4.5. Dimension instantiation
An inferred dimension might contain dimension vari-ables and/or conversion-factor variables. Variables occurwhenever the spreadsheet does not provide enough
information to precisely narrow down the dimensions.In these cases we have to find substitutions for thevariables to obtain proper dimensions.
In fact, a dimension involving variables describes a wholeclass of possible dimensions. For example, lengthf can be m,cm, or any other length dimension that can be obtained bysubstituting values for f. Similarly, the dimension fm,dg canbe instantiated to velocity or acceleration using thesubstitution fd/s�1g or fd/s�2g, respectively.
The instantiation of dimensions can be realized bygenerating substitutions for conversion-factor variables sothat default dimensions are obtained and by generatingsubstitutions for dimension variables that produce validdimensions. From those valid dimensions we can thenselect the one that is most common (as indicated by thenumbers to be reported in Section 6).
5. Shared reasoning
While the method described in the previous sectionhas been shown to be effective at detecting errors inspreadsheets [8], it is but one way to combine these labelsand dimensions. In fact, this system was designed only asan add on to the dimension inference system, and so insome cases it ignores the search for label errors to focusinstead on identifying dimension errors.
This approach is but one method of many that areavailable to use. It stands to reason that these other methodsmay have similar success detecting errors and should beexplored. To test these possibilities we have modified theoriginal integrated system, LD analysis, in several ways, eachof which is described in the following sections.
The options described in this sections are a combina-tion of three different methods for checking spreadsheetsfor errors. The first method is UCheck, which is designed
to look for label errors, the second is dimension inference,which will check a spreadsheet for unit of measurementerrors, and the third is LD analysis, which attempts tocheck for both label and unit of measurement errors.
To conceptualize how these options differ, it isinstructive to think of the axes in a spreadsheet as areasoning resource. This resource can be used only inspecific ways. For example, in LD analysis, we assign axesto dimension inference, if they contain units of measure-ment, or UCheck if they do not.
There are two specific aspects that we can investigatewhen discussing axes as a reasoning resource.
1.
Which axis is made available to which tool: In LDanalysis any axis that had a unit of measurement was
Fig. 6. Combined system rules.
C. Chambers, M. Erwig / Journal of Visual Languages and Computing 21 (2010) 249–262256
assigned to dimension inference and any axis withoutone was given to UCheck. However, a tool could bedesigned where UCheck and dimension inference areboth always given one axis.
2.
Integrated or independent: How the resources arereasoned about is important, and there are two typesof reasoning. The first is an integrated approach thatwill take the label and dimension information andcombine it to potentially find more errors, in effectmaking an entirely new system. The other type ofreasoning is independent, where the axes are used by agiven tool without any information about how theother axis or system is performing.
The following section will describe four different systemsthat each take advantage of these axis resources indifferent ways.
5.1. UCheck followed by dimension inference
The simplest method of combining labels and units ofmeasurement is to simply run UCheck and dimensioninference sequentially. That is, first run UCheck, whichwill determine the label errors in the spreadsheet, andthen run dimension inference to find unit errors.
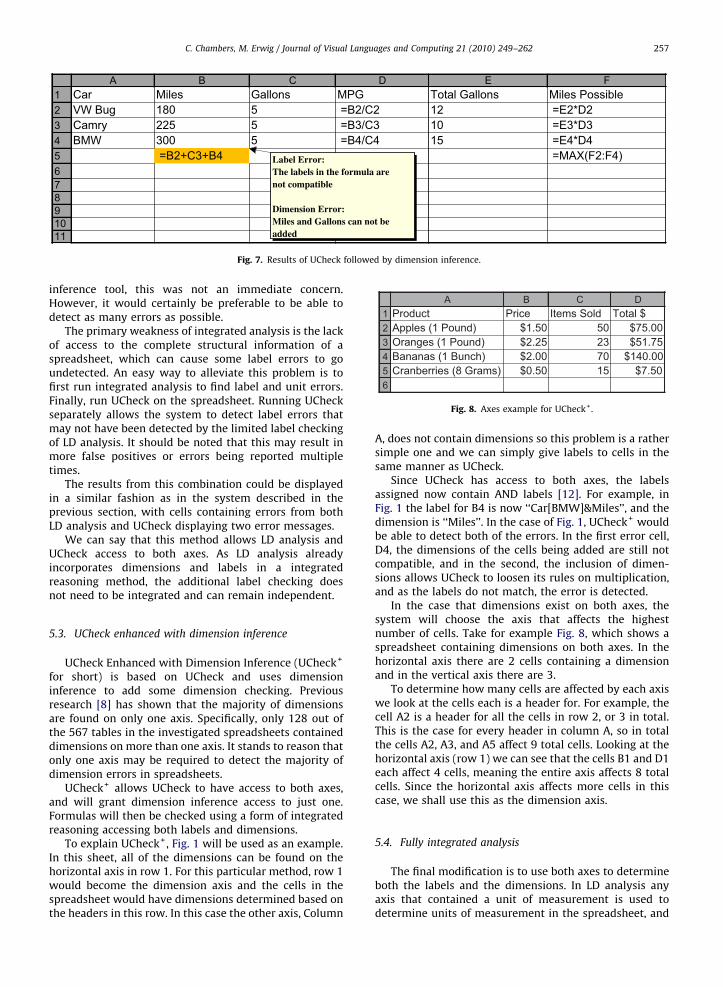
Once the two systems have been run on the spread-sheet and the errors for each have been found, they can bedisplayed to the user. In this case, there may be some cellswith errors from both systems. If this is the case, thenboth errors are displayed in the cell. An example of thiscan be seen in Fig. 7.
This combination method is very basic, and in fact, thetwo systems share no reasoning whatsoever. While thismethod should be able to find all of the label and uniterrors in a spreadsheet, it will not be able to combine thestructural data that is found in the labels of a spreadsheetto improve the dimension analysis.
We can say that this method allows UCheck anddimension inference access to both axes, however, none ofthe reasoning or error detection is shared between thesystems. This non-integration may case fewer errors to bedetected, but it will, at the very least, give a baseline withwhich to judge the integrated analysis methods.
5.2. LD Analysis followed by UCheck
In previous work [8] we have seen that some labelerrors were missed because some of the labels wereexclusively used for dimension analysis. As that systemwas designed to be simply an add on to the dimension
A B C D E F1 Car Miles Gallons MPG Total Gallons Miles Possible2 VW Bug 180 5 =B2/C2 12 =E2*D23 Camry 225 5 =B3/C3 10 =E3*D34 BMW 300 5 =B4/C4 15 =E4*D45 =B2+C3+B4 =MAX(F2:F4)67891011
Label Error:The labels in the formula are not compatible
Dimension Error: Miles and Gallons can not be added
Fig. 7. Results of UCheck followed by dimension inference.
A B C D1 Product Price Items Sold Total $2 Apples (1 Pound) $1.50 50 $75.003 Oranges (1 Pound) $2.25 23 $51.754 Bananas (1 Bunch) $2.00 70 $140.005 Cranberries (8 Grams) $0.50 15 $7.506
Fig. 8. Axes example for UCheck+.
C. Chambers, M. Erwig / Journal of Visual Languages and Computing 21 (2010) 249–262 257
inference tool, this was not an immediate concern.However, it would certainly be preferable to be able todetect as many errors as possible.
The primary weakness of integrated analysis is the lackof access to the complete structural information of aspreadsheet, which can cause some label errors to goundetected. An easy way to alleviate this problem is tofirst run integrated analysis to find label and unit errors.Finally, run UCheck on the spreadsheet. Running UCheckseparately allows the system to detect label errors thatmay not have been detected by the limited label checkingof LD analysis. It should be noted that this may result inmore false positives or errors being reported multipletimes.
The results from this combination could be displayedin a similar fashion as in the system described in theprevious section, with cells containing errors from bothLD analysis and UCheck displaying two error messages.
We can say that this method allows LD analysis andUCheck access to both axes. As LD analysis alreadyincorporates dimensions and labels in a integratedreasoning method, the additional label checking doesnot need to be integrated and can remain independent.
5.3. UCheck enhanced with dimension inference
UCheck Enhanced with Dimension Inference (UCheck+
for short) is based on UCheck and uses dimensioninference to add some dimension checking. Previousresearch [8] has shown that the majority of dimensionsare found on only one axis. Specifically, only 128 out ofthe 567 tables in the investigated spreadsheets containeddimensions on more than one axis. It stands to reason thatonly one axis may be required to detect the majority ofdimension errors in spreadsheets.
UCheck+ allows UCheck to have access to both axes,and will grant dimension inference access to just one.Formulas will then be checked using a form of integratedreasoning accessing both labels and dimensions.
To explain UCheck+, Fig. 1 will be used as an example.In this sheet, all of the dimensions can be found on thehorizontal axis in row 1. For this particular method, row 1would become the dimension axis and the cells in thespreadsheet would have dimensions determined based onthe headers in this row. In this case the other axis, Column
A, does not contain dimensions so this problem is a rathersimple one and we can simply give labels to cells in thesame manner as UCheck.
Since UCheck has access to both axes, the labelsassigned now contain AND labels [12]. For example, inFig. 1 the label for B4 is now ‘‘Car[BMW]&Miles’’, and thedimension is ‘‘Miles’’. In the case of Fig. 1, UCheck+ wouldbe able to detect both of the errors. In the first error cell,D4, the dimensions of the cells being added are still notcompatible, and in the second, the inclusion of dimen-sions allows UCheck to loosen its rules on multiplication,and as the labels do not match, the error is detected.
In the case that dimensions exist on both axes, thesystem will choose the axis that affects the highestnumber of cells. Take for example Fig. 8, which shows aspreadsheet containing dimensions on both axes. In thehorizontal axis there are 2 cells containing a dimensionand in the vertical axis there are 3.
To determine how many cells are affected by each axiswe look at the cells each is a header for. For example, thecell A2 is a header for all the cells in row 2, or 3 in total.This is the case for every header in column A, so in totalthe cells A2, A3, and A5 affect 9 total cells. Looking at thehorizontal axis (row 1) we can see that the cells B1 and D1each affect 4 cells, meaning the entire axis affects 8 totalcells. Since the horizontal axis affects more cells in thiscase, we shall use this as the dimension axis.
5.4. Fully integrated analysis
The final modification is to use both axes to determineboth the labels and the dimensions. In LD analysis anyaxis that contained a unit of measurement is used todetermine units of measurement in the spreadsheet, and
06
19
4711
0
0
0 099
0
415
24152
Integrated System Integrated System
UCheck DimensionInference
UCheck DimensionInference
Fig. 9. System comparison: identified erroneous spreadsheets (left) and
total errors (right).
C. Chambers, M. Erwig / Journal of Visual Languages and Computing 21 (2010) 249–262258
any axis that does not have a unit of measurement is thenused to determine the labels in a spreadsheet.
While this method can be successful, it might ignoreuseful label information in some cases. However, by usingboth axes to determine the labels and dimensions of aspreadsheet we are able to use all the structural informa-tion that the label checking can provide without losingany dimension checking ability.
As an example, we will look at the cell B4 in Fig. 1. Infully integrated analysis the two axes are used to assignboth labels and dimensions. So this cell will have the label‘‘Car[BMW]&Miles’’ and the dimensions is ‘‘Miles’’. Shouldthe spreadsheet have dimensions on both axes, thedimensions would be combined via the method describedin [4].
To create this system the rules for integrated analysishave to be modified. Since the entire structural informa-tion of the spreadsheet is being used, the rules get a littlemore complex. For example, in each rule we now have tocheck to make sure that the label that is created iswell formed and that the dimensions are compatible.In addition we still check for errors using integratedreasoning.
6. Evaluation
We have extended the dimension inference tool withthe ability to perform automatic dimension analysis withlabel-based reasoning. This tool reuses the header analysisimplementation [13] of the UCheck tool [6] and is basedon the dimension inference tool presented in [4]. Inaddition we have created four modified systems, de-scribed in Section 5, that attempt to approach the problemin new ways. In this section we describe an evaluation ofall of these system to answer the following researchquestions.
RQ1: Which system performs best at detecting errors in
spreadsheets? Each of these systems has strengths andweaknesses that should become evident from the resultsof our evaluation. Will the results show one as being ableto detect more errors than others? Or will there be noclear delineation between the different analysis options?
RQ2: How do the systems handle false positives? Withthe combination of systems it stands to reason that thismay increase the number of false positives (or falsenegatives) that are reported. Will the systems show thesame number of false positives or will there be notabledifferences?
RQ3: Are both axes needed to detect unit of measurement
errors? In one combination we are limiting labels to onlyone axis. What effect will this have on detectingdimension errors? Will this make this method invalid orwill the improvement in detected label errors overshadowthe dimension errors that are no longer detected (if thereare any)?
6.1. Experiments
To answer these research questions we have employedthe EUSES spreadsheet corpus [11], which currently
contains 4498 spreadsheets collected from varioussources. Of these 4498 spreadsheets only 487 containboth dimensions and formulas. In previous work [8],dimension inference, LD analysis, and UCheck were run onall of these spreadsheets to determine how well eachsystem fared and how many errors each found. In theseresults only 83 of those 487 spreadsheets contained anyerrors, so it is to these sheets that we will limit ourexperiment, as these are the only sheets where any errorswere detected by the three systems.
To run our experiment we ran all of the systems onthese 83 spreadsheets. To verify the results from theprevious evaluation, UCheck, dimension inference, andthe original LD analysis were all run again. In addition tothese three methods, the four systems described inSection 5 were also run on these spreadsheets todetermine how effective they are at detecting errors andhow they compare to each other.
For RQ1 the results for each system are compared todetermine how many errors were detected and how manyeach system could not find. These numbers will show howwell the systems perform looking at specific errors, suchas label errors, as well as overall.
To investigate RQ2, the resulting spreadsheets werechecked to determine how many false positives, reportederrors that are not actually errors, were identified for eachsystem. To determine this, cells containing errors werelooked at and formulas investigated to determine if thereported error is indeed an error.
RQ3 is specifically looking at UCheck+, which is theonly system that limits dimension inference to one axis.How well this system performs will show whether it isimportant to use both axes when determining dimensionsor if only one is needed.
6.2. Results
The primary task for this evaluation was to run all ofthese systems on the subset of dimension sheets in theEUSES corpus. This process gave us the necessaryinformation to be able to determine which systemsperform better and which errors are not detected byothers.
To review and verify the data from previous work weagain ran dimension inference, UCheck, and the combined
C. Chambers, M. Erwig / Journal of Visual Languages and Computing 21 (2010) 249–262 259
system on these spreadsheets. Dimension inference wasable to detect 47 spreadsheets with a total of 241dimension errors, LD analysis was able to detect 77spreadsheets with errors and a total of 708 errors, andUCheck identified errors in 17 sheets with 151 totalerrors. The overlap of errors is shown in Fig. 9.
To determine false positives, the spreadsheets witherrors were looked at more closely. We found that LDanalysis produced 11 false positive instances that resultedin 78 total errors, whereas dimension inference found 7false positive instances that resulted in 49 total errors. The7 false positives of dimension inference were all inheritedby LD analysis. Of the 7 false positives, 6 were caused bylabel interpretation, and one was caused by incorrectheader inference. Of the additional 4 false positives in LDanalysis one was caused by label interpretation and 3 byincorrect header inference. We did not try to validate thespreadsheets manually, therefore we have no informationon false negatives.
In addition to the original three systems, we includedseveral modified systems as described in Section 5. Toanswer RQ1 and RQ2, the results have been compiled andare summarized in Table 3.
These results reveal the best system to be LD analysisfollowed by UCheck as it both detects the most errorswith a relatively few number of false positives. It shouldbe noted that the false positives are the same number asLD analysis, which demonstrates that this method did notgenerate any new false positives. The same cannot be saidfor the fully integrated analysis, which introduced 12 newfalse positives. However, it was able to find the secondmost number of errors amongst the systems.
The total number of errors and false positives is shownin graphical form in Fig. 10. As this chart shows, LDanalysis followed by UCheck is able to identify the mosterrors with a fairly small number of false positives. Thefirst four systems show a fairly significant drop off, whichmakes some sense considering that either they do nottake an integrated approach or they focus on label errorsmore than dimension errors, which is ill suited for thespreadsheets selected.
The results of UCheck+ show that limiting dimensionsto only one axis does make a significant difference in thenumber of errors that can be detected as there is asignificant decrease compared to LD Analysis. In generalwe can answer RQ3 and say that two axes are recom-mended, but probably not necessary to detect dimensionerrors. However, they are extremely useful.
Table 3System error results.
Method Sheets with errors
UCheck 17
Dimension inference 47
LD analysis 77
UCheck then dimension inference 64
LD analysis then UCheck 83
UCheck+ 58
Fully integrated analysis 83
6.3. Discussion
These results show some interesting trends. Particu-larly interesting is the strength of the LD Analysisfollowed by UCheck which was able to detect errors inthe largest number of sheets as well as the largest totalnumber of errors. Inspecting the results more closely itcan be seen that in a few cases there are label errors thatare reported twice. Specifically, there are 52 label errorsthat were found that were detected by both the LDanalysis and by UCheck. While this is not a problem, andcould even be considered a feature, it could potentially beconfusing to users who may think that there are twoerrors in the cell.
The other strong system, as was expected, was the fullyintegrated system, however, it should be noted that thissystem reports the highest number of false positives andwhile it is able to detect a high number of errors, this increasein false positives could cause confusion amongst users.
Many of these false positives are due to problemsgetting the labels to correctly interact with the dimen-sions. In some cases the system will even miss errors thatthe combined system caught due to error propagationnegating the result.
In general these false positives are caused by twoprimary problems, an incorrect label interpretation andincorrect header inference. Label interpretation errorsoccur when a label contains a substring that the toolidentifies as a dimension, but it is not. One example of thisoccurred when a spreadsheet contained a list of names,one of which was ‘‘Johnson, Samuel M’’. The inclusion of‘‘M’’, caused the tools to interpret this as the dimension‘‘Meters’’, which caused a false positive to be reported.This type of error is hard to detect, but a combination ofmanual and automatic methods, discussed in Section 8,may have some success.
The false positives cause by incorrect header inferenceoccur when headers are identified for cells incorrectly. If aheader is assigned incorrectly and it contains a dimensionit can create problems for the system. There are twopossible solutions. The first is the combination of manualand automatic methods that would allow users to changethe dimensions assigned by the system. The second is theimplementation of header patterns. Identified headerpatterns could be matched to a spreadsheet and give abetter idea of how the headers should be assigned. Thiscould reduce the number of incorrectly assigned headersand false positives.
Total errors False positives
151 0
241 49
708 78
392 49
859 78
454 25
785 90
151 192
343429
630695
781
049
49
25
7890
78
0
100
200
300
400
500
600
700
800
900
1000Errors False Positives
UCheck DimensionInference
UCheck;DimensionInference
UCheck+ LDAnalysis Fully IntegratedAnalysis
LD Analysis;UCheck
Fig. 10. Results of the different systems.
C. Chambers, M. Erwig / Journal of Visual Languages and Computing 21 (2010) 249–262260
The approach of simply running UCheck and dimen-sion inference sequentially was rather weak. This systemwas unable to actually detect any combined errors. It did,however, successful find all the errors that UCheck anddimension inference found, which is encouraging. Un-fortunately, it still lags far behind most of the othersystems.
One of the more interesting results was that ofUCheck+, which limited dimension inference to one axis.The results from this method indicate that while it wasable to detect all of the potential label errors, it was notable to catch many of the dimension or integrated errors.The strength of UCheck+ is the full label checking, whichmay have gone unused in this experiment as there areonly 17 sheets containing label errors in the 83 used inthis experiment. In general these results show howimportant two axes are to finding all of the dimensionand integrated errors.
It could be noted that previous studies [2] report amuch higher failure rate than any of the tools discussed inthis paper, even up to 90%. The most effective tooldescribed in this paper reports errors in only 17% of thespreadsheets investigated. This low failure rate is causedby the singular focus of these tools, as they are onlylooking for two particular kind of errors, label anddimension, instead of focusing on all possible errors inspreadsheets. Often these high error rates are caused byerrors such as data entry mistakes which are principallyquite hard to detect for any tool.
7. Related work
The system that is most closely related to our work isSLATE [5], which separates the unit from the object ofmeasurement and defines semantics for spreadsheets sothat the unit and the object of measurement areconsidered.
SLATE is the only system that attempts to measureboth labels and dimensions, and it does this by assigningthree attributes to every expression: a value, a unit, and alabel. The value is what is contained in a cell. Units, suchas meters, kilograms, and seconds, capture informationabout the scale at which the measurement was taken andthe dimensions of the measurement. The final attribute,labels, defines characteristics of the objects of measure-ment. For example, a cell referring to 25 pounds of applesmight read ‘‘25 lbs (apples)’’.
For this system to work correctly it requires a user toannotate a spreadsheet, which involves adding the unitsand labels to every non-formula cell. The system thenanalyzes the formula cells and determines the unit andlabel for these cells. This information is then displayed inthe cell. One of the primary problems with this approachis that is does not actually detect errors, it simply displayslabels and units for each cell.
The results when SLATE is run on the examplespreadsheet used in Section 2 are shown in Fig. 11. Whilethe results do not immediately indicate that there is anerror, through investigation a user could determine thepresence of two. The first is in cell C4, (D4 in Fig. 1), has adifferent dimension the other cells in the column, (Miles,Gallons) compared to Miles. This is indicative of an errorand will hopefully draw the attention of the user. Withrespect to the second error, SLATE would infer a properdimension, Miles, together with a label (VW Bug, Camry).This label, which contains the label of two different cars,should illustrate to the user that the cell contains an error.SLATE does not specify what the errors are or what causesthem, but the different labels or dimensions may beenough to make a user curious about the possible reasonsand cause a deeper investigation of erroneous cells.
Another related system is XeLda [3] which is designedto check a spreadsheet for units of measurement, such asmeters, grams, and seconds. Much like SLATE, XeLdarequires the user to annotate the units for all of the cells ina spreadsheet. Note that this does not only include data
A B C D E1 Miles Gallons MPG Total Gallons Miles Possible2 180 (Miles, VW Bug) 5 (Gallons, VW Bug) =A2/B2 (MPG, VW Bug) 12 (Gallons, VW Bug) =D2*C3 (Miles, (VW Bug, Camry))3 225 (Miles, Camry) 5 (Gallons,Camry) =A3/B3 (MPG, Camry) 10 (Gallons,Camry) =D3*C3 (Miles, Camry)4 300 (Miles, BMW) 5 (Gallons, BMW) =A4+B4 ((Miles,Gallons), BMW) 15 (Gallons,BMW) =D4*C4 ((Miles, Gallons^2), BMW)5 =Sum(B2:B5)(Gallons, Car) =MAX(E2:E4) ((Miles,Gallons^2), Car)6
Fig. 11. Results of slate on example spreadsheet.
C. Chambers, M. Erwig / Journal of Visual Languages and Computing 21 (2010) 249–262 261
cells, but also all formula cells. While analyzing aspreadsheet XeLda checks the annotated units againstthe results of formulas to insure correctness.
The advantage of the XeLda approach is that it workswell independently of the spreadsheet layout, whereasour approach depends on header and label interpretation.On the other hand, XeLda’s disadvantage is the hugeamount of extra work required by the user whereas ourapproach is fully automatic. Moreover, XeLda cannot inferconversion factors.
With respect to the error discussed in the Section 2that requires a combined label and dimension analysis forits discovery, XeLda would not be able to catch this erroras it depends entirely on units of measurement annotatedby the user.
While we cannot be certain, it seems likely that a userwould annotate F2 with ‘‘Miles’’, E2 with ‘‘Gallons’’, andD3 with ‘‘Miles/Gallon’’. Thus the resulting unit ofmeasurement of the formula would be ‘‘Miles’’, whichmatches the annotation of the cell, F2. So no error wouldbe reported.
UCheck [6] was designed to check for labels in aspreadsheet, and as such it does not handle dimensions.UCheck works by inferring headers for all the cells in aspreadsheet, based on the structure and content of thespreadsheet. Once these headers are inferred, the systemderives labels for the cells and checks for label errors.
While UCheck works completely automatically, someother related approaches require the user to annotate thespreadsheet with label information [12,7]. The sameadvantages and disadvantages that we have mentionedfor XeLda apply here as well.
8. Conclusions and future work
In previous work [8] we have introduced a system thatintegrates label-based reasoning with dimension analysis.This integration strengthened the system considerablywith the evaluation showing almost a twofold increasein the number of errors that the system is able to detect.This system was designed to be able to find label anddimension errors, as well as any errors that could bedetected with integrated reasoning.
While the individual systems, UCheck [6] and dimen-sion inference [4] proved to be useful tools for finding aspecific types of errors, the evaluation shown in this papermakes clear that by integrating labels and dimensions asystem can detect more errors and can potentially bemore useful to the user.
When the results of the individual systems, or even thesystem where UCheck is run followed by dimension
inference, it is clear that without some way to integratethe information there are errors that go undetected. LDanalysis worked well as an extension to dimensioninference, and as a system it is strong, however, it doeshave the weakness of not using all of the structuralinformation that can be given through labels.
By evaluating several different options, we haveidentified two that not only integrate labels and dimen-sions, but also are able to detect the majority of errors.The most effective system is LD analysis followed byUCheck. This system is able to get all of the benefits ofintegrated reasoning, through LD analysis, as well as thefull label checking, through UCheck, that the originalsystem lacked.
The one type of combination that was not explored isthat of the manual and automatic approaches. Thestrength of automatic approaches lay in their ability torun independent of any information provided by the user.However, this can often be inflexible and potentiallyfrustrating to users if the system infers somethingincorrectly. By incorporating manual approaches andallowing users to provide additional or correctionalannotations the system could potentially become andeasier to use and stronger application. Such a combinationcould be explored in future work.
References
[1] C. Scaffidi, M. Shaw, B. Myers, Estimating the numbers of end usersand end user programmers, in: IEEE Symposium on VisualLanguages and Human-Centric Computing, IEEE Computer Society,2005, pp. 207–214.
[2] K. Rajalingham, D. Chadwick, B. Knight, D. Edwards, Quality controlin spreadsheets: a software engineering-based approach to spread-sheet development, 33rd Hawaii International Conference onSystem Sciences, vol. 4, 2000, pp. 1–9.
[3] T. Antoniu, P.A. Steckler, S. Krishnamurthi, E. Neuwirth, M. Felleisen,Validating the unit correctness of spreadsheet programs, in: 26thIEEE International Conference on Software Engineering, IEEEComputer Society, 2004, pp. 439–448.
[4] C. Chambers, M. Erwig, Dimension inference in spreadsheets, in:IEEE International Symposium on Visual Languages and Human-Centric Computing, 2008, pp. 123–130.
[5] M.J. Coblenz, A.J. Ko, B.A. Myers, Using objects of measurement todetect spreadsheet errors, in: VLHCC ’05: Proceedings of the 2005IEEE Symposium on Visual Languages and Human-CentricComputing, IEEE Computer Society, Washington, DC, USA, 2005,pp. 314–316.
[6] R. Abraham, M. Erwig, UCheck: a spreadsheet unit checker for endusers, Journal of Visual Languages and Computing 18 (1) (2007)71–95.
[7] Y. Ahmad, T. Antoniu, S. Goldwater, S. Krishnamurthi, A type systemfor statically detecting spreadsheet errors, 18th IEE InternationalConference on Automated Software Engineering, 2003, pp.174–183.
[8] C. Chambers, M. Erwig, Combining spatial and semantic labelanalysis, in: VLHCC ’09: Proceedings of the 2009 IEEE Symposiumon Visual Languages and Human-Centric Computing (VL/HCC), IEEEComputer Society, Washington, DC, USA, 2009, pp. 225–232.
C. Chambers, M. Erwig / Journal of Visual Languages and Computing 21 (2010) 249–262262
[9] J. Lawrence, R. Abraham, M.M. Burnett, M. Erwig, Sharing reason-ing about faults in spreadsheets: an empirical study, in: IEEE
International Symposium on Visual Languages and Human-CentricComputing, 2006, pp. 35–42.
[10] National Institute of Standards and Technology, The NIST Guide forthe Use of the International System of Units, 2010. /http://www.nist.gov/physlab/pubs/sp811/index.cfmS.
[11] M. Fisher, G. Rothermel, The EUSES spreadsheet corpus: a sharedresource for supporting experimentation with spreadsheetdependability mechanisms, in: WEUSE I: Proceedings of the First
Workshop on End-user Software Engineering, ACM, New York, NY,USA, 2005, pp. 1–5.
[12] M. Erwig, M.M. Burnett, Adding apples and oranges, FourthInternational Symposium on Practical Aspects of DeclarativeLanguages, Lecture Notes in Computer Science, vol. 2257, 2002,pp. 173–191.
[13] R. Abraham, M. Erwig, Header and unit inference for spread-sheets through spatial analyses, in: IEEE International Symposiumon Visual Languages and Human-Centric Computing, 2004, pp.165–172.