This article was downloaded by: [Universite Laval] On: 05 September 2013, At: 23:00 Publisher: Routledge Informa Ltd Registered in England and Wales Registered Number: 1072954 Registered office: Mortimer House, 37-41 Mortimer Street, London W1T 3JH, UK Journal of the American Planning Association Publication details, including instructions for authors and subscription information: http://www.tandfonline.com/loi/rjpa20 Reasons for Living in a Transit-Oriented Development, and Associated Transit Use Hollie Lund Published online: 26 Nov 2007. To cite this article: Hollie Lund (2006) Reasons for Living in a Transit-Oriented Development, and Associated Transit Use, Journal of the American Planning Association, 72:3, 357-366, DOI: 10.1080/01944360608976757 To link to this article: http://dx.doi.org/10.1080/01944360608976757 PLEASE SCROLL DOWN FOR ARTICLE Taylor & Francis makes every effort to ensure the accuracy of all the information (the “Content”) contained in the publications on our platform. However, Taylor & Francis, our agents, and our licensors make no representations or warranties whatsoever as to the accuracy, completeness, or suitability for any purpose of the Content. Any opinions and views expressed in this publication are the opinions and views of the authors, and are not the views of or endorsed by Taylor & Francis. The accuracy of the Content should not be relied upon and should be independently verified with primary sources of information. Taylor and Francis shall not be liable for any losses, actions, claims, proceedings, demands, costs, expenses, damages, and other liabilities whatsoever or howsoever caused arising directly or indirectly in connection with, in relation to or arising out of the use of the Content. This article may be used for research, teaching, and private study purposes. Any substantial or systematic reproduction, redistribution, reselling, loan, sub-licensing, systematic supply, or distribution in any form to anyone is expressly forbidden. Terms & Conditions of access and use can be found at http:// www.tandfonline.com/page/terms-and-conditions
Transcript
This article was downloaded by: [Universite Laval]On: 05 September 2013, At: 23:00Publisher: RoutledgeInforma Ltd Registered in England and Wales Registered Number: 1072954 Registered office: Mortimer House,37-41 Mortimer Street, London W1T 3JH, UK
Journal of the American Planning AssociationPublication details, including instructions for authors and subscription information:http://www.tandfonline.com/loi/rjpa20
Reasons for Living in a Transit-Oriented Development,and Associated Transit UseHollie LundPublished online: 26 Nov 2007.
To cite this article: Hollie Lund (2006) Reasons for Living in a Transit-Oriented Development, and Associated Transit Use,Journal of the American Planning Association, 72:3, 357-366, DOI: 10.1080/01944360608976757
To link to this article: http://dx.doi.org/10.1080/01944360608976757
PLEASE SCROLL DOWN FOR ARTICLE
Taylor & Francis makes every effort to ensure the accuracy of all the information (the “Content”) containedin the publications on our platform. However, Taylor & Francis, our agents, and our licensors make norepresentations or warranties whatsoever as to the accuracy, completeness, or suitability for any purpose of theContent. Any opinions and views expressed in this publication are the opinions and views of the authors, andare not the views of or endorsed by Taylor & Francis. The accuracy of the Content should not be relied upon andshould be independently verified with primary sources of information. Taylor and Francis shall not be liable forany losses, actions, claims, proceedings, demands, costs, expenses, damages, and other liabilities whatsoeveror howsoever caused arising directly or indirectly in connection with, in relation to or arising out of the use ofthe Content.
This article may be used for research, teaching, and private study purposes. Any substantial or systematicreproduction, redistribution, reselling, loan, sub-licensing, systematic supply, or distribution in anyform to anyone is expressly forbidden. Terms & Conditions of access and use can be found at http://www.tandfonline.com/page/terms-and-conditions
Reasons for Living in a Transit-OrientedDevelopment, andAssociated Transit Use
Hollie Lund
Transit oriented development (TOD) is generally defined as moderateto high-density residential development that also includes employmentand shopping opportunities and is located within easy walking distance
of a major transit stop (Parker, McKeever, Arrington, & Smith-Heimer, 2002).There are now over 100 TODs in the United States, most fairly recent. (Cerveroet al., 2004). Planners hope TODs will encourage transit use, increase housingopportunities, promote walking and bicycling, and facilitate neighborhoodrevitalization. As this article reveals, new residents of TODs share those expec-tations. While some are moving to TODs for improved transit access, others aredrawn to amenities such as lower-cost housing, local shops, or the overall livingenvironment.
This article uses surveys of 605 people who moved into a TOD withinwalking distance of a light, heavy, or commuter rail station in the San FranciscoBay Area, Los Angeles, or San Diego within the past 5 years. It addresses threeinterrelated questions:
1. Who is locating in TODs and how do they differ from the generalpopulation?
2. What factors lead these households to locate in TODs, and do differentfactors influence different types of households?
3. Given the characteristics and preferences of new TOD residents, what arethe implications for transit use? Are people who say they chose the TODfor its access to transit more likely to use transit service than those whoreport moving there for other reasons?
Literature Review
While the literature clearly demonstrates that a household’s choice of resi-dential location is directly related to its members’ attitudes and lifestyle prefer-ences, evidence is less clear on how much individuals’ daily behaviors, includingtravel, are influenced by those attitudes and preferences versus the opportunitiesprovided by their residential location.
357
Cities and regions throughout the U.S. arepromoting transit-oriented development(TOD) near rail stations to increase bothtransit use and the number and range ofhousing opportunities. This paper reportsthe results of a survey of households whomoved to TODs within the last 5 years,finding a wide range of motivations.Only about one-third of respondentsreported access to transit as one of thetop three reasons for choosing to live in aTOD. They were equally or more likelyto cite lower housing cost or the qualityof the neighborhood. Those who reportedthat their choice of residence locationwas motivated in part by access to transitwere more likely to use transit than thosewho did not.
Hollie Lund ([email protected])has been teaching urban and regionalplanning at California State PolytechnicUniversity in Pomona since 2001 andis now on a leave of absence to teachat Portland State University. She isinterested in exploring the ways thatpeople respond to changing environ-ments, particularly in small towns andcommunities.
Personal Attitudes, Physical Environments,and Travel Behavior
Numerous travel behavior studies explore the complexrelationships among attitudes, environments, and behavior.Recently, these include Bagley and Mokhtarian (2002);Boarnet and Sarmiento (1998); Cao, Handy, and Mokh-tarian (2006); Kitamura, Mokhtarian, and Laidet (1997);Handy, Cao, and Mokhtarian (2006); Lund (2003); and,in the area of social and environmental psychology,Hunecke, Blobaum, Matthies, and Hoger (2001); andCollins and Chambers (2005). Each of these studies foundpersonal attitudes and values such as preferences for walking(Lund, 2003), living in walkable neighborhoods (Cao etal., 2006), or favoring environmental preservation (Kitamuraet al., 1997), to be related to individuals’ travel decisions.Some studies (Bagley & Mokhtarian, 2002; Kitamura etal., 1997; Lund, 2003) found attitudes and values to bemore powerful than community design in explaining travelbehavior, while others (Cao et al., 2006; Naess, 2005;Schwanen & Mokhtarian, 2005), found the physical envi-ronment to be the strongest influence on travel behavior.Schwanen and Mokhtarian (2005) also concluded thatattitude and environment may interact differently indifferent contexts.
Some researchers have asked survey respondents abouttheir travel behavior before moving and compared it toreported travel behavior after moving. This quasi-experi-mental approach has been used recently by Handy, Cao,and Mokhtarian (2006); Naess (2005); and Lund, Cervero,and Willson (2004). All three studies had difficulty estab-lishing strong linkages between changes in neighborhoodenvironment and longer-distance travel such as rail com-muting (Lund et al., 2004), driving (Handy et al., 2006),and overall amount of travel (Naess, 2005). Handy et al.(2006) did, however, find a significant relationship towalking, and Naess (2005) found that changes in travelbehavior did become significant once people moved acertain distance from the downtown core.
Lifestyle Preferences and the ResidentialLocation Decision
While the studies noted above have brought attentionand new understanding to the relationship between lifestylepreferences and travel behavior, current research still relieson a priori assumptions about households’ motivationsfor choosing where to live, leaving significant gaps in ourunderstanding. To what extent is a household’s locationchoice actually guided by their attitudes and lifestyle pref-erences? In a detailed study of the link between householdpreferences and residential location decisions, Jarvis (2003)
found that preferences and residential locations oftenmatch up poorly. Drawing on household interviews con-ducted in Seattle, San Francisco, and Portland (Oregon),the study concluded that while many households stated apreference for compact, urban living, their location choicesor lifestyle behaviors often did not reflect this. These find-ings are further supported by Schwanen and Mokhtarian(2004, 2005).
According to both Jarvis (2003) and Schwanen andMokhtarian (2004), attitudes and preferences are mostlikely to play an important role in the residential locationdecision when the trade-offs are not too great. A householdmay prefer the transport options of an urban environment,for instance, but may not be willing to forego the qualityof schools or recreational opportunities available in moresuburban areas. Rather than make assumptions about house-holds’ motivations for choosing residence locations, I explorethem using stated preference methods.
Research Design and Data Collection
The data presented in this paper were collected aspart of two larger studies on travel behavior in CaliforniaTODs reported in Lund, Cervero and Willson (2004) andLund and Willson (2005). In both studies we surveyedhouseholds to collect data on factors that influenced theirchoices to live in TODs as well as detailed data on up tothree main trips. The analyses in this article focus solely ona subset of households who had recently moved into TODs.By asking them about factors that influenced their pastchoice of residence location rather than asking their locationpreferences under hypothetical circumstances, I was ableto better reflect what they would do when faced with realchoices (as in Jarvis, 2003; Kim, Pagliara, & Preston, 2005;Schwanen & Mokhtarian, 2004). I also examined therelationship between factors influencing this choice andtheir trips by transit to discover whether those people whoindicated that they chose the TOD for its transit accesswere more likely to use transit than those who reportedmoving there for other reasons.
Data were collected in 2003 and 2004 by first identify-ing all of the transit-oriented developments within 1⁄4 mile(or in a few cases within 1⁄2 mile)1 actual walking distanceof ticket-purchase booths at light, heavy, or commuter railstations in the San Francisco Bay Area, Los Angeles, andSan Diego.2 The studies excluded developments that werewhat Cervero, Ferrell, and Murphy (2002) termed “transit-adjacent,” meaning we omitted those that lacked “anyfunctional connectivity to transit, whether in terms of land-use composition, means of station access, or site design”
358 Journal of the American Planning Association, Summer 2006, Vol. 72, No. 3
Dow
nloa
ded
by [
Uni
vers
ite L
aval
] at
23:
00 0
5 Se
ptem
ber
2013
(p. 6). To determine transit orientation, graduate planningstudents conducted site visits, eliminating developmentsfor which walking routes to the nearest rail stations werevisually or physically impeded.
Within each selected residential building in the stationareas listed in Table 1 we distributed surveys, instructionletters, and pre-addressed, postage-paid envelopes to alloccupied housing units. In some cases we also distributedletters of support from local officials.
Out of 6,225 surveys distributed to residential unitsacross the two studies, a total of 826 were successfully com-pleted and returned, for a response rate of 13.3%. A total of605 of these were recent movers: 244 from the Bay Area,
212 from the Los Angeles region, and 149 from the SanDiego region. While a higher response rate would haveclearly been desirable, Table 2, which compares the surveyrespondents to the population of the surrounding areas,reveals few notable differences. Compared to the populationof their surrounding cities, TOD residents were less likely tobe of Hispanic origin or to fall into the lowest income cate-gory. They were also more likely to be office/professionalworkers. Survey respondents were no more likely than thesurrounding population to live without an automobile.
Table 2 also compares the characteristics of respondentswho had moved within the previous 5 years to longer-termTOD residents. The only notable difference between thesepopulations was the mean age, with newer residents beingyounger on average by almost 15 years (35 years comparedto 49) suggesting that individuals move into TODs intheir thirties and then remain there.
Residential Location FactorsEach survey respondent was asked to indicate the
“three most important factors” considered in their decisionto live in a TOD. Eight possible responses were provided:cost of housing, type or quality of housing, quality of localschools, quality of neighborhood, access to shops and ser-vices, access to transit, access to highway, and recreationalopportunities. Respondents were also given the option offilling in an “other” category, but these responses are notincluded in the regression models.
Although the survey instrument asked respondents torank their top three factors, a large number of respondentssimply checked three factors without providing any rank-ing. So as not to lose these data, all responses (ranked andunranked) were coded as dummy variables (1 = yes, 0 = no).A small number of respondents provided more than threefactors. In these cases I coded the factors as missing values,meaning they were removed from the analysis.
In order to minimize problems with recall, the analysispresented in this article focuses solely on those respondentswho reported moving to their current residence no morethan 5 years prior to this survey. Those who failed to reportlength of residency were dropped from the sample.
Results
Table 3 presents the residential location choice factorsamong TOD residents, in total and by region. (Note thatpercentages reflect the share of responses for each category,and thus will not add to 100, as each respondent wasallowed to identify up to three main residential locationfactors.) Three factors clearly stand out as important to
Lund: Reasons for Living in a Transit-Oriented Development and Associated Transit Use 359
Table 1. Surveyed sites, by region and rail system.
BuildingsRegion/rail system Rail station surveyed
Bay AreaBART (Heavy) El Cerrito Del Norte 1
Fremont 1Hayward 1Pleasant Hill 4South Hayward 1Union City 1
San Jose VTA (Light) Ohlone Chynoweth 1Caltrain (Commuter) Broadway 1
San Antonio 1Palo Alto 1
Los AngelesMetro Red Line (Heavy) Hollywood/Vine 1
Hollywood/Western 1North Hollywood 1
Metro Blue Line (Light) Long Beach Transit Mall 1Pacific at 5th Street 1
Metro Gold Line (Light) Allen 3Del Mar 4Fillmore 4Highland Park 1Lake 4Memorial Park 2Mission 10Sierra Madre 6SW Museum 3
Metrolink (Commuter) Fullerton 1
San DiegoSan Diego Trolley (Light) Amaya Drive 1
Barrio Logan 1Fenton Parkway 1Hazard Center 1
Coaster (Commuter) Carlsbad Poinsettia 1
Dow
nloa
ded
by [
Uni
vers
ite L
aval
] at
23:
00 0
5 Se
ptem
ber
2013
explaining why people choose to live in TODs: type orquality of housing (reported by 61%); cost of housing (re-ported by 54%); and quality of neighborhood (reported by52%). Type or quality of housing was most frequently citedin the San Diego region (77%, compared to 55% and 56%in the other regions); quality of neighborhood was mostfrequently cited in the Los Angeles region (59%, comparedto 47% and 50%); and cost of housing was most frequentlycited in the Bay Area and the Los Angeles region (58% and57%, respectively, compared to 44% in San Diego).
Two factors also stand out for being cited so infre-quently: quality of local schools was reported to be a majorfactor by just 5% of all respondents, and recreationalopportunities were cited by just 6% (with no statisticallysignificant variations across the three regions.) I attributethis to the fact that TODs rarely incorporate schools andoften have limited access to recreational opportunities,though it may also reflect the high proportion of childlesshouseholds among survey respondents.
360 Journal of the American Planning Association, Summer 2006, Vol. 72, No. 3
Table 2. Characteristics of survey respondents and surrounding populations.
Survey respondents
Moved to TOD Moved to TODin past 5 years over 5 years ago Surrounding
N = 605 N = 221 population1
Mean age (years) 35 49.3 35.9
Female (%) 54.82 54.5 50.1
Race or ethnicity (%)White, non-Hispanic 61.1 62.8 53.5Hispanic or Latino 11.1 8.7 38.6African American 4.2 4.1 9.5Asian or Pacific Islander 19.6 22.7 15.5Other 4.0 1.7 21.5
Notes:1. Data for “surrounding population” are compiled from the 2000 U.S. Census and reflect the values for all localities in which survey data were
collected, weighted to reflect the number of surveys received from each locality.2. Percentages are reported for valid responses only, and do not include missing values.3. Income categories were as follows:
Surveys CensusLowest $30,000 or less $34,999 or lessMiddle $30,001–$100,000 $35,000–$99,999Highest Over $100,000 $100,000 or more
Dow
nloa
ded
by [
Uni
vers
ite L
aval
] at
23:
00 0
5 Se
ptem
ber
2013
The survey captured three types of transportationaccess: access to transit, access to shops and services (e.g.,walking opportunities), and access to highways. Amongthese factors there was significant, and notable, regionalvariation. Transit access was reported to be a major factorby 52% of respondents in the Bay Area, but still came inthird there, after housing cost (58%) and housing type/quality (54%). Quality of neighborhood was given as amain reason almost as frequently as transit access (47%compared to 52%). In other words, transit access was animportant residential location factor in the Bay Area, buthousing and neighborhood characteristics were just asimportant. Within the San Francisco area, Figure 1 revealsthat transit access was a predominant location factor only
along the heavy rail lines of the BART system. This is likelybecause BART is part of an extensive transit network, thusproviding numerous transit connections and many possibledestinations via transit.
Respondents in the Los Angeles region were morelikely to choose to live in a TOD for highway access thanfor transit access (21.2 and 19.3%, respectively). And in SanDiego, highway access and transit access were cited withnearly identical frequencies (25.0 and 24.8%, respectively).In both regions, more than 40% of respondents reported“access to shops and services” as a top-three reason forchoosing their current residential location. This means thatthey were seeking shorter trips to nonwork destinations,whether by automobile or foot.
Lund: Reasons for Living in a Transit-Oriented Development and Associated Transit Use 361
Figure 1. Share of respondents in five Bay Area rail station areas giving “access to transit” as one of three main reasons for choosing to live in a TOD.
61.5%55.3%
63.6%
22.2%
34.9%
0%
100%
BART:Pleasant Hill
BART:South Alameda
BART:El CerritoDel Norte
San Jose VTA(Light Rail)
Caltrain(Commuter)
Bay Area Sub-Region
Table 3. Reasons for choosing to live in a TOD: percentages and ranks.
Overall All sites Bay Area Los Angeles San Diegorank Reason (N=605) (N=244) (N=212) (N=149)
1 Type or quality of housing 60.5% 54.5% (2nd) 55.7% (3rd) 77.2% (1st)2 Cost of housing 54.0% 58.2% (1st) 56.6% (2nd) 43.6% (3rd)3 Quality of neighborhood 51.7% 46.7% 59.0% (1st) 49.7% (2nd)4 Access to shops, services 35.4% 25.0% 42.5% 42.3%5 Access to transit 33.9% 52.0% (3rd) 19.3% 24.8%6 Access to highway 22.0% 20.5% 21.2% 25.0%7 Other 7.6% 5.5% 10.5% 4.1%8 Recreational opportunities 6.3% 6.6% 7.1% 4.7%9 Quality of local schools 5.3% 7.4% 4.7% 2.7%
I used binary logistic regression analysis to predict theprobability that a survey respondent would cite a particularfactor as one of their household’s top three reasons forchoosing to live in a TOD. I modeled only the mostcommonly reported factors: cost of housing, type orquality of housing, quality of neighborhood, access toshops and services, and access to transit, coding each as adichotomous variable (1 = yes, 0 = no). I used the follow-ing, self-reported, predictor variables (or covariates) gender(1 = female, 0 = male), age, approximate household income,and the number of children (under 16 years) in the house-hold. I also included dummy variables (1 = yes, 0 = no)indicating whether sites were located in the San FranciscoBay Area or the Los Angeles region in order to account forregional variations between the Bay Area with its longerhistory of transit-oriented growth, the Los Angeles regionwith its highly dispersed development pattern, and themore concentrated but still auto-oriented region of SanDiego. I dropped age, which proved to be insignificant,from all but one of the final models. A dummy variableI initially included for “employment in an office or pro-fessional occupation” was removed after partial correlationanalysis revealed a high level of collinearity with householdincome.
Tables 4 through 7 show the resulting models predict-ing the likelihood that a respondent reported each locationfactor as one of their top three reasons for choosing to livein a TOD. The statistical power of each of the four models(based on the Chi-Square statistics and corresponding p -values) is highly significant.
Cost of Housing. Lower-income households were morelikely to consider cost of housing in deciding to live in aTOD (p < 0.01), as were residents of either the San Fran-cisco Bay Area or the Los Angeles region as opposed to SanDiego (p < 0.01; see Table 4). Since the model controls forincome, this could indicate that housing is more affordablein San Diego, but the California Association of Realtorscalculated that only 9% of households in San Diego couldafford a median-priced home, compared to 15% in LosAngeles and 12% in the Bay Area in 2005 (California Asso-ciation of Realtors, 2006). Two other possibilities are thatthe price of TOD housing in San Diego is the same as otherhousing in the region, while it is lower in San Francisco andLos Angeles, or that San Diego TOD residents particularlyvalued other amenities.
Quality of the Living Environment. Although clearlydistinct, both “type or quality of housing” and “qualityof neighborhood” relate to the quality of the living envi-ronment and both have similar relationships to the pre -dictor variables. Thus, Table 5 shows a model for which
362 Journal of the American Planning Association, Summer 2006, Vol. 72, No. 3
Table 4. Logistic regression predicting “Cost of housing” as one of threemain reasons for choosing to live in a TOD.
OddsPredictor variables B Wald Signif. ratio
Number of children under 16 0.19 1.76 1.20Approx. household income −0.19 17.21 ** 0.82Resides in SF Bay Area 0.71 10.27 ** 2.03Resides in LA region 0.68 8.70 ** 1.97
Model summaryN 577 (df = 4)Chi-Square 29.33Significance **
Note:Approximate household income categories: 1 = $15,000 or less; 2 = $15,001–$30,000; 3 = $30,001–$45,000; 4 = $45,001–$60,000; 5 = $60,001–$75,000; 6 = $75,001–$100,000; 7 = $100,001–$150,000;8 = $150,001 and over
*p < 0.05 **p < 0.01
Table 5. Logistic regression predicting “Type or quality of housing” or“Quality of neighborhood” as one of three main reasons for choosing tolive in a TOD.
OddsPredictor variables B Wald Signif. ratio
Number of children under 16 0.15 0.53 1.16Age of respondent −0.04 16.82 ** 0.97Approx. household income 0.12 3.53 1.13Resides in SF Bay Area −1.04 9.81 ** 0.35Resides in LA region −0.39 1.18 0.68
Model summaryN 520 (df = 5)Chi-Square 28.97Significance **
Note:Approximate household income categories: 1 = $15,000 or less; 2 = $15,001–$30,000; 3 = $30,001–$45,000; 4 = $45,001–$60,000; 5 = $60,001–$75,000; 6 = $75,001–$100,000; 7 = $100,001–$150,000;8 = $150,001 and over
*p < 0.05 **p < 0.01
Dow
nloa
ded
by [
Uni
vers
ite L
aval
] at
23:
00 0
5 Se
ptem
ber
2013
these two factors were combined. Younger respondents(p < 0.01) were more likely to cite one or both of theselocation factors as were respondents in the Los Angelesand San Diego regions. This may indicate demand thatexceeds the supply of attractive urban environments inthese regions, or simply that other factors, including thecost of housing, are less important in these regions than inSan Francisco.
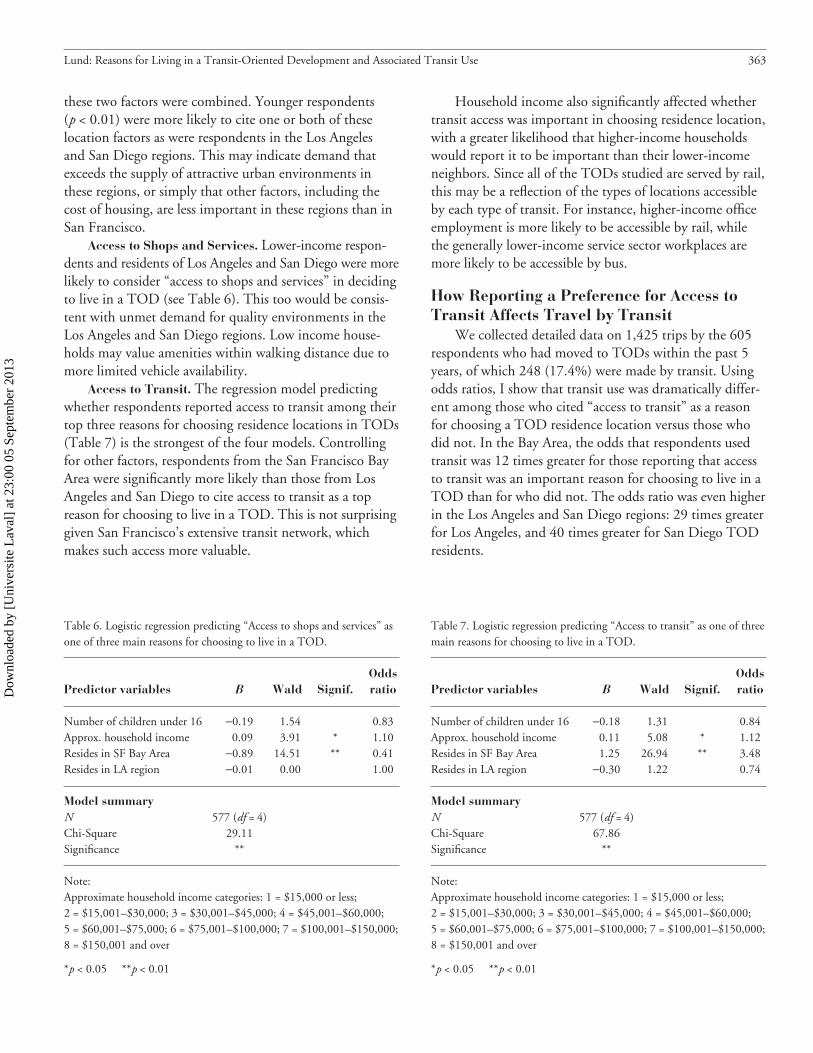
Access to Shops and Services. Lower-income respon-dents and residents of Los Angeles and San Diego were morelikely to consider “access to shops and services” in decidingto live in a TOD (see Table 6). This too would be consis-tent with unmet demand for quality environments in theLos Angeles and San Diego regions. Low income house-holds may value amenities within walking distance due tomore limited vehicle availability.
Access to Transit. The regression model predictingwhether respondents reported access to transit among theirtop three reasons for choosing residence locations in TODs(Table 7) is the strongest of the four models. Controllingfor other factors, respondents from the San Francisco BayArea were significantly more likely than those from LosAngeles and San Diego to cite access to transit as a topreason for choosing to live in a TOD. This is not surprisinggiven San Francisco’s extensive transit network, whichmakes such access more valuable.
Household income also significantly affected whethertransit access was important in choosing residence location,with a greater likelihood that higher-income householdswould report it to be important than their lower-incomeneighbors. Since all of the TODs studied are served by rail,this may be a reflection of the types of locations accessibleby each type of transit. For instance, higher-income officeemployment is more likely to be accessible by rail, whilethe generally lower-income service sector workplaces aremore likely to be accessible by bus.
How Reporting a Preference for Access toTransit Affects Travel by Transit
We collected detailed data on 1,425 trips by the 605respondents who had moved to TODs within the past 5years, of which 248 (17.4%) were made by transit. Usingodds ratios, I show that transit use was dramatically differ-ent among those who cited “access to transit” as a reasonfor choosing a TOD residence location versus those whodid not. In the Bay Area, the odds that respondents usedtransit was 12 times greater for those reporting that accessto transit was an important reason for choosing to live in aTOD than for who did not. The odds ratio was even higherin the Los Angeles and San Diego regions: 29 times greaterfor Los Angeles, and 40 times greater for San Diego TODresidents.
Lund: Reasons for Living in a Transit-Oriented Development and Associated Transit Use 363
Table 6. Logistic regression predicting “Access to shops and services” asone of three main reasons for choosing to live in a TOD.
OddsPredictor variables B Wald Signif. ratio
Number of children under 16 −0.19 1.54 0.83Approx. household income 0.09 3.91 * 1.10Resides in SF Bay Area −0.89 14.51 ** 0.41Resides in LA region −0.01 0.00 1.00
Model summaryN 577 (df = 4)Chi-Square 29.11Significance **
Note: Approximate household income categories: 1 = $15,000 or less; 2 = $15,001–$30,000; 3 = $30,001–$45,000; 4 = $45,001–$60,000; 5 = $60,001–$75,000; 6 = $75,001–$100,000; 7 = $100,001–$150,000;8 = $150,001 and over
*p < 0.05 **p < 0.01
Table 7. Logistic regression predicting “Access to transit” as one of threemain reasons for choosing to live in a TOD.
OddsPredictor variables B Wald Signif. ratio
Number of children under 16 −0.18 1.31 0.84Approx. household income 0.11 5.08 * 1.12Resides in SF Bay Area 1.25 26.94 ** 3.48Resides in LA region −0.30 1.22 0.74
Model summaryN 577 (df = 4)Chi-Square 67.86Significance **
Note: Approximate household income categories: 1 = $15,000 or less; 2 = $15,001–$30,000; 3 = $30,001–$45,000; 4 = $45,001–$60,000; 5 = $60,001–$75,000; 6 = $75,001–$100,000; 7 = $100,001–$150,000;8 = $150,001 and over
*p < 0.05 **p < 0.01
Dow
nloa
ded
by [
Uni
vers
ite L
aval
] at
23:
00 0
5 Se
ptem
ber
2013
It is certainly possible that respondents who have cometo depend on transit since living in a TOD have also retro-spectively assigned transit a higher rating in their locationdecisions. Thus it is not clear whether TOD residentsbrought their predisposition toward transit with them whenthey chose to live in a TOD, or developed it once they livedthere. What is clear is that TOD residents use transit at arelatively high rate compared to the population as a whole.
I estimated an additional logistic regression model tofocus solely on trips made by rail transit (N = 240), usingthe trip rather than the respondent as the unit of analysisand coding each trip as 1 (by rail) or 0 (not by rail). I addedsix predictor variables to the model using the Enter method:number of children under 16 years of age, approximatehousehold income, and dummy variables (1 = yes, 0 = no)for female respondent, residence in the Bay Area, residencein the LA region, and giving “access to transit” as one ofthree top reasons for choosing to live in a TOD. I initiallyincluded age, but removed it as lacking significance andhaving a low response rate. Table 8 reveals that after con-trolling for regional and sociodemographic influences,individuals who said access to transit was one their top threereasons for choosing to live in a TOD were nearly 20 timesmore likely to travel by rail than those who did not citethis as a major factor in that choice.
Limitations of the StudyBecause the survey instrument did not collect informa-
tion on households’ residential location choice alternatives,this study is unable to evaluate the trade-offs involved inhousehold location decisions. And because the instrumentdid not collect comparable data on prior place of residenceor prior travel mode, I could not link behavioral changeto change in the residential environment. The sample wasconstrained to those buildings in which we were allowed todistribute surveys, and as noted earlier, the response ratewas low, and thus the responses may be biased.
Finally, it should be noted that the results are biasedtoward English-speaking respondents. Although Spanish
364 Journal of the American Planning Association, Summer 2006, Vol. 72, No. 3
Table 8. Logistic regression predicting use of rail transit as primary tripmode.
OddsPredictor variables B Wald Signif. ratio
Number of children under 16 0.09 0.35 1.10Female respondent 0.25 1.88 1.28Approx. household income 0.01 0.03 1.01Resides in SF Bay Area 1.07 16.35 ** 2.94Resides in LA Region 0.56 3.54 1.75“Access to transit” preference 2.97 170.50 ** 19.41
Model summaryN 1,326 (df = 6)Chi-Square 335.06Significance ***
Note: Approximate household income categories: 1 = $15,000 or less; 2 = $15,001–$30,000; 3 = $30,001–$45,000; 4 = $45,001–$60,000; 5 = $60,001–$75,000; 6 = $75,001–$100,000; 7 = $100,001–$150,000;8 = $150,001 and over
*p < 0.05 **p < 0.01
Figure 2. Atherton Place Condominiums near the Hayward BARTStation in Hayward, CA.
Figure 3. Del Norte Apartments near the El Cerrito Del Norte BARTStation in El Cerrito, CA.
Dow
nloa
ded
by [
Uni
vers
ite L
aval
] at
23:
00 0
5 Se
ptem
ber
2013
surveys were made available upon request in areas withhigh concentrations of Spanish-speaking residents (mostlyin central-city Los Angeles), these response rates weredramatically lower than for English-speaking households.Although I feel the results are still applicable to most TODs,this does limit my ability to explore cultural variations inresidential location decisions.
Summary and Conclusions
I discovered that those who had moved to TODswithin the previous 5 years were not unlike the general
population of the area, though they had higher householdincomes and were less likely to be Hispanic. Although thereis usually a significant link between vehicle ownership andtransit use they were no less likely to have private cars,which argues against limiting parking availability, as isoften advocated for TODs.
My survey indicates that individuals choose to live inTODs for a wide range of reasons, though in general thesedid not include schools or recreational opportunities. Tran-sit access was most important in the San Francisco Bay Area,and within that area, most notably along the heavy rail linesof the BART system. This is likely because BART is partof an extensive transit network, thus providing numeroustransit connections and many possible destinations via tran-sit. There is also some indication that people chose TODsfor good access more generally, including to destinationsreachable on foot and by car.
Only about one third of the respondents to my surveywho had moved in within the previous 5 years reportedaccess to transit as one of the top three reasons for theirchoice. Though the share is higher in the Bay Area andlower in the Los Angeles region, it is surprisingly low in allcases. Surveyed TOD residents were equally or more likelyto choose to live in a TOD because of lower housing costor the quality of the neighborhood. Thus TODs may bemeeting a range of needs.
Residents who cite access to transit as one of their topthree reasons for choosing to live in a TOD are 13 to 40times more likely to use transit than those who do not. Thepreference for transit access remains a significant predictor ofrail transit use even after controlling for personal and house-hold characteristics and metropolitan region of residence.
It is not clear whether or not respondents broughttheir interest in transit with them when they moved intoTODs or developed it afterwards. What is clear is that TODresidents use transit at a relatively high rate compared tothe population as a whole.
AcknowledgementsThe data collection for this paper was funded by Caltrans Transporta-tion Grant “Statewide Planning Studies” FTA Section 5313(b) and theMineta Transportation Institute of San Jose State University.
Notes1. In most cases, distance from housing unit to station was limited to 1⁄4mile, but TODs in some areas were included though they were locatedup to 1⁄2 mile from a station.2. The Sacramento region was also included in the initial data collectioneffort but produced only a small sample of TOD residents, so is not in-cluded here. Most Sacramento sites were office buildings, not residential.
Lund: Reasons for Living in a Transit-Oriented Development and Associated Transit Use 365
Figure 4. Coggins Square Apartments, near the Pleasant Hill BARTStation in Walnut Creek, CA.
Figure 5. The Crossings, near the San Antonio Caltrain Station inMountain View, CA.
Dow
nloa
ded
by [
Uni
vers
ite L
aval
] at
23:
00 0
5 Se
ptem
ber
2013
ReferencesBagley, M., & Mokhtarian, P. (2002). The impact of residentialneighborhood type on travel behavior: A structural equations modelingapproach. Annals of Regional Science, 36 (2), 279–297.Boarnet, M., & Sarmiento, S. (1998). Can land-use policy really affecttravel behaviour? A study of the link between non-work travel and land-use characteristics. Urban Studies, 35 (7), 1155–1169.California Association of Realtors. (2006). The 2005 California Hous-ing Market Annual Historical Data Survey. California Association ofRealtors, Department of Research and Economics: Los Angeles, CA.Cao, X., Handy, S., & Mokhtarian, P. (2006). The influences of thebuilt environment and residential self-selection on pedestrian behavior:Evidence from Austin, TX. Transportation, 33 (1), 1–20.Cervero, R., Ferrell, C., & Murphy, S. (2002, October). Transit-oriented development and joint development in the United States: Aliterature review. Transit Cooperative Research Program Research ResultsDigest, 52.Cervero, R., Murphy, S., Ferrell, C., Goguts, N., Tsai, Y.-H., Arrington,G. B., et al. (2004). Transit-oriented development in the United States:experiences, challenges, and prospects (TCRP Report 102). Washington,DC: Transit Cooperative Research Program.Collins, C., & Chambers, S. (2005). Psychological and situationalinfluences on commuter-transport-mode choice. Environment andBehavior, 37(5), 640–661.Handy, S., Cao, X, Mokhtarian, P. (2006) Self-selection in the relation-ship between the built environment and walking. Journal of the AmericanPlanning Association, 72 (1), 55–74.Hunecke, M., Blobaum, A., Matthies, E., & Hoger, R. (2001). Re-sponsibility and environment: Ecological norm orientation and externalfactors in the domain of travel mode choice behaviour. Environment andBehavior, 33 (6), 830–852.
Jarvis, H. (2003). Dispelling the myth that preference makes practice inresidential location and transport behaviour. Housing Studies, 18 (4),587–606.Kim, J. H., Pagliara, F., & Preston, J. (2005). The intention to move andresidential location choice behavior. Urban Studies, 42 (9), 1621–1636.Kitamura, R., Mokhtarian, P., & Laidet, L. (1997). A micro-analysis ofland use and travel in five neighborhoods in the San Francisco Bay Area.Transportation, 24 (2), 125–158.Lund, H. (2003). Testing the claims of new urbanism: Local access,pedestrian travel, and neighboring behaviors. Journal of the AmericanPlanning Association, 69 (4), 414–429.Lund, H., Cervero, R., & Willson, R. W. (2004). Travel behavior oftransit-oriented development in California (Final Report). Sacramento:California Department of Transportation.Lund, H., & Willson, R. W. (2005). The Pasadena Gold Line: Devel-opment strategies, location decisions, and travel characteristics along a newrail line in the Los Angeles region (Final report). San Jose, CA: MinetaTransportation Institute.Naess, P. (2005). Residential location affects travel behavior—but howand why? The case of Copenhagen metropolitan area. Progress andPlanning, 63 (1), 1–91.Parker, T., McKeever, M., Arrington, G. B., & Smith-Heimer, J.(2002). Statewide transit-oriented development study: Factors for successin California (Final Report). Sacramento: California Department ofTransportation.Schwanen, T., & Mokhtarian, P. (2004). The extent and determinantsof dissonance between actual and preferred residential neighborhoodtype. Environment and Planning B, 31 (5), 759–784.Schwanen, T., & Mokhtarian, P. (2005). What if you live in the wrongneighborhood? The impact of residential neighborhood type dissonanceon distance traveled. Transportation Research Part D, 10 (2), 127–151.
366 Journal of the American Planning Association, Summer 2006, Vol. 72, No. 3