135
Re-awakening Australia The economic cost of sleep disorders in Australia, 2010 Sleep Health Foundation October 2011

Re-awakening
Australia
The economic cost of sleep
disorders in Australia, 2010
Sleep Health Foundation
October 2011

Re-awakening Australia
Liability limited by a scheme approved under Professional Standards Legislation.
Deloitte refers to one or more of Deloitte Touche Tohmatsu Limited, a UK private company limited by guarantee, and its network
of member firms, each of which is a legally separate and independent entity.
Please see www.deloitte.com/au/about for a detailed description of the legal structure of Deloitte Touche Tohmatsu Limited and
its member firms.
© 2011 Deloitte Access Economics Pty Ltd
Contents Glossary ...........................................................................................................................................i
Executive summary ....................................................................................................................... iii
1 Sleep disorders in Australia ................................................................................................ 8
1.1 Prevalence of sleep disorders ................................................................................................ 8
1.2 Sleep disorders and other health conditions ....................................................................... 15
1.3 Sleep disorders and the risk of accidents............................................................................. 25
1.4 Sleep disorders in children ................................................................................................... 28
1.5 Costs of sleep disorders ....................................................................................................... 30
1.6 Quality of life ........................................................................................................................ 30
2 Population attributable fractions ..................................................................................... 32
2.1 Methodology ........................................................................................................................ 32
2.2 Cardiovascular disease ......................................................................................................... 33
2.3 Depression ........................................................................................................................... 37
2.4 Injuries ................................................................................................................................. 39
3 Health costs of sleep disorders ......................................................................................... 43
3.1 Sleep disorders ..................................................................................................................... 43
3.2 Health costs of other conditions .......................................................................................... 50
3.3 Summary of health system costs ......................................................................................... 53
4 Indirect costs ..................................................................................................................... 55
4.1 Productivity .......................................................................................................................... 55
4.2 Informal care ........................................................................................................................ 66
4.3 Other costs of motor vehicle accidents ............................................................................... 68
4.4 Other costs of workplace accidents ..................................................................................... 71
4.5 Deadweight loss ................................................................................................................... 71
4.6 Summary and sensitivity of indirect costs ........................................................................... 75
5 Burden of disease ............................................................................................................. 76
5.1 Methodology ........................................................................................................................ 76
5.2 Disability weights for sleep disorders .................................................................................. 77
5.3 Loss in the stock of health capital ........................................................................................ 80
6 Cost effectiveness of CPAP ............................................................................................... 83
6.1 Description of CPAP ............................................................................................................. 83
6.2 Safety and efficacy of CPAP therapy .................................................................................... 85
6.3 Review of previous CUAs for CPAP ...................................................................................... 89
6.4 CUA of CPAP ......................................................................................................................... 92
6.5 Sensitivity analysis ............................................................................................................... 95
7 Comparisons and opportunities........................................................................................ 98
7.1 Summary of the cost of sleep disorders .............................................................................. 98

Deloitte Access Economics
7.2 Comparisons in Australia ..................................................................................................... 99
7.3 Comparisons with Wake Up Australia ............................................................................... 100
7.4 International developments .............................................................................................. 104
7.5 Opportunities for the future .............................................................................................. 105
References ................................................................................................................................. 107
Appendix A : Sleep disorder ICSD to ICD-10 mapping ............................................................... 126
Limitation of our work................................................................................................................... 129
Charts Chart 3.1 : Number of separations for sleep disorders .............................................................. 44
Chart 3.2 : Hospital costs by sleep disorder, 2010 ..................................................................... 46
Chart 3.3 : Health system costs for conditions attributed to sleep disorders, 2010 ................. 53
Chart 6.1 : Sensitivity analysis, ICER health system ................................................................... 97
Chart 6.2 : Sensitivity analysis, ICER society ............................................................................... 97
Chart 7.1 : Economic cost of sleep disorders, 2010 ................................................................... 99
Tables Table 1.1 : Estimated prevalence of moderate-severe OSA in Australia, 2010 ............................ 9
Table 1.2 : Large sample studies on the prevalence of OSAS ..................................................... 10
Table 1.3 : Estimated prevalence rates of primary insomnia by age group................................ 12
Table 1.4 : Age-gender prevalence rates of RLS in Australia, 2010............................................. 13
Table 1.5 : Prevalence of sleep disorders in Australia ................................................................ 15
Table 1.6 : Odds ratio of having OSA and hypertension ............................................................. 17
Table 1.7 : Beck depression scale ................................................................................................ 23
Table 1.8 : Relationship between insomnia and major depressive episodes ............................. 24
Table 2.1 : Prevalence of stroke, 2010 ........................................................................................ 34
Table 2.2 : PAFs of OSA to stroke ................................................................................................ 34
Table 2.3 : Prevalence of CHF, 2010 ............................................................................................ 35
Table 2.4 : PAFs of OSA to CHF .................................................................................................... 35
Table 2.5 : Prevalence of coronary artery disease, 2010 ............................................................ 36
Table 2.6 : PAFs of OSA to coronary artery disease .................................................................... 37
Table 2.7 : PAFs of OSA to all CVDs ............................................................................................. 37
Table 2.8 : Prevalence of depression, 2010 ............................................................................... 38

Deloitte Access Economics
Table 2.9 : PAFs of sleep disorders to depression ....................................................................... 38
Table 2.10 : Incidence of hospitalised and non-hospitalised injuries caused by MVAs, 2010 ... 40
Table 2.11 : PAFs of OSA to a MVA injury ................................................................................... 40
Table 2.12 : Incidence of serious workplace injuries, 2010 ....................................................... 41
Table 2.13 : PAFs of OSA to a workplace injury .......................................................................... 42
Table 3.1 : Hospital costs for sleep disorders in 2010 ................................................................ 45
Table 3.2 : Cost of sleep studies in 2010 .................................................................................... 49
Table 3.3 : Cost of medical practitioner visits due to OSA in 2010 ............................................ 50
Table 3.4 : Summary of direct health care system cost components for MVA .......................... 52
Table 3.5 : Average cost per person and total cost of road injuries due to OSA, 2010 .............. 52
Table 3.6 : Summary of health care costs of sleep disorders, 2010 ............................................ 54
Table 4.1 : Prevalence of OSA and associated conditions caused by OSA by age and gender,
2010 58
Table 4.2 : Prevalence of insomnia and associated conditions by age and gender, 2010 .......... 59
Table 4.3 : Prevalence of RLS and associated conditions by age and gender, 2010 ................... 59
Table 4.4 : Lost productivity due to CVDs ................................................................................... 60
Table 4.5 : Lost productivity due to depression .......................................................................... 61
Table 4.6 : Assumed impact of injury on employment .............................................................. 62
Table 4.7 : Productivity cost of temporary absence due to MVAs from OSA by gender, 2010 .. 62
Table 4.8 : Productivity cost of premature mortality .................................................................. 65
Table 4.9 : Productivity cost of absenteeism .............................................................................. 65
Table 4.10 : Estimated hours per week of care by level of disability, 2010 ................................ 67
Table 4.11 : Cost of informal care, 2010 ..................................................................................... 68
Table 4.12 : Estimated general costs of road traffic crashes, 2010 ........................................... 71
Table 4.13 : Other costs of workplace accidents, 2010.............................................................. 71
Table 4.14 : Social security payments to people not employed due to sleep disorders ............ 73
Table 4.15 : Deadweight loss, 2010 ............................................................................................ 74
Table 4.16 : Summary of the costs of sleep disorders, 2010 ...................................................... 75
Table 5.1 : Studies of pre-treatment health utility scores for those with OSA ........................... 79
Table 5.2 : Average EQ-5D health utility scores for those with RLS ............................................ 80
Table 5.3 : YLDs due to OSA, RLS and insomnia in 2010 ............................................................. 81
Table 6.1 : Reports of minor adverse events from CPAP ............................................................ 85
Table 6.2 : Summary of CUA of CPAP versus conventional or no treatment .............................. 91
Table 6.3 : Estimated total cost of CPAP treatment over 5 years in Australia ............................ 93
Table 6.4 : Cost utility analysis .................................................................................................... 94

Deloitte Access Economics
Table 6.5 : Results from sensitivity analysis, inputs .................................................................... 96
Table 7.1 : Summary of the economic cost of sleep disorders, 2010 ......................................... 98
Table 7.2 : Health cost comparison, national priorities and other, 2010 ................................. 100
Table 7.3 : Summary of the methods and findings of this study compared with Access
Economics (2004a) .................................................................................................................... 101
Figures Figure 6.1 : CPAP therapy ........................................................................................................... 84

Re-awakening Australia
Liability limited by a scheme approved under Professional Standards Legislation.
Deloitte refers to one or more of Deloitte Touche Tohmatsu Limited, a UK private company limited by guarantee, and its
network of member firms, each of which is a legally separate and independent entity.
Please see www.deloitte.com/au/about for a detailed description of the legal structure of Deloitte Touche Tohmatsu Limited
and its member firms.
© 2011 Deloitte Access Economics Pty Ltd
Glossary ABS Australian Bureau of Statistics
ADHD attention deficit/hyperactivity disorder
AHI apnoea-hypopnoea index
AIHW Australian Institute of Health and Welfare
ATO Australian Tax Office
BEACH Bettering the Evaluation and Care of Health
BITRE Bureau of Infrastructure, Transport and Regional Economics
BMI body mass index
CEA cost effectiveness analysis
CHF congestive heart failure
CI confidence interval
CPAP continuous positive airway pressure
CSA central sleep apnoea
CUA cost utility analysis
CVD cardiovascular disease
DALY disability adjusted life year
DRG diagnostic related groups
DSM-IV Diagnostic and Statistical Manual (of mental disorders), Version 4
DWL deadweight loss
EDS excessive daytime sleepiness
ESS Epworth sleepiness scale
ICD-10 International Classification of Diseases (Tenth Revision)
ICER incremental cost effectiveness ratio
ICSD International Classification of Sleep Disorders
GP general practitioner
HADS hospital anxiety depression scale
MBS Medicare Benefits Schedule
MCS mental component summary
MSLT multiple sleep latency test

Deloitte Access Economics
MWT maintenance of wakefulness test
MVA motor vehicle accident
NHCDC National Hospital Cost Data Collection
NHMRC National Health and Medical Research Council
NSMHWB National Survey of Mental Health and Wellbeing
OR odds ratio
OSA obstructive sleep apnoea
OSAS obstructive sleep apnoea syndrome
PAF population attributable fraction
PBS Pharmaceutical Benefits Scheme
PCS physical component summary
PLMD primary limb movements disorder
POMS profile of mood scale
QALY quality adjusted life year
REST RLS Epidemiology, Symptoms and Treatment
RR risk ratio
RLS restless legs syndrome
UK United Kingdom
US United States (of America)
VSLY value of a statistical life year
WHO World Health Organization
YLD years lived with disability
YLL years of life lost

iii Deloitte Access Economics
Executive summary Sleep disorders are a large and under-recognised problem in Australia. In 2004, Access
Economics prepared a report on the economic cost of sleep disorders in Australia, Wake up
Australia. This 2011 Deloitte Access Economics report was commissioned by the Sleep
Health Foundation to re-estimate the cost of sleep disorders based on updated cost
information and developments in the literature, which result in different methodology from
the previous analysis. This report also includes a cost-utility analysis of continuous positive
airway pressure (CPAP) — the most common treatment for obstructive sleep apnoea (OSA).
This report focuses on three of the most well recognised and researched sleep disorders,
since these account for the majority of sleep impacts studied. These are:
• OSA;
• restless legs syndrome (RLS); and
• primary insomnia.
Prevalence
The prevalence of each sleep disorder was calculated in the Australian population aged 20
years and over (Table i). These prevalence rates do not overlap, that is they have been
adjusted to avoid counting people with multiple disorders, by only counting the primary
sleep condition (Section 1.1.5). In 2010 there were an estimated 1.5 million Australians
(8.9% of the population) with these sleep disorders, comprising approximately:
• 775,000 people with OSA (4.7%);
• 492,000 people with primary insomnia (3%); and
• 199,000 people with RLS (1.2%).
Costs may be underestimated given the prevalence of people experiencing symptoms of
insomnia, RLS or OSA is substantially higher than the proportion of people who are
diagnosed with these conditions, and given the exclusion of other sleep conditions.
Table i: Prevalence of sleep disorders in Australia
Sleep Disorder Low Base case High
OSA (AHI≥15) 4.0% 4.7% 6.0%
Primary Insomnia 1.5% 3.0% —
Restless Legs Syndrome — 1.2% —
Source: Deloitte Access Economics calculations. AHI = apnoea-hypopnoea index.
Sleep disorders and other health conditions
There is evidence of a causal relationship between sleep disorders and other illnesses and
injuries. Population attributable fractions (PAFs) were used to estimate the proportion of
each condition attributable to each sleep disorder. These are shown in Table ii. Some of
the PAFs have changed since the previous report, due to changes in the literature evidence.
In particular, in this report there is:
• a lower odds ratio for the impact of OSA on the risk of workplace injuries (potentially
reflecting changes in occupational health and safety practices in the intervening years);

iv Deloitte Access Economics
• the PAF for motor vehicle accidents is lower is this report because it relates to OSA
only, rather than to all sleep disorders (see table note below).
Table ii: PAFs for sleep disorders
Attributed injury/illness OSA Insomnia RLS
Stroke 5.3% — —
CHF 1.1% — —
Coronary artery disease 3.6% — —
Depression 6.2% 2.9% 1%
Motor vehicle accidents (MVAs) 4.3% — —
Workplace injuries 0.6% 3.9% —
Source: Deloitte Access Economics’ calculations. — Not estimated this time due to a lack of data evidence. Last
time PAFs were based on overall prevalence of sleep conditions with odds ratios for OSA extrapolated to other
conditions. This time each relationship was, more conservatively, separately analysed, and a link discounted if
there was insufficient evidence of a direct relationship, even though the causal pathway may be the same
(e.g. the pathway for a link between insomnia and MVAs may be the same as for OSA – notably, fatigue).
PAFs were based on clinical evidence with the exceptions that:
• the effect of OSA on the risk of certain cardiovascular diseases (CVDs) – here
comprising stroke, congestive heart failure (CHF) and coronary artery disease – for
women was estimated to be the same as for men (allowing for higher CVD risk for men
of the same age); and
• the link between RLS and depression was derived from the lifetime risk of experiencing
a major depressive episode, since estimates of annual risk in the literature tend to be
unstable and based on very small sample sizes.
Health system costs
The health system costs of sleep disorders comprise the cost of the sleep disorders
themselves and the share of health costs from other conditions attributed to sleep
disorders (i.e. CVDs, depression and injuries).
The total health care cost of sleep disorders in 2010 was estimated to be $818 million.
Sleep disorders cost the hospital system $96.2 million, of which 73.1% was due to sleep
apnoeas, 6.7% to insomnia and 0.3% to RLS. The remainder was for other sleep disorders –
including 13.9% due to disorders of the sleep wake schedule.
People with sleep disorders access a range of medical services and use pharmaceuticals
that they would not require in the absence of the sleep disorder. Data on these out-of-
hospital medical costs was only available for OSA – $96.6 million in 2010. This estimate is
likely to underestimate the actual cost because it only captures a limited range of the
potential services accessed as a result of a person having OSA. In addition, the total cost of
devices in 2010 was $81.5 million (mainly CPAP devices).
The total health system cost for conditions attributed to sleep disorders in 2010 was
estimated to be $544 million. The proportion of these costs for each sleep condition were
$408.5 million to OSA, $118.7 million to insomnia and $16.9 million due to RLS.

v Deloitte Access Economics
Indirect costs
Indirect financial costs associated with sleep disorders and conditions attributable to
them were estimated to be $4.3 billion in 2010.
• This includes $3.1 billion in lost productivity due to premature workforce separation
and mortality, and absenteeism.
• The deadweight loss of raising revenue to fund lost productivity, public health
expenditure, social security payments and a number of costs associated with motor
vehicle accidents that were due to sleep disorders cost $472 million.
• Informal care and other costs of motor vehicle and workplace accidents amounted to
$129 million and $517 million respectively.
• OSA accounted for 62% of the total cost ($2.6 billion) while insomnia contributed
$1.5 billion (36%) and RLS $115 million (3%).1
Human cost of sleep disorders
Sleep disorders impose a burden that extends beyond health care system and broader
economic costs. A person living with a sleep disorder will likely experience a lower quality
of life through increased morbidity, and may die prematurely e.g. from a motor vehicle
accident.
Loss of healthy life is measured in disability adjusted life years (DALYs). DALYs lost from
OSA, insomnia and RLS as well as attributable conditions were calculated, with an
adjustment made to avoid double counting. It was estimated 190,000 DALYs were lost
due to sleep disorders in 2010. OSA contributed 109,000 DALYs, insomnia 56,000 DALYs
and RLS 26,000 DALYs.
Multiplying DALYs lost by the value of a statistical life year (VSLY) of $165,000, the total
cost of lost wellbeing was estimated to be $31.4 billion ($23.5 billion – $36.8 billion). This
is not a direct cost to the economy in the traditional sense (i.e. a loss in productivity). It is
the value of a loss in the stock of health capital.
Cost effectiveness of CPAP
CPAP is the most common treatment for people with OSA. Its cost effectiveness for
treating the average Australian with OSA was evaluated in comparison with no treatment.
The incremental cost effectiveness ratio (ICER) from the heath system perspective was
$15,523 ($12,112 to $19,750) per DALY averted – which is considered very cost effective
based on World Health Organization (WHO) benchmarks. From the perspective of society,
there was a saving of $8,736 per DALY averted, making CPAP for OSA a ‘dominant’
intervention from a societal perspective – saving healthy life and dollars.
Comparisons and opportunities
The total cost associated with sleep disorders in Australia was estimated at $36.4 billion
($27.0 billion to $42.8 billion) (Table iii).
1 The indirect costs in this report are lower than in the previous report because the cost is primarily based on
OSA and its associated conditions rather than an estimate of all sleep disorders. Also, changes made to the PAF
for OSA and workplace accidents have had a large impact on the results.

vi Deloitte Access Economics
This comprised $5.1 billion ($3.5 billion to $6.0 billion) in financial costs and $31.4 billion
($23.5 billion to $36.8 billion) in nonfinancial costs.
Table iii: Summary of the economic cost of sleep disorders, 2010
Low Base case High
$m $m $m
Health care costs
Sleep disorders 274 274 274
Associated conditions 357 544 703
Total health care cost 631 818 977
Indirect financial costs
Productivity 2,120 3,132 3,673
Informal care 76 129 166
Other cost of MVA 303 465 605
Other cost of workplace accidents 28 53 56
Deadweight loss 329 472 565
Total indirect financial cost 2,855 4,250 5,065
Total financial cost 3,487 5,069 6,042
Total non-financial costs 23,468 31,350 36,751
Total cost 26,955 36,419 42,793
Source: Deloitte Access Economics estimates.
Chart i shows the total cost of sleep disorders in 2010, by type of sleep disorder. The total
cost of OSA was estimated at $21.2 billion. The total cost of insomnia was estimated at
$10.9 billion and the total cost of RLS was $4.4 billion.2
Chart i: Economic cost of sleep disorders, 2010
Source: Deloitte Access Economics’ estimates.
2 These results should not be interpreted as meaning that OSA is the most costly sleep disorder as data
limitations have not allowed us to include all costs associated with all sleep disorders.
$21,151 m
$10,871 m
$4,356 m
$39 m
OSA Insomnia RLS Other sleep disorders
Total economic cost $36.4 billion

vii Deloitte Access Economics
The importance of sleep health is beginning to gain recognition overseas, in terms of
acknowledgement of the need for and development of strategies to increase public
awareness and intervention in relation to sleep disorders.
A number of groups have sought to heighten awareness of sleep disorders. World Sleep
Day was established on 18 March 2008 and, in the United States (US), National Sleep
Awareness week occurs on 7 – 13 March. The European Respiratory Society and the British
Lung Foundation have also played an important role in raising awareness in relation to OSA.
Australia has comparative advantages in the analysis of sleep arena. Priority interventions
to address the current fragmented and under-resourced sleep health landscape include the
following.
• Education and awareness raising — for community, health professionals and public
policy makers, regarding the importance of good sleep hygiene and how to achieve
better sleep outcomes.
• Research and development — this report has identified a number of areas in which
further research would be worthwhile (see Section 7).
• Cost-effective prevention, treatment and management options — this report has
shown CPAP to be a highly cost effective treatment for OSA yet it is largely privately
funded. Other treatment options may provide improved compliance, one of the
shortcomings of CPAP.
• A national coordination point — the establishment of a catalysing agent with a forward
national action plan is recommended.
Although sleep disorders remain under-recognised, the future is positive if opportunities
for action are pursued since such a large proportion of sleep-related impacts are
preventable or treatable.
Deloitte Access Economics
Re-awakening Australia
8 Deloitte Access Economics
1 Sleep disorders in Australia This chapter reviews the literature on the prevalence and types of sleep disorders, links
between sleep disorders and other medical and economic outcomes, and the cost of sleep
disorders.
1.1 Prevalence of sleep disorders
Over the course of their lives, a person may experience a range of sleep disorders. Among
the nearly 70 clinically diagnosable sleep disorders listed in the International Classification
of Sleep Disorders (ICSD), the most frequent and often the most severe are obstructive
sleep apnoea (OSA), narcolepsy, restless legs syndrome (RLS), periodic limb movement
disorder, insomnia, parasomnias, circadian rhythm disorders including jet lag and shift
work, and sudden infant death syndrome.
The majority of this report focuses on OSA, insomnia and RLS since they are among the
most highly prevalent sleep disorders and there are established links between them and
other health conditions, which is the area where the majority of costs are incurred. This
section presents estimates of the prevalence of these three sleep disorders.
1.1.1 Obstructive sleep apnoea
Sleep apnoea refers to abnormal reductions or pauses in breathing during sleep. OSA is a
type of sleep apnoea characterised by sleep-related intermittent upper airway obstruction,
which may be associated with episodes of oxygen desaturations and sleep fragmentation.
OSA syndrome (OSAS) refers to a combination of OSA and symptoms, such as snoring,
disrupted sleep, witnessed apnoeas and excessive daytime sleepiness
OSA is commonly measured by the apnoea-hypopnoea index (AHI), which measures the
number of obstructive and central apnoea or hypopnoea episodes per hour of sleep.3
Two measures of the prevalence of OSA have been adopted in this report.
• the prevalence of those with AHI ≥ 15 (often described as moderate to severe OSA);
and
• the prevalence of OSAS, defined as those with AHI ≥ 5 who also experience excessive
daytime sleepiness.
There are advantages and disadvantages to both measures. It is more common in
epidemiological studies to report results in terms of those with AHI ≥ 15. This is because a
number of epidemiological studies have found that OSA only affects health outcomes if AHI
levels are above 15, or in some cases 30. For example Redline et al (2010) found that the
effect of OSA on strokes is only observed among those with AHI≥30. The second measure,
3 Central sleep apnoea refers to sleep apnoea characterised by episodes of shallow or absent breathing caused
by the absence of movement in the chest wall during sleep (Bixler et al 1998) and is commonly observed in
heart failure patients. The prevalence of CSA is much lower than the prevalence of OSA (Bixler et al 1998).

Re-awakening Australia
9 Deloitte Access Economics
although including people with a lower AHI, captures only those who are actually affected
by daytime sleepiness as a result of the condition. This is more important in studies looking
at the relationship between OSA and accidents and depression.
1.1.1.1 The prevalence of moderate to severe OSA (AHI≥15)
Two major studies have reported the prevalence of OSA. Young et al (2005) analysed data
from the Wisconsin Sleep Cohort Study4 and found that 5.7% of US adults aged 30-69 years
had an AHI ≥ 15.5 Bixler et al (2001) found that 2.2% of females and 7.2% of males had an
AHI ≥ 15 in the US population aged 20-100 years.6 This implies an overall prevalence rate of
4.7%, assuming approximately equal numbers of men and women in that population.
The prevalence estimates used in this report were based on Bixler et al (2001), due to a
wider range of age groups than Young et al (2005). Table 1.1 shows the prevalence of OSA
by age and gender based on Bixler et al (2001). The total number of people with OSA in
Australia in 2010 was estimated to be 774,590 — 24% (185,410) were female and 76%
(589,181) male. An age distribution was inferred using the age distribution for men in
Bixler et al (1998).7 The age distribution for females was taken from Bixler et al (2001).
Table 1.1: Estimated prevalence of moderate-severe OSA in Australia, 2010
Age
Group
Women Men Persons
% No. % No. % No.
20-44 0.6 22,775 3.3 126,317 1.6 149,092
45-64 1.9 53,706 10.3 287,186 5.3 340,892
65+ 6.7 108,929 12.6 175,677 10.2 284,606
Total 2.2 185,410 7.2 589,181 4.7 774,591
Note: The age breakdown was derived based on the results from Bixler et al (1998; 2001). OSA is defined as
being an AHI≥15.
Source: Deloitte Access Economics calculations.
1.1.1.2 The prevalence of OSAS
The prevalence of OSAS has been estimated in a number of studies. The most commonly
cited results are from Young et al (1993) who found that 4% of men and 2% of women have
OSAS.
The results of Young et al (1993) are broadly consistent with those found across the
literature. Punjabi (2008) reviewed the literature on the prevalence of OSAS in studies with
4 At the baseline this study included 1,549 Wisconsin state employees aged between 30 and 60 years (Young
2009).
5 Young et al (2005) used the Wisconsin Sleep Cohort data to estimate relative risk ratios for OSA by categories
of age, sex and BMI. This was then used to estimate the proportion of those with an AHI > 15 based on the age,
sex and weight distribution in the 2003 US Census.
6 The 95% confidence interval around the female prevalence rate was 1.5% to 3.3% and for males, 5.6% to 9.3%.
7 The age distribution for men was available based on AHI≥5, AHI≥10 and AHI≥20; an estimate for AHI≥15 was
made assuming a linear relationship between the number of men in each age group and the AHI. Bixler et al
(1998) showed that prevalence declines as AHI increases.
Re-awakening Australia
10 Deloitte Access Economics
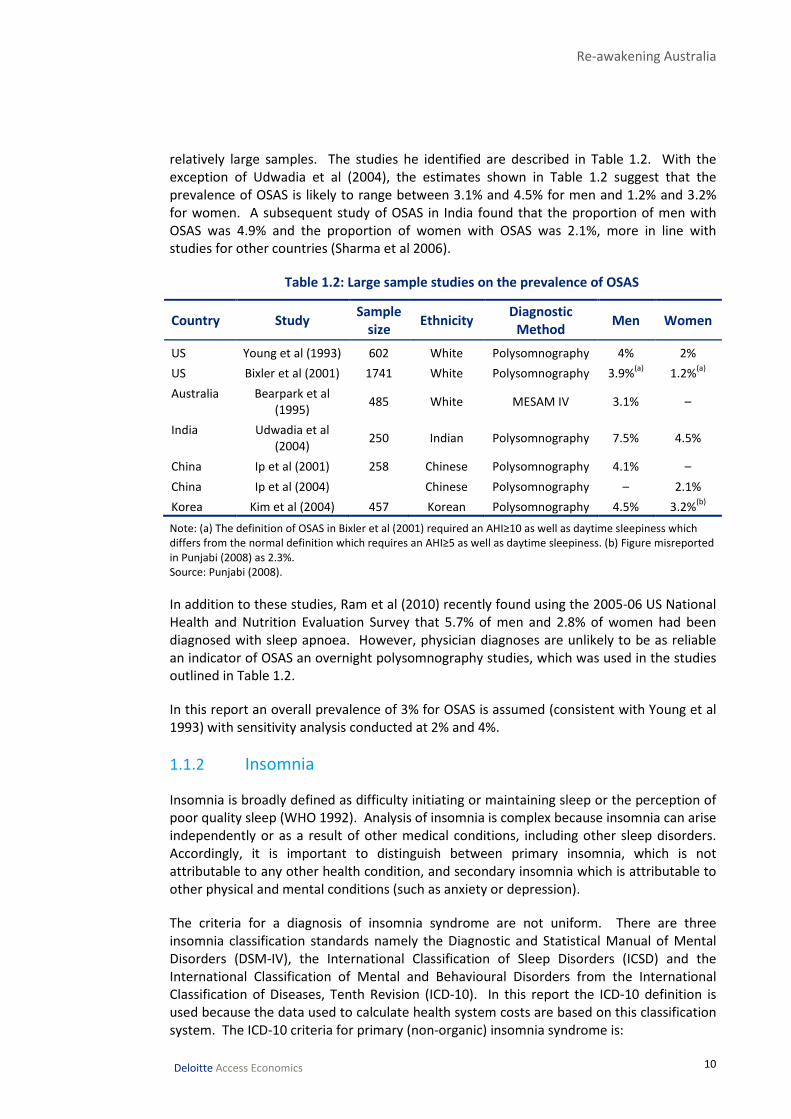
relatively large samples. The studies he identified are described in Table 1.2. With the
exception of Udwadia et al (2004), the estimates shown in Table 1.2 suggest that the
prevalence of OSAS is likely to range between 3.1% and 4.5% for men and 1.2% and 3.2%
for women. A subsequent study of OSAS in India found that the proportion of men with
OSAS was 4.9% and the proportion of women with OSAS was 2.1%, more in line with
studies for other countries (Sharma et al 2006).
Table 1.2: Large sample studies on the prevalence of OSAS
Country Study Sample
size Ethnicity
Diagnostic
Method Men Women
US Young et al (1993) 602 White Polysomnography 4% 2%
US Bixler et al (2001) 1741 White Polysomnography 3.9%(a)
1.2%(a)
Australia Bearpark et al
(1995) 485 White MESAM IV 3.1% –
India Udwadia et al
(2004) 250 Indian Polysomnography 7.5% 4.5%
China Ip et al (2001) 258 Chinese Polysomnography 4.1% –
China Ip et al (2004) Chinese Polysomnography – 2.1%
Korea Kim et al (2004) 457 Korean Polysomnography 4.5% 3.2%(b)
Note: (a) The definition of OSAS in Bixler et al (2001) required an AHI≥10 as well as daytime sleepiness which
differs from the normal definition which requires an AHI≥5 as well as daytime sleepiness. (b) Figure misreported
in Punjabi (2008) as 2.3%.
Source: Punjabi (2008).
In addition to these studies, Ram et al (2010) recently found using the 2005-06 US National
Health and Nutrition Evaluation Survey that 5.7% of men and 2.8% of women had been
diagnosed with sleep apnoea. However, physician diagnoses are unlikely to be as reliable
an indicator of OSAS an overnight polysomnography studies, which was used in the studies
outlined in Table 1.2.
In this report an overall prevalence of 3% for OSAS is assumed (consistent with Young et al
1993) with sensitivity analysis conducted at 2% and 4%.
1.1.2 Insomnia
Insomnia is broadly defined as difficulty initiating or maintaining sleep or the perception of
poor quality sleep (WHO 1992). Analysis of insomnia is complex because insomnia can arise
independently or as a result of other medical conditions, including other sleep disorders.
Accordingly, it is important to distinguish between primary insomnia, which is not
attributable to any other health condition, and secondary insomnia which is attributable to
other physical and mental conditions (such as anxiety or depression).
The criteria for a diagnosis of insomnia syndrome are not uniform. There are three
insomnia classification standards namely the Diagnostic and Statistical Manual of Mental
Disorders (DSM-IV), the International Classification of Sleep Disorders (ICSD) and the
International Classification of Mental and Behavioural Disorders from the International
Classification of Diseases, Tenth Revision (ICD-10). In this report the ICD-10 definition is
used because the data used to calculate health system costs are based on this classification
system. The ICD-10 criteria for primary (non-organic) insomnia syndrome is:

Re-awakening Australia
11 Deloitte Access Economics
• a complaint of difficulty falling asleep, maintaining sleep, or non refreshing sleep;
• the sleep disturbance occurs at least three times per week for at least one month;
• the sleep disturbance results in marked personal distress or interference with
personal functioning in daily living; and
• the absence of any known causative organic factor, such as a neurological or other
medical condition, psychoactive substance use disorder or a medication (WHO 1992).
Lack et al (1988) found prevalence rates to be around 5% (4% - 20%), using South Australian
data. This was similar to the prevalence of the use of sleep medications. The 1995 National
Health Survey showed that "almost 4% of the population had recently used a tranquilliser,
sedative and/or sleeping medication” (ABS 1999).
A subsequent large-scale study of general practitioner (GP) data on the prevalence of
chronic morbidities (Knox et al 2008) found that the prevalence of insomnia syndrome in
Australia was between 3.4% and 5%, and chose the midpoint (4.2%) as the estimate. This
figure reflects the prevalence of both primary and secondary insomnia syndrome because it
was possible in this study for multiple chronic morbidities to be recorded for each of the
9,156 participants.
This is consistent with the prevalence range of 1.3% – 3% for primary insomnia syndrome
found in the international literature. In a US study, Ohayon and Caulet et al (1997a) found
that 1.3% of the population had primary insomnia syndrome (with a further 4.3% having
secondary insomnia) while Ohayon and Partinen (2002) found that the prevalence of
primary insomnia syndrome in Finland was 1.6%. In a United Kingdom (UK) telephone
survey, Ohayon and Caulet et al (1997a) found that the population prevalence for primary
insomnia was slightly above 3%. The most recent large scale study of insomnia was a
telephone survey of 25,579 individuals in seven European countries (Ohayon and Reynolds
2009). The authors found that 3% (95% confidence interval of 2.8% to 3.2%) of the sample
had primary insomnia under either the ICD or DSM-IV criteria (with a further 3.6% having
secondary insomnia). This comprised prevalence rates of 2% for males and 3% for females.
While insomnia prevalence studies do not generally provide data on the prevalence of
primary insomnia syndrome by age group, data are available on the prevalence of insomnia
symptoms by age group. The distribution of insomnia symptoms by age group in Ohayon
and Reynolds (2009) was used to estimate the prevalence of primary insomnia by age
group, shown in Table 1.3.
Under the assumption that the distribution of insomnia symptoms across age groups is the
same as the distribution of insomnia itself, the prevalence of insomnia symptoms in each
age group relative to the overall prevalence was used to form the relative ratio. This ratio
was then multiplied by the total prevalence of primary insomnia (based on Ohayon and
Reynolds (2009)) to form an estimate for each age group. Using this age distribution, the
number of people in each age group was adjusted so that the total prevalence was equal to
that implied by the overall prevalence rate.

Re-awakening Australia
12 Deloitte Access Economics
Table 1.3: Estimated prevalence rates of primary insomnia by age group
Age
Group
Insomnia
symptoms
Relative
Ratio(a)
Male primary
insomnia(b)
Female primary
insomnia(b)
% % No. % No.
20-24(c)
26.6 0.8 1.5 13,044 3.0 23,626
25-34 27.2 0.8 1.6 25,320 3.0 47,906
35-44 29.6 0.9 1.7 26,899 3.3 52,390
45-54 34.4 1.0 2.0 29,938 3.8 58,722
55-64 42.0 1.2 2.4 30,545 4.7 59,615
65 + 47.7 1.4 2.8 37,916 5.3 86,422
Total 34.5 1.0 2.0 163,661 3.9 328,681
Note: (a) Ratio of the prevalence of symptoms in each age group to the total prevalence of symptoms. (b) This
was estimated for each age group by multiplying the total population prevalence for each gender (2% and 3.9%)
by the relative ratio of insomnia symptoms for each age group, adjusting so that the total across age groups was
equal to the total prevalence. (c) Figures for the age group 20-24 years were based on estimates by Ohayon and
Reynolds (2009) for the age group 15-24 years.
Source: Deloitte Access Economics calculations.
As indicated in Table 1.3, the proportion of individuals experiencing some form of insomnia
symptoms (including difficulty initiating or maintaining sleep, early morning awakening or
non restorative sleep) is substantially higher for people aged 45 years and over than the
proportion of people who meet the diagnostic criteria for insomnia syndrome. Thus to
some extent the prevalence of primary insomnia syndrome underestimates the experience
of insomnia among the general population.
1.1.3 Restless legs syndrome
RLS is a common, under-diagnosed and treatable central nervous system disorder
characterised by disagreeable leg sensations that cause an almost irresistible urge to move
the legs. Allen et al (2003) defined and diagnosed RLS according to the following four
criteria:
• an urge to move the legs, usually accompanied or caused by uncomfortable or
unpleasant sensations in the legs;
• the urge to move or unpleasant sensations begin or worsen during periods of rest or
inactivity such as lying or sitting;
• the urge to move or unpleasant sensations are partially or totally relieved by
movement, such as walking or stretching, at least as long as the activity continues;
and
• the urge to move or unpleasant sensations are worse in the evening or night than
during the day or only occur in the evening or night.
RLS is closely related to periodic limb movements disorder (PLMD). The latter is
characterised by periodic episodes of repetitive limb movements caused by contractions of
the muscles during sleep. This report focused on RLS because it is more prevalent than
PLMD (Ohayon and Roth 2002) and there is a greater body of evidence on the relationship
between RLS and other health impacts.
Re-awakening Australia
13 Deloitte Access Economics
The prevalence of RLS in Australia was previously estimated by Access Economics (2005)
based on an analysis of the RLS Epidemiology, Symptoms and Treatment (REST) data
(Hening et al 2004, Allen et al 2002). The REST data consists of two samples:
• a sample of 23,052 individuals visiting primary care physicians; and
• a general (random) population sample of 15,391 individuals.
Analysis of the first sample showed that of those who reported RLS symptoms at least once
per week, 25% experienced RLS symptoms at least twice per week causing moderate-
severe distress (which was matched and confirmed by their GP). This was then adjusted
based on the proportion of those in the general population sample who reported RLS
symptoms at least once per week in order to derive population based estimates of the
proportion of individuals experiencing RLS symptoms at least twice per week involving
moderate-severe distress.8 Access Economics (2005a) found that based on the age-gender
distribution in Australia, the prevalence of those experiencing RLS symptoms at least twice
per week causing moderate-severe distress was 1.4%.
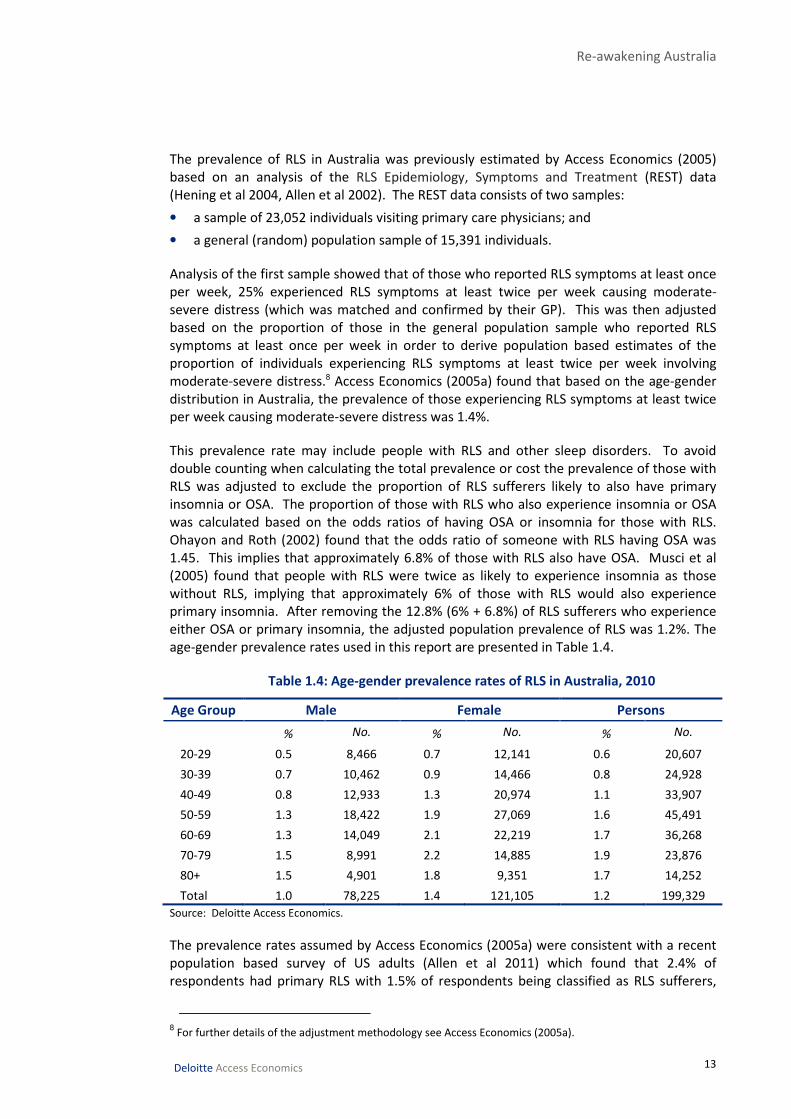
This prevalence rate may include people with RLS and other sleep disorders. To avoid
double counting when calculating the total prevalence or cost the prevalence of those with
RLS was adjusted to exclude the proportion of RLS sufferers likely to also have primary
insomnia or OSA. The proportion of those with RLS who also experience insomnia or OSA
was calculated based on the odds ratios of having OSA or insomnia for those with RLS.
Ohayon and Roth (2002) found that the odds ratio of someone with RLS having OSA was
1.45. This implies that approximately 6.8% of those with RLS also have OSA. Musci et al
(2005) found that people with RLS were twice as likely to experience insomnia as those
without RLS, implying that approximately 6% of those with RLS would also experience
primary insomnia. After removing the 12.8% (6% + 6.8%) of RLS sufferers who experience
either OSA or primary insomnia, the adjusted population prevalence of RLS was 1.2%. The
age-gender prevalence rates used in this report are presented in Table 1.4.
Table 1.4: Age-gender prevalence rates of RLS in Australia, 2010
Age Group Male Female Persons
% No. % No. % No.
20-29 0.5 8,466 0.7 12,141 0.6 20,607
30-39 0.7 10,462 0.9 14,466 0.8 24,928
40-49 0.8 12,933 1.3 20,974 1.1 33,907
50-59 1.3 18,422 1.9 27,069 1.6 45,491
60-69 1.3 14,049 2.1 22,219 1.7 36,268
70-79 1.5 8,991 2.2 14,885 1.9 23,876
80+ 1.5 4,901 1.8 9,351 1.7 14,252
Total 1.0 78,225 1.4 121,105 1.2 199,329
Source: Deloitte Access Economics.
The prevalence rates assumed by Access Economics (2005a) were consistent with a recent
population based survey of US adults (Allen et al 2011) which found that 2.4% of
respondents had primary RLS with 1.5% of respondents being classified as RLS sufferers,
8 For further details of the adjustment methodology see Access Economics (2005a).
Re-awakening Australia
14 Deloitte Access Economics
namely those who experience two or more symptoms per week causing moderate – severe
distress.
While RLS sufferers are more likely to require treatment for their condition, those with
primary RLS who experience infrequent symptoms may still be adversely affected by their
condition. Allen et al (2011) found that, of people with primary RLS, those with moderate
RLS experienced an average productivity loss of 7.4%, compared to those with severe and
very severe RLS who experienced an average productivity loss of 20.1%, and 57.8%
respectively. This suggests that those with primary RLS experiencing moderate but
infrequent symptoms may still be affected to some degree by RLS. For this reason basing
prevalence rates on the proportion of individuals who experience at least two or more
symptoms per week causing moderate-severe distress is likely to provide a conservative
estimate of the proportion of individuals affected by primary RLS. Nevertheless such a
definition provides a reasonable estimate of the proportion of individuals whose symptoms
are severe enough to warrant treatment.
1.1.4 Other
Another sleep condition which is highly prevalent is sleep deprivation. A recent study of
3,300 people in New South Wales found that 18.4% reported sleeping fewer than 6.5 hours
per night on average (Bartlett et al 2008b). Although sleep deprivation has been linked to a
range of health conditions (discussed in further detail in Section 1.2) this report did not
include the cost of sleep deprivation because it reflects, to some extent at least, a lifestyle
choice by individuals. By sleeping fewer hours individuals implicitly indicate that the cost of
reduced sleep is outweighed by the benefits to them of other activities such as work,
socialising or exercise.
1.1.5 Total prevalence of sleep disorders
The prevalence assumptions for each sleep disorder are summarised in Table 1.5. To
account for the possibility of overlap people with OSA and another condition were counted
as having OSA. People with RLS and another condition were counted towards the other
condition, rather than RLS. The reason for this was that in the costing exercise, the most
information was available for OSA, then insomnia and then RLS, and this was the order of
costliness. Hence for a person with more than one condition, the cost of the most
expensive condition was counted and no additional cost of any other condition, which is
probably conservative, but which was necessary due to the data contraints.
A prevalence rate of 4.7% was assumed for OSA. This was based on the proportion of
individuals with an AHI ≥ 15 estimated by Bixler et al (2001). Sensitivity analysis was
conducted at 4% and 6% based on the results of Young et al (2005). Where a prevalence of
OSAS was required for estimating the PAF, it was assumed to be 3% — consistent with
Young et al (2005). A sensitivity analysis was carried out at 2% and 4% based on the range
of estimates provided in Table 1.3.
The prevalence rate of primary insomnia was assumed to be 3% based on the results of a
large-scale telephone survey of seven European countries by Ohayon and Reynolds (2009).
Sensitivity analysis was also conducted at 1.5% given the results of other studies (Ram et al
2010, Ohayon and Partinen 2002, Ohayon and Caulet et al 1997a). The estimate of the
prevalence of primary insomnia from Ohayon and Reynolds (2009) explicitly excluded those

Re-awakening Australia
15 Deloitte Access Economics
with sleep apnoea (and a number of other sleep disorders) thus there is no need to adjust
for any overlap between insomnia and OSA.
A prevalence rate of 1.2% was assumed for RLS. This was based on the prevalence used in
Access Economics (2005a) adjusted for the potential overlap between insomnia and OSA.
This was consistent with a recent US population survey which found that 1.5% of
respondents had primary RLS involving two or more symptoms per week causing moderate-
severe distress (Allen et al 2011).
Table 1.5: Prevalence of sleep disorders in Australia
Sleep Disorder Low Base case High
Obstructive Sleep Apnoea (AHI≥15) 4.0% 4.7% 6.0%
Obstructive Sleep Apnoea Syndrome(a)
2.0% 3.0% 4.0%
Primary Insomnia 1.5% 3.0% —
Restless Legs Syndrome — 1.2% —
Note: (a) OSAS was used interchangeable with OSA, depending on the definition that most appropriately
matched the definition used for the rest of the calculation.
Source: Deloitte Access Economics calculations.
The estimates presented Table 1.5 imply that the overall prevalence of these
three sleep disorders (using OSA not OSAS) in Australia is 8.9%. This may be an
underestimate given that the prevalence of people experiencing symptoms of
insomnia, RLS or OSA is substantially higher than the proportion of people who
are diagnosed with these conditions.
1.2 Sleep disorders and other health conditions
There is a large literature linking sleep disorders to other health conditions, motor vehicle
and workplace accidents. Since OSA is the most well-defined sleep disorder it tends to
dominate the literature and has been linked to a number of cardiovascular diseases (CVDs)
such as hypertension, coronary heart disease, heart failure, stroke, cardiac arrhythmia, and
pulmonary hypertension (Young et al 2002). Insomnia and RLS have not generally been
linked to CVD but have been linked to the experience of mental illness.
This section examines the literature on sleep disorders and other health conditions in order
to determine whether a causal relationship exists between them. Where a causal
relationship has been found, odds ratios from relevant studies are presented (where
available) which indicate the ratio of the odds of experiencing that medical condition for an
individual with a sleep disorder compared to those without a sleep disorder.
There are two types of studies commonly used to investigate the association of sleep
disorders with other medical conditions.
• Co-existence or cross-sectional studies — look at the prevalence of sleep disorders
in people with another medical condition at a particular point in time. This approach,
the more frequently available, does not actually establish a cause and effect
relationship between sleep disorders and comorbidities.

Re-awakening Australia
16 Deloitte Access Economics
• Prospective or longitudinal studies — track a group of people known to have a sleep
disorder to determine the odds ratio of contracting another medical condition
(assumed to be associated with the sleep disorder). Ideally such studies should
exclude those with the medical condition at the base year and examine whether the
presence of a sleep disorder increases the likelihood of experiencing that medical
condition in the future.
Both types of studies are discussed in the following sections although where prospective
results are available these are discussed in greater detail since they are more likely to
indicate a causal relationship between a sleep disorder and a medical condition, although
this will depend on the particular methodology employed.
1.2.1 Cardiovascular disease
In 1990 Partinen and Guilleminault (1990) highlighted the close association between OSA
diagnosis and CVD in the general population. Since then, significant attention has been
directed towards exploring the relationship between OSA and CVD. The pathogenesis
between OSA and CVD is not yet fully understood, although current theories indicate that
pathogenesis is likely to be a multifactorial process involving various mechanisms, such as
sympathetic nervous system overactivity, selective activation of inflammatory molecular
pathways, endothelial dysfunction, abnormal coagulation and metabolic
dysregulationoxidative stress, systemic inflammation, hypercoagulability, hyperleptinemia,
and insulin resistance (McNicholas and Bonsignore 2007).
The effect of RLS and primary insomnia on CVD has not been considered in this
report given uncertainty in the literature about whether RLS and insomnia are
related to CVD.
For example, while a recent study by Winkelman et al (2008) found that RLS was
statistically significantly associated with CVD (but not hypertension), there have not been
any long term prospective studies of the relationship between RLS and CVD to confirm this
relationship. The pathogenesis for a link between RLS and CVD also remains unclear,
although Winkelman et al (2008) suggest RLS may lead to electroencephalographic arousals
or substantial autonomic hyperactivity during sleep.
Furthermore Spiegelhalder et al (2010) noted that although some studies have found
insomnia to be associated with CVD, most of these did not use adequate diagnostic criteria
for insomnia or failed to control for the effect of depression on CVD. Spiegelhalder et al
(2010) also observed that longitudinal studies have failed to find any increased mortality
risk associated with insomnia. While Phillips and Mannino (2007) found that insomnia may
lead to a slightly increased risk of CVD in their longitudinal analysis, they concluded that
the:
“modest and inconsistent associations that we found between sleep complaints
and incident cardiovascular disease and hypertension suggest that insomnia is
not a robust contributor to adverse cardiovascular events.”

Re-awakening Australia
17 Deloitte Access Economics
1.2.1.1 Hypertension (high blood pressure)
There is an established literature showing the likelihood of a person with OSA having
hypertension is substantially higher than for a person without OSA. There is less concrete
evidence of a causal link — one of the difficulties in establishing a causal link is controlling
for confounding factors such as obesity. However, several studies have investigated using
prospective studies of people initially without hypertension and concluded that OSA
appears to contribute to its development.
Using the Sleep Heart Health Study (a longitudinal survey containing 6,132 respondents),
Nieto et al (2000) undertook a co-existence study and found a statistically significant trend
between AHI levels and hypertension (the p-value for the trend was 0.005) after adjusting
for a range of factors including age, sex, ethnicity, BMI and neck, waist to hip ratios. The
odds ratio of hypertension found for those with different categories of AHI levels is shown
in Table 1.6.
Table 1.6: Odds ratio of having OSA and hypertension
AHI level Odds ratio of hypertension (95% confidence interval)
1.5 – 5 1.07 (0.91 - 1.26)
5 – 15 1.20 (1.01 - 1.42)
15 – 30 1.25 (1.00 - 1.56)
30+ 1.37 (1.03 - 1.83)
Note: The odds ratios compare the AHI level indicated to that of a person with an AHI < 1.5.
Source: Nieto et al (2000).
While these co-existence studies illustrate a clear association between hypertension and
OSA, they have not established a causal link. Peppard and Young et al (2000) found that a
minimally elevated AHI (of less than five episodes of apnoea or hypopnoea per hour of
sleep) in the starting period was associated with a statistically significant 42% increase in
the odds of developing hypertension over a four-year follow up period.9 Those with an AHI
level of 15 or more had a statistically significant odds ratio of 2.9 for developing
hypertension compared to individuals with an AHI of zero. Peppard and Young et al (2000)
took into account hypertension levels at the base year, non modifiable risk factors, BMI,
smoking and alcohol use.
The relationship between OSA and hypertension has recently been brought into question
by a prospective analysis of the Sleep Heart Health Study. O’Connor et al (2009) found that
although baseline AHI was associated with an increased likelihood of hypertension the
relationship between baseline AHI and hypertension was not statistically significant after
including baseline BMI. For those with an AHI > 30 the odds ratio for incipient hypertension
was found to be 1.50 with a 95% confidence interval of 0.91 to 2.46. While this was not
statistically significant at the 5% level, the authors noted that it was still possible some
association might exist between severe OSA and hypertension.
Peppard (2009) argued that the differences between results presented in O’Connor et al
(2009) and Peppard and Young et al (2000) were largely attributable to the different
samples and methodology used. In particular, the two studies used different base
9 With a 95% confidence interval of 13% to 78%.
Re-awakening Australia
18 Deloitte Access Economics
categories (AHI=0 in the Wisconsin Sleep Cohort Study and AHI<5 in the Sleep Heart Health
Study) and different methods of AHI estimation (Peppard and Young et al (2000) used
laboratory polysomnography while O’Connor et al (2009) used at home polysomnography).
There was also a greater degree of survivor bias in the Sleep Heart Health Study, since 51%
of individuals were excluded due to hypertension at the baseline. This is potentially
problematic because the Sleep Heart Health Study consisted of an older age group (the
survey only includes those aged over 40 years). Those who did not have hypertension at
the baseline, given their older age, may have had some individual specific characteristics
that make them less susceptible to hypertension such as genetics or lifestyle factors. This
problem was less of an issue in the Wisconsin Sleep Cohort Study since the population was
younger on average and 27% were excluded for being hypertensive at the baseline. For
these reasons the odds ratio estimated by Peppard and Young et al (2000) was used to
calculate PAFs for hypertension in this report.
There was also some evidence from randomised clinical trials that supports a statistically
significant relationship between OSA and hypertension. Duran et al (2001) conducted a
random clinical trial of 340 patients recently diagnosed with systematic hypertension who
had an AHI > 15, with half being assigned to continuous positive airway pressure (CPAP)
treatment, and the remainder being assigned to a sham CPAP treatment. They found that
CPAP led to a statistically significant but small reduction in blood pressure in patients with
systemic hypertension and OSA. This result is consistent with Peppard and Young et al
(2000).
1.2.1.2 Congestive heart failure
Congestive heart failure (CHF) occurs when the pumping action of the heart is inadequate
to supply sufficient blood flow to meet the needs of the body. This can be caused by a
number of other conditions such as high blood pressure, cardiomyopathy (primary heart
muscle weakness) or a damaged heart valve (AIHW 2011a). CHF has traditionally been
closely associated with central sleep apnoea (CSA) rather than OSA. However, there is
some epidemiological evidence that suggests OSA may increase the risk of CHF.
A recent study found that, among people with CHF, the prevalence of CSA was 37%
compared to 12% for OSA (Javaheri 2006). The literature is largely uncertain as to whether
CSA causes CHF or whether the reverse is true. Wolk et al (2003) note that CSA “may have
an important influence on prognosis, in that its presence is associated with increased
mortality in CHF patients”, although it is “unclear whether CSA directly affects CHF
pathophysiology and can therefore be causally linked to prognosis, or whether it is rather
an index of the severity of CHF”. Wolk et al (2003) also note “that CHF predisposes to CSA
and, in turn, CSA contributes to CHF progression”. Thus the precise quantification of the
cause and effect relationship between CSA and CHF is unclear.
Epidemiological data suggest that OSA may also lead to an increased risk of CHF. In a cross-
sectional study, Shahar et al (2001) found that those with AHI scores in the top quartile had
a 2.4 times increased risk of heart failure. Adjusting the top quartile from this study to an
odds ratio for an AHI>15 or an AHI>30 presents challenges. Moreover, the study was cross-
sectional. However, a recent prospective study found that OSA was responsible for an
increased risk of heart failure for men (but not for women). Gottleib et al (2010) found that

Re-awakening Australia
19 Deloitte Access Economics
men who had an AHI>30 were 1.58 times more likely to experience heart failure (based on
the adjusted hazard ratio).10 Both studies used data from the Sleep Heart Health Study.
The results of Gottleib et al (2010) were used in this report for the relationship
between OSA and CHF, since it was prospective and presented results for
AHI>30.
1.2.1.3 Myocardial infarction and coronary artery disease
Coronary artery disease, also referred to as coronary heart disease or ischaemic heart
disease has two main clinical manifestations: myocardial infarction or angina. It is caused
by a build up of plaque (fat, cholesterol, calcium, and other substances found in the blood),
inside the coronary arteries and can result in a heart attack (or acute myocardial infarction)
if a blood vessel supplying the heart is suddenly blocked completely (AIHW 2011a). The
pathogenesis between OSA and coronary artery disease is not well understood. However,
people with OSA appear to have a higher prevalence of coronary artery disease than the
general population. Whether OSA is a causal factor in the development of coronary artery
disease has not been widely researched but there is some evidence to suggest that it is.
In a co-existence study, Shahar et al (2001) found a statistically significant relationship
between OSA and coronary artery disease. They found that those in the top AHI quartile
(with an AHI > 11) had an odds ratio for coronary artery disease of 1.27 compared to those
in the lowest AHI quartile. In a small Swedish prospective study Peker et al (2006) found
that those with OSA at the baseline who had not received or properly completed treatment
for OSA had an odds ratio of 5.4 for developing coronary artery disease or experiencing a
myocardial infarction, although their study only controlled for a limited set of confounding
factors.
In another prospective study Marin et al (2005) followed 1,651 Spanish men over a period
of 10 years and found that the odds ratio for experiencing non-fatal cardiovascular events
(defined as either myocardial infarctions, strokes or the need for coronary artery bypass
surgery or percutaneous transluminal coronary angiography) was 3.17 for those with an
AHI≥30.
While Peker et al (2006) found that those with OSA had a relatively high odds
ratio for coronary artery disease and myocardial infarction, their study only
controlled for a limited number of confounding factors. For this reason results
from Marin et al (2005) were used in this report for the relationship between
OSA and coronary artery disease.
1.2.1.4 Stroke
The results of both co-existence and prospective studies have generally found that OSA is
related to the onset of strokes. A stroke occurs when the blood supply to the brain is
interrupted, either due to an arterial blockage or bleeding (AIHW 2011a), often resulting in
10
Although this particular category was not statistically significant, the overall effect of AHI levels (when
measured as a continuous variable) on the incidence of CHF was statistically significant at the 5% level.

Re-awakening Australia
20 Deloitte Access Economics
severe impairment or death. Similar to other CVDs, the pathogenesis between strokes and
OSA has not been comprehensively established. However, there is evidence of a higher
incidence of strokes among people with OSA.
In a co-existence study, Shahar et al (2001) found that the association between OSA and
strokes was stronger than the link between OSA and total CVD. They found that the odds
ratio of prevalent stroke in people in the upper OSA AHI quartile, compared to those in the
lowest quartile, was 1.58.11
In a recent prospective study, Yaggi et al (2005) found that after controlling for relevant
factors including hypertension, diabetes and BMI, those with OSA at the baseline had a
hazard ratio of 1.97 for suffering a stroke or death from any cause. Valham et al (2008)
examined the impact of OSA on strokes among patients with coronary artery disease. In
this prospective study those with an AHI > 15 had a statistically significant hazard ratio of
3.56 for experiencing a stroke.
Other prospective studies have examined the relationship between sleep disorders and
strokes specifically. Using prospective data from the Wisconsin Sleep Cohort study, Arzt et
al (2005) found that those with an AHI>20 had an odds ratio of 3.08 for experiencing a
stroke compared to those with an AHI<5, but this was not statistically significant. Another
prospective study using the Sleep Heart Health Study (Redline et al 2010) found that AHI
levels were linearly associated with an increased risk of stroke for men, with each unit
increase of AHI increasing stroke risk by 6% (with a confidence interval of 2% - 10%). Men
in the highest AHI quartile (corresponding to an AHI > 19) had an adjusted hazard ratio for a
stroke of 2.86. However, there was not a statistically significant relationship between
strokes and AHI quartiles for women. This gender difference may potentially explain why
Arzt et al (2005) failed to find a statistically significant relationship in their data.
The results of Redline et al (2010) were deemed to be the most robust given a
large, unbiased sample and appropriate estimation methodology. As such
these were used as the basis of the calculations for the relationship between
OSA and stroke in this report.
1.2.1.5 Other cardiovascular diseases
Although the exact nature of the relationship between OSA and many cardiovascular
conditions is unclear, numerous cross-sectional studies have found OSA to be associated
with increased CVD mortality (He et al 1988, Partinen et al 1988, Peker et al 2000, Mooe et
al 2001, Ancoli-Israel et al 1996, Mant et al 1995). Two recent prospective studies have also
found OSA to be significantly associated with CVD mortality. Marin et al (2005) found, in a
10 year prospective study, that men with an AHI > 15 had an odds ratio of 2.87 for fatal and
3.17 for non fatal cardiac events, after adjusting for controls and CVD at the baseline.
11
This compares people in the upper quartile of AHI (11 or more episodes of apnoea or hypopnoea per hour of
sleep) with people in the lower quartile of AHI (< 1.3 episodes of apnoea or hypopnoea per hour of sleep). The
95% confidence interval was 1.02 to 2.46.

Re-awakening Australia
21 Deloitte Access Economics
Atrial fibrillation
A number of studies have found an association between OSA and instances of atrial
fibrillation. Gami et al (2004) found that the adjusted odds ratio of experiencing atrial
fibrillation for those with OSA was 2.19, while Mooe et al (1995) found that the relative risk
of atrial fibrillation for those with OSA was 2.8. However, Porthan et al (2004) was unable
to find a statistically significant association between atrial fibrillation and OSA, suggesting
that the strength of the association remains unclear.
This report does not include impacts of OSA on atrial fibrillation due to the lack
of conclusive evidence at this stage. More research is required in this area.
The relationship with CVD mortality is not directly included, but is captured in
costs from the established relationships between OSA and CHF, coronary
artery disease and stroke.
1.2.2 Diabetes
A large number of studies have examined the relationship between OSA and diabetes.
Although the vast majority of cross-sectional studies have found that a statistically
significant relationship exists between OSA and diabetes (see Shaw et al 2008 for an
extensive review of this literature), this relationship has not yet been definitively confirmed
in prospective studies. Consequently, it remains unclear whether a causal relationship
exists between OSA and diabetes.
Some cross-sectional studies have found a statistically significant relationship between OSA
and diabetes. One large US cross-sectional study by Punjabi et al (2004) found a statistically
significant relationship between those with an AHI > 15 and diabetes after taking into
account age, gender, BMI and waist circumference. Punjabi et al (2004) found that those
with an AHI > 15 had an odds ratio of 1.46 for experiencing diabetes.
Another way in which the literature has sought to examine the relationship between OSA
and type 2 diabetes has been to examine the relationship between OSA and insulin
resistance. Punjabi et al (2002) found that sleep disordered breathing was associated with
an increased risk for glucose intolerance and insulin resistance. This was consistent with
the results of an earlier study by Bresnitz et al (1994). Ip et al (2002) also found that those
with OSA were more insulin-resistant, with stepwise regression showing that AHI levels
were independent determinants of insulin resistance in both obese and non obese subjects,
with greater resistance the more severe the OSA.
Another way in which the literature has sought to examine the relationship between OSA
and diabetes has been through prospective studies. Reichmuth et al (2005) examined 978
subjects from the Wisconsin Sleep Cohort Study who reported no diabetes at the baseline
and had at least one follow-up visit. They found that the odds ratio for a diagnosis of
diabetes on a follow up visit for those who had an AHI > 15 was statistically significant after
adjusting for age and sex but not statistically significant after body habitus (physique or
body build) was taken into consideration. The odds ratio after accounting for age, sex and
body habitus was 1.62 (0.67 – 3.65). This contrasted with their cross sectional results,
which had shown a significant association between the prevalence of diabetes and those
with an AHI > 15. The authors hypothesised that OSA might be linked to obesity, which
itself leads to an increased risk of developing diabetes. They also noted that while OSA may

Re-awakening Australia
22 Deloitte Access Economics
impair the body’s use of glucose (as found in the studies on insulin resistance) it may not
hasten the development of diabetes mellitus independently of other factors such as age
and weight. One notable limitation of the study was the relatively short follow-up period of
four years.
The results of Reichmuth et al (2005) were revisited in an Australian prospective analysis of
those in the Busselton health study (Marshall et al 2009). They found that mild sleep
apnoea (5 < AHI < 15) was not significantly related to subsequently developed diabetes.
However, those with an AHI > 15 did have a statistically significant increased risk of
developing diabetes with an odds ratio of 13.45 after including controls for age, gender,
waist circumference, BMI, mean arterial pressure and cholesterol. Nevertheless the study
had a relatively small sample of individuals with an AHI > 15 (n=10), so the results were not
definitive. In a 16 year Swedish follow-up, Celen et al (2010) found that OSA was
significantly associated with incidence of diabetes among women but not men, although
their definition of OSA was based on a low AHI threshold and their sample size only
contained 168 individuals.
Botros et al (2009) also conducted a prospective study of the relationship between OSA and
diabetes among elderly patients in Connecticut, finding a significant association between
OSA and incident diabetes with a hazard ratio of 1.43 per quartile.
Although these prospective studies have strengthened the case for the
existence of a causal relationship between OSA and diabetes, none contain a
comprehensive data set and thus the existence of a causal relationship
between OSA and diabetes (and therefore the associated costs) remains
unclear. For this reason PAFs were not calculated for diabetes, although this is
an active area of research interest and more definitive results on the link
between OSA and diabetes is likely to emerge in the future.
1.2.3 Metabolic syndrome
Tasali and Ip (2008) reviewed the relationship between OSA and metabolic syndrome. They
found that although a number of cross-sectional studies showed a link between the two,
the majority lacked sufficient sample size and did not adequately control for confounding
factors such as visceral obesity. They also noted that data from prospective studies are
currently lacking and that further research is need to elucidate the complex relationship
between OSA, metabolic syndrome, obesity and type 2 diabetes.
A relationship between OSA and metabolic syndrome was not included in this
report, due to data and evidence gaps.
1.2.4 Depression
Sleep disorders have been found to be closely linked to the experience of depression. One
of the difficulties in assessing the relationship between sleep disorders and depression is
that sleep disruption itself is a clinical symptom of depression (American Psychiatric
Association 1987) thus, where possible, information from prospective studies was used.

Re-awakening Australia
23 Deloitte Access Economics
1.2.4.1 OSA and depression
In a seminal study, Vandeputte and de Weerd (2003) assessed the prevalence of depression
in 917 patients with a range of sleep disorders from the Center for Sleep and Wake
Disorders in the US. The Beck depression scale (see Table 1.7) was used to assess the level
of depression indicated by each individual.
Table 1.7: Beck depression scale
Beck score Grade of depression
0-9 No or minimal depression
10-14 On the border of a depression
15-20 Mild depression
21-30 Mild-moderate depression
31-40 Moderate-severe depression
41-63 Severe depression
Source: Vandeputte and de Weerd (2003).
Vandeputte and de Weerd (2003) examined 167 individuals with OSAS. Of those, 41%
indicated some form of depression and 1.6% indicated moderate or severe depression.
Interestingly, across all forms of sleep disorder more than 25% of patients indicated some
form of depression.
A subsequent prospective study by Peppard et al (2006) focused on the relationship
between OSA and depression, finding a statistically significant relationship. Those with mild
OSA (AHI≥5) had an odds ratio of 2.0 for developing depression compared to those with no
OSA. Those with moderate to severe OSA (AHI≥15) had a 2.6 times higher risk of
developing depression than those without OSA.
The results of Peppard et al (2006) were used in this report to quantify the link
between OSA and depression, since they controlled for confounding factors
such as hypertension, age and so on, unlike Vandeputte and de Weerd (2003).
1.2.4.2 Insomnia and depression
An early prospective study of the relationship between insomnia and depression by Breslau
et al (1996) found that those with a history of insomnia at the baseline had a four times
higher relative risk for new onset of depression than those who did not have insomnia at
the baseline. These results were later confirmed by Roberts et al (2000) who conducted a
prospective study of Californian individuals aged 50 and over. Roberts et al (2000) found
that after excluding those with a major depressive episode in the base year (1994), those
experiencing insomnia in both 1994 and 1995 had an odds ratio of 8.08 for experiencing a
major depressive episode in 1995 (Table 1.8). However, those who only experienced
insomnia in 1994 did not have a significantly increased risk of experiencing a major
depressive episode in 1995. Nonetheless, the results of Roberts et al (2000) suggest that
persistent insomnia is causally related to the experience of major depressive episodes.

Re-awakening Australia
24 Deloitte Access Economics
Table 1.8: Relationship between insomnia and major depressive episodes
Relation to depression in 1995
Unadjusted odds Adjusted odds
Sleep complaint Odds ratio 95% CI Odds ratio 95% CI
Neither year 1.00 1.00
1994 only 1.80 0.74-4.38 1.66 0.67-4.09
1995 only 10.89 6.67-17.77 10.29 6.23-16.66
1994 and 1995 9.23 5.63-15.13 8.08 4.88-13.39
Note: N = 2,164; excludes subjects who were depressed in 1994 (N=206). Adjusted for age, gender, marital
status, social isolation, education, financial problems, problems with daily activities, and heavy drinking.
Source: Roberts et al (2000).
A recent meta-analysis of 21 longitudinal studies on the relationship between
insomnia and depression yielded an overall odds ratio for developing
depression of 2.10 for those with insomnia at the baseline (Baglioni et al 2011).
Since this estimate takes into account the results of a range of studies it is used
for the purpose of calculating PAFs in this report.
1.2.4.3 RLS and depression
Picchietti and Winkelman (2005) conducted a systematic review of the literature on the
relationship between RLS and depression. They found that existing population based
studies indicated a range of odds ratios for the risk of depression among those with RLS,
with one study finding an odds ratio of 2.6, another an odds ratio of 3.1 while a third study
found an odds ratio of 13.06 among men but no significant relationship for women.
A recent cross-sectional study in the US found that those with RLS had an adjusted odds
ratio of 2.7 for experiencing major depressive disorder over an individual’s lifetime and an
odds ratio of 4.7 for having experienced a major depressive disorder in the last twelve
months (Lee et al 2008). Another cross-sectional study, conducted on Korean adults, found
that those with RLS had an odds ratio for depression over their lifetime of 2.57 and an odds
ratio of 2.99 for experiencing major depressive disorders in the last twelve months (Cho et
al 2009).
However, Lee et al (2008) and Cho et al (2009) contained a small sample of those with RLS
(42 and 72 individuals respectively). A cross-sectional study of German adults (Winkelman
et al 2005) included a larger sample of those with RLS (130 individuals) and found that the
odds ratio of experiencing a major depressive episode (not caused by another medical
condition) was 1.93 over an individual’s lifetime and 1.31 over the previous 12 months,
although the latter odds ratio was not statistically significant.

Re-awakening Australia
25 Deloitte Access Economics
The results of Winkelman et al (2005) were used as the basis of the calculation
in this report given a larger sample size. Since the odds ratio for depression
over the previous 12 month was not statistically significant, the lifetime odds
ratio was used.
1.3 Sleep disorders and the risk of accidents
Aside from the increased risk of experiencing particular health conditions, those with sleep
disorders are also likely to face an increased risk of having a motor vehicle accident (MVA)
or workplace accident, due to lapses in concentration or fatigue.
OSA has been found to be associated with an increased likelihood of MVAs,
although the effect of insomnia and RLS on MVAs has received relatively little
attention in the literature. There also appears to be a relationship between
OSA and insomnia and workplace accidents, although the literature on this
relationship is less extensive.
1.3.1 Motor vehicle accidents
The relationship between fatigue and MVAs has been well established. Ohayon and Caulet
al (1997b) found that 9.3% of those with severe daytime sleepiness had experienced a MVA
in the past 12 months, compared to 4.7% of those who did not suffer from daytime
sleepiness. However, while the positive association between OSA and MVAs has been well
established (Ellen et al 2006), the relationship between RLS and insomnia and MVAs has not
been well documented (Philip and Akerstedt 2006). Given the link between fatigue and
MVAs, more research is needed in order to clarify the effect of insomnia and RLS on
MVAs.
1.3.1.1 OSA
A number of studies have highlighted the relationship between OSA and increased risk of
motor vehicle accidents (MVAs). Austroads cited a number of studies in their Fitness to
Drive Guidelines (Austroads 2006) which indicated that:
• people with sleep apnoea are two to seven times more likely to have a motor vehicle
accident than people without sleep apnoea;
• sleep apnoea impairs driving performance to a similar extent to illegal alcohol
consumption or sleep deprivation; and
• drivers with severe sleep disordered breathing may have a much higher rate of
accidents than those with a less severe sleep disorder.
One difficulty in accurately estimating the magnitude of the relationship between OSA and
MVAs is that many studies contain relatively small sample sizes. Terran-Santos et al (1999)
found that those with AHI > 15 had an adjusted odds ratio of 8.1 for experiencing motor
vehicle accidents although they used a sample of only 102 people, drawn from those who
had been treated at emergency hospitals in Burgos or Santander in Spain following MVAs
on a highway.

Re-awakening Australia
26 Deloitte Access Economics
George (2001) took a different approach to examining the relationship between OSA and
MVAs, examining the impact of CPAP treatment on the risk of motor vehicle accidents.
George (2001) found (using a sample of 420 people) that those with untreated OSA had
0.18 motor vehicle crashes per year compared with 0.06 crashes per year for those without
OSA. Following CPAP treatment the number of crashes for people with OSA fell to 0.06, in
line with the control group. More recently, Mulgrew et al (2007) studied 375 crashes over a
three year period and found that those with an AHI between 6 and 15 had a relative risk of
2.6 of being involved in an MVA compared to controls, while those with an AHI > 30 had a
relative risk of 2.0 for being involved in a MVA compared to controls.
Two major meta-analyses have also been conducted on the relationship between OSA and
MVAs. Sassani et al (2004) conducted a meta-analysis of six studies to obtain a pooled OR
of the risk of a MVA among those with OSAS. The six studies provided odds ratios ranging
from 1.71 to 7.43 with a combined pooled odds ratio of 2.52. Ellen et al (2006) also
conducted a systematic review of the literature on OSA and MVAs. They found that 23 out
of the 27 studies on non-commercial drivers had found a statistically significant relationship
between OSA and MVAs including all studies the authors deemed to be ‘high quality’. The
odds ratio of an MVA for people with OSA across the studies ranged from 1.2 to 13, with a
median of 3.1.
Sassani et al (2004) was used as the basis for the relationship between OSA
and MVAs in this report – Section 2.4.1 provides more detail regarding the
reasons for this choice.
1.3.1.2 Insomnia
Surprisingly, a clear relationship between insomnia and MVAs has not yet emerged. An
early study by Balter and Ulenhuth (1992) found that people with insomnia were 3.5 to 4.5
times more likely to experience a MVA than controls. More recently, Daley et al (2009)
examined 948 adults and found no significant difference in MVAs in the previous six months
for those with insomnia compared to good sleepers, although only 34 individuals reported
experiencing accidents. In a study of 738 people, Leger et al (2006) found people with
insomnia were more likely to report experiencing both major and minor accidents in the
previous 12 months. However, there was no statistically significant difference in accident
rates between those with insomnia and good sleepers. Philip et al (2010) also found no
statistically significant relationship between insomnia and MVAs in a sample of 35,004
drivers, although they did find that insomnia and OSAS were statistically significant
predictors of driving accidents caused by sleepiness.
These mixed results indicate that more research is needed (preferably with
large sample sizes) before a definitive link between insomnia and MVAs can be
established, and a relationship is thus conservatively excluded in this report.
1.3.1.3 RLS
There is little evidence on the relationship between RLS and MVAs. Phillip et al (2010) did
not find a relationship between RLS and MVAs or MVAs due to sleepiness, although the
sample contained a relatively small number of accidents among those with RLS.
Re-awakening Australia
27 Deloitte Access Economics
A relationship between RLS and MVAs is thus excluded in this report. As with
insomnia, RLS causes fatigue and fatigue increases risk of MVAs – so this
exclusion may also be conservative and further studies are needed.
1.3.2 Workplace accidents
There is evidence that poor sleep impacts the risk of accidents in the workplace. However,
the links between specific conditions remain largely unexplored. While evidence from
small sample cross-sectional studies suggests that OSA and insomnia are associated with
workplace accidents, few studies have explored the relationship between RLS and
workplace accidents.
1.3.2.1 OSA
Current studies on the relationship between OSA and workplace injuries have a number of
limitations. A robust study was conducted by Lindberg et al (2001), who examined the
effect of snoring and excessive daytime sleepiness (EDS) on the risk of occupational
accidents. Snoring and EDS are the main symptoms of OSAS. A multivariate analysis
revealed that men who reported both snoring and EDS in the base year had an adjusted
odds ratio of 2.2 (95% confidence interval of 1.3 – 3.8) of having an occupational accident
over 10 years.12 For those who reported snoring and EDS in the base year and the final
year, the adjusted odds ratio became 3.1 (95% confidence interval of 1.5-6.4).
Two cross-sectional studies have examined the relationship between OSA specifically
(rather than symptoms) and workplace accidents specifically. A 10 year retrospective study
by Ulfberg et al (2000) found that men with OSAS had an odds ratio of 1.5 for experiencing
a workplace accident but this was not statistically significant.13 On the other hand, women
with OSAS had a much higher odds ratio (6.3), which was statistically significant.14 A New
Zealand study by Fransen et al (2006), based on a large sample of blood donors, found that
those with OSA had a statistically significant unadjusted odds ratio of 1.72 for experiencing
a workplace accident. However, Fransen et al (2006) identified self-reported OSA rather
than polysomnography and did not adjust the odds ratios for other confounding factors.
The odds ratio of 1.5 (Ulfberg et al 2000) was used to estimate the relationship
between OSA and workplace injuries, as unlike the other studies it looked at
OSA specifically and controlled for confounding factors.
1.3.2.2 Insomnia
Daley et al (2009) found that the odds ratio for those with insomnia experiencing other
accidents compared to good sleepers was 2.43, although the number of accidents
considered was relatively small. Leger et al (2002) also found that industrial accidents were
12
Adjustments were allowed for age, BMI, smoking, alcohol dependency, years at work, blue-collar job, shift
work, exposure to noise, organic solvents, exhaust fumes and whole-body vibrations.
13 While this result was not statistically significant at the 5% level, the 95% confidence interval ranged from 0.9
to 2.6 making it statistically significant at the 10% level.
14 It should be noted that the number of accidents involving women was small, containing only 34 women.
Re-awakening Australia
28 Deloitte Access Economics
more common among people with severe insomnia compared to good sleepers, which was
statistically significant. The number of accidents among severe insomniacs was relatively
similar in both studies.
The odds ratio of 2.43 (Daley et al 2009) was used to estimate the relationship
between insomnia and workplace injuries, since the odds ratio was not
quantified in Leger et al (2002).
1.3.2.3 RLS
Phillips et al (2006) found that 34% of people who experienced symptoms of RLS a few
nights a week reported making errors at work compared to 20% of those who did not.
However, Swanson et al (2011) did not find RLS to be a significantly associated with
mistakes at work, although it was significantly associated with concentration difficulties and
problems in the organisation.
A link between RLS and workplace accidents was not modelled in this analysis
and report due to the lack of robust evidence uncovered to date. As RLS
results in fatigue, which in turn is associated with workplace accident risk, it
appears more studies are needed.
1.4 Sleep disorders in children
There has been little research into the economic impact of sleep disorders in children due
to a paucity of data. A survey in Queensland suggested almost 30% of parents reported
sleep problems affecting the output and function of their children (Armstrong et al 1994).
Associations between OSA and hyperactivity, aggressive or rebellious behaviour,
inattention, and poor school performance has also been found (Ali et al 1993; Frank et al
1983; Guilleminault et al, 1981; Guilleminault 1982; Stradling et al 1990; Ali et al 1996).
Existing studies of OSA in children indicate a prevalence rate of around 2% (Marcus 2001),
although a longitudinal study by Brunetti et al (2001) found the prevalence of OSA in
children in southern Italy to be slightly lower, between 1% and 1.8%. Picchietti et al (2007)
found a prevalence rate of around 2% for RLS in children. The prevalence of insomnia
symptoms for children has, however, been found to range from 10% to 30% (Saarenpaa-
Heikkila et al 2000), although the proportion experiencing primary insomnia is likely to be
much lower.
The paucity of robust childhood studies using a polysomnography mean that the potential
contribution of OSA to cardiovascular and neurobehavioural impairments is unclear (Young
et al 2002). However, existing studies have concluded that there is an association. In their
recent review of the literature, Loghmanee and Sheldon (2010) noted that pediatric OSA
has been associated with failure to thrive, attention and behaviour problems, cognitive
impairment, hypertension, ventricular dysfunction, insulin resistance, and lipid
dysregulation. The relationship between sleep disordered breathing and neurobehavioural
function and CVD are discussed in greater detail below.
Neurobehavioural function
Re-awakening Australia
29 Deloitte Access Economics
O’Brien et al (2003) linked OSA to changes in neurobehavioral function leading to
symptoms of attention deficit/hyperactivity disorder (ADHD). There is a growing body of
literature associating OSA to behavioural problems like hyperactivity. ADHD is
characterised by inattention, overactivity and impulsivity. It also leads to other emotional,
behavioural and learning problems. There is increasing evidence that snoring and OSA are
associated with behavioural problems especially hyperactivity and ADHD. Gottlieb et al
(2003) recently found that sleep disorders in children were significantly related to
experiences of hypertension, inattention and aggressiveness. They found that children with
sleep disorders were twice as likely to experience these conditions. However, most of the
studies on sleep and ADHD (including Gottlieb et al (2003)) rely on parental reports of sleep
disturbance rather than objective sleep assessments using polysomnography.
Existing research suggests that there is a "neurocognitive window" for the proper diagnosis
and treatment of young children with sleep-breathing disorders before the impact on
academic performance and behaviour (O'Brien et al 2003, Urschitz et al 2003). The high
incidence of delayed sleep phase syndrome in older children and adolescents has
implications for school performance and behaviour and is only now being realised with
some US counties delaying high school starting times. The various economic impacts of
such children utilising health and educational resources is thought to be significant but not
yet quantified. There is a growing awareness that many children with sleep disorders such
as OSA and sleep disordered breathing as well as non-respiratory sleep disorders such as
Periodic Limb Movement Disorder (Chervin et al 2002, Walters et al 2000, Crabtree et al
2003) might present or even perform on testing like ADD/ADHD children (Teng et al 2003).
Gottlieb et al (2004) found that five year olds with sleep disordered breathing performed
significantly worse in tests of executive function, memory and intellectual ability than those
who did not experience sleep disordered breathing problems.
Cardiovascular and other impacts
Kwok et al (2003) found that children with primary snoring have increased daytime blood
pressure and reduced arterial distensibility, which may jeopardise long-term cardiovascular
health. They concluded that the foundations for metabolic and vascular derangement in
adult sleep disorders are laid earlier in childhood than previously imagined. Amin et al
(2008) similarly found that sleep disordered breathing in children was independently
associated with morning blood pressure surge, blood pressure load and 24-hour
ambulatory blood pressure.
There are other medical disorders that impact on sleep and are potential fragmenters of
parental sleep, such as gastric reflux, nocturnal seizures, developmental disorders, chronic
neonatal lung disease. Diette et al (2000) found that nocturnal asthma in children affects
school attendance, school performance, and parent work attendance.
While new data are emerging on the relationship between childhood sleep
disorders and long term health conditions, more research is needed before
sufficient robust data are available to derive PAFs.

Re-awakening Australia
30 Deloitte Access Economics
1.5 Costs of sleep disorders
To date there have been a number of studies on the economic costs of sleep disorders,
particularly in the US. This report builds on the work of a previous Access Economics
(2004a) report, Wake Up Australia, which estimated the economic cost of all sleep
disorders in Australia. It found that that the total direct and indirect financial costs of sleep
disorders were $6.2 billion with an additional estimated cost of $4.1 billion reflecting the
net cost of suffering.
Other studies have focused more specifically on the costs of OSA, insomnia or RLS. The
most recent estimate of the costs of OSA was completed in Denmark by Jennum and
Kjellberg (2011) who found that the total direct and indirect financial cost per person was
€3,860 in 2006 prices ($A6,433).15 If the total financial cost of sleep disorders estimated by
Hillman et al (2006) was divided by the estimated number of Australian adults with sleep
disorders in 2004, the average cost of sleep disorders per person with a sleep disorder was
$4,880 in 2004-05, which is not dissimilar to that estimated by Jennum and Kjellberg (2011).
In New Zealand, Scott et al (2007) derived a substantially lower estimate of $NZ40 million in
2005 dollars for the economic costs of OSA, but their study only considered the effect of
OSA on diabetes and CVD and did not consider the cost of reduced productivity.
The economic cost of insomnia in 2002 dollars was estimated by Daley et al (2009) for the
province of Quebec as $CAN 6.6 billion ($A 7.7 billion).16 This was equivalent to an annual
cost in 2002 dollars of $CAN 5,010 ($A 5,867) per person with insomnia. An earlier study of
the cost of insomnia in the US by Walsh and Engelhardt (1999) estimated the direct costs of
medical care associated with insomnia for the US to be around US$10.9 billion in 1990
dollars, of which US$1.1 billion was for prescribed medications. Health care services
accounted for US$9.8 billion, the majority of which was associated with nursing home care.
These studies suggest that insomnia is likely to involve large economic costs to society.
The economic cost of RLS was estimated by Access Economics (2005a) to be $1.38 billion in
2004 dollars which equates to just under $5,000 per person with RLS. This is slightly lower
than the estimated cost per patient of recent studies of OSA and insomnia.
1.6 Quality of life
OSA has been linked to reductions in self-reported quality of life. Using the Sleep Heart
Health Study, Baldwin et al (2001) found that severe sleep disordered breathing was
significantly and negatively associated with general health perception, physical and social
functioning and vitality. The odds ratio for having poor general health perception was 1.56
for those with severe sleep disordered breathing (similar odds ratios were derived for the
other indicators). Those experiencing RLS have also been found to report significantly
below average scores on a range of quality of life indicators (Allen et al 2005), while Leger
15
Reserve Bank of Australia (2011a) Conversion based on average monthly exchange rates during calendar year
2006.
16 Reserve Bank of Australia (2011a). Conversion based on average daily exchange rates during calendar year
2002.

Re-awakening Australia
31 Deloitte Access Economics
et al (2001) found that individuals with both mild and severe insomnia had significantly
lower mean scores across a range of quality of life indicators.

Re-awakening Australia
32 Deloitte Access Economics
2 Population attributable fractions Population attributable fractions (PAFs) refer to the proportion of one health condition,
injury or risk factor that can be directly attributed another, in this case to a sleep disorder.
This section estimates PAFs for sleep disorders, based on information obtained in the
literature review on prevalence and linkages between sleep disorders and other health
impacts.
To estimate the PAFs the following prevalence estimates were used (from Section 1.1.5).
• Prevalence of OSA is 4.7% (based on the proportion of individuals with an AHI > 15)
with sensitivity analysis at 4% and 6%.17
• Prevalence of primary insomnia in Australia is 3%, with sensitivity analysis at 1.5%.
• Prevalence of RLS in Australia is 1.2%.
The information from Section 1.2 was used to estimate the PAFs between sleep disorders
and CVDs (CHF, coronary artery disease and strokes) and between sleep disorders and
depression. The information from Section 1.3 was used to estimate the PAFs between
sleep disorders and MVAs and between sleep disorders and workplace injuries. PAFs were
separately assessed for OSA, RLS and insomnia and were limited to those cases where a
robust relationship was estimable from the literature evidence located.
Although the effect of OSA on certain cardiovascular conditions (such as stroke and heart
failure) has been found to be significant for men but not women, it was assumed that the
effect of OSA for women was identical to that for men given that the mortality risk from
OSA for women below 70 was found to be similar to that for men in a prospective study by
Punjabi et al (2009).
This report only considered the ‘first round’ impact of sleep disorders on other conditions,
not the potential impact of these conditions on the risk of other conditions. When
including further round effects there is a risk of double counting or incorrectly attributing
costs to the original condition.
2.1 Methodology
Where evidence from clinical studies of a causal relationship between sleep disorders and
another health condition was provided in terms of odds ratios, PAFs were calculated using
the following method. First, the following two equations were solved simultaneously:
(1) q1.s1 +q2.s2 = p1
17In some cases the most appropriate epidemiological studies of OSA and other conditions do not use
classifications of OSA that conform with these prevalence estimates. These prevalence estimates are based on
the proportion of individuals with an AHI>=15. Where this happens, the prevalence of OSA is adjusted to reflect
the prevalence of individuals in the category used by the study (eg men with an AHI>=20) based on the results in
Bixler et al (1998). Where epidemiological studies use OSAS a prevalence of 3% is assumed (consistent with
Young et al 1993) and sensitivity analysis is conducted at 2% and 4%.

Re-awakening Australia
33 Deloitte Access Economics
(2) q1/(1-q1) / (q2/(1-q2)) = OR where
q1 = probability of having the particular health condition given that an individual has OSA
q2 = probability of having the particular health condition given that an individual does not
have OSA
s1 = share of people with OSA = probability of having OSA
s2 = share of people without OSA = probability of not having OSA
p1 = probability of having the particular health condition
OR = odds ratio for that particular condition for individuals with OSA
After solving these equations for q1 and q2, the following equation is solved:
(3) PAF = (q1-q2).s1 / p1
Equation 3 was used to determine the PAF of each health condition due to OSA.18 It was
also used to determine PAFs for RLS and insomnia.
Where epidemiological studies reported relationships in terms of a hazard ratio, the hazard
ratios were assumed to be roughly equivalent to relative risk ratios.19 The PAF was
calculated using the following equation, which was taken from Eide and Heuch (2001).
(4) PAF = s1.(RR-1) / (s1.(RR-1) + 1)
s1 = share of people with OSA = probability of having OSA
RR = relative risk ratio
2.2 Cardiovascular disease
Given the established evidence between sleep disorders and CVD, PAFs were calculated for
stroke, CHF and coronary artery disease.
2.2.1 Stroke
The relationship between stroke and OSA was expressed in terms of a hazard ratio, hence
Equation (3) was used to estimate the PAF. A hazard ratio of 2.86 was used, based on
Redline et al (2010). This hazard ratio was for stroke among men in the top quartile of the
sleep apnoea distribution (with an AHI>19).
18 See Eide and Heuch (2001) for derivation and background to this approach.
19 Choi et al (2010) show that where the risk of an event is rare, relative risk ratios are numerically quite similar
to hazard ratios.
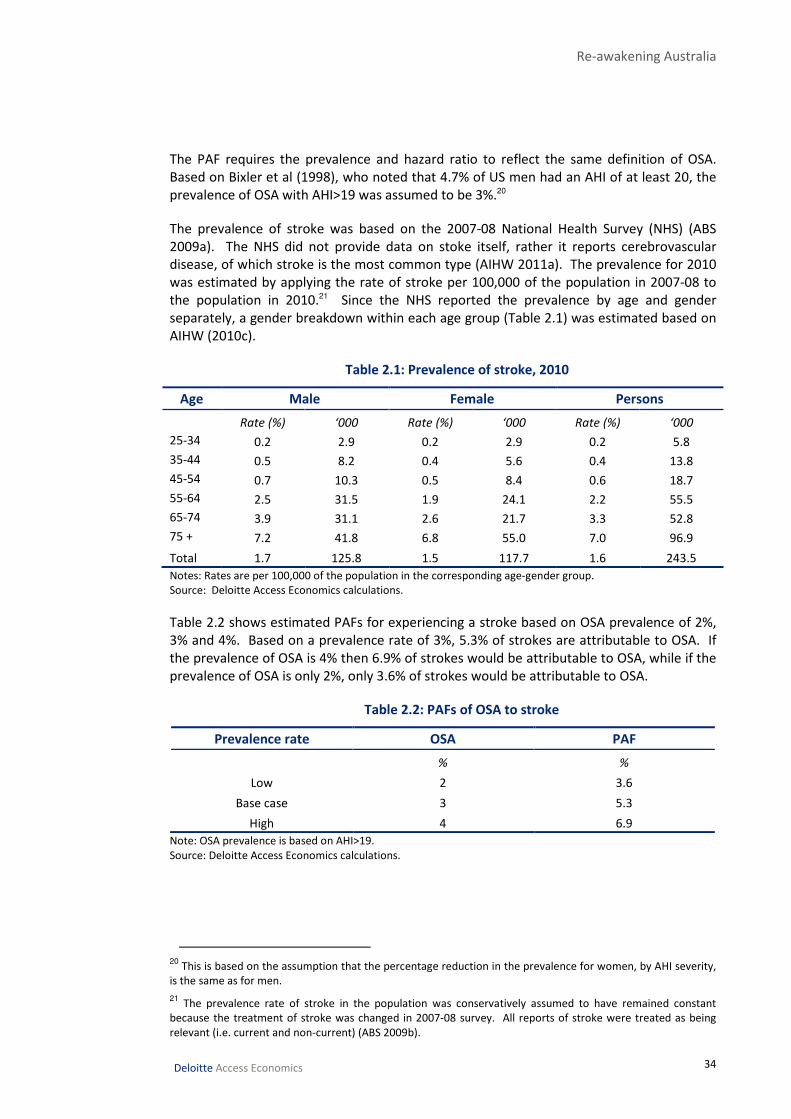
Re-awakening Australia
34 Deloitte Access Economics
The PAF requires the prevalence and hazard ratio to reflect the same definition of OSA.
Based on Bixler et al (1998), who noted that 4.7% of US men had an AHI of at least 20, the
prevalence of OSA with AHI>19 was assumed to be 3%.20
The prevalence of stroke was based on the 2007-08 National Health Survey (NHS) (ABS
2009a). The NHS did not provide data on stoke itself, rather it reports cerebrovascular
disease, of which stroke is the most common type (AIHW 2011a). The prevalence for 2010
was estimated by applying the rate of stroke per 100,000 of the population in 2007-08 to
the population in 2010.21 Since the NHS reported the prevalence by age and gender
separately, a gender breakdown within each age group (Table 2.1) was estimated based on
AIHW (2010c).
Table 2.1: Prevalence of stroke, 2010
Age Male Female Persons
Rate (%) ‘000 Rate (%) ‘000 Rate (%) ‘000
25-34 0.2 2.9 0.2 2.9 0.2 5.8
35-44 0.5 8.2 0.4 5.6 0.4 13.8
45-54 0.7 10.3 0.5 8.4 0.6 18.7
55-64 2.5 31.5 1.9 24.1 2.2 55.5
65-74 3.9 31.1 2.6 21.7 3.3 52.8
75 + 7.2 41.8 6.8 55.0 7.0 96.9
Total 1.7 125.8 1.5 117.7 1.6 243.5
Notes: Rates are per 100,000 of the population in the corresponding age-gender group.
Source: Deloitte Access Economics calculations.
Table 2.2 shows estimated PAFs for experiencing a stroke based on OSA prevalence of 2%,
3% and 4%. Based on a prevalence rate of 3%, 5.3% of strokes are attributable to OSA. If
the prevalence of OSA is 4% then 6.9% of strokes would be attributable to OSA, while if the
prevalence of OSA is only 2%, only 3.6% of strokes would be attributable to OSA.
Table 2.2: PAFs of OSA to stroke
Prevalence rate OSA PAF
% %
Low 2 3.6
Base case 3 5.3
High 4 6.9
Note: OSA prevalence is based on AHI>19.
Source: Deloitte Access Economics calculations.
20
This is based on the assumption that the percentage reduction in the prevalence for women, by AHI severity,
is the same as for men.
21 The prevalence rate of stroke in the population was conservatively assumed to have remained constant
because the treatment of stroke was changed in 2007-08 survey. All reports of stroke were treated as being
relevant (i.e. current and non-current) (ABS 2009b).

Re-awakening Australia
35 Deloitte Access Economics
2.2.2 Congestive heart failure
The PAF for CHF was based on the hazard ratio of 1.58 estimated by Gottlieb et al (2010).
Although this hazard ratio was derived from men with an AHI > 30, it was also applied to
women.
As the hazard ratio was based on an AHI > 30, the prevalence of OSA used to calculate the
AF should also be based on those with an AHI > 30. The prevalence of people with an AHI >
15 (4.7%) was adjusted based on Gottlieb et al (2010), who found that just under 40% of
those with an AHI > 15 also had an AHI > 30. The resulting proportion of people with an AHI
> 30 was 2%.
The prevalence of CHF was based on self reported prevalence in the 2007-08 NHS (ABS
2009a). The prevalence was projected to 2010 by applying the rate of CHF per 100,000
people to the Australian population in 2010 (ABS 2010a).22 Table 2.3 shows the estimated
prevalence of CHF in 2010 by age and gender. The gender breakdown was based on AIHW
(2010c), which used data from the 2004-05 NHS.
Table 2.3: Prevalence of CHF, 2010
Age Male Female Persons
Rate ‘000 Rate ‘000 Rate ‘000
25-34 0.0 0.2 0.6 9.6 0.3 9.8
35-44 0.1 2.1 0.6 10.3 0.4 12.4
45-54 0.5 8.3 1.6 24.5 1.1 32.8
55-64 1.6 19.9 3.6 45.5 2.6 65.4
65-74 2.6 20.5 5.6 46.5 4.1 67.0
75 + 7.8 45.5 6.8 54.5 7.2 99.9
Total 1.3 96.4 2.5 190.9 1.9 287.3
Notes: Rate is per 100,000 of the population in the corresponding age-gender group.
Source: Deloitte Access Economics calculations.
The estimated PAF of CHF due to OSA was estimated as 1.1% for the base case prevalence
estimate (Table 2.4). High and low prevalence of OSA gave PAFs of 0.6% and 1.7%
respectively.
Table 2.4: PAFs of OSA to CHF
Prevalence rate OSA PAF
% %
Low 1 0.6
Base case 2 1.1
High 3 1.7
Note: OSA prevalence is based on AHI>30.
Source: Deloitte Access Economics calculations.
22
The prevalence rate of CHF in the population was conservatively assumed to have remained constant
between 2007-08 and 2010 because the reporting treatment of CHF was changed in 2007-08 survey. All reports
of CHF were treated as being relevant (i.e. current and non-current) (ABS 2009b).
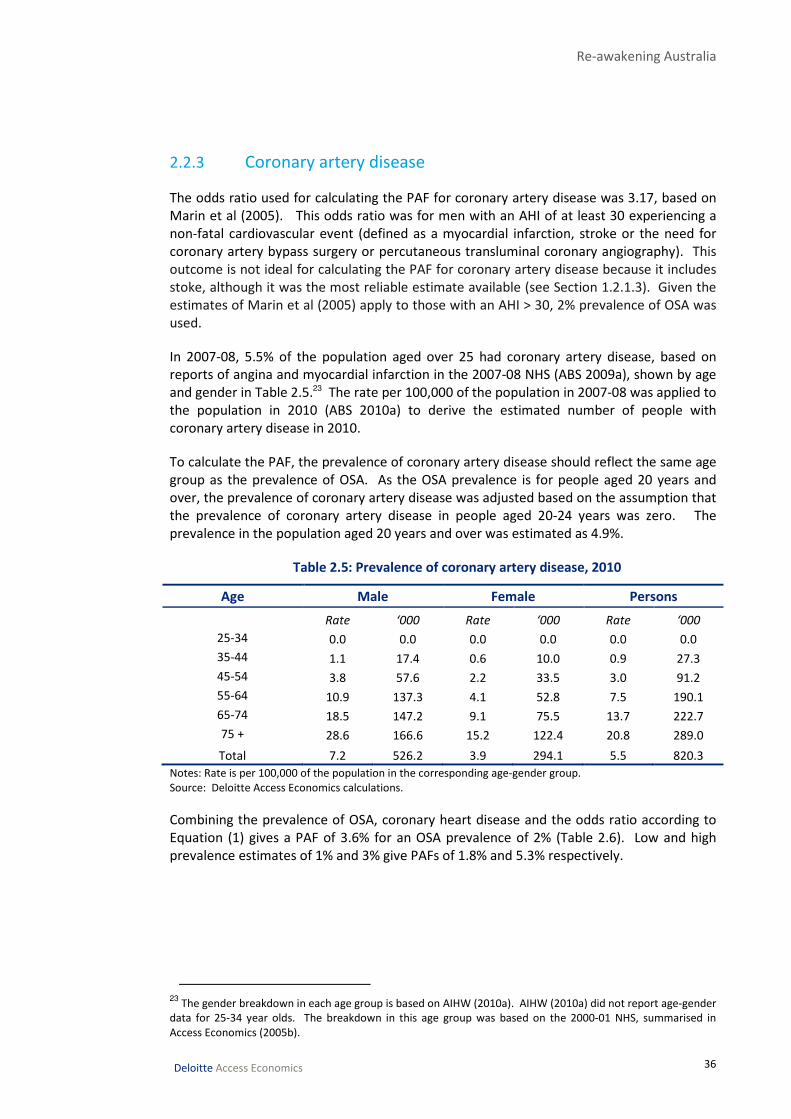
Re-awakening Australia
36 Deloitte Access Economics
2.2.3 Coronary artery disease
The odds ratio used for calculating the PAF for coronary artery disease was 3.17, based on
Marin et al (2005). This odds ratio was for men with an AHI of at least 30 experiencing a
non-fatal cardiovascular event (defined as a myocardial infarction, stroke or the need for
coronary artery bypass surgery or percutaneous transluminal coronary angiography). This
outcome is not ideal for calculating the PAF for coronary artery disease because it includes
stoke, although it was the most reliable estimate available (see Section 1.2.1.3). Given the
estimates of Marin et al (2005) apply to those with an AHI > 30, 2% prevalence of OSA was
used.
In 2007-08, 5.5% of the population aged over 25 had coronary artery disease, based on
reports of angina and myocardial infarction in the 2007-08 NHS (ABS 2009a), shown by age
and gender in Table 2.5.23 The rate per 100,000 of the population in 2007-08 was applied to
the population in 2010 (ABS 2010a) to derive the estimated number of people with
coronary artery disease in 2010.
To calculate the PAF, the prevalence of coronary artery disease should reflect the same age
group as the prevalence of OSA. As the OSA prevalence is for people aged 20 years and
over, the prevalence of coronary artery disease was adjusted based on the assumption that
the prevalence of coronary artery disease in people aged 20-24 years was zero. The
prevalence in the population aged 20 years and over was estimated as 4.9%.
Table 2.5: Prevalence of coronary artery disease, 2010
Age Male Female Persons
Rate ‘000 Rate ‘000 Rate ‘000
25-34 0.0 0.0 0.0 0.0 0.0 0.0
35-44 1.1 17.4 0.6 10.0 0.9 27.3
45-54 3.8 57.6 2.2 33.5 3.0 91.2
55-64 10.9 137.3 4.1 52.8 7.5 190.1
65-74 18.5 147.2 9.1 75.5 13.7 222.7
75 + 28.6 166.6 15.2 122.4 20.8 289.0
Total 7.2 526.2 3.9 294.1 5.5 820.3
Notes: Rate is per 100,000 of the population in the corresponding age-gender group.
Source: Deloitte Access Economics calculations.
Combining the prevalence of OSA, coronary heart disease and the odds ratio according to
Equation (1) gives a PAF of 3.6% for an OSA prevalence of 2% (Table 2.6). Low and high
prevalence estimates of 1% and 3% give PAFs of 1.8% and 5.3% respectively.
23
The gender breakdown in each age group is based on AIHW (2010a). AIHW (2010a) did not report age-gender
data for 25-34 year olds. The breakdown in this age group was based on the 2000-01 NHS, summarised in
Access Economics (2005b).

Re-awakening Australia
37 Deloitte Access Economics
Table 2.6: PAFs of OSA to coronary artery disease
Prevalence rate OSA PAF
% %
Low 1 1.8
Base case 2 3.6
High 3 5.3
Note: OSA prevalence is based on AHI>30.
Source: Deloitte Access Economics calculations.
2.2.4 All cardiovascular diseases
A PAF was calculated for CVD overall because some costs were not available broken down
by illness. In accordance with Marin et al (2005), the attributable fraction of cardiovascular
events due to OSA was calculated using an odds ratio of 3.17. Given the results were based
on an AHI great than 30, 2% prevalence of people with AHI > 30 was used (Marin et al 2005)
The proportion of the population aged 20 years or over expected to have experienced a
cardiovascular event was estimated based on data from the 2007-08 National Health
Survey (ABS 2009c). The proportion of individuals experiencing either ischaemic heart
disease, a stroke, oedema, heart failure or diseases of the arteries, arterioles and capillaries
was found to be 5.2% in 2007-08 (ABS 2009c). Adjusting this figure based on the
proportion of the population aged over 20 in 2010 (consistent with our prevalence data for
OSA) (ABS 2010a), the proportion of Australians aged over 20 who had experienced a
cardiovascular event was estimated to be 7.2%.24 Table 2.7 details the likely range of
possible PAFs for experiencing a cardiovascular event due to OSA.
Table 2.7: PAFs of OSA to all CVDs
Prevalence rate OSA PAF
% %
Low 1 1.7
Base case 2 3.4
High 3 5.0
Source: Deloitte Access Economics calculations.
2.3 Depression
The PAF for depression due to OSA was based on an odds ratio of 2.6 (for people with an
AHI>15), using the results of Peppard et al (2006). For RLS, an odds ratio of 1.93 was
adopted based on the odds ratio in Winkelman et al (2005) for experiencing a major
depressive episode (not related to another medical condition) over an individual’s
24
This prevalence was estimated by first estimating the total number of individuals aged over 20 who had
experienced a cardiovascular event (multiplying the number of individuals in each age group (ABS 2010a) by the
proportion of individuals experiencing cardiovascular events in that age group (ABS 2009)) and then dividing this
number by the total population aged over 20 years (ABS 2010a).

Re-awakening Australia
38 Deloitte Access Economics
lifetime.25 An odds ratio of 2.10 was adopted for insomnia based on the meta-analysis
conducted by Baglioni et al (2011).
The prevalence of depression was based on the 2007 National Survey of Mental Health and
Wellbeing (ABS 2008). This prevalence was reported for people aged 16-85 years who
experienced at least one depressive episode over the previous year or dysthymia.26 An age
breakdown was determined using the age distribution for affective disorders, of which
depression is a sub-group.27 The prevalence of depression in the population aged 20 years
and over was estimated to be 5.1%.
Table 2.8: Prevalence of depression, 2010
Age Male Female Persons
% ‘000 % ‘000 % ‘000
20-24 3.2 27.0 7.4 59.6 5.2 86.6
25-34 5.2 83.9 7.7 122.2 6.4 206.1
35-44 6.5 101.7 7.5 119.9 7.0 221.6
45-54 4.8 71.7 7.1 109.5 6.0 181.2
55-64 2.0 25.1 5.4 69.1 3.7 94.2
65+ 1.2 16.1 2.8 45.9 2.1 62.0
Total 4.0 325.7 6.2 526.1 5.1 851.8
Source: Deloitte Access Economics calculations.
The PAF for OSA is 6.2% assuming a prevalence rate of 4.7% for OSA (Table 2.9). A lower
and higher prevalence rate of 4% and 6% respectively would result in PAFs of 5.4% and
7.8%. For RLS the PAF is 1% and for insomnia the PAFs are 1.5% and 2.9% assuming
prevalence rates of 1.5% and 3% respectively.
Table 2.9: PAFs of sleep disorders to depression
Prevalence OSA Insomnia RLS
Prevalence (%) PAF(%) Prevalence (%) PAF(%) Prevalence (%) PAF(%)
Low 4.0 5.4 1.5 1.5 — —
Base case 4.7 6.2 3.0 2.9 1.2 1.0
High 6.0 7.8 — — — —
Source: Deloitte Access Economics calculations.
25
Although an odds ratio for experiencing a major depressive episode over the previous twelve months was
provided for RLS it was not used due to the small sample size.
26 A depressive episode is characterised as experiencing a number of the following symptoms: depressed mood,
loss of interest in activities, lack of energy or increased fatigue, loss of confidence or self esteem, feelings of self-
reproach or excessive guilt, thoughts of death or suicide, or suicide attempts, diminished ability to concentrate,
think or make decisions, change in psychomotor activity; agitation or retardation, sleep disturbance or change
in appetite over a period of at least two weeks. 27
Using the age breakdown, a rate per 100,000 of the population is calculated. It is assumed that the rate in
the age groups 16-24 years is the same as the rate in age group 20-24 years. Similarly, the rate for 65-85 years is
assumed the same as 65+.
Re-awakening Australia
39 Deloitte Access Economics
2.4 Injuries
PAFs were calculated for injuries that occurred through motor vehicle and workplace
accidents. For OSA, a PAF was calculated by type of accidents. A PAF was also calculated
for insomnia and workplace accidents. However, there was inconclusive evidence found of
a statistically significant association between motor vehicle accidents and insomnia. There
was also insufficient information available to calculate a PAF for RLS and either type of
accident.
2.4.1 Motor vehicle accidents
The PAF for motor vehicle accidents (MVA) was based on an odds ratio of 2.52 for OSAS and
motor vehicle accidents (Sassani et al 2004). Although Ellen et al (2006) (a study that uses
OSA rather than OSAS) found that the median odds ratio across a large number of studies
was 3.1, the studies used a variety of different definitions for OSA whereas the studies
investigated by Sassani et al (2004) used a consistent definition (OSAS). A prevalence of 3%
for OSAS was used in the calculation of PAFs.
Due to a lack of data it was not possible to determine the prevalence of injury caused by
MVA in the general population. Instead, the incidence of MVAs in 2010 was used to
calculate the PAF. To limit the overlap between work related injuries that occur in motor
vehicles, the prevalence data were adjusted to take into account the joint likelihood of
MVA being work-related in the same manner as in Hillman et al (2006).28
The number of injuries resulting from MVA was derived from the National Hospital
Morbidity Database (AIHW 2009a). This data included the number of annual hospitalised
injuries caused by road use between 2000 and 2007 broken down by age, gender and road
user group. The Australian Institute of Health and Welfare (AIHW) defines a hospital
admission as one related to a land transport accident if the external cause code for the
injury was in the ICD-10-AM range V01-V89 and ‘injury’ is the primary diagnosis.
A linear trend was applied to the number of hospitalised injuries between 2000 and 2007 to
estimate the total number of road injuries in 2010 (30,275). According to BITRE (2009),
32.8% of people who were hospitalised following a road traffic crash were discharged on
the same day. In addition, for every hospitalised person there were:
• 1.1 people who were not hospitalised but were treated by a GP for less severe
injuries, and
• 3.5 people who were taken to hospital but were not admitted (BITRE 2009).
Non-hospitalised road injuries were estimated using the ratio of non-hospitalised road
injuries to hospitalised injuries. Total injuries caused by MVAs are shown by age and
gender in Table 2.10.29 Total injuries were estimated to be around 288,000 in 2010. Given
28
MVAs included people in a car or on a motor cycle. An age breakdown was determined using the age
distribution of all injuries to road users.
29 The age group 20-24 was estimate using the population share of people 15-24, which was the original age
grouping of the data. The remainder of injuries for people 15-19 was added to those 5-14 to form the age
group 5-19.

Re-awakening Australia
40 Deloitte Access Economics
Australia’s population aged 20 years and over in 2010 (ABS 2010a) this is equivalent to an
incidence rate for MVAs of 1.3%.30
Table 2.10: Incidence of hospitalised and non-hospitalised injuries caused by MVAs, 2010
Age Male Female Persons
% ‘000 % ‘000 % ‘000
<20 0.6 16.4 0.3 7.7 0.4 24.0
20–24 6.2 52.4 3.2 25.9 2.5 78.3
25–44 2.2 68.5 0.9 29.1 1.5 97.6
45–64 1.3 35.5 0.8 21.9 1.0 57.3
65+ 1.1 14.5 1.0 16.2 1.0 30.8
Total 1.7 187.3 0.9 100.7 1.3 288.0
Source: Deloitte Access Economics calculations.
The PAFs of MVAs due to OSA are presented in Table 2.11. The PAF at a prevalence rate of
3% for OSA is 4.3%. High and low prevalence rates of 2% and 4% give PAF for 2.8% and
5.6% respectively.
Table 2.11: PAFs of OSA to a MVA injury
Prevalence rate OSA PAF
% %
Low 2 2.8
Base case 3 4.3
High 4 5.6
Source: Deloitte Access Economics calculations.
2.4.2 Workplace injuries
The PAF for OSA and workplace injury was based on an odds ratio of 1.5 (Ulfberg et al
2000). This odds ratio was based on a sample of men with OSAS. Although they also
provided an odds ratio for women, it was based on a small sample. Given that the odds
ratio was much higher for women (6.4), it was conservatively assumed that the odds ratio
of 1.5 applies to both men and women. The PAF for insomnia and workplace injuries was
based on an odds ratio of 2.4 (Daley et al 2009).
The probability of being injured in a workplace accident was based on the incidence of
workplace injuries in 2010. There are two sources of workplace accident data.
• ABS survey of work related injuries (ABS 2010b) — a survey that captures people aged
15 years or older who self-report whether they have experienced a work-related injury
30
It was not possible to identify the age gender distribution of injuries where the driver was responsible for the
accident due to lack of data. This definition would be the most consistent with the concept of the odds ratio. In
addition to people with OSA who cause an accident, there would be other people injured in at least some of
those accidents. Hence, the age gender distribution of injuries resulting from MVA was assumed to be the same
as the distribution of those injured in an accident that was caused by a person with OSA. Moreover, people
under the age of 20, although potentially injured in a road accident caused by a driver with OSA, were
conservatively excluded.
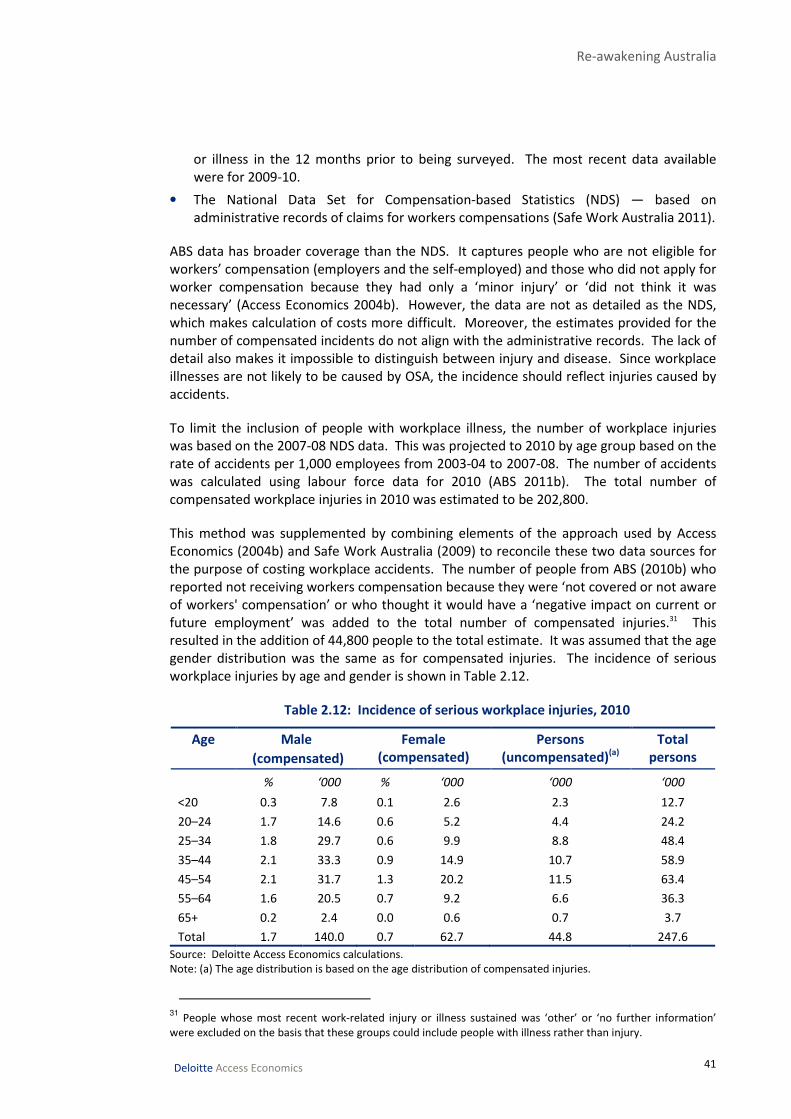
Re-awakening Australia
41 Deloitte Access Economics
or illness in the 12 months prior to being surveyed. The most recent data available
were for 2009-10.
• The National Data Set for Compensation-based Statistics (NDS) — based on
administrative records of claims for workers compensations (Safe Work Australia 2011).
ABS data has broader coverage than the NDS. It captures people who are not eligible for
workers’ compensation (employers and the self-employed) and those who did not apply for
worker compensation because they had only a ‘minor injury’ or ‘did not think it was
necessary’ (Access Economics 2004b). However, the data are not as detailed as the NDS,
which makes calculation of costs more difficult. Moreover, the estimates provided for the
number of compensated incidents do not align with the administrative records. The lack of
detail also makes it impossible to distinguish between injury and disease. Since workplace
illnesses are not likely to be caused by OSA, the incidence should reflect injuries caused by
accidents.
To limit the inclusion of people with workplace illness, the number of workplace injuries
was based on the 2007-08 NDS data. This was projected to 2010 by age group based on the
rate of accidents per 1,000 employees from 2003-04 to 2007-08. The number of accidents
was calculated using labour force data for 2010 (ABS 2011b). The total number of
compensated workplace injuries in 2010 was estimated to be 202,800.
This method was supplemented by combining elements of the approach used by Access
Economics (2004b) and Safe Work Australia (2009) to reconcile these two data sources for
the purpose of costing workplace accidents. The number of people from ABS (2010b) who
reported not receiving workers compensation because they were ‘not covered or not aware
of workers' compensation’ or who thought it would have a ‘negative impact on current or
future employment’ was added to the total number of compensated injuries.31 This
resulted in the addition of 44,800 people to the total estimate. It was assumed that the age
gender distribution was the same as for compensated injuries. The incidence of serious
workplace injuries by age and gender is shown in Table 2.12.
Table 2.12: Incidence of serious workplace injuries, 2010
Age Male
(compensated)
Female
(compensated)
Persons
(uncompensated)(a)
Total
persons
% ‘000 % ‘000 ‘000 ‘000
<20 0.3 7.8 0.1 2.6 2.3 12.7
20–24 1.7 14.6 0.6 5.2 4.4 24.2
25–34 1.8 29.7 0.6 9.9 8.8 48.4
35–44 2.1 33.3 0.9 14.9 10.7 58.9
45–54 2.1 31.7 1.3 20.2 11.5 63.4
55–64 1.6 20.5 0.7 9.2 6.6 36.3
65+ 0.2 2.4 0.0 0.6 0.7 3.7
Total 1.7 140.0 0.7 62.7 44.8 247.6
Source: Deloitte Access Economics calculations.
Note: (a) The age distribution is based on the age distribution of compensated injuries.
31
People whose most recent work-related injury or illness sustained was ‘other’ or ‘no further information’
were excluded on the basis that these groups could include people with illness rather than injury.
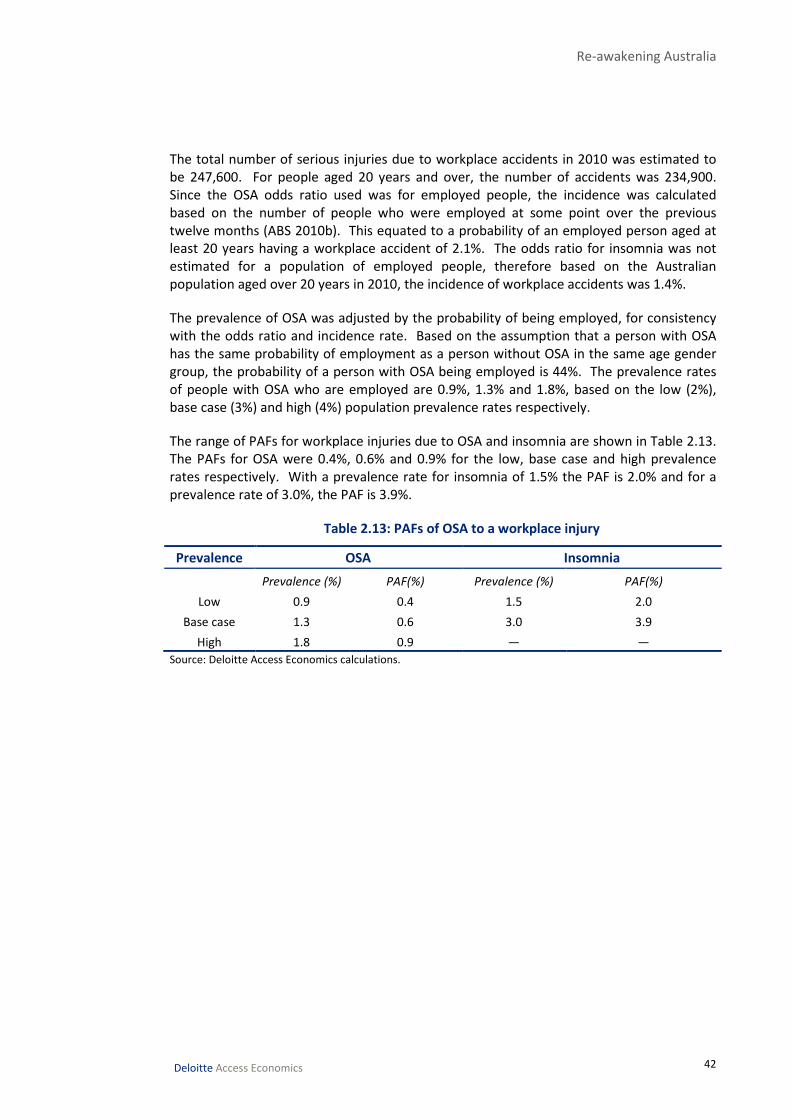
Re-awakening Australia
42 Deloitte Access Economics
The total number of serious injuries due to workplace accidents in 2010 was estimated to
be 247,600. For people aged 20 years and over, the number of accidents was 234,900.
Since the OSA odds ratio used was for employed people, the incidence was calculated
based on the number of people who were employed at some point over the previous
twelve months (ABS 2010b). This equated to a probability of an employed person aged at
least 20 years having a workplace accident of 2.1%. The odds ratio for insomnia was not
estimated for a population of employed people, therefore based on the Australian
population aged over 20 years in 2010, the incidence of workplace accidents was 1.4%.
The prevalence of OSA was adjusted by the probability of being employed, for consistency
with the odds ratio and incidence rate. Based on the assumption that a person with OSA
has the same probability of employment as a person without OSA in the same age gender
group, the probability of a person with OSA being employed is 44%. The prevalence rates
of people with OSA who are employed are 0.9%, 1.3% and 1.8%, based on the low (2%),
base case (3%) and high (4%) population prevalence rates respectively.
The range of PAFs for workplace injuries due to OSA and insomnia are shown in Table 2.13.
The PAFs for OSA were 0.4%, 0.6% and 0.9% for the low, base case and high prevalence
rates respectively. With a prevalence rate for insomnia of 1.5% the PAF is 2.0% and for a
prevalence rate of 3.0%, the PAF is 3.9%.
Table 2.13: PAFs of OSA to a workplace injury
Prevalence OSA Insomnia
Prevalence (%) PAF(%) Prevalence (%) PAF(%)
Low 0.9 0.4 1.5 2.0
Base case 1.3 0.6 3.0 3.9
High 1.8 0.9 — —
Source: Deloitte Access Economics calculations.
Re-awakening Australia
43 Deloitte Access Economics
3 Health costs of sleep disorders The health system costs of sleep disorders comprise two parts, the cost of the sleep
disorder themselves and the share of other illnesses and injuries attributed to them. This
chapter estimates both types of costs.
3.1 Sleep disorders
This section estimates the costs of primary conditions, sleep disorders, to the health
system. Limited data were available on these costs and the estimates presented in this
section should be viewed as conservative. They are not directly comparable to those
presented in Access Economics (2005) because the sleep disorders included have been
reduced to those where the ICSD can be directly mapped to an ICD-10 code at the two digit
level. Moreover, a bottom up approach has been used whereas the previous report used a
top down approach.
3.1.1 Hospital costs
The total cost of hospitalisation for sleep disorders was estimated by multiplying the
number of separations for sleep disorders by an estimated average cost of hospitalisation.
The number of hospitalisations was based on separation statistics from the National
Hospital Morbidity Database (AIHW 2010c) for ICD-10 codes that capture sleep disorders
(see Appendix A for details). The ICD-10 codes were based on a mapping between ICSD and
ICD-10 at the two-digit level — this meant that not all sleep disorders could be mapped to
the available data.
The number of separations for the broad categories of sleep disorders, G47 sleep disorders
and F51 nonorganic sleep disorders are shown in Chart 3.1. A third category ‘other’ covers
all sleep disorders not included under these two broad headings. The number of
separations was linearly projected to 2010 using data from 1998-99 to 2007-08 for G47, F51
and ‘other’. A linear projection was made based on data from 2003-04 to 2007-08.32 The
total number of separations for G47, F51 and ‘other’ in 2010 was 64,141.
32
For ‘other’ the linear projection was applied to each series, while for G47 and F51 the total was projected and
a distribution across the individual series was based on the breakdown in 2007-08, because the total was a
smoother series and therefore could be projected more accurately.

Re-awakening Australia
44 Deloitte Access Economics
Chart 3.1: Number of separations for sleep disorders
Source: AIHW (2010c) and Deloitte Access Economics’ projections.
A cost was attached to these separations using data from the National Hospital Cost Data
Collection (NHCDC) (DoHA 2010). The mapping between each ICD-10 sleep disorder and
diagnostic related group (DRG) is shown in Table 3.1. This mapping was based on the ICD-
10 to AR-DRG mapping provided in DoHA (2006). The cost of a sleep apnoea separation
was based on the DRG for sleep apnoea (E63Z). Most other conditions were based on the
cost of the DRG for anxiety disorders (U65Z), due to a lack of data on more specific costs
and since the ICD-10 codes for sleep disorders in practice map to the DRG for anxiety
disorders (based on expert opinion).
The average cost per bed day was calculated using the cost of a separation in a public
hospital divided by the average length of stay. Public hospital costs were used because the
data on private hospitals was incomplete. For example, specialist fees are not included in
NHCDC information for private hospitals (DoHA 2010). The costs were inflated from 2008-
09 dollars to 2010 dollars using the average rate of health inflation over the previous ten
years (3.4%) found in AIHW (2010a). The average cost for each sleep disorder is shown in
Table 3.1.
0
10
20
30
40
50
60
70
1998-99 2001-02 2004-05 2007-08
'000
G47 Sleep disorders
Forecast
0
0.5
1
1.5
2
2.5
1998-99 2001-02 2004-05 2007-08
'000
F51 Nonorganic sleep disorders Other
Forecast

Re-awakening Australia
45
Deloitte Access Economics Commercial-in-confidence
Table 3.1: Hospital costs for sleep disorders in 2010
ICD-10 Description DRG Average cost Separations Total
cost(a)
Public (per sep per day) No. $m (2010)
G25.8 Other specified extrapyramidal and movement disorders B06A, B06B, B67A, B67B, B67C 330.8 357 0.28
G47.0 Disorders of initiating and maintaining sleep U65Z 1,279.9 1,820 6.29
G47.1 Disorders of excessive somnolence U65Z 1,279.9 267 0.41
G47.2 Disorders of the sleep-wake schedule U65Z 1,279.9 3,305 12.27
G47.3 Sleep apnoea E63Z 1,109.0 55,371 70.30
G47.4 Narcolepsy and cataplexy B06A, B06B, B81A, B81B 349.3 109 0.08
G47.8 Other sleep disorder U65Z 1,279.9 1,093 1.82
G47.9 Unspecified sleep disorder U65Z 1,279.9 1,417 2.72
F51.0 Nonorganic insomnia U65Z 1,279.9 28 0.15
F51.1 Nonorganic hypersomnia U65Z 1,279.9 4 0.01
F51.2 Nonorganic disorder of the sleep-wake schedule U65Z 1,279.9 164 1.14
F51.3 Sleep walking U65Z 1,279.9 10 0.03
F51.4 Sleep terrors U65Z 1,279.9 27 0.04
F51.5 Nightmares U65Z 1,279.9 7 0.02
F51.8 Other nonorganic sleep disorders U65Z 1,279.9 3 0.01
F51.9 Nonorganic sleep disorder, unspecified U65Z 1,279.9 121 0.58
P28.3 Primary sleep apnoea of newborn E72Z 137.7 21 0.05
R06.3 Periodic breathing E67A, E67B 195.6 19 0.005
Total n/a n/a n/a 96.2
Note: (a) Total cost is the average cost multiplied by separations and average length of stay.
Source: Deloitte Access Economics; DoHA (2010); AIHW (2010a).

Re-awakening Australia
46 Deloitte Access Economics Commercial-in-confidence
It was estimated that in 2010 sleep disorders cost the hospital system
$96.2 million. Chart 3.2 shows the breakdown of this cost by broad sleep
disorder category. Sleep apnoeas contributed the greatest cost (73.1%)
followed by disorders of the sleep wake schedule (13.9%) and insomnia (6.7%).
RLS contributed only 0.3% of hospital costs.33 Sleep apnoea encompasses a
number of different types of apnoea — OSA represented 59.6% of the total.
Chart 3.2: Hospital costs by sleep disorder, 2010
Source: Deloitte Access Economics’ calculations.
33
The cost of other specified extrapyramidal and movement disorders was assumed to be representative of the
cost of RLS.
Insomnia6.7%
RLS0.3%
Hypersomnia0.4%
Disorders of the sleep wake schedule
13.9%
Narcolepsy0.1%
Other5.3%
Parasomnia0.1%
OSA59.6%
Unspecif ied12.7%
CSA0.8% Sleep apnea of a
newborn & periodic breathing
0.1%
Sleep apnoea73.1%
Total cost in 2010
$96.2 million
Re-awakening Australia
47 Deloitte Access Economics Commercial-in-confidence
3.1.2 Out of hospital costs
People with sleep disorders access a range of medical services and use pharmaceuticals
that they would not require in the absence of the sleep disorder. The out-of-hospital costs
in this section are estimated using a bottom up approach. Access Economics (2005a) used
data from the Bettering the Evaluation and Care of Health (BEACH) study, combined with
information on the ratio of hospital costs to out-of-hospital costs for chronic disease to
estimate out-of-hospital costs. This report utilises a different methodology based on the
diagnosis and treatment of sleep disorders. The advantage of this approach is that the
costs are more transparent, although they are not as comprehensive due to data
limitations.
A bottom up approach requires an understanding of the treatment protocol for sleep
disorders. In Australia the GP is the first point of contact for most medical events that are
not emergencies. It is therefore assumed that all procedures, pharmaceutical use and
treatments have an attached cost of a GP consultation.
3.1.2.1 Diagnosis and treatment
Based on a patient history and reported symptoms a person with suspected OSA may be
referred directly for a sleep study. Alternatively the person might first be referred to a sleep
physician or other specialist. There are four types or ‘levels’ of sleep studies.
• Level 1 — a polysomnography conducted at a sleep laboratory (in a public or private
hospital or a private clinic) overnight in the presence of sleep technician who can adjust
equipment as required (Kee and Naughton 2009).
• Level 2 —polysomnography conducted without a technician present, usually in the
person’s home, meaning that they are responsible for setting the test up themselves
based on instructions provided. This test has a higher failure rate than an attended
sleep study (Kee and Naughton 2009).
• Level 3 — cardiopulmonary monitoring, which can be conducted at home or in hospital
and monitors airflow, respiratory effort, oximetry and electrocardiogram (Kee and
Naughton 2009).
• Level 4 — single channel cardiopulmonary monitoring (Kee and Naughton 2009).
Medicare reimburses the procedural cost and medical interpretation of a level 1 sleep
study. If the sleep study is performed at a private hospital or sleep centre then there may
be a bed fee charged, which is paid for privately (often covered by private health insurance)
(Marshall et al 2007). Medicare also reimburses the cost of level 2 sleep studies (Medicare
Australia 2011).
Following diagnosis of OSA there are several approaches to management.
• Lifestyle management: weight loss, reducing alcohol intake, smoking cessation and
positional therapy (modifying the position adopted for sleep).
• CPAP: positively pressurised air is used to hold open the upper airway during sleep.
This is delivered via a mask worn over the nose - or nose and mouth - which is
connected by a tube to a small electric pump (a CPAP device).

Re-awakening Australia
48 Deloitte Access Economics Commercial-in-confidence
• Dental device: splints that keeps the airway open either by holding the lower jaw
forward (a mandibular advancement device) or the tongue forward (a tongue retaining
device).
• Surgery: a tonsillectomy with adenoidectomy is often used to treat OSA in children.
Surgery is less commonly used in adults although surgery to treat anatomical
obstruction in the upper airway (e.g. nasal surgery) can be helpful.
Daley et al (2009) estimated the economic cost of insomnia in Canada. They interviewed a
range of health care professionals to estimate the difference in out-of-hospital costs for
people with insomnia symptoms, insomnia syndrome and good sleepers. They found a
statistically significant difference in the costs associated with GPs, psychiatrists and other
specialists between people with insomnia syndrome and the two other groups. Insomnia is
primarily diagnosed and managed in primary care, with assistance from allied health
services. Treatment for insomnia includes:
• behavioural interventions: these are aimed at reducing poor sleep habits and
psychological barriers to sleeping, for example:
• relaxation therapy: muscle relaxation and meditation can help assist with
sleep onset;
• sleep restriction therapy: reducing the amount of time spent in bed lying
awake;
• stimulus control therapy: aims to reassociate the bedroom/bed with sleeping
only; and
• cognitive therapy: reduces the focus on needing to sleep and the stress
generated when sleep is not achieved (Grunstein 2002).
• pharmacological interventions: benzodiazepines and other hypnotics including
zolpidem, zopliclone and zaleplon, are the most commonly used treatments.
RLS is usually diagnosed by a GP based on symptoms, including difficulty initiating or
maintaining sleep and the presence of periodic limb movements in sleep. A person
presenting with the symptoms of RLS might be referred to a sleep specialist or a neurologist
if they have atypical symptoms, substantial disturbance to sleep or other potentially more
severe problems. RLS can be managed in one or both of the following ways:
• non-pharmacological intervention: for example increasing iron intake and reducing
caffeine, nicotine and alcohol consumptions; and/or
• a pharmacological intervention: typically benzodiazepines, low potency opioids,
levodopa, or dopamine agonists (which are used to manage RLS).
3.1.2.2 Cost of diagnosis and treatment
Although there is evidence that people with sleep disorders are more likely to access
medical services it is difficult to isolate the costs that are incurred due to a sleep disorder.
For example, the pharmacological interventions used for sleep disorders are also used for
other illnesses, meaning that data on the number of people using these pharmaceuticals
are not sufficient to allocate a cost to sleep disorders.
The cost of out-of-hospital services for OSA is based on the number of sleep studies claimed
though the Medicare Benefits Schedule (MBS) in 2010. The item numbers, descriptions,

Re-awakening Australia
49 Deloitte Access Economics Commercial-in-confidence
number of claims and schedule fees included are shown in Table 3.2. The total cost of sleep
studies in 2010 was $61.6 million.
Table 3.2: Cost of sleep studies in 2010
Item Description Scheduled
fee
Claims Total
cost
$ No. $’000
12203 Level 1 sleep study, adult (aged over 18 years) 565.75 83,140 47,036
12207 Level 1 sleep study, adult (aged over 18 years),
fourth or subsequent investigation in a 12 month
period.
565.75 2 1
12210 Level 1 sleep study, child aged < 12 years 675.25 5,609 3,787
12213 Level 1 sleep study, child aged 12-18 years 608.35 1,331 810
12215 Level 1 sleep study, child aged < 12 years, fourth or
subsequent investigation in a 12 month period.
675.25 34 23
12217 Level 1 sleep study, child aged 12-18 years, fourth
or subsequent investigation in a 12 month period.
608.35 3 2
12250 Level 2 sleep study 322.60 30,939 9,981
Total 61,640
Source: Medicare Australia (2011).
Attached to each of these MBS claims are various consultations with medical practitioners.
Deloitte Access Economics obtained expert clinical advice on the proportion of people likely
to have been referred by a GP and the proportion by a sleep physician.
It was assumed that 80% of people having a level 1 sleep study would have been referred
by a sleep physician, while only 40% of people having a level 2 study would have been
referred by a sleep physician. The remainder were assumed to have been referred by a GP.
For paediatric sleep studies it was assumed that 40% would have been referred by a sleep
physician. Following the sleep study, approximately 60% of adults would proceed to a trial
of therapy (usually with CPAP), necessitating a further two consultations (one long and one
short). The estimated numbers of consultations and costs are shown in Table 3.3. 34
The cost of a consultation with a sleep physician was based on the MBS scheduled fee for a
professional attendance by a consultant physician other than psychiatry. The cost for a
long consultation was $145.20 and for a short consultation was $72.65. Based on the
assumption above, 81,960 people were referred for a sleep study by a sleep physician.
These people incurred the cost of one long and one short consultation. Of these, 60%
(49,008) required another long and short consultation related to treatment for OSA. In
total these visits cost $28.5 million.
The cost of a consultation with a GP was based on the MBS schedule fees for a Level C and
a Level B consultation ($67.65 and $37.50 respectively). Each person referred for a sleep
study by a GP required a Level C and a Level B consultation (39,378 people). Those
commencing treatment required an additional Level C and Level B consultation (23,627). In
total this cost $6.5 million.
34
Advice on these assumptions was obtained from Dr David Hillman, MBBS, FANZCA, FRCP(Edin), FRACP(Hon)
Head, Department of Pulmonary Physiology and Sleep Medicine Director, West Australian Sleep Disorders
Research Institute Sir Charles Gairdner Hospital Perth.

Re-awakening Australia
50 Deloitte Access Economics Commercial-in-confidence
The total cost of medical practitioner fees due to OSA was therefore estimated to be
$34.9 million.
Table 3.3: Cost of medical practitioner visits due to OSA in 2010
Item Description Scheduled
fee
Claims Total
cost
Sleep physician $ ‘000 $m
110 Professional attendance, consultant physician, long 145.20 131 19.0
116 Professional attendance, consultant physician, short 72.65 131 9.5
General practitioner
36 Level C professional attendance, GP 67.65 63 4.3
23 Level B professional attendance, GP 34.90 63 2.2
Total 34.9
Source: Medicare Australia (2011).
The cost of out-of-hospital health system use for OSA was estimated to be
$96.6 million in 2010.
This estimate is likely to underestimate the actual cost. Only one method of treatment for
OSA has been considered and even for this it was not possible to capture all types of costs.
The estimate also excludes the cost of other sleep disorders (including undiagnosed sleep
disorders), which would include consultations with medical practitioners, pharmaceuticals
and community mental health services.
3.1.3 Cost of devices
The cost of CPAP devices was based on data obtained from two out of three of the leading
manufacturers of CPAP devices in Australia. These data were an estimate of the annual size
of the market. Averaging the two estimates suggests that 51,206 new devices were sold in
2010, costing an estimated $65.5 million. It was expected that a further $16 million in extra
interfaces (mask or nasal pillow) and spare parts would also be sold.
The total cost of devices in 2010 was estimated to be $81.5 million.
3.2 Health costs of other conditions
The health system costs of other injuries and illness that are associated with sleep disorders
were calculated by applying the PAFs presented in Chapter 2. In this section the middle
estimates are presented, with results for the high and low PAFs shown in Section 3.3.
The costs of CVD and depression were based on AIHW disease expenditure data. These
data are constructed using a top down approach — the AIHW uses total health system
expenditure and then allocates it across diseases using information from hospital morbidity

Re-awakening Australia
51 Deloitte Access Economics Commercial-in-confidence
records and casemix, Medicare, the Pharmaceutical Benefits Scheme (PBS), the Pharmacy
Guild Survey, and the BEACH survey of general practice (AIHW 2008).35
The total cost of CVD in 2004-05 was estimated to be $5.9 billion. This included $1.8 billion
for strokes and $546 million on coronary artery disease (AIHW 2008). These costs were
inflated to 2010 using the 10-year average health price inflation rate (3.4%). The total cost
in 2010 was estimated to be $7.1 billion.
The middle PAFs for stroke (Table 2.2) and coronary artery disease (Table 2.6) were applied
to these totals. The attributed cost of these conditions to sleep disorders was estimated
to be $34.8 million and $78.4 million for stroke and coronary artery disease respectively.
The PAF for all CVD (shown in Table 2.7) was used to estimate the residual attributed cost
for remaining CVD of $129.6 million.36
The total cost of depression and anxiety in 2004-05 was estimated to be $1.4 billion (AIHW
2010b). In 2010 prices, this was $1.7 billion. Using the middle PAFs for OSA, insomnia and
RLS, the cost of depression and anxiety attributed to sleep disorders in 2010 was
$170.8 million — $104.8 million to OSA, $49 million to insomnia and $16.9 million to RLS.
AIHW (2010b) provided an estimate of the total cost of injuries, although it was not broken
down by cause of injury. BITRE (2009) provided an estimate of the health system cost of a
MVA, which was used as the basis for the cost of MVAs in 2010. Average health care
system costs for hospitalised and non-hospitalised injuries and fatalities derived from BITRE
(2009) were inflated to 2010 prices using an average health expenditure inflation rate of
3.4% (AIHW 2010a). Average costs by injury type were applied to the estimated number of
injuries and fatalities in 2010 (Table 2.10) to estimate a total direct health care system cost
associated with MVA where OSA was a contributing factor. The number of injuries
attributed to OSA are shown in Table 4.1. This was estimated by applying the PAF to the
number of MVAs in 2010 (see Section 4.1.1).
Hospitalised road injuries were broken down by severity and level of disability using the
distribution of severity levels from the Bureau of Infrastructure, Transport and Regional
Economics (BITRE 2009). These are summarised in Table 3.5. The level of impairment was
assessed medically to determine current and future treatment and to aid in lodging
compensation claims to cover medical and other costs (BITRE 2009). Severity scores range
from 0 to 100, where 0 means no impairment. The breakdown of the number of people by
level of impairment in 2006 was estimated by BITRE (2009) using compensation claims data
from the Transport Accident Commission of Victoria and hospitalisations data from AIHW.
Direct health care system costs for road injuries and fatalities were separated into hospital,
medical and paramedical costs, and ambulance costs. Table 3.4 provides a brief description
of each of these cost components.
35
The AIHW includes only 86% of total recurrent health expenditure in its estimate of expenditure by disease
and injury, referred to as ‘allocated’ health expenditure. The ‘unallocated’ remainder includes capital
expenditure, expenditure on community health (excluding mental health), public health programs (except
cancer screening), health administration and health aids and appliances.
36 This was calculated by applying the PAF for all CVD to the total CVD expenditure and deducting the cost
already attributed to stroke and coronary artery disease.

Re-awakening Australia
52 Deloitte Access Economics Commercial-in-confidence
Table 3.4: Summary of direct health care system cost components for MVA
Cost
component Description
Hospital costs Includes all costs associated with hospital stays for both public and private
hospitals. BITRE (2009) assumed 39% of total bed days are in a private hospital
where it incurs marginally higher costs per patient day compared to public
hospitals. The cost per patient day is applied to average length of stay per injury
using AIHW (2009), which is broken down by serious injuries and serious injuries
with a high threat to life. Non-hospitalised injuries do not incur any hospital
costs.
Medical costs Includes all costs related to a crash including consultations with GPs, specialists,
hospital outpatient services, pharmaceuticals and medical excess payments
(BITRE 2009). Per person medical costs are higher for people with serious to
severe levels of impairment compared to minor to moderate levels.
Paramedical costs Includes all public and private allied health costs such as rehabilitation,
occupational therapy, vocational training, aids and equipment (for the person or
in the home), home services due to disability and other associated services. The
per person paramedical costs also increase as the level of impairment increases.
Ambulance costs Estimated using BITRE (2009), which includes the proportion of crashes that are
attended by ambulances, and the average cost per crash in 2006.
Source: Deloitte Access Economics.
The cost per person by severity of injury for the four types of health system costs are
shown in Table 3.5. To estimate the health care system costs of fatalities, it was assumed
that hospital and medical costs are only incurred for people who survived and were
admitted to hospital but died within 30 days from injuries sustained in the road traffic crash
(i.e. it does not include those who died at the crash site). Multiplying the estimated
number of injuries and fatalities by the average health care system cost of each, it was
estimated that direct health care system costs associated with MVA due to OSA were
$51.3 million in 2010.
Table 3.5: Average cost per person and total cost of road injuries due to OSA, 2010
Cost component Hospitalised Non-hospitalised Fatal
Hospital ($ per person) 7,289
Medical costs ($ per person) 8,070 2,401 3,259
Paramedical costs ($ per person) 4,867
Ambulance costs ($ per person) 2,179 2,443
Number of people 1,193 10,152 50
Total cost ($m) 26.7 24.4 0.1(a)
Note: (a) 21% of people are excluded under the assumption that they died at the crash site.
Source: BITRE (2009), Deloitte Access Economics’ calculations.
The health system cost of workplace accidents was based on Access Economics (2004),
which estimated that the cost per injury in 2000-01 was $6,009 Inflating to 2010 prices
using health price inflation gave a per injury cost of $8,256. Applying this to the number of
workplace injuries (including fatalities due to injury) caused by sleep disorders in 2010,
which was estimated to be 9,599 (see Table 4.1, Table 4.2 and Table 4.3 for the number of

Re-awakening Australia
53 Deloitte Access Economics Commercial-in-confidence
injuries), gave a total cost of workplace injuries attributed to sleep disorders in 2010 of
$79.2 million.
The total health system costs for conditions attributed to sleep disorders in
2010 was estimated to be $544.1 million. The composition of this cost by
condition is shown in Chart 3.3. Cardiovascular disease is the largest
contributor, accounting for 44%. Depression and anxiety accounted for 31% of
the costs while injuries contributed 25% — 10% from MVA and 15% from work
related injuries.
Chart 3.3: Health system costs for conditions attributed to sleep disorders, 2010
Source: Deloitte Access Economics’ calculations.
The proportion of total costs by each sleep condition was $408.5 million due to
OSA, $118.7 million due to insomnia and $16.9 million due to RLS.
3.3 Summary of health system costs
The total health care cost of sleep disorders in 2010 was estimated to be $818 million
(Table 3.6). High and low PAF gave estimates of $631 million and $977 million respectively.
The cost directly due to sleep disorders was $274 million, comprising $96 million for
hospital costs, $97 million in out-of-hospital medical costs and $82 million for CPAP devices.
The total health system cost of OSA was estimated at $644 million, comprising 79% of the
total cost. Insomnia comprised 15% of the total cost and RLS 2.1%. The remaining 3.9%
was from the cost of hospitalisation for other sleep disorders. In comparing these
proportions, it should be remembered that out-of-hospital medical costs were not included
for insomnia, RLS or other sleep disorders, but only for OSA.
Coronary heart
disease
14%
Stroke
6%
Other CVD
24%Depression and
anxiety
31%
Injuries from
motor vehicle
accidents
10%
Work -related
injuries
15%

Re-awakening Australia
54 Deloitte Access Economics Commercial-in-confidence
Table 3.6: Summary of health care costs of sleep disorders, 2010
Low Base case High
$m $m $m
Sleep disorders
Hospital costs 96 96 96
Out of hospital costs 97 97 97
Devices 82 82 82
Total sleep disorders 274 274 274
Associated conditions
Coronary heart disease 39 78 115
Stroke 24 35 45
Other CVD 59 130 196
Depression and anxiety 157 171 198
Injuries from motor vehicle accidents 36 51 64
Injuries from workplace accidents 42 79 84
Total other conditions 357 544 703
Total health care cost 631 818 977
Note: Columns may not sum due to rounding.
Source: Deloitte Access Economics estimates.

Re-awakening Australia
55 Deloitte Access Economics Commercial-in-confidence
4 Indirect costs This chapter investigates the indirect costs of sleep disorders, including the share of indirect
costs of the illnesses and injuries that were attributed to sleep disorders. Indirect costs are
costs that do not relate to the direct health care system costs. In this chapter the following
indirect costs are examined:
• productivity losses from reduced labour market participation through lower
employment, and premature mortality associated with sleep disorders and attributed
shares of other illnesses and injuries;
• costs to informal carers from providing care to someone who has a sleep disorder,
including the cost associated with attributed shares of other illnesses and injuries;
• other costs related to the attributed shares of other illnesses and injuries; and
• deadweight loss associated with raising additional tax revenue to publicly fund health
care services associated with sleep disorders and attributed shares of other illnesses
and injuries.
The majority of the costs presented in this chapter were based on the PAFs calculated for
the middle prevalence rate for each of the sleep disorders. In Section 4.6, the cost
estimates for the high and low prevalence rates are presented as a sensitivity analysis.
4.1 Productivity
There are a number of theoretical links between the level of an individual’s health and their
labour supply (Grossman 1972). Quite simply, better health outcomes allow an individual to
increase their supply of labour and to work more productively. Poor health outcomes are
likely to be associated with lower labour supply and lower productivity, thereby imposing a
cost on the economy.
A loss in productivity of a person will only equate to a loss in productivity to the economy
under fairly strict conditions. These are:
• the economy is at full employment so any reduction in hours worked due to sleep
health and attributed shares of other illnesses and injuries, or any permanent reduction
in labour force participation through early retirement or death, cannot be replaced by
employing or increasing hours of other workers; and
• the income of an individual is proportional to the total value added to production.
The first condition will fluctuate over time as the economy moves into, and out of, full
employment. A reduction in labour when labour is scarce will have a greater impact on
productivity compared to an economy with an abundant labour supply. In this situation, a
temporary or permanent reduction in working hours due to sleep disorders and associated
conditions cannot be replaced by hiring another worker. Consequently, a loss in
productivity due to sleep disorders and associated conditions is expected to represent a
real cost to an economy operating at a low level of unemployment.
Re-awakening Australia
56 Deloitte Access Economics Commercial-in-confidence
The second condition will occur if there is a perfect labour market such that the marginal
benefit from an additional hour of work (the value added) is equal to the marginal cost (the
wage). In reality, labour markets are imperfect for a number of reasons, for example
asymmetric information in the market, and labour market restrictions imposed by
government regulation and natural barriers. In addition, synergy created between labour,
capital and land means a reduction in working hours may also impact the productivity of
other factors of production.
Consequently the value of productivity from labour will be larger than the wage provided to
an individual so using lost income as a proxy for lost productivity will tend to underestimate
the true cost. It is likely that in the absence of their condition, people with sleep disorders
and associated conditions would participate in the labour force and obtain employment at
the same rate and average weekly earnings as others. The implicit assumption is that the
numbers of such people would not be of sufficient magnitude to substantially influence the
overall clearing of labour markets, and average wages remain the same.
The potential production losses are of four types:
• premature workforce separation — early retirement or other workforce withdrawal;
• temporary absenteeism — due to being unwell more often than average and taking
time off work, while remaining in the workforce;
• lower productivity at work (‘presenteeism’) — producing less due to reduced hours or
lower capacity while at work; and
• premature mortality — the discounted net present value of the future income streams
that would have been earned if a person dies prematurely.
The costs of presenteeism were not included due to data limitations - it is difficult to obtain
Australian data on the difference in productivity between people with and without a
particular illness or injury.
However, a number of studies show the productivity impacts of sleep disorders on
presenteeism as well as other types of productivity losses. For example, Kessler et al (2001)
show that insomnia was significantly associated with lost work performance due to
presenteeism, equivalent to 7.8 days per annum of lost work performance per individual
with insomnia after controlling for comorbid conditions, equating to US$63.2 billion in total
annually. The study suggests there are large potential productivity gains from increasing
sleep and enhancing alertness, not only by decreasing absenteeism and premature
workforce separation (including through premature mortality) but also through reducing
presenteeism and thus enhancing creativity and innovation in the work force.
4.1.1 Premature workforce separation
The amount of productivity loss that is attributable to a sleep disorder will depend on how
many people are not employed as a result of a sleep disorder or a condition that is caused
by a sleep disorder.
There is risk of double counting when costing the impact to productivity of each sleep
disorders and the associated conditions because data limitations make it difficult to isolate
whether or not any reduced employment among people with sleep disorders is due to the
sleep disorder or the associated conditions. The cost has therefore been based on the
Re-awakening Australia
57 Deloitte Access Economics Commercial-in-confidence
share of the cost of injuries and illness attributable to sleep disorders. It was assumed that
a sleep disorder does not compound the probability of premature workforce separation for
people with a particular illness or injury and a sleep disorder, compared with those who
have that illness or injury but not a sleep disorder.
The cost to productivity for each injury and illness associated with a sleep disorder was
determined by the difference in the employment rate of people with each injury or illness
derived from a sleep disorder and the age gender standardised Australian population
equivalent.
Calculating this requires first determining the number of people, by age and gender, with
each injury or illness. This was done by applying the PAFs calculated in Chapter 2 to the
total prevalence, split by gender, of each of the CVDs and depression (Table 2.1, Table 2.3,
Table 2.5 and Table 2.8) and the incidence of road and workplace accidents (Table 2.10 and
Table 2.12). The attributed cases of each injury and illness were split by age and gender
based on the relative probability that a person with both the sleep disorder and other injury
or illness would be in each age-gender group.37
People with sleep disorders could have multiple conditions associated with their sleep
disorder. Applying the PAF to the number of people with each condition could result in the
same person being counted towards multiple conditions. This would result in double
counting when calculating the indirect costs. To avoid double counting the prevalence
estimates were adjusted to take this into account. For each condition, the probability of
having that condition and each of the other conditions was calculated (by multiplying the
probability together to find a joint probability). The number of people with two conditions
was subtracted from the number of people with each of those two conditions. This means
that the cost calculated does not include these people at all. The reason for excluding them
completely rather than removing them from one of the two conditions to which they were
counted was twofold.
• The probability of having two conditions is not based on observation (for example a
clinical study that measures the prevalence of people with two conditions caused by a
sleep disorder). It is therefore unclear which condition it would be preferable to count
them towards.
• The prevalence was only adjusted for people who have two conditions and there could
be people with more than two conditions. Excluding people with two conditions will
have an offsetting effect on the double counting of people with more than two
conditions.
The number of people in 2010 by age and gender with OSA and each illness and injury
associated with OSA are shown in Table 4.1. Table 4.2 and Table 4.3 show the same for
insomnia and RLS respectively.
37
For example, the probability that a person with depression and OSA is a female aged 20-44 is the probability
of a person with depression (in the population 20 years and over) being females aged 20-44 (25%) multiplied by
the probability of a person with OSA being female aged 20-44 (13.3%). Cases are the allocated to female age
20-44 based on the probability relative to other age groups.

Re-awakening Australia
58
Table 4.1: Prevalence of OSA and associated conditions caused by OSA by age and gender, 2010
Age-gender Coronary
artery disease Stoke CHF Depression
Workplace
injury MVA OSA
No. No. No. No. No. No. No.
Male
20–24 0 0 0 2,351 30 2,389
131,507 25–34 0 136 3 7,303 62 3,128
35–44 395 383 25 8,849 69
45–54 3,166 1,041 211 13,504 152 3,503 284,598
55–64 8,230 3,175 509 4,733 99
65+ 11,029 4,487 1,031 1,847 7 872 173,075
Total 22,820 9,222 1,779 38,588 420 9,892 589,181
Female
20–24 0 0 0 898 61 204
22,775 25–34 0 31 20 1,841 116 229
35–44 37 59 21 1,807 175
45–54 325 159 119 3,889 257 407 53,706
55–64 646 459 220 2,454 117
65+ 4,262 2,968 993 3,305 9 614 108,929
Total 5,270 3,676 1,373 14,193 735 1,454 185,410
Note: Numbers crossing multiple rows refer to the total for the combined age groups.
Source: Deloitte Access Economics calculations.

Reawakening Australia
59 Deloitte Access Economics
Table 4.2: Prevalence of insomnia and associated conditions by age and gender, 2010
Age-gender Depression Workplace injury Insomnia
Male
20–24 134 259 13,044
25–34 10,833 572 25,320
35–44 1,010 1,180 26,899
45–54 795 1,264 29,938
55–64 289 852 30,545
65+ 236 125 37,916
Total 13,295 4,251 163,662
Female
20–24 540 164 23,626
25–34 2,233 621 47,906
35–44 2,380 1,023 52,390
45–54 2,417 1,560 58,722
55–64 1,572 735 59,615
65+ 1,531 75 86,422
Total 10,674 4,178 328,681
Source: Deloitte Access Economics calculations.
Table 4.3: Prevalence of RLS and associated conditions by age and gender, 2010
Age-gender Depression RLS
Male Female Male Female
20–24 69 219 4,233 6,071
25–34 482 986 9,464 13,303
35–44 722 1,290 11,697 17,720
45–54 683 1,596 15,678 24,021
55–64 248 1,033 16,236 24,644
65+ 205 984 20,917 35,345
Total 2,409 6,109 78,225 121,105
Note: Age-gender breakdown was determined for depression by assuming dividing the 10 year age groups into
five year age groups by assuming 50% of people would occur in each group.
Source: Deloitte Access Economics calculations.
The loss of employment was calculated separately for each condition using information on
the impact on employment rates for the relevant condition. All employment data for
Australia was sourced from ABS (2011b).
The rates of employment for each of the CVDs were taken from the NHS unit record data.38
The proportion of people with each disease who are employed was compared with the
employment rate that would be expected in the absence of the disease, based on the
38
The sample of the working age population with stroke, congestive heart failure or coronary artery disease is
small (130; 418; 476 respectively). Also, it should be noted that the analysis was conducted on records of each
condition not people – that is the same person could have more than one condition.

Reawakening Australia
60 Deloitte Access Economics
probability of employment by age and gender of the Australian population. The result is
that:
• stroke reduces the probability of employment on average by 34.1% (44.4% are
employed compared with 67.5% likely to be employed in the absence of stoke);
• CHF reduces probability of employment on average by 27.1% (49.8% are employed
compared with 49.8% likely to be employed in the absence of CHF); and
• coronary artery disease reduces the probability of employment on average by 26.2%
(52.6% are employed compared with 71.3% likely to be employed in the absence of
coronary artery disease).
These percentage reductions in employment are based on data for the population.
However, the age gender distribution of people with OSA and each of these conditions is
different from that of people with the condition. This means that the expected rate of
employment would also be different. To adjust for this, the expected rate of employment
without the condition was calculated based on the age gender distribution of people with
OSA and each of the CVD conditions (shown in Table 4.1, Table 4.2 and Table 4.3). This
employment rate is shown in Table 4.4. The employment rate with the condition was then
calculated based on the percentage reduction that the disease was expected to cause,
shown above.39 The number of people not working due to illnesses caused by sleep
disorders was 1,351 people with stroke, 215 with CHF and 2,654 with coronary artery
disease (Table 4.4).40 The loss in wages was calculated based on an average wage weighted
by age and gender (ABS 2011c).
The resulting loss in productivity was $92.5 million due to stroke, $13.7 million
due to CHF and $184.6 million due to coronary artery disease (Table 4.4) – a
total of $290.8 million in lost productivity due to CVDs from OSA.
Table 4.4: Lost productivity due to CVDs
Stroke CHF Coronary artery
disease
Potential employment rate 72.7% 70.1% 79.0%
Actual employment rate 47.9% 51.0% 58.2%
Number not employed 1,351 215 2,654
Average annual earnings ($) 68,468 63,588 69,564
Lost productivity ($m) 92.5 13.7 184.6
Source: Deloitte Access Economics calculations
39
For example, based on the age gender distribution of people with stroke and OSA the number of people who
would be employed if the employment distribution followed the Australian population would be 72.7%. This is
higher than the proportion that would be expected to be employed if they just had stroke (67.5%). The reason
for this is that people with stroke caused by OSA are on average younger than people with stroke (by
construction of the sample). Assuming the impact of stroke on employment is the same regardless of whether
the person has OSA, stroke reduces the probability of employment by 34.1%. Applying this percentage
reduction to 72.7% gives a probability of employment for people with stroke and OSA of 47.9%. The difference
in the number of people employed is 1,351 or 24.8%.
40 It was assumed that the probability of ceasing employment was constant across age and gender. Although
this could be true if the severity of condition is independent of age, the probability is likely to also be associated
with wealth, income and years remaining to retirement.

Reawakening Australia
61 Deloitte Access Economics
The employment rate for people with depression was based on the 2007 National Survey of
Mental Health and Wellbeing (ABS 2008). This showed that only 21.7% of people with an
affective disorder were employed full-time and 38.1% were employed part-time. The
employment rates expected in the absence of depression (that is based on the age gender
employments rates of the Australian population) were 57.7% for full-time and 14.5% part-
time. The impact of depression was estimated to be a reduction in 30,736 people in full-
time employment and an increase of 20,091 people in part-time employment. Age gender
adjusted average annual earnings (ABS 2011c) were calculated for each sleep disorder, on
average this was $70,622 for full-time employees and $28,770 for part-time employees
with OSA. The net loss in productivity in 2010 due to reduced employment was therefore
estimated to be $1,593 million.
OSA was the most costly, contributing $1,092 million to the total cost while
insomnia contributed $417 million and RLS $82 million (Table 4.5) – a total of
$1.591 billion in lost productivity due to depression from sleep disorders.
Table 4.5: Lost productivity due to depression
OSA Insomnia RLS
Full-time Part-time Full-time Part-time Full-time Part-time
Potential employment rate 60.2% 12.7% 57.3% 16.5% 43.7% 20.5%
Actual employment rate 21.7% 38.1% 21.7% 38.1% 21.7% 38.1%
Number not employed 20,324 -13,408 8,538 -5,181 1,874 -1,501
Average annual earnings ($) 73,275 29,592 65,507 27,458 66,858 28,584
Lost productivity ($m) 1,489 -397 559.3 -142.3 125.3 -42.9
Net productivity loss ($m) 1,092 417 82
Source: Deloitte Access Economics calculations
Lost productivity from injury was based on an incidence approach, hence the cost in 2010
was the lifetime cost of lost productivity due to injuries incurred during 2010 that can be
attributed to sleep disorders. The total cost associated is therefore made up of temporary
costs and the present value of lifetime costs. Temporary cost results from lost productivity
associated with being temporarily out of work due to injuries sustained within a road traffic
crash or workplace accident. Lifetime costs depend on the number of years that the
disability continues to impact employment opportunity until retirement age is reached.
Following BITRE (2009) it was assumed that the probability of returning to work if
profoundly disabled was zero. Severely and moderately disabled people were assumed to
return to work with probability 3.0% and 50.6% respectively following an absence of 44.1
weeks. All other injuries were assumed to have a much smaller impact on productivity
following a temporary absence. The probability of returning to work along with the
assumed number of weeks temporarily absent is shown in Table 4.6.
BITRE (2009) estimated the breakdown of hospitalised injuries by level of disability using
data from the Australian Bureau of Statistics (ABS) and data on disability on discharge. It
was assumed that the distribution of injury severity in 2006 was the same as the
distribution of injuries caused by OSA related MVA in 2010.
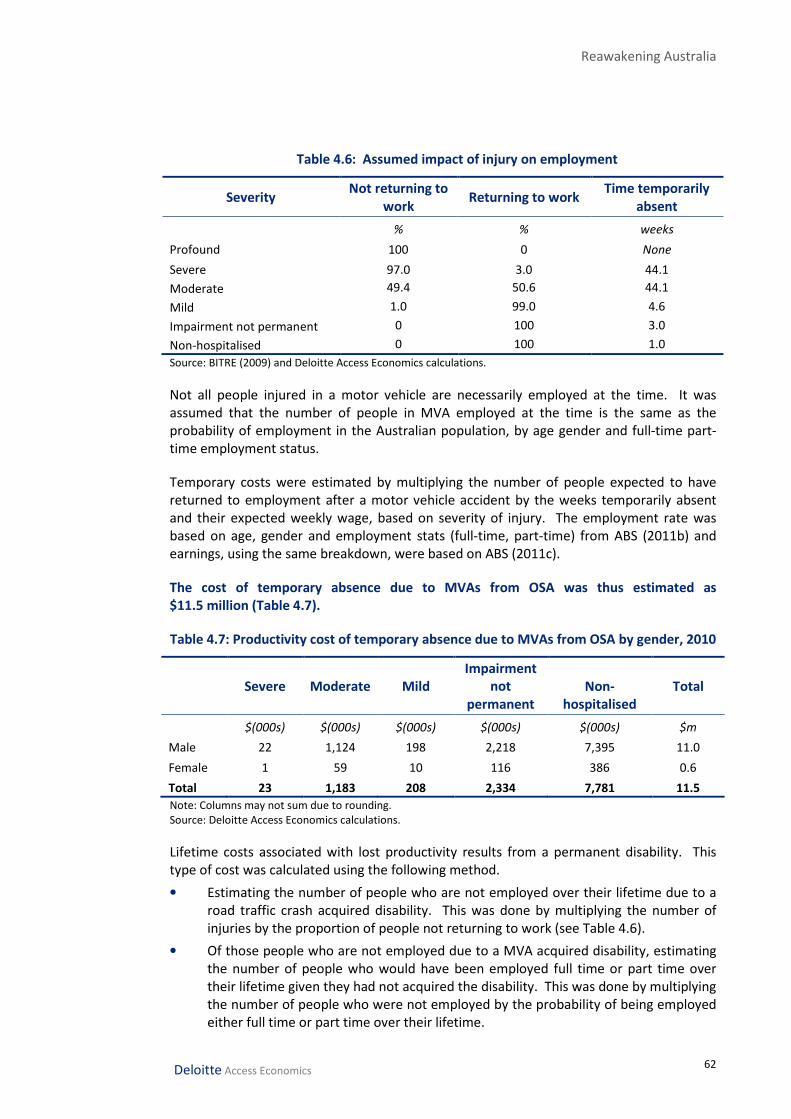
Reawakening Australia
62 Deloitte Access Economics
Table 4.6: Assumed impact of injury on employment
Severity Not returning to
work Returning to work
Time temporarily
absent
% % weeks
Profound 100 0 None
Severe 97.0 3.0 44.1
Moderate 49.4 50.6 44.1
Mild 1.0 99.0 4.6
Impairment not permanent 0 100 3.0
Non-hospitalised 0 100 1.0
Source: BITRE (2009) and Deloitte Access Economics calculations.
Not all people injured in a motor vehicle are necessarily employed at the time. It was
assumed that the number of people in MVA employed at the time is the same as the
probability of employment in the Australian population, by age gender and full-time part-
time employment status.
Temporary costs were estimated by multiplying the number of people expected to have
returned to employment after a motor vehicle accident by the weeks temporarily absent
and their expected weekly wage, based on severity of injury. The employment rate was
based on age, gender and employment stats (full-time, part-time) from ABS (2011b) and
earnings, using the same breakdown, were based on ABS (2011c).
The cost of temporary absence due to MVAs from OSA was thus estimated as
$11.5 million (Table 4.7).
Table 4.7: Productivity cost of temporary absence due to MVAs from OSA by gender, 2010
Severe Moderate Mild
Impairment
not
permanent
Non-
hospitalised
Total
$(000s) $(000s) $(000s) $(000s) $(000s) $m
Male 22 1,124 198 2,218 7,395 11.0
Female 1 59 10 116 386 0.6
Total 23 1,183 208 2,334 7,781 11.5
Note: Columns may not sum due to rounding.
Source: Deloitte Access Economics calculations.
Lifetime costs associated with lost productivity results from a permanent disability. This
type of cost was calculated using the following method.
• Estimating the number of people who are not employed over their lifetime due to a
road traffic crash acquired disability. This was done by multiplying the number of
injuries by the proportion of people not returning to work (see Table 4.6).
• Of those people who are not employed due to a MVA acquired disability, estimating
the number of people who would have been employed full time or part time over
their lifetime given they had not acquired the disability. This was done by multiplying
the number of people who were not employed by the probability of being employed
either full time or part time over their lifetime.
Reawakening Australia
63 Deloitte Access Economics
• Of those people who would have been employed given they had not acquired the
disability, estimating their lost income over their expected working life. This was
done by multiplying the expected annual income at each age bracket by the number
of people who would have been employed. The potential income earned over a
lifetime was based on the income distribution for Australia in 2010 (ABS 2011c). It
was assumed that people involved road traffic crashes would have the same average
income and probability employment as the general population.41
The present value of lifetime costs associated with lost productivity was estimated to be
$45.2 million in 2010.
Adding the cost of temporary productivity loss from Table 4.7 to this cost of
lifetime productivity loss, the total present value cost associated with lost
productivity due to injury and disability associated with MVA among people
with OSA was $56.8 million in 2010. There was no cost associated with MVA
and insomnia or RLS due to inconclusive evidence on the contribution of these
conditions to MVA.
The cost of workplace injury was taken from Access Economics (2004b). Human capital
costs — lost productive capacity of the worker until retirement age — for people with
injuries were $25.7 billion in 2000-01 or $61,670 per person injured. Using wage price
inflation between 2000-01 and 2010 (ABS 2011c) the human capital cost per person injured
was $94,962. Production disturbance costs — the value of production lost between the
incident and when a worker either returns to work or is (fully or partially) replaced, as well
as the staff turnover costs — for people injured in the workplace were $876 million in 2000-
01 or $2,972 per person injured. In 2010 prices this is a cost of $4,576 per person injured.
The total productivity cost per person injured in the workplace in 2010 was $99,538.
In 2010 9,584 people were injured in workplace accidents caused by sleep
disorder (1,155 due to OSA and 8,586 due to insomnia). The total cost to
productivity was estimated at $954 million. The cost due to OSA was $108
million and the cost due to insomnia was $926 million. There was not cost
associated with RLS and workplace injuries due to inconclusive evidence on the
contribution of RLS to workplace accidents.
4.1.2 Premature mortality
In addition to the productivity loss associated with reduced employment, there is also
productivity forgone from premature mortality due to each of the illness or injuries
attributed to a sleep disorder.
Total deaths from CVDs were based on a linear projection the number of deaths from 2000
to 2009 from ABS Cause of Death data (ABS 2011d). An age gender breakdown was
determined using data from AIHW (2011a) for each of the CVDs, which was projected to
41
A real growth rate for income was assumed at 0.62%, which is the average real rate of growth in average
weekly earnings between 1982 and 2020, based on forecasts made by Access Economics (2010). Future income
was discounted at 7% (OBPR 2010).

Reawakening Australia
64 Deloitte Access Economics
2010. The expected distribution in 2010 was then applied to the estimated total number of
deaths. The number of deaths attributable to OSA was estimated by applying the PAF to
the total number of deaths. An age-gender distribution was then determined based on the
probability a person with both the CVD and OSA would be in each age gender group.
It was difficult to determine the number of deaths due to depression because data on
deaths is based on the underlying cause of death listed on the death certificate. The cause
of death is determined by a medical practitioner or coroner as the condition that began the
train of events that led directly to death (ABS 2003). The consequence of this is that for
illnesses such as depression, there are very few if any records of death because the primary
cause of death would be recorded as suicide. Based on AIHW (2010e) 42% of male and 53%
of female suicides were attributed to depression. It was assumed that the proportion of
suicides resulting from depression is the same across the age distribution. Depression
related suicides were attributed to sleep disorders by applying the PAF for each disorder to
the total number of deaths.
Deaths from motor vehicle accidents in 2010 by age and gender were obtained from the
Department of Infrastructure and Transport (2010). The number of deaths from workplace
accidents in 2010 was not available, so deaths were estimated based on a projection of the
number of deaths from 2003-04 to 2007-08 obtained from Safe Work Australia (2010). An
age gender distribution was based on a projection of the age gender breakdown over this
period. The number of accidental deaths due to sleep disorders were again obtained by
applying the PAF to the total number of deaths and then backing out an age distribution
using the age distribution of the sleep disorder and the deaths.
The productivity lost due to premature deaths was calculated by multiplying the estimated
number of deaths from each condition that can be attributed to OSA by lifetime potential
earnings at the time of death. Lifetime earnings were based on age and gender and
adjusted for the probability of employment, full-time or part-time. Assuming a retirement
age of 65, the remaining years of employment were calculated for each age group based on
the average for a person of each age in the group.
The annual productivity loss from premature death was valued using 2010 average annual
earnings data by workforce age group (ABS 2011c). Future streams of income were
discounted to a present value using a 7% real discount rate, which is consistent with the
federal government’s choice of discount rate for assessing regulatory interventions (OBPR
2010).
In 2010 the productivity cost of premature mortality due to stroke was
estimated to be $15.7 million and from coronary artery disease was estimated
to be $43.3 million. Deaths from depression related suicide cost $54 million
and MVAs cost $23.7 million. Workplace accidents cost $8.0 million. The total
cost of premature mortality in 2010 was $145.5 million.
The cost premature mortality caused by OSA was $117.9 million. Insomnia and
RLS accounted for $23.1 million and $4.4 million respectively.

Reawakening Australia
65 Deloitte Access Economics
Table 4.8: Productivity cost of premature mortality
Condition Male Female Persons
Full-time Part-time Full-time Part-time
$m $m $m $m $m
Coronary artery
disease 37.7 2.8 2.3 0.4 43.3
Stoke 11.5 0.8 2.9 0.5 15.7
CHF 0.7 0.1 0.1 0.0 0.9
Depression 38.6 2.4 10.2 2.7 54.0
MVA injuries 20.9 1.3 1.2 0.3 23.7
WPA 6.8 0.4 0.6 0.2 8.0
Total 116.3 7.8 17.3 4.1 145.5
Note: No deaths of working age people (15-64 years of age) were found to be attributable to a sleep disorder.
Source: Deloitte Access Economics calculations.
4.1.3 Absenteeism
People with chronic conditions such as sleep disorders and associated other conditions may
take more days off work than the average Australian. Absenteeism was measured by
looking at the number of work days missed by people with chronic conditions relative to
the rest of the population. AIHW (2009b) found that people with chronic disease, including
depression and CVD, reported missing 0.48 days of work per fortnight compared with 0.25
days per fortnight missed by people without a chronic disease. This amounts to an average
of 11.5 days of sick leave per year for a person with a chronic condition compared to 6 days
for a person without a chronic disease.
The cost of absenteeism for each condition caused by a sleep disorder was therefore
assumed to be 5.5 days per person employed. The cost of a missed day of work for each
condition was based on number of people employed full-time and part-time and the age-
weighted weekly wages from Section 4.1.1 for each condition.
In total absenteeism from sleep related CVD and depression cost $91.9 million
in 2010 (Table 4.9). Depression was the largest component of the cost account
from $76.4 million followed by coronary artery disease at $10.9 million. Stroke
and CHF account for $3.8 million and $0.8 million respectively.
Table 4.9: Productivity cost of absenteeism
Condition Cost
$m
Coronary artery disease 10.9
Stoke 3.8
CHF 0.8
Depression 76.4
Total 91.9
Source: Deloitte Access Economics’ estimates.

Reawakening Australia
66 Deloitte Access Economics
The cost of temporary absence due to the event of the accident was included in Section
4.1.1. However, people injured in a MVA or workplace accident could also incur an
absenteeism cost once they return to work because they may have ongoing health issues as
a result of their injury, which require days off work. Due to data limitations this cost could
not be calculated.
4.2 Informal care
An injury or illness that results in impairment or disability not only impacts on the individual
experiencing the event, it can also impact on their family and friends. This is typically
through the emotional strain it places on others, such as anxiety and stress associated with
uncertainty surrounding survival. However, it can also impact through lifestyle changes
that result from caring activities required.
A range of informal care activities are usually provided to individuals who have a disability,
illness or impairment. Informal care activities depend on the level of impairment and
disability of the person, and can include:
• collecting any relevant prescriptions and organising and timing the administration of
medication (if required);
• nursing care, such as feeding, washing, dressing, assisting with going to the toilet,
cooking and laundry;
• ad-hoc tasks, such as shopping, transporting and cleaning activities;
• monitoring of the patient’s physical and mental wellbeing;
• delivering a support network for any depression that may result from the disability or
impairment; and
• assessment of certain activities on the patient’s condition (e.g. determining the
appropriateness of social engagements or work related activities).
Due to limited data, it is problematic to separate the time that family and friends spend
helping someone as a result disability or illness and the time when they are simply
undertaking activities with the person unrelated to the injuries sustained. It is also
problematic to estimate the cost of informal care as consideration must also be given to the
number of people receiving informal care, the amount of time devoted to informal care per
day, the number of days informal care is provided, and the value of time associated with
informal care (which depends on whether the informal carer has substituted labour supply
or leisure time in providing care).
The opportunity cost method was used to estimate the cost of informal care. This method
measures the value in alternative use of time spent caring, which is typically valued by
productivity losses (or value of leisure time) associated with caring. It is based on the
assumption that time spend providing informal care could be alternatively used within the
paid workforce or in leisure activities. The value of informal care provided by one individual
in any time period t using the opportunity cost method can be represented by:
Vit = titwit
where Vit is the value of informal care for individual i in time t, tit is the time provided and
wit is the net market wage rate (van den Berg et al 2006).

Reawakening Australia
67 Deloitte Access Economics
For those who provide informal care but are not in paid work (e.g. children or those who
have retired), the value of providing informal care is the value of the lost opportunity of
undertaking leisure time. This can be approximated by the willingness to pay to undertake
leisure, or to avoid work. However, the value of leisure time is often proxied by an average
age and sex specific wage rate (Brouwer and Koopmanschap 2000; Heitmueller 2007). If
the value of non-work is more (less) than the average wage rate, the opportunity cost
method will under (over) estimate the value of informal care.
The cost of informal care for MVA was based on BITRE (2009). The average number of
hours of care presented in BITRE (2009) was used to estimate the number of hours of
informal care provided to people who sustain injuries in a road traffic crash resulting in
permanent disabilities. BITRE (2009) estimates are based on ABS (2004) data and
assumptions about a weekly care cycle whereby the average amount of care required per
week increases with a person’s level of disability. They also assumed that people with a
mild disability or those who did not suffer from permanent disability do not require
informal care. The estimated number of hours of care required per week by level of
disability is summarised in Table 4.10.
Table 4.10: Estimated hours per week of care by level of disability, 2010
Profound Severe Moderate
Number of people affected
15-24 6 5 8
25 - 44 8 7 10
45-64 9 8 12
65+ 3 3 4
Total 26 22 34
Days of care needed per week 7 3.8 3
Hours of care per day 15 7.5 3
Care hours per week 105 28.5 9
Source: BITRE (2009) and Deloitte Access Economics’ calculations.
Applying the number of informal care hours to the number of people estimated to sustain a
moderate to profound disability as a result of a road traffic crash in 2010, it was estimated
that around 192,174 hours of care was provided. It was assumed that the number of hours
of care required would remain constant over the lifetime of the person injured. The
average number of years for which care would be received was the difference between the
age at which the disability was sustained, and an assumed life expectancy of 80 years (ABS
2010c). Because data for injuries by disability level for ages is unavailable, a uniform
distribution in each age group is assumed.
The age and gender adjusted average weekly earnings of primary carers in Australia in 2010
was $735 (ABS 2011c).42 A long run average real rate of growth in average weekly earnings
of 0.62% per year was assumed (Access Economics 2010a). Weekly earnings were
multiplied by the number of people by level of disability for the remainder of their lifetime
and discounted to a net present value using a discount rate of 7% (OBPR 2010).
42
The age gender distribution of primary carers in 2010 was estimated by Access Economics (2010b).

Reawakening Australia
68 Deloitte Access Economics
The lifetime cost of informal care for people injured in MVAs due to OSA in 2010 was
estimated to be $48.3 million.
The cost of informal care due to workplace accidents was based on Access Economics
(2004b). In 2000-01 people injured in a workplace accident used $809.9 million of informal
care or $2,748 per injured person. In 2010 prices this would be $3,589 of informal care per
person injured. Applying this cost to the 9,584 people injured in workplace accidents due
to OSA or insomnia gives a total cost in 2010 for informal care of $34.4 million.
Access Economics (2005b) estimated that the cost of informal care due to CVD was $784.71
per person with CVD in 2004. In 2010 prices this would be a cost of $1,055 per person with
CVD. Applying this cost to the number of people with coronary artery disease, stroke and
CHF due to OSA (Table 4.1) gives informal care costs of $29.6 million, $13.6 million and
$3.3 million for each condition respectively.
The total cost of informal care due to sleep disorders in 2010 was estimated to
be $129.3 million (Table 4.11). The majority of this cost was attributable to
OSA, which accounted for $99 million and insomnia accounting for $30.3
million.
Table 4.11: Cost of informal care, 2010
Condition Cost
$m
Coronary artery disease 29.6
Stoke 13.6
CHF 3.3
Depression(a)
—
MVA 48.3
Workplace accidents 34.4
Total 129.3
Note: (a) No data were available on the cost of informal care for depression.
Source: Deloitte Access Economics’ estimates.
4.3 Other costs of motor vehicle accidents
4.3.1 Disability related costs
Other disability-related costs of a road injury for people who suffer a permanent disability
include a range of one-off and recurrent costs such as:
• specialist accommodation;
• therapy and specialist services;
• respite programs;
• aids and equipment; and
• modifications to the home (BITRE 2009).

Reawakening Australia
69 Deloitte Access Economics
Average disability-related costs increase with the severity of a person’s disability, from
$14,340 for a person with a moderate disability to $39,522 for a person with a profound
and serious disability in 2006 (BITRE 2009). Recurrent costs are incurred annually over the
expected lifetime of a person with moderate to profound disabilities.
Multiplying the estimated number of permanent disabilities according to severity by the
average cost relating to other disability services (sourced from BITRE (2009) and adjusted to
2010 prices)43, the total disability-related cost of people incurring a permanent disability
from MVA was estimated to be $5.8 million in 2010.
4.3.2 Vehicle-related costs
Vehicle related costs arise from property damage resulting from a road traffic crash.
Vehicle related costs include:
• costs of repairing a damaged vehicle (including towing costs); and
• the cost of vehicle unavailability (that is, the loss in value to the owner due to the
inability to use the car for personal or commercial purposes while being repaired).
Average vehicle related costs were sourced from BITRE (2009) and inflated to 2010 prices.44
The cost of repairing a damaged vehicle was based on average insurance claims and
included an average excess payment of $500. The loss in value associated with not being
able to use a car was based on the daily rate of hiring a car obtained through a survey of
vehicle hire services, including Hertz, Budget, Europcar and Avis (BITRE 2009). It was
assumed that motor vehicles involved in unreported road traffic crashes did not result in
vehicle unavailability and therefore did not incur this type of cost.
To estimate total vehicle related costs, average costs were multiplied by the estimated
number of vehicles involved in OSA related MVAs in 2010.
The total number of MVA was estimated to be 36,742 involving 64,470 vehicles. Total
vehicle related cost was estimated to be $282.0 million in 2010, with $269.9 million
attributed to the cost of vehicle repairs. The cost of vehicle unavailability was estimated
to be $12.1 million.
4.3.3 General costs
There are several other costs associated with MVAs. These have been classified as general
costs, and were estimated using average costs sourced from BITRE (2009) inflated to 2010
prices.45 The methodology used to estimate each general cost item is outlined below.
• Costs of emergency services from police and fire and rescue were based on an
average cost per hospitalised injury. Total cost was calculated by multiplying the
average cost to total number of hospitalised injuries.
• Insurance administration costs are associated with administering compulsory third
party systems. It was estimated by multiplying an average cost per hospitalised
43
Average annual inflation rate was assumed to be 2.8% based off ABS (2011d).
44 Average annual inflation rate was assumed to be 2.8% based off ABS (2011d).
45 Average annual inflation rate was assumed to be 2.8% based off ABS (2011d).

Reawakening Australia
70 Deloitte Access Economics
injury to the total number of hospitalised injuries in 2010. This is based on Transport
Accident Commission of Australia data.
• Legal costs in the event that a road traffic crash injury claim becomes litigious were
estimated using an average cost per hospitalised injury and multiplied by the total
number of hospitalised injuries in 2010. Costs were based on average size of claims
from the Transport Accident Commission of Victoria.
• Cost of travel delay takes into account the value of time, flow rate during peak and
non-peak hours, crash time of day and week, crash severity, response time of
emergency services, time at crash scene and restricted flow factors as a result of the
crash. Total cost was calculated using an average cost per fatality, injury and
property damage crash and multiplying by the respective number of crashes.
• Health costs associated with local air pollution caused by additional time queuing in
traffic with the engine running leading to atmospheric exhaust emissions. Total cost
was calculated using an average cost per fatality, injury and property damage crash
and multiplying by the respective number of crashes.
• Additional vehicle operating costs result from the extra time spent in congested
traffic due to a road traffic crash. Total cost was calculated using an average cost per
fatality, injury and property damage crash and multiplying by the respective number
of crashes.
• The cost of repairing street furniture, especially for property damage only crashes.
Total cost was estimated by multiplying the average cost of repairing street furniture
with the total number of crashes in 2010.
Fatalities due to MVA additional general costs. These types of costs were calculated by
multiplying the inflated average cost for each cost item sourced from BITRE (2009) prices by
the number of fatalities in 2010. 46 These costs include:
• cost of a coronial investigation for deaths that are unexpected, violent, unnatural or
suspicious;
• cost of premature funerals;
• insurance administration costs associated with processing claims for fatalities;
• criminal legal costs if a person is charged with a criminal offence following a fatality;
and
• costs of providing correctional services for a person imprisoned following a fatality.
Total general costs for road traffic crashes were estimated to be $176.9 million
in 2010. Each general cost item is shown in Table 4.12. The majority of
general costs result from insurance administration costs ($101.5 million).
Other substantial general cost items include the cost of travel delay and
vehicle operating costs from congested traffic ($50.2 million), and legal costs
($10 million).
Together with the costs of disability ($5.8 million) and vehicle related costs
($282.0 million) from Sections 4.3.1 and 4.3.2, the total additional cost of
MVAs was estimated as $464.7 million in 2010.
46
Average annual inflation rate was assumed to be 2.8% based off ABS (2011d).

Reawakening Australia
71 Deloitte Access Economics
Table 4.12: Estimated general costs of road traffic crashes, 2010
Item Cost
$ (million)
Insurance administration 101.5
Travel delay and vehicle operating costs 50.2
Legal costs 10.0
Health cost of crash-induced pollution 5.4
Police and fire and rescue services 3.2
Street furniture damage cost 4.5
Correctional services 1.7
Premature funeral cost 0.2
Coronial costs 0.1
Total general costs 176.9
Source: Access Economics calculations.
4.4 Other costs of workplace accidents
There are a number of other costs associated with workplace accidents. These costs were
based on Access Economics (2004b) estimates per workplace injury inflated to 2010 prices.
The total other costs of workplace accidents in 2010 due to sleep disorders
was $52.5 million (Table 4.13). This comprised $15.4 million in legal costs,
$10.5 million in investigation costs, $15.8 million in travel costs and $11 million
in aids and equipment for people permanently disabled. The cost of premature
funerals was $25,500.
Table 4.13: Other costs of workplace accidents, 2010
Item Cost
$ (million)
Legal costs 15.4
Cost of investigation 10.5
Travel costs 15.8
Premature funeral cost 0.0
Aides and equipment 10.8
Total 52.5
Source: Access Economics calculations.
4.5 Deadweight loss
Many of the costs associated with sleep disorders publically funded. These include some
direct health care system costs, social security (transfer) payments, correctional services,
coronial costs and the cost of emergency and police services.

Reawakening Australia
72 Deloitte Access Economics
Publically funding costs means the government must effectively increase tax revenue to
achieve a budget neutral position. To look at it another way, if all sleep disorders were
avoided, the government would need to raise less taxation revenue.
Imposing taxes on a market reduces the efficiency of resource allocation within that market
because it changes the price of those goods or services being taxed. For example, an
increase in income tax rates will increase the relative price of work compared to leisure and
therefore create a disincentive to work. This market distortion creates a reallocation of
resources within the market being taxed and therefore creates an allocative efficiency loss.
This is an economic cost to society because it results in less welfare through a reduction in
producer and consumer surplus.
Although transfer payments are not an economic cost in themselves (they do not involve
the use of resources) they have been estimated, along with public funding of health care for
sleep disorders and attributed shares of other diseases and injuries, to calculate the cost
associated with a loss in allocative efficiency.
There are several social security payments available to people with disability or unable to
work, the main one being the Disability Support Pension. The Disability Support Pension is
paid to people over the age of 16 who have disabilities that preclude them from working for
at least 15 hours per week at or above the relevant minimum wage or able to return to
such work for at least the next two years due to a disability (Department of Human Services
2010a). In addition, people receiving the Disability Support Pension are eligible for the
Pension Supplement (which incorporates allowances for utilities, telephone,
pharmaceuticals and GST) and Rent Assistance if they are renting in the private market
(Department of Human Services 2010b).
In 2010 the Disability Support Pension was paid at an average annual rate of $15,904
(FaHCSIA 2011).47 In addition to the Disability Support Pension an annual amount of $1,297
was payable in Pension Supplement and $2,866 in Rent Assistance. It was assumed that
30% of people are eligible for rent assistance, in line with the proportion of Australians
renting. The average social security payment for a disabled person was therefore
estimated to be $18,061.
The lifetime cost of social security payments was estimated for people who sustained
injuries in motor vehicles that did not return to work using a discount rate of 7%. Social
security payments made to people in workplace accidents were based on the cost per
injury from Access Economics (2004b) in 2010 prices.
For CVD and depression it was assumed that all people not employed due to their illness,
who were of working age, would receive a pension. The social security cost of these
illnesses was estimated for 2010 because the cost of these illnesses is based on a
prevalence approach.
It was estimated that $279 million was spent on social security payments in 2010 (Table
4.14). The cost due to OSA was $197 million (70%). The most costly condition associated
47
This rate is based on a weighted average (0.25, 0.5, 0.25) of the annual rates applicable as of 20/9/2009,
20/3/2010 and 20/9/2010. The couples and singles rate was averaged.

Reawakening Australia
73 Deloitte Access Economics
with OSA was depression followed by CVD. The cost of insomnia related social security
payments was $77 million (28%) and for RLS the cost was $5 million.
Table 4.14: Social security payments to people not employed due to sleep disorders
OSA Insomnia RLS Total
No. $m No. $m No. $m $m
CVD 4,219 76.2 — — — — 76.2
Depression 5,405 97.6 2,625 47.4 280 5.1 150.1
MVA 72 18.8 — — — — 18.8
Workplace injury(a)
n/a 4.1 n/a 30.0 — — 34.1
Total 9,697 196.8 2,625 77.4 280 5.1 279.2
Note: (a) Social security payments to people not employed due to workplace accidents was based on Access
Economics (2004b).
Source: Deloitte Access Economics calculations.
Reduced earnings from lower employment participation results in reduced taxation
revenue collected by the Government. As well as forgone income (personal) taxation, there
is also a fall in indirect (consumption) tax, as those with lower incomes spend less on the
consumption of goods and services. Lost taxation revenue to the Government was
estimated by applying an average personal income tax rate and average indirect taxation
rate to lost earnings. Rates in 2009-10 were 19.2% and 11.7%, respectively (taken from
Deloitte Access Economics’ Macroeconomic Model). Total lost taxation due to productivity
reductions was $835 million in 2010 — $234 million due to lost indirect taxation on
consumption and $601 million due to lost taxation on income.
The costs associated with deadweight loss will depend on the method used to raise
additional taxation revenue. Studies that have evaluated the marginal welfare cost of
raising additional tax revenue (known as the marginal cost of public funds) mostly relate to
the US (Browning 1976, Stuart 1984, Ballard 1985, Browning et al 1987). Estimates have
ranged from zero marginal cost to well over 100%. This wide range has been due to
alternative models used (partial versus general equilibrium), alternative parameter
estimates, and assumptions on the adjustment of employment relative to changes in tax
rates (labour supply elasticities).
There are limited studies available that estimate the marginal welfare cost of raising
additional tax revenue in Australia. Following the Productivity Commission (2003), it was
assumed the marginal cost of raising additional tax revenue is 28.75 cents per dollar. This
cost includes 27.5 cents per dollar of taxation raised in lost efficiency plus 1.25 cents per
dollar of tax revenue raised for Australian Taxation Office (ATO) administration.
For comparison, Campbell and Bond (1997) estimated the marginal cost of funds per dollar
raised in Australia through personal income tax to be between 19 and 24 cents, using the
assumption that additional taxes are raised through income tax rate changes. This estimate
is similar to the estimate used by the Productivity Commission (2003).
There is little information on the cost of compliance in Australia. The Treasury (2008) cited
a cost of 0.9 cents per dollar raised based on the cost of ATO administration, although this
does not include the cost of administering transfers or compliance with tax laws, which may
have increased in complexity (Treasury 2008). Treasury (2008) suggests the average tax
administration cost for business and personal could be between 7 to 11.9 cents per dollar.

Reawakening Australia
74 Deloitte Access Economics
If this were the case then the estimate of administration costs presented in this study
would be conservative.
The deadweight loss is based on total public expenditure and lost tax revenue as a result of
lower productivity. Publically funded direct health system costs were estimated at
$521 million. This comprised the following.
• The public cost of hospitalisations directly due to sleep disorders was $65.1 million.
This cost was derived based on the assumption that the private cost component of the
total cost of hospitalisations was the difference in the cost of a public and private bed
day multiplied by the number of private bed days.
• The public cost of sleep studies was $50 million, based on public expenditure recorded
in Medicare (2011) for each MBS item.
• Consultations with medical practitioners were assumed to be 75% publically funded, in
accordance with the proportion of such fees that are reimbursable.
• For the health system costs of associated conditions, it was assumed that 69.7% were
public, which is the proportion of government expenditure on total health care costs
(AIHW 2010a).
The present value revenue required to fund social security payments was $279.2 million.
All of the costs of emergency services, street furniture damage and coronial inquests were
assumed to be public funded. The revenue required to meet these costs is $7.7 million.
The cost of imprisonment was included as a public cost ($0.5 million) while the remainder
of the cost of correctional services (productivity and leisure losses) were considered to be
private.
The total public cost of sleep disorders including the attributed share of other
illness and injuries was estimated to be $808 million in 2010. Estimated
deadweight loss based on a marginal cost of 28.75 cents per dollar is shown in
Table 4.15. The associated deadweight loss was calculated to be $232 million.
Lost taxation due to lower productivity was $835 million, causing a deadweight
loss of $240 million. In total the deadweight loss due to sleep disorders was
$472.4 million in 2010.
Table 4.15: Deadweight loss, 2010
Cost
$ (millions)
Direct health system costs 520.5
Social security payments 279.2
Emergency services 3.2
Street furniture damage cost 4.5
Coronial costs 0.1
Correctional services 0.5
Total public revenue 808.0
Total lost tax revenue from reduced productivity 835.0
Cost of raising revenue (28.75%) 472.4
Source: Deloitte Access Economics calculations.

Reawakening Australia
75 Deloitte Access Economics
4.6 Summary and sensitivity of indirect costs
The indirect cost associated with sleep disorders in Australia is summarised in Table 4.16.
In total these impacts sum to $4.3 billion in 2010. In the low and high
prevalence scenarios, the total costs are $2.9 billion and $5.1 billion. Lost
productivity costs $3.1 billion (74%) ranging from $2.1 billion to $3.7 billion
depending on the prevalence rate used to calculate the PAFs. Other costs of
motor vehicle accidents are 11% of indirect costs ($465 million) while the DWL
accounts for $472 million (11%). OSA accounts for 62% of the total cost ($2.6
billion) while insomnia contributed $1.5 billion (36%) and RLS $115 million
(3%).
Table 4.16: Summary of the costs of sleep disorders, 2010
Low Base case High
$m $m $m
Productivity 2,120 3,132 3,673
Informal care 76 129 166
Other costs of MVA 303 465 605
Other costs of workplace accidents 28 53 56
Deadweight loss 329 472 565
Total indirect financial 2,855 4,251 5,065
Source: Deloitte Access Economics estimates.

Reawakening Australia
76 Deloitte Access Economics
5 Burden of disease For those experiencing sleep disorders, less tangible costs such as the loss of quality of life,
loss of leisure and physical pain are often as or more important than the health system
costs or indirect costs of those disorders.
This chapter presents a quantitative analysis of the loss of wellbeing and premature death
both from sleep disorders and other health conditions attributable to them. A disability
adjusted life year (DALY) approach was taken to measuring the loss in the stock of health
capital as a result of sleep disorders.
5.1 Methodology
The ‘Burden of Disease’ methodology developed by the World Health Organization (WHO)
is a comprehensive measure of mortality and disability from diseases, injuries and risk
factors for populations around the world in 1990, projected to 2020 (Murray and Lopez
1996). It uses a non-financial approach, where pain, suffering and premature mortality are
measured in terms of Disability Adjusted Life Years (DALYs).
DALYs are a measurement unit that quantify the morbidity aspect and premature death
associated with various diseases and injuries (Murray and Acharya 1997). DALY weights are
measured on a scale of zero to one, where a zero represents a year of perfect health and a
one represents death. Other health states are given a weight between zero and one to
reflect the quality of life that is lost due to a particular condition. For example, a disability
weight of 0.2 is interpreted as a 20% loss in the quality of life relative to perfect health.
Disability weights are determined by a reference group convened at the WHO on the basis
of a person trade-off method for measuring health state preferences (Murray and Acharya
1997).
Under the DALY framework, the total burden of disease for an individual with a condition is
the sum of the mortality and morbidity components associated with that condition over
time, including the years of healthy life lost due to disability (YLDs), and the years of healthy
life lost due to premature death (YLLs). Incorporating time preference for health (and thus
discounting), this is represented by:
,
(1 )
a L
i t
i t a
t a
DwDALY
r
+
−
=
=
+∑
where Dw is the DALY weight of the condition experienced by individual i, L is the residual
life expectancy of the individual at age a, and t represents individual years within that life
expectancy.
The total burden of disease from a condition on society can be calculated by aggregating
DALYs of all individuals with the condition, which can be represented by:
Reawakening Australia
77 Deloitte Access Economics
,
0
tN
t i t
i
DALY DALY
=
=∑
where N is the prevalence of the condition at time t.
DALYs based on YLD were calculated for OSA, insomnia and RLS only, not the associated
conditions because disability weights should include the impact of all other conditions in
their estimation (on average). Although there is debate as to what a DALY (or EQ-5D health
utility score) does include there is a risk that including DALYs for each associated condition
could result in double counting. Since there were few deaths directly associated with sleep
disorders, YLLs were based only on the associated conditions.
5.2 Disability weights for sleep disorders
Two main sources were used to determine disability weights for particular health
conditions:
• Global Burden of Disease 2004 Update (WHO 2008); and
• Disability Weights for Diseases in the Netherlands (Stouthard et al 1997).
In relation to sleep disorders, primary insomnia was given a disability weight of 0.100 in the
Global Burden of Disease Study. However, disability weights were not provided for RLS or
OSA by either of the above studies.
OSA
Although disability weights were not provided for OSA, a number of articles in the literature
have estimated quality adjusted life years (QALYs) for OSA in order to estimate the cost
effectiveness of CPAP.
QALYs were developed to reflect the fact that health is a function of length and quality of
life by multiplying the value assigned to different health states by their duration. QALYs
value a year of perfect health as unity, a year of less than perfect health as less than unity
and death as zero. They provide a standard unit for measuring health gain across diseases
and population groups. Various approaches have been used to derive health utility scores
which can be used as preference (weights) quality levels for QALYs which are discussed
below. A notable difference between QALYs and DALYs is that QALYs are based on the
views of individuals in a particular sample who are assessing their own (or others) relative
utility from different health states whereas DALYs are generally based on the views of
health experts about the loss of quality of life resulting from a particular health state.
Measuring health utility scores involves a number of steps:
1. Health states need to be defined using an instrument such as the Short Form Health
Survey Questionnaire (SF-36) and the EuroQol EQ-5D (EQ-5D) which measures health
status across a number of domains.
2. The desirability of each of these health states needs to be assessed based on general
population or patient surveys.

Reawakening Australia
78 Deloitte Access Economics
3. An appropriate scaling method must be used to determine utilities from the data
collected in step two, such as the standard gamble or time tradeoff approach
discussed in the box below.
Under the standard gamble approach individuals are asked whether they
would prefer a certain to a probability (p) of being in full health (U=1) and a
probability (1-p) of immediate death (U=0). The probability where an
individual is indifferent between the gamble and that particular health state
indicates the utility of an individual in that particular health state (Jenkinson et
al 1998).
Under the time trade-off approach individuals are asked to consider the
relative amounts of time they would be willing to trade in order to survive in
various health states. The choice is often between continuing in a present
defined state of ill health and moving to a shorter but healthier life. The
duration of survival in the healthier state is varied until the subject indicates no
preference between the two alternatives (similar to the standard gamble).
For example, Jenkinson et al (1998) assessed individual’s well being with OSA using the EQ-
5D questionnaire covering mobility, self-care, usual activity, pain/discomfort and
anxiety/depression. Respondent’s responses to these five areas (no problems, some
problems, extreme problems) were used to map individuals to 243 different possible health
states (Jenkinson et al 1998). The utility values for each of these health states was then
determined based on a population survey of the UK population using the time-tradeoff
method (Dolan et al 1996). Jenkinson et al (1998) applied a similar approach to the SF-36
which is a 36 item questionnaire on functioning and well-being. Summary scores were
presented as a physical component summary (PCS) score and a mental component
summary (MCS) score where the general population mean for each of these measures is 50.
Table 5.1 shows a number of studies which have estimated health utility levels for those
with OSA. Studies which estimated utility based on the standard gamble approach varied
considerably, while studies using the EQ-5D questionnaire yielded health utility values
within a relatively tight range of 0.74 to 0.78. The one study using the SF-36 questionnaire
found that health utility averaged 79.8 out of 100 after adding the two indexes.
An advantage of using utility scores derived from the EQ-5D instrument is that EQ-5D utility
scores have been validated to the general population in a number of countries which
means that responses to the EQ-5D questionnaire can easily be converted to utility scores
to compare the impact of particular conditions.

Reawakening Australia
79 Deloitte Access Economics
Table 5.1: Studies of pre-treatment health utility scores for those with OSA
Study Sample Standard
Gamble
Time trade-
off using
the EQ-5D
SF-36 (PCS)
+ SF-36
(MCS)
Tousignant et al (1994) 19 Canadian adults with
severe OSA 0.63
Jenkinson et al (1998) 89 British men selected for
CPAP assessment 0.78
79.8(b)
(39.7 + 40.1)
Chakravorty et al (2002) 53 British adults with an
AHI≥15 0.32
(a) 0.75
(a)
Mar et al (2003) 46 Spanish sleep clinic
patients who were found
to have OSAS.
0.74
Note: (a) Figures presented are the average of all participants as baseline utilities differed slightly between
those receiving CPAP treatment and those receiving lifestyle treatment. (b) Each SF-36 index is scored out of 50.
A common method for converting EQ-5D health utility scores to disability weights is to
subtract the calculated EQ-5D health utility score for a particular condition from the
population norm EQ-5D health utility scores for a person of that age and sex (Haagsma et al
2009). Since both Jenkinson et al (1998) and Chakravorty et al (2002) used population
samples from the UK, the UK population norm EQ-5D utility scores are used as a
comparator. The average health utility score from the three studies that provide utility
scores based on the EQ-5D in Table 5.1 (weighted equally) was 0.755. As the mean EQ-5D
utility score for the UK population as a whole was 0.86 (Kind et al 1998),48 subtracting 0.755
from 0.86 results in a disability weight of 0.105 for OSA.
This disability weight is very similar to the disability weight of 0.100 for primary insomnia
used in the Global Burden of Disease study (WHO 2008). This is consistent with the fact
that health utility scores for those with severe insomnia are relatively similar to those for
OSA. Snedecor et al (2009) found that those with severe insomnia had a six month baseline
EQ-5D utility score of 0.40, where 0.5 represents perfect health. If the results of Snecedor
et al (2009) are scaled up to a situation where 1 indicates perfect health as for QALYs, this
result implies a baseline health QALY of 0.80.49 Another study by Botteman et al (2007),
which was based on the Mark II Health Utility Index rather than EQ-5D index, found that
patients with severe insomnia had a health utility level of 0.7603 compared to 0.8413 for
those without insomnia.50
Together these two studies suggest that health utility scores for those with severe insomnia
are around 0.76 to 0.80, which is similar (albeit slightly higher) than utility scores estimated
48
The mean utility score for those in the 45-54 years age group (which was where the mean age of study
participants was located in all three studies) was 0.85.
49 The results of Snedecor et al (2009) were based on responses to the SF-36 questionnaire which were then
transformed to EQ-5D utility levels based on the transformation methodology outlined in Franks et al (2004). 50
These results were based on responses to the SF-36 questionnaire in the survey conducted by Katz and
McHorney (2002), which the authors transformed into utility scores based on the methodology of Nichol et al
(2001). HUI-2 scores for the US general population are similar to that estimated by the EQ-5D. Luo et al (2005)
found that the US population mean for EQ-5D was 0.87 compared to 0.86 using the HUI-2 index.
Reawakening Australia
80 Deloitte Access Economics
for OSA. Thus using a disability weight of 0.105 for OSA would appear to be consistent with
the evidence in the literature on health utility scores for those with insomnia.
Restless legs syndrome
The quality of life experienced by those with RLS has also been examined in a number of
studies. The self assessed health status of those with RLS has been found to be significantly
lower than the general population (Cho et al 2009, Happe et al 2008), while a study by
Kushida et al (2007) found that RLS sufferers had an average combined SF-36 mental and
physical component summary score of 84.35 compared to the US population norm of
99.14.
A number of studies have also derived health utility scores for those with RLS based on the
EQ-5D survey (see Table 5.2). Happe et al (2008) found that the average EQ-5D health
utility score for those diagnosed with RLS was 0.75, while Lees et al (2008) show that EQ-5D
health utility scores are negatively associated with the severity of RLS symptoms. Those
with mild, moderate and severe RLS had average utility scores of 0.89, 0.67 and 0.40
respectively. However, Lees et al (2008) used a relatively small sample size from a UK
support group so their results should be viewed with some caution. The most recent large-
scale study examining EQ-5D health utility scores for those with RLS was completed by Allen
et al (2011). They found that RLS sufferers had a mean EQ-5D health utility score of 0.75
compared to 0.94 for healthy controls.
Table 5.2: Average EQ-5D health utility scores for those with RLS
Study Sample EQ-5D health utility score
Happe et al (2008) 519 German adults diagnosed with RLS by
sleep clinics
0.75
Lees et al (2008) 83 individuals from the Ekbom support group,
a group for individuals with RLS in the UK
0.89 (mild), 0.67 (moderate),
0.40 (severe)
Allen et al (2011) 251 US adults who suffer from primary RLS
including 131 RLS sufferers
0.75
Source: As specified in the table.
Since the definition of RLS sufferers in Allen et al (2011) (namely those who experience at
least two symptoms per week leading to moderate-severe distress) is identical to the one
used to determine the prevalence of RLS in this report, the EQ-5D health utility score
estimated in Allen et al (2011) of 0.75 (which was identical to that estimated by Happe et al
2008) was used to determine disability weights in this report. The population norm EQ-5D
health utility score for US adults was found to be 0.87 in a population survey conducted by
Luo et al (2005). Hence using the same approach as for OSA, the EQ-5D health utility score
for those with RLS (0.75) was subtracted from the general population norm (0.86), yielding
an estimated disability weight of 0.12.
5.3 Loss in the stock of health capital
DALYs for OSA, insomnia and RLS were calculated by multiplying the relevant disability
weights by the assumed prevalence of OSA, insomnia and RLS presented in Table 1.5. The
YLDs from OSA, insomnia and RLS are shown in Table 5.3. The figures in parentheses

Reawakening Australia
81 Deloitte Access Economics
represent sensitivity analysis. The low scenario was based on prevalence for insomnia of
1.5% and a prevalence of OSA of 4%. The high scenario was based on a prevalence of
insomnia of 3% and a prevalence of OSA of 6%.
Total YLDs from the three sleep disorders are shown in Table 5.3.
In the base case prevalence scenario the DALYs lost due to sleep disorders were 180,400.
OSA contributed 81,300 DALYs, insomnia 49,200 DALYs and RLS 23,900 DALYs. DALYs for
conditions associated with sleep disorders were 26,000. These were calculated using the
average disability weight implied by the total YLDs divided by the prevalence of each
disease in Mathers et al (1999). The disability weights for injuries due to motor vehicle
accidents followed Mathers et al (1999), while for workplace accidents the weighted
average disability weight by severity from Access Economics (2004b) was used. Disability
weights for the combined burden of having a sleep disorder and the associated condition
were estimated using a simple multiplicative model which constrained the total possible
disability weight to less than one.
Table 5.3: YLDs due to OSA, RLS and insomnia in 2010
Sleep
Disorder
Prevalence Disability
Weight
YLDs
Low Base case High Low Base case High
‘000 ‘000 ‘000 ‘000 ‘000 ‘000
OSA 664.4 774.6 996.6 0.105 69.8 81.3 104.6
Insomnia 246.2 492.3 492.3 0.1 24.6 49.2 49.2
RLS 199.3 199.3 199.3 0.12 23.9 23.9 23.9
Other
conditions(a)
104.3 150.8 187.4 17.7 26.0 32.6
Total 1,214.2 1,617.0 1,875.6 136.0 180.4 210.3
Note: (a) A multiplicative model was used to calculate the disability weight for each condition so that the total
disability weight could not add to more than one. The YLDs are net of the DALYs due directly to the sleep
disorder.
Source: Deloitte Access Economics calculations.
No YLLs were calculated directly for OSA, insomnia and RLS, since these conditions are
unlikely to contribute directly to premature mortality.51 The contribution of such disorders
to YLL is indirect as it occurs through the impact of sleep disorders on other health
conditions such as CVD and depression. The number of deaths attributed to sleep disorders
was 1,431 (see Section 4.1.2), of which 1,371 were attributed to condition caused by OSA,
48 to conditions caused by insomnia and 12 to conditions caused by RLS. Life expectancy
was based on the average years of life remaining for each age and gender group (ABS
2010c; BITRE 2009, Safe Work 2010). Applying a discount rate of 3%, the total YLL was
estimated to be 9,623 DALYs in 2010. The high and low prevalence rates gave YLL of 12,422
and 6,245 respectively.
Total DALYs lost as a consequence of sleep disorders was estimated to be
190,000 with a range of 142,000 to 223,000 in 2010.
51
In 2009, there were 19 deaths with the primary cause recorded as a sleep disorder (ABS 2011e). Together
these people cost 157 years of life, suggesting that they were on average over the age of 70.

Reawakening Australia
82 Deloitte Access Economics
The DALY approach is not financial. A monetary conversion involves applying a value of a
statistical life year (VSLY) in perfect health to the total number of DALYs estimated for a
particular condition.
Typically, a VSLY is derived from estimates of a willingness to pay for a reduction in the risk
of physical harm in the context of OHS policy, transport and airspace regulation and
environmental policy. The VSLY essentially estimates how much society is willing to pay to
reduce the risk of premature death, expressed in terms of a saving a statistical life year. In
this report, a VSLY of $165,000 for 2010 was used based on Department of Finance and
Deregulation (DoFD) estimates (OBPR 2008).52
The cost of the burden of disease due to OSA, insomnia and RLS consists of the burden
associated with YLDs, and the value society places on a year of perfect health.
Using the estimated VSLY, the total cost was estimated to be $31.4 billion
($23.5 billion – $36.8 billion). This is not a direct cost to the economy in the
traditional sense (i.e. a loss in productivity). It is the value of a loss in the stock
of health capital.
52
As the recommended DoFD figure ($151,000) is expressed in 2007 prices, the VSLY was inflated to 2010 prices
using an average inflation rate of 3% (ABS 2011d).

Reawakening Australia
83 Deloitte Access Economics
6 Cost effectiveness of CPAP The cost effectiveness of CPAP versus no treatment was evaluated for the average
Australian with OSA using a cost utility analysis. The cost effectiveness was measured using
an incremental cost effectiveness ratio (ICER) expressed as cost per DALY averted by the
intervention (CPAP) and compared with World Health Organisation (WHO) benchmarks.
The WHO has recommended cost effectiveness benchmarks based on the advice of the
Commission on Macroeconomics and Health. The following three categories of cost-
effectiveness were specified (WHO 2011):
• highly cost-effective: less than gross domestic product per capita — in Australia this
is less than (approximately) $60,000/DALY averted;
• cost-effective: between one and three times gross domestic product per capita — in
Australia this is (approximately) between $60,000 and $180,000/DALY averted; and
• not cost-effective: more than three times gross domestic product per capita — in
Australia over (approximately) $180,000/DALY averted.
The ICER was estimated from two perspectives.
• Health care perspective – including direct health system costs of the intervention
and associated treatment only.
• Societal perspective – including other financial costs such as productivity losses,
informal care costs and deadweight losses.
6.1 Description of CPAP
CPAP is the most common form of treatment for people with OSA.53 It is delivered using a
CPAP device, which consists of a mask worn over the nose - or nose and mouth - while
sleeping, connected by a tube to a small electric pump that provides a flow of positively
pressurised air (Figure 6.1). The air acts as a ‘splint’ holding the upper airway open thereby
preventing the occurrence of the apnoea (McDaid et al 2009).
53
This includes OSAS and obstructive sleep apnoea-hypopnoea syndrome, which includes people with full
(apnoea) and partial (hypopnoea) obstruction of the airway.

Reawakening Australia
84 Deloitte Access Economics
Figure 6.1: CPAP therapy
Source: Essig (2009) and Hook (2006).
There are different types of CPAP devices, many of which have been developed to improve
comfort and compliance. Varying features include (but are not limited to):
• air pressure: can be fixed or auto-titrating — where it continually adjusts air pressure
during the night rather than requiring manual adjustment;
• mask — can be nasal (covering only the nose) or a ‘full face mask’ covering both the
mouth and nose; and
• a humidifier can be included to reduce drying in the mouth and airway (Basner 2008).
CPAP is usually recommended following the diagnosis of OSA. A laboratory based
polysomnography is currently the main diagnostic tool for sleep-disordered breathing
(Merlin et al 2010). CPAP therapy is a method of managing OSA and not a cure, therefore
the treatment process is long term. NHMRC (2000) specified the following treatment
protocol for a five year period based on expert advice from clinicians:
• two overnight sleep studies (one at start of CPAP treatment, one routine follow-up at
18 months);
• first follow-up consultation with a physician;
• five annual follow-up consultations;
• minor attendances by physicians;
• minor attendances by technicians;
• initial rental of appliances for three months;
• purchase of a CPAP machine (standard model); and
• minor apparatus replacement (e.g. the filters require regular replacement and over
time the mask and tube may need replacement).
While this treatment protocol is no longer contemporary, and may overestimate resources
required for management of some cases, it has been used in the measurements of cost
effectiveness in this study, together with updated advice from clinicians.
The life of a CPAP device is typically assumed to be five to seven years for the purpose of
calculating the cost of treatment (NHMRC 2000, Ayas et al 2003, Mar et al 2003, McDaid et
al 2009, Tousignant et al 1998). It is conservatively assumed in this report that a CPAP
device would last for five years.
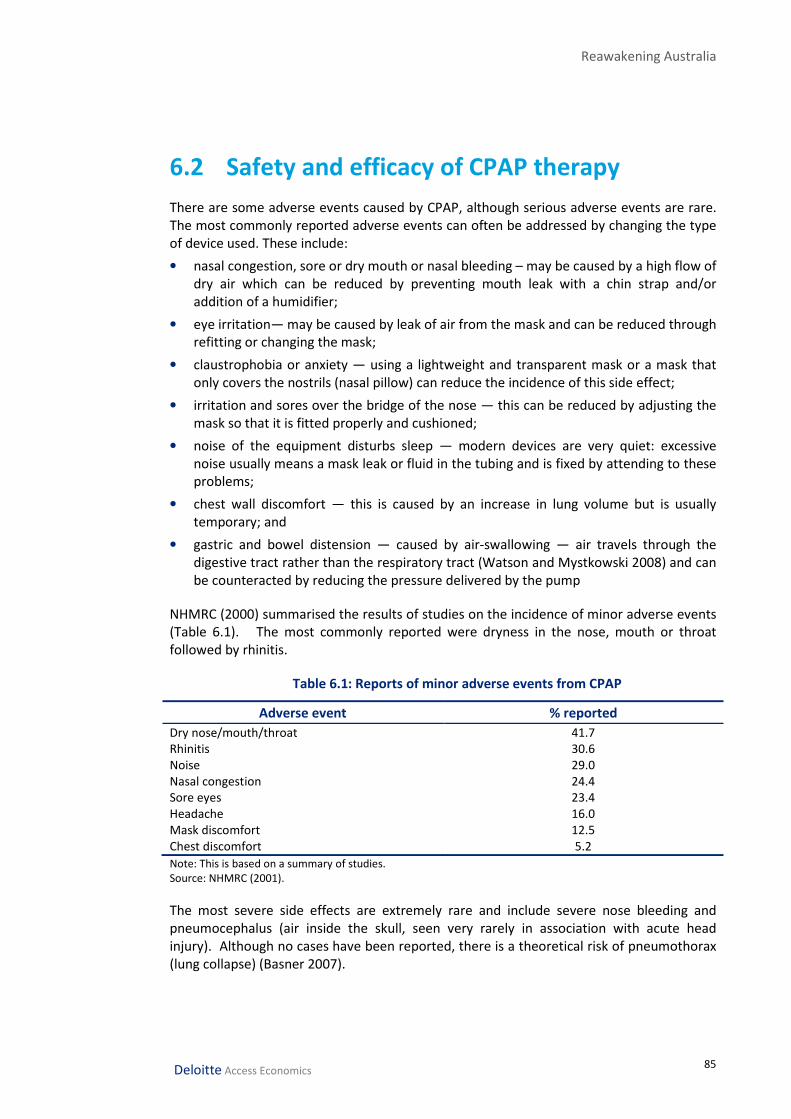
Reawakening Australia
85 Deloitte Access Economics
6.2 Safety and efficacy of CPAP therapy
There are some adverse events caused by CPAP, although serious adverse events are rare.
The most commonly reported adverse events can often be addressed by changing the type
of device used. These include:
• nasal congestion, sore or dry mouth or nasal bleeding – may be caused by a high flow of
dry air which can be reduced by preventing mouth leak with a chin strap and/or
addition of a humidifier;
• eye irritation— may be caused by leak of air from the mask and can be reduced through
refitting or changing the mask;
• claustrophobia or anxiety — using a lightweight and transparent mask or a mask that
only covers the nostrils (nasal pillow) can reduce the incidence of this side effect;
• irritation and sores over the bridge of the nose — this can be reduced by adjusting the
mask so that it is fitted properly and cushioned;
• noise of the equipment disturbs sleep — modern devices are very quiet: excessive
noise usually means a mask leak or fluid in the tubing and is fixed by attending to these
problems;
• chest wall discomfort — this is caused by an increase in lung volume but is usually
temporary; and
• gastric and bowel distension — caused by air-swallowing — air travels through the
digestive tract rather than the respiratory tract (Watson and Mystkowski 2008) and can
be counteracted by reducing the pressure delivered by the pump
NHMRC (2000) summarised the results of studies on the incidence of minor adverse events
(Table 6.1). The most commonly reported were dryness in the nose, mouth or throat
followed by rhinitis.
Table 6.1: Reports of minor adverse events from CPAP
Adverse event % reported
Dry nose/mouth/throat 41.7 Rhinitis 30.6
Noise 29.0
Nasal congestion 24.4
Sore eyes 23.4
Headache 16.0
Mask discomfort 12.5
Chest discomfort 5.2
Note: This is based on a summary of studies.
Source: NHMRC (2001).
The most severe side effects are extremely rare and include severe nose bleeding and
pneumocephalus (air inside the skull, seen very rarely in association with acute head
injury). Although no cases have been reported, there is a theoretical risk of pneumothorax
(lung collapse) (Basner 2007).

Reawakening Australia
86 Deloitte Access Economics
6.2.2 Efficacy
CPAP has been shown to be efficacious in reducing various metrics used to identify OSA in
people of all ages. The typical outcomes used to assess efficacy are a reduction in the
apnoea-hypopnoea index (AHI) and Epworth sleepiness scale (ESS).
A cost utility analysis (CUA) requires information linking the intervention (CPAP) to
improved outcomes — in this case both in terms of OSA and the associated conditions —
and improved utility. In this section the efficacy data for each are reviewed.
6.2.3 Symptoms of OSA
CPAP has been shown to be efficacious at reducing measures of OSAS, including day time
sleepiness as measured by the ESS, maintenance of wakefulness test (MWT) and
physiological and polysomnographic parameters such as the AHI.
Lasserson et al (2006) undertook a Cochrane review of CPAP for the treatment of OSA in
adults. In parallel and partial crossover studies they found that there were statistically
significant differences in ESS (-3.83 units) for CPAP when compared with sham CPAP,
placebo tables or conservative management (lifestyle changes). Similarly, in crossover
studies they found a statistically significant difference in ESS (-1.92 units) and MWT (2.36
minutes). No significant difference in the multiple sleep latency test (MSLT) was found.
CPAP was also found to have a statistically significant effect on AHI based on a meta-
analysis of seven studies. The results using fixed-effects were a reduction in AHI of 17.02
events per hour for parallel studies (Lasserson et al 2006).
McDaid et al (2009) also conducted a comprehensive review of the efficacy of CPAP. The
primary outcomes examined were the ESS, MSLT and MWT. Twenty-three clinical trials
were identified for inclusion that had ESS as an outcome. When the results were pooled
there were 1,334 participants, and a statistically significant difference in ESS (-2.7 units) was
found between CPAP and either placebo or usual care. However, there was a large degree
of heterogeneity. A sub-group analysis based on ESS severity found improvement in ESS
symptoms was greatest in people with the most severe symptoms. A meta-analysis was
conducted on five studies that had MWT as an outcome. A statistically significant
difference was found between CPAP and placebo or usual care (3.3 minutes).
Heterogeneity was low among these studies. Data from seven trials was used to examine
the impact of CPAP versus placebo or usual care on MSLT. No statistically significant result
was found. A meta-analysis of nine studies reporting AHI as an outcome revealed a
statistically significant reduction in AHI. However, McDaid et al (2009) viewed these results
as meaningless due to the large degree of statistical heterogeneity. Individually all of the
studies reported a statistically significant reduction in AHI, ranging from -9.2 to -60.0.
6.2.4 Depression
Evidence that CPAP reduces depression among people with OSA is mixed. McDaid et al
(2009) concluded from their meta-analysis of five studies reporting on the hospital anxiety
depression scale (HADS) that there was no statistically significant difference between CPAP
and placebo for depression. Heterogeneity between the studies was moderate. There was
only one study that reported the profile of mood scale (POMS), finding a statistically

Reawakening Australia
87 Deloitte Access Economics
significant improvement. Lasserson et al (2006) found a statistically significant
improvement in HADS.
Saunamäki and Jehkonen (2007) reviewed 27 studies that compared CPAP with a placebo
or conservative treatment and included measures of mood as an outcome. Results on the
effectiveness of CPAP in reducing depression were inconclusive. A possible reason for this
was that the knowledge of requiring lifetime treatment for a chronic condition using CPAP
could counteract some or all of the benefit of reducing depression caused by the symptoms
of OSA (Saunamäki and Jehkonen 2007).
6.2.5 Reducing accident risk
CPAP has been shown to reduce the risk of MVA in people with OSA. For work-related
injuries there has been less research directly comparing CPAP use and reduced risk of
incidents. However, it is reasonable to interpret that, since CPAP is effective in treating
OSA and a proportion of workplace incidents are attributable to OSA, that CPAP use should
reduce workplace incidents in accord with the attributable proportion effectively treated.
Ayas et al (2003) performed a meta-analysis using random-effects on the inverse variance
of the logarithm of the odds ratio published in eight studies. They estimated that the odds
ratio of a person treated with CPAP versus a person not treated with CPAP was 0.15.
McDaid et al (2009) supplemented this analysis with a study by Barbé et al (2001) and
estimated an odds ratio of 0.17.
McDaid et al (2009) also reviewed the efficacy of CPAP in improving skills in a simulated
driving test. They found there was no statistically significant difference in the number or
percentage of obstacles hit.
Kreiger et al (1997) conducted a prospective study on people with OSA using CPAP. The
baseline questionnaire included questions concerning accidents in the previous 12 months,
asking whether patients had had an accident and, if so, whether they felt that the
accident(s) were related to sleepiness, and whether the patients felt that they had had
near-miss accidents due to sleepiness. They showed a substantial reduction in the number
of workplace accidents and MVA, although it was difficult to compare this with the general
population because there were demographic differences.
George (2001) examined the impact of CPAP treatment on the risk of motor vehicle
accidents using a sample of 420 people. Those with untreated OSA had 0.18 motor vehicle
crashes per year compared with 0.06 crashes per year in the three year period after CPAP
therapy started. This rate was in line with the control group.
6.2.6 Cardiovascular diseases
The impact of CPAP on the risk of CVDs is largely unknown. Although CPAP has been shown
to reduce blood pressure (McDaid et al 2009, Lasserson et al 2006) in the short term, there
is limited research examining the impact of treatment on the incidence of a CVD event.
Peker et al (2006) undertook a prospective study over seven years on men with an average
age of 50 years, without CVD at the baseline. They found that people with OSA at the
baseline who had not received any treatment (treatments included CPAP, dental devices or

Reawakening Australia
88 Deloitte Access Economics
surgery) or who had not received ‘efficient treatment’ (for CPAP this was defined as using
CPAP during 50% of sleep hours) had an increased odds ratio for developing coronary artery
disease or experiencing a myocardial infarction. The odds ratio for untreated OSA was 5.4
while for those using CPAP it was 1.7, which was not statistically significant. This study had
a small sample, only 15 people with OSA received effective treatment and less than half of
these used CPAP. The treatment population was younger than the untreated population
(average 46.6 years).
Doherty et al (2005) offered CPAP to patients who had been diagnosed with OSAS within
the previous three months. They did not find a statistically significant difference in the
incidence of hypertension, ischaemic heart disease and other cardiovascular disorders
during follow-up. However, they found a higher rate of mortality in untreated patients.
Marin et al (2005) also conducted a study where patients were offered CPAP. The study
covered men at an average age of 50 years whose OSA symptoms ranged in severity and
men without OSA. They found that long-term cardiovascular morbidity and mortality
increased only in patients with untreated severe OSAS, and not in the general population or
those complying with treatment.
6.2.7 Quality of life
There is limited conclusive evidence examining the impact of CPAP on quality of life.
McDaid et al (2009) identified six studies reporting SF-36 scales. The impact was not
statistically significant, although there was moderate to high heterogeneity in the pooled
estimates. In two of the individual studies there was an improvement in quality of life from
using CPAP that was statistically significant. One study was identified in McDaid et al (2009)
that measured EuroQol, although there was no difference between CPAP and conservative
treatment.
Lasserson et al (2006) found a statistically significant improvement to general health status
and physical function from using CPAP in a meta-analysis of three parallel studies that
measured SF-36. For other measures included in SF-36 there was too much heterogeneity
to form an estimate. CPAP was also found to improve social outcomes, activity level and
vigilance in a meta-analysis of three crossover studies.
6.2.8 Compliance
A problem with CPAP treatment undertaken outside supervised clinical settings is non-
compliance. Compliance is usually defined in clinical settings as using CPAP for more than
four hours a night for 70% of nights (Wells et al 2007). The reason for non-compliance is
most often the experience of an adverse event or inconvenience — either socially or in
terms of requiring professional assistance in adjusting the machine (Ballard 2008). Most
clinical studies are conducted over short period (several weeks or months) and therefore
little is known about long term compliance with CPAP.
The most commonly used compliance rate in CUA is from McArdle et al (1999), who
reported compliance for a sample of Scottish men. They observed a compliance rate of
84% one year after treatment began. At years two and three, compliance was 74% and
73% respectively, based on a survival curve analysis. By four years, compliance had fallen
to 68% and then remained steady for the remaining two years of the study.

Reawakening Australia
89 Deloitte Access Economics
Sucena (2006) studied compliance among a sample of people in Belgium with OSA who
began CPAP between 1991 and 1998 and were still using it at the end of 2003. They found
that 60% of people were compliant for more than five years. Ballard (2008) reported the
results of Kribbs et al (1993) citing compliance rates of 46% among people treated with
OSA.
6.3 Review of previous CUAs for CPAP
Previous cost utility analyses have found CPAP to be a cost-effective treatment for OSA
(and OSAS/OSAHS). Table 6.2 summarises the most comprehensive CUAs that were
identified in the literature by McDaid et al (2009). This section reviews these CUAs and
others identified by McDaid et al (2009) and NHMRC (2000).
McDaid et al (2009) compared CPAP versus dental devices and conservative management
(lifestyle changes) for a male aged 50 years.54 A lifetime Markov state transition cohort
model was designed that included coronary artery disease, MVA and stroke. Three clinical
endpoints were used to link utility with outcomes: ESS, blood pressure and MVA risk.
Utility values were linked with efficacy that was measured using ESS though a regression
analysis of four studies (Tousignant et al 1994, Jenkinson et al 1997, Chakravorty et al 2002,
Mar et al 2003). Coronary heart disease and stroke were based on results found by Sullivan
and Ghushchyan (2006) and for MVA from Currie et al (2005). The efficacy of CPAP versus
conservative treatment was assumed to be –2.7 ESS points in the baseline.
Compliance with CPAP was based on McArdle et al (1999). McDaid et al (2009) assumed
that discontinuation of treatment resulted in ESS returning to pre-treatment levels. The
incremental cost-effectiveness of CPAP compared with conservative treatment was
estimated to be £3,899/QALY (for the financial year 2005).
Ayas et al (2006) conducted a two arm CUA of CPAP versus no treatment. A Markov model
with a five year time horizon was used for patients aged 25-54 years newly diagnosed with
OSAHS (AHI>15). The impact of CPAP on utility was based on the results of Chakravorty et
al (2002), which is a retrospective study. After adjusting for differences in population, CPAP
increased utility by 0.23 compared with no treatment. The effectiveness of CPAP on
reducing the risk of MVA and improving utility was based on a random effects meta-
analysis of eight observational studies. The types of studies included could be subject to
reporting bias because they may have been referred to the analysis following a MVA
(McDaid et al 2009). Compliance with CPAP was assumed to be 70% based on the average
over five years from McArdle et al (1999). Ayas et al (2006) estimated an incremental cost-
effectiveness ratio of $US 3,354 (3rd party payer) and $US 314 (societal) per QALY gained (in
2003 prices).
Mar et al (2003) undertook a CUA of CPAP versus no treatment. A semi-Markov model was
developed for a five year time horizon. The base case was a male aged 50 with moderate-
severe OSAHS (AHI ≥30 and ESS>10). The model included coronary artery disease, stroke
and MVA. The effectiveness of CPAP on utility for people with OSAHS was based on a
survey of 51 patients in Spain before and after a three month treatment period. Data on
54
NICE guidelines indicated that CPAP should treated as a single intervention, although there are different types
of devices (McDaid et al 2009).

Reawakening Australia
90 Deloitte Access Economics
the relationship between CPAP and blood pressure was used to infer a reduction in stroke
and coronary artery disease based on MacMahon et al (1990). It was not clear how
compliance was treated. The cost analysis was based on the health care system
perspective. In the base case the ICER was €7,861/QALY over a five year horizon and
€4,938/QALY over a lifetime horizon (in 2000 prices).
Resmed (2007) compared CPAP with no treatment for people with moderate-severe OSAHS
using a Markov model over a 14 year horizon. The model included stroke, CVD events (such
as myocardial infarction) and MVA. The efficacy of CPAP in improving utility was based on
Mar et al (2003). Compliance with CPAP was assumed to stablise after one year at 79%.
The efficacy of CPAP in reducing CVD was based on Marin et al (2005). From the health
payer perspective the cost of no treatment per QALY gained was £10,645, for CPAP (fixed)
£9,086 and £8,622 for auto-titrating CPAP (in 2005 prices).
Shortcomings in the above studies include a lack of efficacy data linking CPAP to improved
quality of life and reduced incidence of MVA and CVD events. Other analyses that were
identified by NMHRC (2000) and McDaid et al (2009) are summarised below. These studies
were less comprehensive than those mentioned above.
Chilcott et al (2007) compared CPAP with no treatment in people with OSAS. The study was
based on literature review and clinical opinion. Utility gains were estimated using data
collected in a cohort study of people referred to a sleep clinic who were asked to complete
an SF-36 questionnaire before and after treatment over a two week period. An attempt was
made to adjust for the non-randomness of the study. The ICER at five years was found to
be £3,200/QALY (the year prices refer to was not reported).
Tousignant et al (1998) compared CPAP with no treatment using a sample of 19 people with
moderate to severe OSAHS in Canada. They collected data on utility using a standard
gamble approach retrospectively and found that utility after treatment was 0.24 higher
than for pre-treatment. The cost-effectiveness was estimated from the health system
perspective to be between $CAN 3,397 and $CAN 18,637 (the year prices refer to was not
reported).
Tan et al (2008) constructed a Markov model with a five year time horizon to estimate the
cost-effectiveness of CPAP compared with no CPAP for people with moderate-severe OSA
who are drivers. Data on MVA rates for people with and without CPAP were based on a
literature search. They found that the ICER from the third-party payer perspective was
$CAN 3,626 and from the societal perspective was $CAN 2,979 per QALY gained (in 2005
prices).
NHMRC (2000) also reported on a study by Wessex Institute of Public Health Medicine
(1994), finding a gain of 0.09 QALYS over 10 years at a cost of between £1,926 and £2,176
(1983-84 prices).

Reawakening Australia
91
Table 6.2: Summary of CUA of CPAP versus conventional or no treatment
McDaid et al (2009) Ayas et al (2006) ResMed (2007) Mar et al (2003)
Study design/model Markov state transition cohort
model
Markov model Cohort based Markov model
using effectiveness estimates
from a before and after study
Semi-Markov model
Country UK US UK Spain
Year Financial year 2005 2003 2005 2000
Scope 50 year old male with OSAS
(sensitivity analysis around
gender, age and severity)
Newly diagnosed with moderate
to severe OSA (AHI>15)
Severe OSAH (AHI>30 and
ESS ≥12)
50 year old male with severe
OSAS (AHI ≥ 30 per hour and an
ESS > 10)
Age group in data n/a Age groups 25-34, 35-44 and 45-
54 for males and females
55 year old male n/a
Time horizon Lifetime 5 years 14 years 5 years and lifetime
Perspective National Health Service and
Personal Social Services
Societal and 3rd
party payer Health payer Health care
Costs of other
conditions included
Coronary artery disease, MVA,
stroke
MVA Stroke, myocardial infarction,
MVA
Stroke, MVA
Cost-effectiveness ICER £3,899 (2005-06) per QALY
gained.
Incremental cost-effectiveness
ratios of $3,354 (3rd
party payer)
and $314 (societal) per QALY
gained
Cost was £10,645 for no
treatment, £9,086 for CPAP
(fixed) and £8,622 for CPAP
(auto).
ICER €7,861 per QALY over a 5-
year time horizon and €4,938
per QALY for the lifetime
horizon.
Source: McDaid et al (2009)

Re-awakening Australia
92 Deloitte Access Economics
6.4 CUA of CPAP
The cost effectiveness of CPAP versus no treatment was evaluated using the ICER. The ICER
is the incremental cost of the intervention (CPAP) per incremental unit of health benefit
gained relative to an appropriate comparator (no treatment) in this case. Health benefits
were measured using DALYs averted. Costs were measured from two perspectives – that of
the health care system and that of society.
The ICER was calculated for the average person with OSA in Australia in 2010 compared
with the average person with OSA receiving no treatment. The cost of CPAP therapy was
based on the five year treatment path outlined in NHMRC (2000), shown in Section 6.1.
The cost was updated to 2010 using updated information from Medicare Australia and
industry consultation. The updated cost information is shown in Table 6.3.
The unit cost of an overnight sleep study was based on the MBS schedule price for items
12203 and 12250, weighted by the number of claims against the item in 2010 (Table 3.2).
The cost of the first follow up consultation and the cost of the annual follow up
consultations were also based on MBS items. The unit cost was based on a weighted
average of the cost of a long consultation with a sleep physician and a level C professional
attendance by a GP (at consulting rooms). These costs are detailed in (Table 3.3). The
annual follow-up consultations were based on a weighted average of the cost of level B
professional attendance by a GP (at consulting rooms) and a follow-up consultation with a
sleep physician. The cost of each visit was $60.10. The cost of a minor attendance by a
physician was based on a level B professional attendance by a GP (at consulting rooms).
A minor attendance by a technician was based on the cost used in NHMRC (2000) inflated
to 2010 dollars. The cost was for the wages of the technician, so the inflator was growth in
the wage price index from 1998 to 2010 (Reserve Bank of Australia 2011b).
The cost of a CPAP device was based on information obtained from manufacturers (see
Section 3.1.3). Since data were derived from the size of the market in 2010, which includes
purchase of new devices, replacement devices, spare parts and accessories, this cost was
assumed to be the annual cost in 2010.
The total cost over five years was determined by multiplying the unit cost of each
treatment item by the number of times it would be required. For example, the cost of each
sleep study is $499.80. Over five years the average person would require two sleep studies.
The total cost is therefore $999.60. This was converted to an expected annual cost by
multiplying the probability of accessing the service in any one year by the total five year
cost. For example, in any year the average person has a two in five chance of having a sleep
study. Therefore the expected annual cost of a sleep study for CPAP therapy is $199.90.
This calculation was based on the assumption that the ratio of new people undertaking
CPAP and people continuing with treatment is the same for each year. The total cost of
treatment using CPAP therapy in 2010 was estimated to be $1,924 per person.
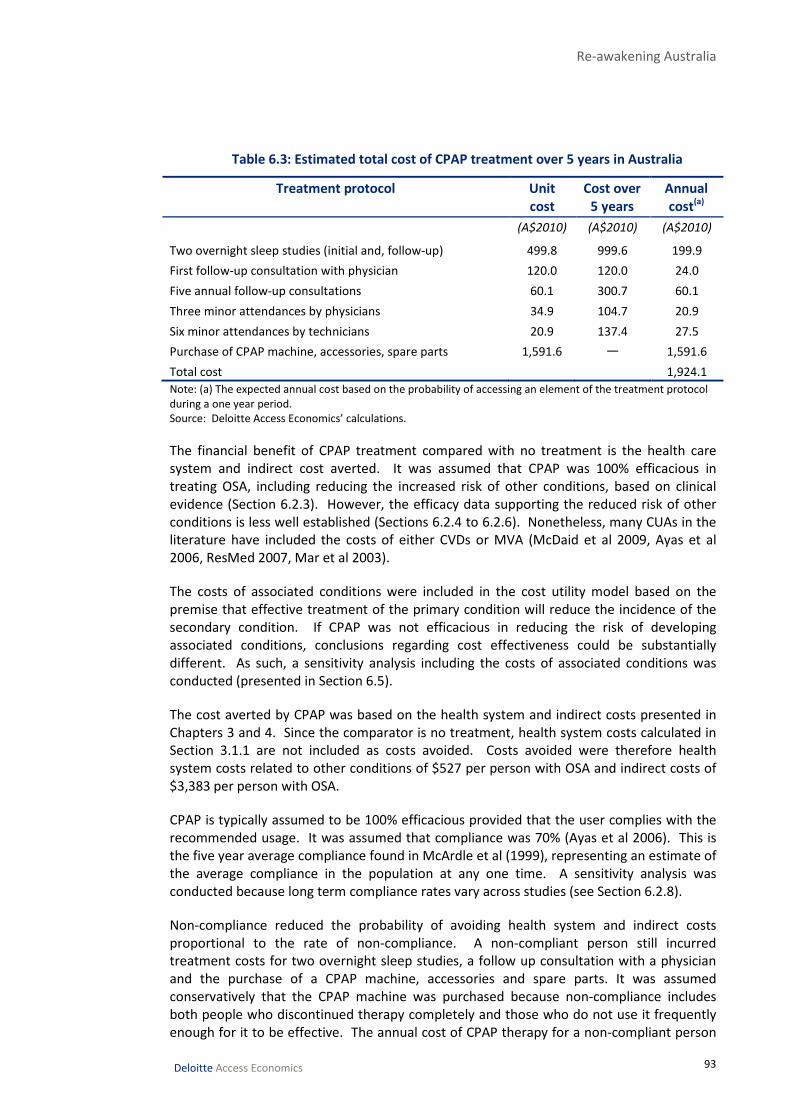
Re-awakening Australia
93 Deloitte Access Economics
Table 6.3: Estimated total cost of CPAP treatment over 5 years in Australia
Treatment protocol Unit
cost
Cost over
5 years
Annual
cost(a)
(A$2010) (A$2010)
(A$2010)
Two overnight sleep studies (initial and, follow-up) 499.8 999.6 199.9
First follow-up consultation with physician 120.0 120.0 24.0
Five annual follow-up consultations 60.1 300.7 60.1
Three minor attendances by physicians 34.9 104.7 20.9
Six minor attendances by technicians 20.9 137.4 27.5
Purchase of CPAP machine, accessories, spare parts 1,591.6 — 1,591.6
Total cost 1,924.1
Note: (a) The expected annual cost based on the probability of accessing an element of the treatment protocol
during a one year period.
Source: Deloitte Access Economics’ calculations.
The financial benefit of CPAP treatment compared with no treatment is the health care
system and indirect cost averted. It was assumed that CPAP was 100% efficacious in
treating OSA, including reducing the increased risk of other conditions, based on clinical
evidence (Section 6.2.3). However, the efficacy data supporting the reduced risk of other
conditions is less well established (Sections 6.2.4 to 6.2.6). Nonetheless, many CUAs in the
literature have included the costs of either CVDs or MVA (McDaid et al 2009, Ayas et al
2006, ResMed 2007, Mar et al 2003).
The costs of associated conditions were included in the cost utility model based on the
premise that effective treatment of the primary condition will reduce the incidence of the
secondary condition. If CPAP was not efficacious in reducing the risk of developing
associated conditions, conclusions regarding cost effectiveness could be substantially
different. As such, a sensitivity analysis including the costs of associated conditions was
conducted (presented in Section 6.5).
The cost averted by CPAP was based on the health system and indirect costs presented in
Chapters 3 and 4. Since the comparator is no treatment, health system costs calculated in
Section 3.1.1 are not included as costs avoided. Costs avoided were therefore health
system costs related to other conditions of $527 per person with OSA and indirect costs of
$3,383 per person with OSA.
CPAP is typically assumed to be 100% efficacious provided that the user complies with the
recommended usage. It was assumed that compliance was 70% (Ayas et al 2006). This is
the five year average compliance found in McArdle et al (1999), representing an estimate of
the average compliance in the population at any one time. A sensitivity analysis was
conducted because long term compliance rates vary across studies (see Section 6.2.8).
Non-compliance reduced the probability of avoiding health system and indirect costs
proportional to the rate of non-compliance. A non-compliant person still incurred
treatment costs for two overnight sleep studies, a follow up consultation with a physician
and the purchase of a CPAP machine, accessories and spare parts. It was assumed
conservatively that the CPAP machine was purchased because non-compliance includes
both people who discontinued therapy completely and those who do not use it frequently
enough for it to be effective. The annual cost of CPAP therapy for a non-compliant person

Re-awakening Australia
94 Deloitte Access Economics
was $1,816. The weighted average cost for a compliant and non-compliant person was
$1,892.
Net DALYs averted by using CPAP was based on the calculations presented in Chapter 5.
Since it was assumed that CPAP was 100% efficacious at treating OSA it was also assumed
that all DALYs would be averted through the use of CPAP. In total it was estimated that
there were 109,000 DALYs lost as a consequence of OSA (Table 5.3). The number of DALYs
averted per person from CPAP therapy was therefore 0.14. However, since only 70% of
people comply with treatment, only 70% of DALYs would actually be averted from
treatment, making the net DALYs averted 0.098.
The results of the CUA are shown in Table 6.4.
The net cost of CPAP therapy from the health system perspective was $1,522
dollars per person. From the perspective of society (including indirect costs
avoided) the net cost was a savings of $857 per person. Net DALYs averted by
using CPAP were 0.098. The resulting ICER from the heath system perspective
was $15,523 per DALY averted and from the perspective of society, -$8,736 per
DALY averted. Based on the WHO benchmarks described above, CPAP would
be considered a highly cost effective intervention for OSA from a health system
perspective, and ‘dominant’ from a societal perspective (i.e. saving money and
healthy life).
Table 6.4: Cost utility analysis
Health system
perspective
Societal
perspective
Costs $ per person $ per person
CPAP treatment 1,924 1,924
CPAP treatment if non- compliant 1,816 1,816
Expected cost of CPAP treatment (based on 70% compliance) 1,892 1,892
Benefits
Health system costs avoided
Coronary heart disease 101 101
Stroke 45 45
Other CVD 167 167
Depression and anxiety 135 135
Injuries from motor vehicle accidents 66 66
Work -related injuries 12 12
Total health system costs avoided 527 527
Indirect costs avoided
Productivity 2,240
Informal care 128
Other cost of MVA and workplace accidents 608
DWL 423
Total indirect costs avoided 3,399
Total costs avoided (included 70% probability of compliance) 369 2,748

Re-awakening Australia
95 Deloitte Access Economics
Net cost of CPAP treatment 1,522 -857
Net DALYs averted (included 70% probability of compliance) 0.098 0.098
ICER 15,523 -8,736
Source: Deloitte Access Economics’ calculations.
6.5 Sensitivity analysis
The results reported in Section 6.4 are point estimates with uncertainty surrounding some
parameter estimates. As such, the accuracy of the estimates cannot be determined from
these results alone. In order to incorporate the uncertainty of inputs into the model, a
sensitivity analysis was undertaken.
The sensitivity analysis investigated how the ICER changed with different assumptions
regarding inputs into the model. The inputs that were allowed to vary within the sensitivity
analysis were:
• the PAF, which determines the share of the cost of each associated injury and illness
that is attributed to OSA;
• the cost of a CPAP device;
• DALYs per person; and
• the rate of compliance with CPAP therapy.
Each input was allowed to vary according to a Pert distribution. For each distribution the
base case was used as the mean estimate. The high and low estimates for each PAF were
used as the upper and lower bounds. The rate of compliance, cost of a CPAP device and
DALYs per person were varied around the base cases by plus and minus 10%.
The sensitivity analysis was undertaken using a Monte Carlo simulation55, which
simultaneously drew a random number for each input according to its distribution and
recalculated the ICER. Random draws were made 10,000 times, providing 10,000 different
estimates of each output from which output distributions were constructed.
Table 6.5 shows the distribution, the minimum, mean, and maximum values, and the 90%
confidence intervals for each simulated input. The confidence interval can be interpreted as
a 90% chance that the interval contains the true value of the output. The inputs all appear
to reflect the assumed distribution indicating that the simulation was of sufficient length.
The ICER from a health care system perspective ranges from $12,112 to
$19,750 with the mean of $15,581 per DALY averted. The ICER from a societal
perspective ranges from -$13,801 to -$3,574 per DALY averted, with a mean of
-$8,602 per DALYs averted. The conclusion that CPAP is a highly cost effective
treatment for OSA is thus robust to variation in key inputs.
55
Monte Carlo simulation is a well known technique used to determine the sensitivity of model outputs from
key model inputs. It iteratively replaces numbers attached to key parameters (inputs) with random numbers
drawn from a specified distribution, where the type of distribution, the upper and lower bounds on the
distribution, and the number of iterations are chosen by the analyst. The Monte Carlo simulation provides a
distribution around chosen outputs from which sensitivity of outputs to inputs can be determined. The program
used to undertake the Monte Carlo simulation was @Risk.
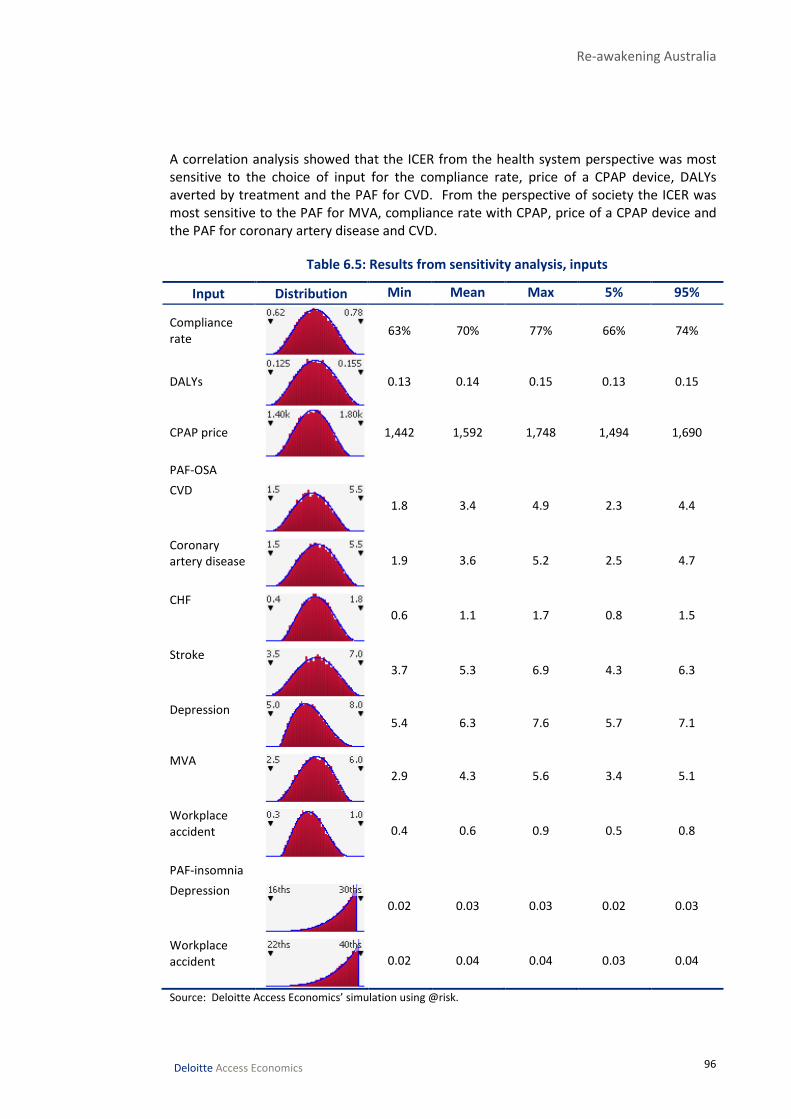
Re-awakening Australia
96 Deloitte Access Economics
A correlation analysis showed that the ICER from the health system perspective was most
sensitive to the choice of input for the compliance rate, price of a CPAP device, DALYs
averted by treatment and the PAF for CVD. From the perspective of society the ICER was
most sensitive to the PAF for MVA, compliance rate with CPAP, price of a CPAP device and
the PAF for coronary artery disease and CVD.
Table 6.5: Results from sensitivity analysis, inputs
Input Distribution Min Mean Max 5% 95%
Compliance
rate
63% 70% 77% 66% 74%
DALYs
0.13 0.14 0.15 0.13 0.15
CPAP price
1,442 1,592 1,748 1,494 1,690
PAF-OSA
CVD
1.8 3.4 4.9 2.3 4.4
Coronary
artery disease
1.9 3.6 5.2 2.5 4.7
CHF
0.6 1.1 1.7 0.8 1.5
Stroke
3.7 5.3 6.9 4.3 6.3
Depression
5.4 6.3 7.6 5.7 7.1
MVA
2.9 4.3 5.6 3.4 5.1
Workplace
accident
0.4 0.6 0.9 0.5 0.8
PAF-insomnia
Depression
0.02 0.03 0.03 0.02 0.03
Workplace
accident
0.02 0.04 0.04 0.03 0.04
Source: Deloitte Access Economics’ simulation using @risk.

Re-awakening Australia
97 Deloitte Access Economics
Chart 6.1 and Chart 6.2 show a distribution of ICER results from the perspective of the
health care system and society respectively.
Chart 6.1: Sensitivity analysis, ICER health system
Source: Deloitte Access Economics’ simulation using @risk.
Chart 6.2: Sensitivity analysis, ICER society
Source: Deloitte Access Economics’ simulation using @risk.
12
13
14
15
16
17
18
19
20
Values x 10^-4
-15
-14
-13
-12
-11
-10 -9 -8 -7 -6 -5 -4
Values x 10^-4

Re-awakening Australia
98 Deloitte Access Economics
7 Comparisons and opportunities
7.1 Summary of the cost of sleep disorders
The total financial cost associated with sleep disorders in Australia was
estimated as $5.1 billion (ranging from $3.5 billion to $6.0 billion) in 2010
(Table 7.1).
• Health care costs were $818 million (16%), of which 33% were directly due to sleep
disorders ($274 million). The remainder of health care costs (67% or $544 million) were
attributable to other conditions associated with sleep disorders.
• Lost productivity cost $3.1 billion (62%) and other costs of motor vehicle accidents
were $465 million (9%).
• The DWL accounted for $472 million or 9% of the total cost while informal care cost
$129 million (3%).
• Non-financial costs were $31.4 billion, ranging from $23.5 billion to $36.8 billion.
In total the economic cost of sleep disorders in 2010 was estimated to be
$36.4 billion, ranging from $27.0 billion to $42.8 billion.
Table 7.1: Summary of the economic cost of sleep disorders, 2010
Low Base case High
$m $m $m
Health care costs
Sleep disorders 274 274 274
Associated conditions 357 544 703
Total health care cost 631 818 977
Indirect financial costs
Productivity 2,120 3,132 3,673
Informal care 76 129 166
Other cost of MVA 303 465 605
Other cost of workplace accidents 28 53 56
Deadweight loss 329 472 565
Total indirect financial cost 2,855 4,250 5,065
Total financial cost 3,487 5,069 6,042
Total non-financial costs 23,468 31,350 36,751
Total cost 26,955 36,419 42,793
Source: Deloitte Access Economics estimates.
Chart 7.1 shows the total cost of sleep disorders in 2010, broken down according to the
type of sleep disorder and the components of the cost of that sleep disorder:

Re-awakening Australia
99 Deloitte Access Economics
• the total cost of OSA was estimated at $21.2 billion;
• the total cost of insomnia was estimated as $10.9 billion; and
• the total cost of RLS was $4.4 billion.
However, it is necessary when making comparison between conditions to note that data
limitations have not allowed us to include all costs associated with all sleep disorders.
Chart 7.1: Economic cost of sleep disorders, 2010
Source: Deloitte Access Economics’ estimates.
7.2 Comparisons in Australia The relative size of health spending for sleep disorders compared to seven of the national
health priorities and other diseases is shown in Table 7.2. Health system expenditure on
sleep disorders is lower than on the national health priorities and other diseases in the
table. However, the estimate of health care costs presented in this report may be an
underestimate, mostly capturing the cost of OSA rather than all sleep disorders.
$21,151 m
$10,871 m
$4,356 m
$39 m
OSA Insomnia RLS Other sleep disorders
Total economic cost $36.4 billion

Re-awakening Australia
100 Deloitte Access Economics
Table 7.2: Health cost comparison, national priorities and other, 2010
Disease Category Total health
care costs(a)
Hospital Out of hospital
medical services
$m $m $m
Cardiovascular disease* 7,142 3,616 1,362
Ischaemic heart disease 2,187 1,570 213
Stroke 643 498 53
Musculoskeletal conditions* 4,755 2,407 1,419
Arthritis 1,678 1,121 280
Other conditions 3,077 1,286 1,139
Mental disorders* 4,961 1,696 647
Depression 1,691 389 351
Neoplasms* 4,552 2,862 685
Injuries* 4,092 2,911 1,016
Diabetes* 1,189 446 346
Asthma* 728 118 166
Sleep disorders 274 96 97
Total of all diseases (b)
63,291 29,111 14,302
Note: * indicates National Health Priorities. Expenditure costs were converted from 2004/05 dollars to 2010
dollars based on average annual inflation rate over ten years (3.4%) (AIHW 2010a). (a) Includes costs other than
hospital and out-of-hospital medical services, which were not estimated for sleep disorders. (b) Includes
conditions not listed in the table.
Source: AIHW (2010b), Deloitte Access Economics’ calculations.
The other diseases presented include costs in addition to hospital and out-of-hospital
medical services. Since these were not estimated for sleep disorders, comparison was only
made with hospital and out-of-hospital medical costs.
• Hospital costs of sleep disorders ($96 million) are of a similar order of magnitude as
those of asthma ($118 million).
• Out of hospital costs ($97 million) are nearly twice those of stroke ($53 million).
If the costs of associated conditions are included, the total health system cost is
$818 million, higher than asthma and stroke.56
7.3 Comparisons with Wake Up Australia
This analysis has built on Access Economics (2004a), adopting updated methods and
parameter estimates for the cost of sleep disorders due to subsequent literature findings
and data that has become available. For ease of comparison, a summary of the differences
in methods between the two analyses is provided in Table 7.3.
56
This cost cannot be directly compared to those in Table 7.2 as they only include primary costs and not costs
associated with attributable conditions.

Re-awakening Australia
101
Table 7.3: Summary of the methods and findings of this study compared with Access Economics (2004a)
2005 report 2011 report Reason Impact
Prevalence of sleep disorders
OSA 4%
Insomnia 1.25%
RLS 1%
6%
Prevalence was based on
whole population.
OSA 4.7%
Insomnia 3%
RLS 1.2%
Total 8.9%
Prevalence was based on population 20 years
and over.
OSA changed based on an assessment of the
quality of the research and in consultation
with the client.
Insomnia changed based on new evidence.
Prevalence was based on the population over
20 because this aligned with the prevalence
data available and with data available on the
relationship between sleep disorders and
other conditions.
Prevalence of all three sleep
disorders is higher in 2011
report
Relationship with other conditions
Hypertension
and CVDs
Included effects of sleep
disorders on hypertension
and through this link to CVDs.
Previous PAF was 0.6% for all
CVD.
Included effects on CVD conditions directly
(rather than through the hypertension link).
Included the impact of OSA on coronary artery
disease, stroke and CHF. Resulted in PAFs of
5.3% for stroke, 1.1% for CHF, 3.6% for coronary
artery disease, and 3.4% for all other CVDs.
There is more literature available now on the
direct linkages, which is methodologically
better than using the risk factor pathway
through hypertension
Larger impact from CVD
costs.
Diabetes Included in the 2005 report
with a PAF of 2.9% and 0.9%
of kidney diseases.
Not included in the 2011 report. Recent clinical evidence has been tenuous
about a causal relationship between sleep
disorders and diabetes. The literature is
mixed in relation to whether obesity is the
underlying cause of both or, once obesity is
controlled for, there is still a link – but it still
may not be causative (e.g. it might be that
diabetes is a risk factor for sleep disorders)
Smaller (zero) impact from
diabetes and kidney disease
costs.
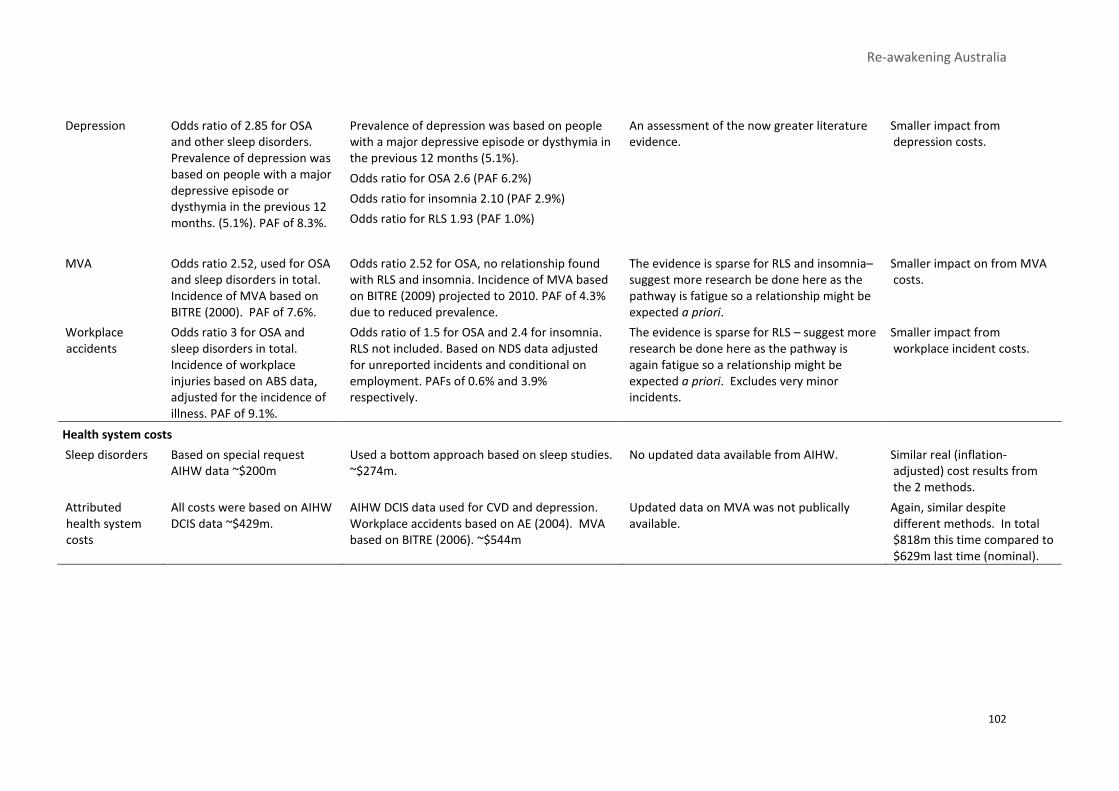
Re-awakening Australia
102
Depression Odds ratio of 2.85 for OSA
and other sleep disorders.
Prevalence of depression was
based on people with a major
depressive episode or
dysthymia in the previous 12
months. (5.1%). PAF of 8.3%.
Prevalence of depression was based on people
with a major depressive episode or dysthymia in
the previous 12 months (5.1%).
Odds ratio for OSA 2.6 (PAF 6.2%)
Odds ratio for insomnia 2.10 (PAF 2.9%)
Odds ratio for RLS 1.93 (PAF 1.0%)
An assessment of the now greater literature
evidence.
Smaller impact from
depression costs.
MVA Odds ratio 2.52, used for OSA
and sleep disorders in total.
Incidence of MVA based on
BITRE (2000). PAF of 7.6%.
Odds ratio 2.52 for OSA, no relationship found
with RLS and insomnia. Incidence of MVA based
on BITRE (2009) projected to 2010. PAF of 4.3%
due to reduced prevalence.
The evidence is sparse for RLS and insomnia–
suggest more research be done here as the
pathway is fatigue so a relationship might be
expected a priori.
Smaller impact on from MVA
costs.
Workplace
accidents
Odds ratio 3 for OSA and
sleep disorders in total.
Incidence of workplace
injuries based on ABS data,
adjusted for the incidence of
illness. PAF of 9.1%.
Odds ratio of 1.5 for OSA and 2.4 for insomnia.
RLS not included. Based on NDS data adjusted
for unreported incidents and conditional on
employment. PAFs of 0.6% and 3.9%
respectively.
The evidence is sparse for RLS – suggest more
research be done here as the pathway is
again fatigue so a relationship might be
expected a priori. Excludes very minor
incidents.
Smaller impact from
workplace incident costs.
Health system costs
Sleep disorders Based on special request
AIHW data ~$200m
Used a bottom approach based on sleep studies.
~$274m.
No updated data available from AIHW. Similar real (inflation-
adjusted) cost results from
the 2 methods.
Attributed
health system
costs
All costs were based on AIHW
DCIS data ~$429m.
AIHW DCIS data used for CVD and depression.
Workplace accidents based on AE (2004). MVA
based on BITRE (2006). ~$544m
Updated data on MVA was not publically
available.
Again, similar despite
different methods. In total
$818m this time compared to
$629m last time (nominal).

Re-awakening Australia
103
Indirect costs
Productivity Used lost productivity
estimates for CVDs, diabetes,
kidney disease and depression
– Workplace accidents and
MVAs included below.
~$1.7bn for CVDs, diabetes,
kidney disease and
depression.
Used data for each condition.
• $2.1 billion for CVDs and depression.
Diabetes and kidney disease costs excluded.
• Workplace accidents and MVA estimated
here (rather than below) as $962m and
$80.5m respectively (excludes impacts from
RLS and, for MVA, from insomnia).
Changes reflect changes to PAFs as above, as
well as minor methodological changes
(e.g calculations with greater granularity by
age and gender this time).
Higher impact from CVDs but
no impact from diabetes or
kidney disease and smaller
impact from depression.
Workplace accidents and
MVAs – see below.
Informal care Only included for workplace
accidents and MVA – included
below in these cost elements.
Included for all conditions except depression.
Based on the number of people assumed not
employed. Total was $129m ($46.5m for CVD,
$48.4m for MVAs and $34.4m for workplace
incidents).
Subsequent (2005) costing of informal care
losses from CVDs enabled this element to be
added this time. Data still inadequate for
depression carer costs.
Higher impact due to
including CVD this time.
Workplace accidents and
MVAs – see below.
DWL Only included DWL from lost
productivity. $138m.
Included DWL from lost productivity and public
expenditure. $472m.
Method for including DWLs from public
expenditure developed since last report,
enabling this element to be added this time.
Higher impact due to
including public expenditure
DWLs this time.
Workplace
accidents
Used Access Economic (2004),
costs applied to injuries and
illnesses. ~$2.7bn
Used Access Economic (2004) but only costs that
applied to injuries. $52.5m Excluded
productivity as calculated above. Excluded loss
in quality of life as included below.
Decision to attribution by health sequelae
rather than type of cost.
$962m+$34.4m+$52.5m
=$1.0bn this time. Smaller
due to smaller PAF, and BoD
being added in below.
MVA Used BITRE calculations.
~$1.1bn
Used updated BITRE estimates - $465m.
Excluded productivity as calculated above.
Excluded loss in quality of life as included below.
Decision to attribution by health sequelae
rather than type of cost.
$80.5m+$48.4m+$464.7m
=$593.6m this time. Smaller
due to smaller PAF, and BoD
being added in below.
Burden of
disease
Based on condition associated
with sleep disorders. ~$4.1bn
Calculated for sleep disorders and associated
conditions (adjusted for double counting).
~31.4bn
New literature on the disability weight for
sleep disorders themselves and updated
value of a statistical life year.
Substantially increased the
estimate of the BoD.

Re-awakening Australia
104 Deloitte Access Economics
7.4 International developments
The importance of sleep health is beginning to gain recognition overseas, in terms of
acknowledgement of the need for and development of strategies to increase public
awareness and intervention in relation to sleep disorders.
In the US, the National Commission on Sleep Disorders Research identified priorities for the
sleep health agenda and called for action from Congress. The following is drawn from the
Executive Summary of their Submission to Congress and the US Department of Health and
Human Services.
• Despite their pervasiveness and impact on society, sleep-related problems are not
recognised as a public health issue. Americans are essentially ignorant of their
prevalence, impacts and basic information about sleep and sleep pathologies. Health
care professionals receive minimal or no training in this area. Both the public and
private sectors largely disregard the impact of sleep-related issues on productivity and
safety. Thus, as a whole, American society fails to recognise and attend effectively to
sleep-related issues.
• Although sleep-related research has been undertaken by the National Institutes for
Health and the former Alcohol, Drug Abuse and Mental Health Administration, no
organisational structure exists federally to foster information dissemination, access to
medical care, education at all levels and biomedical and behavioural research into and
for clinical diagnosis, prevention and treatment of sleep disorders.
• Six key recommendations to address these issues are:
i The establishment of a National Center for Research and Education on Sleep
and Sleep Disorders, complementing other sleep-related research undertaken
elsewhere, filling gaps and encouraging cross-cutting research, and developing
new research programs and educational training and initiatives in the field.
ii The expansion of basic, clinical, epidemiological, health services and
prevention research on sleep and sleep disorders.
iii The establishment of specifically identified offices on sleep and sleep disorders
within all federal departments and agencies whose programs affect or are
affected by sleep issues.
iv Increased federal support for sleep and sleep disorder research training and
career development opportunities.
v Broader awareness of and training in sleep and sleep disorders across all
health professionals, particularly at the primary care level.
vi A major public awareness and education campaign about sleep and sleep
disorders.
The 2006 US Institute of Medicine report “Sleep Disorders and Sleep Deprivation: an unmet
public health problem” is also highly influential.57
A number of groups have also sought to heighten awareness of sleep disorders
internationally. World Sleep Day was established on 18 March 2008 and in the US National
5757
For example, see http://www.nap.edu/catalog.php?record_id=11617

Re-awakening Australia
105 Deloitte Access Economics
Sleep Awareness week occurs on 7 – 13 March. The European Respiratory Society and the
British Lung Foundation have played an important role in raising awareness in relation to
OSA.
However, more still needs to be done to enhance public awareness of sleep disorders.
Colten and Altevogt (2006) noted that the public education campaigns used by the National
Centre for Sleep Disorders Research in the US focus on children and adolescents. There
were no multimedia awareness campaigns for adults. They argued that more needed to be
done to inform individuals about sleep disorders and to integrate information on sleep
disorders into the medical, nursing, and pharmacology curricula.
7.5 Opportunities for the future
Australia is confronted with similar challenges. Sleep remains under-represented on the
national health agenda. However, the future is positive if opportunities for action are
catalysed, since such a large proportion of sleep-related impacts are preventable or
treatable.
• Australia has comparative advantages in the analysis of sleep arena.
• We are a world leader in clinical practice, research and in the development,
manufacturing and marketing of devices to diagnose and treat sleep disorders.
• A number of groups are already active, with the potential to build on these existing
delivery mechanisms.
• The Australasian Sleep Association is a professional organisation responsible
for training and advising health professionals.
• Sleep Disorders Australia is a group of state-based organisations providing
patient support and local community programs.
• The Sleep Health Foundation has played an active role in raising community
awareness of the impact of sleep disorders and poor sleep practices on health,
safety, productivity and quality of life.
• Australian governments provide funding for part of the cost of diagnosis and
treatment of sleep disorders.
• Individual clinicians, including sleep specialists, GPs, psychologists and
surgeons, diagnose and treat sleep disorders.
• The Australian sleep health industry, including private, not-for-profit and
public community health services, includes companies that are world leaders
in the development and manufacture of diagnostic and therapeutic devices.
Priority interventions to address the current fragmented and under-resourced sleep health
landscape include the following:
Education and awareness raising for community, health professionals and public policy
makers, regarding the importance of good sleep hygiene and how to achieve better sleep
outcomes. In particular, there is a need for:
• greater awareness, diagnosis and treatment of OSA, insomnia and RLS and other
medical causes of disordered sleep;
• better understanding of the behavioural and social consequences of sleep health
disturbance on the part of health professionals, government and the community;

Re-awakening Australia
106 Deloitte Access Economics
• a change in people’s understanding of the need for effective sleep and misconceptions
about the hours and quality of sleep required, including:
• education on healthy sleep practices;
• a change in the perception that sleep intrudes on the time available to
complete daily activities;
• destigmatisation of snoring; and
• increasing awareness that treatments are available for sleep disorders.
• continuing education for key medical workforce such as GPs, which may involve:
• enhanced undergraduate education on sleep for medical students;
• Royal Australian College of General Practice post-graduate education and
training on sleep disorders, for example Chai-Coetzer et al (2011) found that a
six hour education program for GPs on OSA lead to greater confidence in
diagnosing and treating OSA; and
• information technology support services.
• public awareness campaigns and regulation, for example through Safe Work Australia
in relation to occupational incidents, to modify workplace practices and improve safety
through better understanding and action in relation to the links between poor sleep,
low productivity and workplace safety, especially in heavy industries and transport and
shift-based businesses.
Research and development – areas where further research would be worthwhile to
understand the link between sleep disorders and other injury and illness include:
• undertaking population based longitudinal studies on the relationship between OSA
and diabetes (using for example the Sleep Heart Health Study);
• undertaking population based longitudinal studies and random clinical trials to evaluate
the relationship between OSA and CVD for women;
• studying the relationship between primary insomnia and MVAs for a number of years
to assess the effect of insomnia on MVAs; and
• studying the effectiveness of CPAP in reducing the risk of CVD and depression.
Cost-effective prevention, treatment and management options:
• CPAP is a highly cost effective treatment option for OSA, although a large proportion of
the cost is met privately.
• CPAP is not tolerated by everyone and there is a relatively high non-compliance rate.
Other treatments that are also effective at treating OSA, such as dental devices, might
be further investigated in terms of greater recommended use and government funding.
A national coordination point – the establishment of a catalysing agent with a forward
national action plan.
• A national sleep health coordinating organisation would be an effective way of
promoting greater knowledge of sleep disorders and their costs to society and
promoting research into effective ways to treat OSA.
• Such an organisation could also help strengthen knowledge of sleep disorders among
GPs and raise community awareness of the dangers of sleep disorders and poor sleep
habits particular in relation to motor vehicle accidents.

Re-awakening Australia
107 Deloitte Access Economics
References Access Economics 2010a, Business Outlook December 2010, Canberra.
-2010b, The economic value of informal care in 2010, Report for Carers Australia.
-2009, The economic costs of heart attack and chest pain (acute coronary syndrome),
Report for Eli Lilly, June 2009.
-2005a, Restless legs syndrome: costs of the most common medical condition most
people have never heard of, Report for Restless Legs Syndrome Australia, April 2005.
-2005b, The shifting burden of cardiovascular disease, Report for the National Heart
Foundation of Australia.
-2004a, Wake up Australia: the value of healthy sleep, Report for Sleep Health
Australia, October 2004.
-2004b, Costs of workplace injury and illness to the Australian economy: reviewing
the estimation methodology and estimates of the level and distribution of costs,
Report for the National Occupational Health and Safety Commission.
Akerstedt, T, Kecklund, G and Horte, LG 2001, ‘Night driving, season, and the risk of
highway accidents’, Sleep, 24(4): 401-6.
Al-Delaimy, WK, Manson, JE, Willett, WC, et al 2002, ‘Snoring as a risk factor for type II
diabetes mellitus: a prospective study’, American Journal of Epidemiology, 155: 387-
393.
Ali, N, Pitson, D and Stradling, J 1996, ‘Sleep disordered breathing: effects of
adenotonsillectomy on behaviour and psychological functioning’, European Journal of
Pediatrics, 155: 56-62.
Ali, N, Pitson, D and Stradling J 1993, ‘Snoring, sleep disturbance, and behavior in 4–5 year
olds’, Archives of Diseases in Childhood, 68: 360-366.
Allen, RP, Bell, TJ, Walters, A and Hening, W 2003, ‘Impact of restless legs syndrome (RLS)
symptoms on the quality of life (QoL) of adult sufferers in the USA’, Neurology 2003;
60 (suppl 1): A11: S05.006.
Allen, RP, Bharmal, M and Calloway, M 2011, ‘Prevalence and disease burden of primary
restless legs syndrome: results of a general population survey in the United States’,
Movement Disorders, 26(1): 114-130.
Allen, RP, Hening, W and Montplaisir, J, et al 2002, ‘Restless legs syndrome (RLS) is a
common disorder rarely diagnosed in Europe or USA: the REST (RLS Epidemiology,
Symptoms and Treatment) study in primary care’, Movement Disorders, 17(suppl
5):S240–S241:P774.
Re-awakening Australia
108 Deloitte Access Economics
Allen, RP, Walters, AS and Montplaisir, J 2005, ‘Restless legs syndrome prevalence and
impact’, Archives of Internal Medicine, 165: 1286-1292.
American Psychiatric Association 1987, Diagnostic and statistical manual of mental
disorders, 3rd edition, revised, Washington DC.
Amin, R, Somers, VK, McConnell, K et al 2008, ‘Activity adjusted 24-Hour ambulatory blood
pressure and cardiac remodeling in children with sleep disordered breathing’,
Hypertension, 51: 84-91.
Ancoli-Israel, S, Kripke, D, Klauber, M et al 1996, ‘Morbidity, mortality and sleep-disordered
breathing in community dwelling elderly’, Sleep, 19: 277-282.
Armstrong, KL, Quinn, RA and Dadds, MR 1994, ‘The sleep patterns of normal children’,
Medical Journal of Australia, 161(3): 202-206.
Artz, M, Young, Tand Finn, L 2005, ‘Association of sleep-disordered breathing and the
occurrence of stroke’, American Journal of Respiratory and Critical Care Medicine,
172: 1447-1451.
Australian Bureau of Statistics (ABS) 2011a, Consumer price index Dec 2010, Australia, Cat
No 6401.0, March.
2011b, Labour force, Australia, detailed — electronic delivery, April 2011, ABS Cat No
6291.0.55.001, http://www.abs.gov.au/AUSSTATS/[email protected]/DetailsPage/6291.0.55.
001Apr%202011?OpenDocument, accessed 3 May 2011.
- 2011c, Employee earnings, benefits and trade union membership, Australia, August
2010, ABS Cat No 6310.0, http://www.abs.gov.au/AUSSTATS/[email protected]/DetailsPage/6
310.0Aug%202010?OpenDocument, accessed 3 February 2011.
-2011d, Cause of Death, 2009, ABS Cat No 3303.
-2010a, Australian demographic statistics, June 2010, Cat. No. 3101.0, December.
-2010b, Work-related injuries, Australia, 2009-10, Cat. No. 6324.0, December.
-2010c, Life tables, Australia, 2007-2009, Cat No 3302, http://www.abs.gov.au/AUSST
ATS/[email protected]/DetailsPage/3302.0.55.0012007-2009?OpenDocument, accessed 05
May 2011.
-2009a, National Health Survey: summary of results 2007-08, ABS Cat No 4364.0,
August.
-2009b, National Health Survey: users' guide - electronic publication, 2007-08, ABS
Cat No 4363.
-2009c, 2007-08 National Health Survey: basic CURF.
-2008, National Survey of Mental Health and Wellbeing: summary of results, 2007,
ABS Cat No 4326.0, November.

Re-awakening Australia
109 Deloitte Access Economics
-2004, Disability, ageing and carers: Summary of findings, Australia 2003, Australian
Bureau of Statistics, Cat No 4430.0, Canberra.
-2003, Multiple cause of death analysis, 1997-2001, Cat No 3319.0.55.001, http://ww
w.abs.gov.au/Ausstats/[email protected]/Latestproducts/3319.0.55.001Appendix21997-2001
?opendocument&tabname=Notes&prodno=3319.0.55.001&issue=1997-
2001&num=&view=., accessed 23 January 2010.
-1999, National Health Survey: use of medications, Australia, ABS Cat No 4377.0,
January.
Australian Institute of Health and Welfare (AIHW) 2011a, Cardiovascular disease: Australian
facts 2011, Cardiovascular disease series No 35, Cat No CVD 53.
-2011b, Health priority areas, http://www.aihw.gov.au/health-priority-areas/,
accessed May 16, 2011.
-2010a, Australia’s Health 2010, http://www.aihw.gov.au/publication-
detail/?id=6442468376&tab=2, accessed May 16 2011.
-2010b, Health system expenditure on disease and injury in Australia, 2004–05,
www.aihw.gov.au/WorkArea/DownloadAsset.aspx?id=6442457087, accessed May
16, 2011.
-2010c, National Hospital Morbidity Database, http://www.aihw.gov.au/hospitals/da
tacub es/datacube_pdx.cfm, accessed 10 May 2010.
-2010d, Women and heart disease: cardiovascular profile of women in Australia,
Cardiovascular Disease Series No 33, Cat No CVD 49, Canberra: AIHW.
-2010e, Premature mortality from chronic disease, Bulletin 84, December 2010.
-2009a, Serious injury due to land transport accidents, Australia 2006-07, Injury
Research and Statistics Series No. 53, Canberra.
-2009b, Chronic disease and participation in work, Cat No PHE 109.
-2008, Health care expenditure on cardiovascular diseases 2004–05, Cardiovascular
disease series No 30, Cat No CVD 43.
Austroads 2006, Assessing fitness to drive, http://www.austroads.com.au/cms/AFTD%20we
b%20Aug%202006.pdf, accessed 04 March 2011.
Ayas, NT, White, DP, Manson, JE et al 2003, ‘A prospective study of sleep duration and
coronary heart disease in women’, Archives of Internal Medicine, 163(2): 205-9.
Baglioni, C, Battagliese, G and Feige, B 2011, ‘Insomnia as a predictor of depression: a meta-
analytic evaluation of longitudinal epidemiological studies’, Journal of Affective
Disorders, (forthcoming).

Re-awakening Australia
110 Deloitte Access Economics
Ballard, R 2008, ‘Management of patients with obstructive sleep apnea’, The Journal of
Family Practice, 57(8): S24-S30.
Ballard, CJ, Shoven J and Walley, DJ 1985, ‘General equilibrium computations of the
marginal welfare costs of taxation in the United States’, American Economic Review,
75(1): 128-138.
Baldwin, CM, Kent, AG, Nieto, J et al 2001, ‘The association of sleep-disordered breathing
and sleep symptoms with quality of life in the Sleep Heart Health Study’, Sleep, 24(1):
96-105.
Balter, MB and Uhlenhuth, EH 1992, ‘New epidemiological findings about insomnia and its
treatment’, Journal of Clinical Psychiatry, 53 (12, supplement): 34-39.
Barbé, F, Mayoralas, L, Duran, J et al 2001, ‘Treatment with continuous positive airway
pressure is not effective in patients with sleep apnea but no daytime sleepiness: a
randomised , controlled trial, Annals of International Medicine, 134: 1015-1023.
Bartlett, DJ, Marshall, NS, Williams, A et al 2008a, ‘Predictors of primary medical care
consultation for sleep disorders’, Sleep Medicine, 9: 857-864.
Bartlett, DJ, Marshall, NS, Williams, A et al 2008b, ‘Sleep health New South Wales: chronic
sleep restriction and daytime sleepiness’, Internal Medicine Journal, 38(1): 24-31.
Basner, R 2007, ‘Continuous positive airway pressure for obstructive sleep apnea’, The New
England Journal of Medicine, 356(17): 1751-1758.
Bearpark, H, Elliott, L, Grunstein, R, et al 1995, ‘Snoring and sleep apnea: a population study
in Australian’, American Journal of Respiratory Critical Care Medicine, 151:1459–
1465.
Begg, S, Vos, T, Barker, B et al 2007, ‘The burden of disease and injury in Australia 2003’,
AIHW Cat. No. PHE 82, AIHW Canberra.
Bixler, EO, Vgontzas, AN, Lin, HM et al 2001, ‘Prevalence of sleep-disordered breathing in
women: effects of gender’, American Journal of Respiratory and Critical Care
Medicine, 163(3): 608-613.
Bixler, EO, Vgontzas, AN, Ten Have, T et al 1998, ‘Effects of age on sleep apnea in men:
I. prevalence and severity’, American Journal of Respiratory and Critical Care
Medicine, 157: 144-148.
Botros, N, Concato, J, Mohsenin, V et al 2009, ‘Obstructive sleep apnea as a risk factor for
type II diabetes’, American Journal of Medicine, 122(12): 1122-1127.
Botteman, MF, Ozminkowski, RJ, Wang, S et al 2007, ‘Cost effectiveness of long-term
treatment with eszopiclone for primary insomnia in adults’, CNS Drugs, 21(4): 319-
334.
Bradley, TD and Floras, JS 2009, ‘Obstructive sleep apnoea and its cardiovascular
consequences’, The Lancet, 373: 82-93.
Re-awakening Australia
111 Deloitte Access Economics
Breslau, N, Roth, T, Rosenthal, L et al 1996, ‘Sleep disturbance and psychiatric disorders: a
longitudinal epidemiological study of young adults’, Biological Psychiatry, 39(6): 411-
418.
Bresnitz, EA, Goldberg, R, Kosinski, RM 1994, ‘Epidemiology of obstructive sleep apnea’,
Epidemiology Review, 16: 210-227.
Brouwer WBF and MA Koopmanschap 2000, ‘On the economic foundations of CEA. Ladies
and gentlemen, take your positions!’, Journal of Health Economics, Vol. 19, pp. 439-
459.
Browning, EK 1987, ‘On the marginal welfare cost of taxation’, American Economic Review,
77(1): 11-23.
-1976, ‘The marginal cost of public funds’, Journal of Political Economy, 84: 283-298.
Brunetti, L, Rana, S, Lospalluti, ML et al 2001, ‘Prevalence of obstructive sleep apnea
syndrome in a cohort of 1,207 children of southern Italy’, Chest, 120(6): 1930-1935.
Buchner, NJ, Bernd, MS, Borgel, J et al 2007, ‘Continuous positive airway pressure
treatment of mild to moderate obstructive sleep apnea reduces cardiovascular risk’,
American Journal of Respiratory and Critical Care Medicine, 176: 1274-1280.
Bureau of Infrastructure, Transport and Regional Economics (BITRE) 2009, Cost of road
crashes in Australia 2006, Report 118, Department of Infrastructure, Transport,
Regional Development and Local Government, Canberra.
Campbell, HF, Bond, KA 1997, ‘The cost of public funds in Australia’, Economic Record,
73(220): 22-34.
Celen, YT, Hedner, J, Carlson, J et al 2010, ‘Impact of gender on incident diabetes mellitus in
obstructive sleep apnea: a 16-year follow-up’, Journal of Clinical Sleep Medicine,
6(3): 244-250.
Chai-Coetzer, CL, Antic, N, Rowland, LS et al 2011, ‘An education program for general
practitioners to improve awareness and knowledge of obstructive sleep apnea’,
Australian Family Physician (forthcoming).
Chakravorty, I, Cayton, RM and Szczepura, A 2002, ‘Health utilities in evaluating
intervention in the sleep apnoea/hypopnoea syndrome’, European Respiratory
Journal, 20: 1233-1238.
Chan, AS, Lee, RW and Cistulli, PA 2007, ‘Dental appliance treatment for obstructive sleep
apnea’, Chest, 132(2): 693-699.
Chervin, RD, Archbold, KH, Dillon, JE et al 2002, ‘Associations between symptoms of
inattention, hyperactivity, restless legs, and periodic leg movements’, Sleep, 25: 213-
218.

Re-awakening Australia
112 Deloitte Access Economics
Cho, SJ, Hong, JP and Hahm, BJ 2009, ‘Restless legs syndrome in a community sample of
Korean adults: prevalence, impact on quality of life and association with DSM-IV
psychiatric disorders’, Sleep, 32(8): 1069-1076.
Choi, BK 2010, ‘Population attributable fraction: comparison of two mathematical
procedures to estimate the annual attributable number of deaths’, Epidemiologic
Perspectives and Innovations, 7: 1-8.
Colton, HR, Altevogt, BM (eds) 2006, Sleep disorders and sleep deprivation: an unmet public
health problem, http://www.nap.edu/catalog/11617.html, accessed on 19 May 2011.
Connor, J, Norton, R, Ameratunga, S et al 2002, ‘Driver sleepiness and risk of serious injury
to car occupants: population based case control study’, British Medical Journal, 324:
1125-1129.
Connor, J, Whitlock, G, Norton, R et al 2001, ‘The role of driver sleepiness in car crashes: a
systematic review of epidemiological studies’, Accident Analysis & Prevention, 33(1):
31-41.
Crabtree, VM, Ivanenko, A and O'Brien, LM 2003, ‘Periodic limb movement disorder of
sleep in children’, Journal of Sleep Research, 12: 73-81.
Currie, C, McEwan, P, Peters,J, Patel, TC and Dixon, S 2005, ‘The routine collation of health
outcomes data from hospital treated subjects in the Health Outcomes Data
Repository (HODaR): descriptive analysis from the first 20,000 subjects’, Value
Health, 8:581–90.
Daley, M, Morin, CM, LeBlanc, M et al 2009 ‘The economic burden of insomnia: direct and
indirect costs for individuals with insomnia syndrome, insomnia symptoms, and good
sleepers’, Sleep, 32(1): 55-64.
Daniels, E, King, M, Smith, I et al 2001, ‘Health-related quality of life in narcolepsy’, Journal
of Sleep Research, 10: 75-81.
Davies, R and Stradling, J 1996, ‘The epidemiology of sleep apnoea’, Thorax, 51: S65-S70.
Dawson, D, McCulloch, K, Baker, A 2001, Extended Working Hours in Australia: Counting the
Costs, report commissioned by the Department of Industrial Relations, Australia.
Department of Health and Ageing (DOHA) 2010, National Hospital Cost Data Collection,
http://www.health.gov.au/internet/main/publishing.nsf/Content/health-casemix-
data-collections-about#NHC, accessed 23 December 2010.
2006, AR-DRG Version 5.2 Definitions Manual.
Department of Human Services 2010a, Disability Support Pension, http://www.centrelink.go
v.au/internet/internet.nsf/payments/disability_support.htm, accessed 23 January
2011.
-2010b, Rent Assistance, http://www.centrelink.gov.au/internet/internet.nsf/payme
nts/rent_assistance.htm, 23 January 2011.

Re-awakening Australia
113 Deloitte Access Economics
Department of Family, Housings, Community Services and Indigenous Affairs(FaHCSIA)
2011, Guide to social security law. Rates of pension - July 1909 to present date,
http://www.fahcsia.gov.au/guides_acts/ssg/ssguide-5/ssguide-5.2/ssguide-
.2.2/ssguide-5.2.2.10.html, accessed 23 January 2011.
Department of Infrastructure and Transport (DIT) 2010, ‘Australian Road Deaths Database’,
http://www.infrastructure.gov.au/roads/safety/road_fatality_statistics/fatal_road_cr
ash_database.aspx, accessed 18 January 2011.
Diette, GB, Markson, L, Skinner, EA et al, 2000, ‘Nocturnal asthma in children affects school
attendance, school performance, and parents’ work attendance’, Archives of
Pediatrics & Adolescent Medicine, 154(9):923-8.
Dolan, P, Gudex, C, Kind, P et al 1996, ‘The time trade-off method: results from a general
population study’, Health Economics, 5: 141-154.
Dunstan, D, Zimmet, P, Welborn T, et al 2001, ‘Diabesity and associated disorders in
Australia – 2000’, The Australian Diabetes, Obesity and Lifestyle Study
(AusDiab),http://www.diabetes.com.au/pdf/AusDiab_Report.pdf, accessed 15
January 2009.
Duran, J, Esnaola, S, Rubio, R et al 2001, ‘Obstructive sleep apnea-hypopnea and related
clinical features in a population-based sample of subjects aged 30 to 70 yr’, American
Journal of Respiratory and Critical Care Medicine, 163: 685-689.
Eide, GE, Heuch, I 2001, ‘Attributable fractions: fundamental concepts and their
visualization’, Statistical Methods in Medical Research, 10: 159-193.
Ellen, RLB, Shawn, C and Marshall, MD 2006, ‘Systematic review of motor vehicle crash risk
in persons with sleep apnea’, Journal of Clinical Sleep Medicine, 2(2): 193-200.
Essig, M 2009, Continuous positive airway pressure (CPAP) for sleep apnea, http://www.em
edicinehealth.com/script/main/art.asp?articlekey=138603&ref=129796H
Fell, DL and Black, B 1997, ‘Driver fatigue in the city’, Accident Analysis and Prevention,
29(4): 463-469.
Ferguson, KA, Cartwright, R, Rogers, R et al 2006, ‘Oral appliances for snoring and
obstructive sleep apnea: a review’, Sleep, 29(2): 244-262.
Finn, L, Young, T, Palta, M et al 1998, ‘Sleep-disordered breathing and self-reported general
health satus in the Wisconsin Sleep Cohort Study’, Sleep, 21(7): 701-706.
Folkard, S 1997, ‘Black times: temporal determinants of transport safety’, Accident Analysis
and Prevention, 29(4): 417-30.
Frank, Y, Kravath, R, Pollak, C et al 1983, ‘Obstructive sleep apnea and its therapy: clinical
and polysomnographic manifestations’, Pediatrics, 71: 737-742.
Franks, P, Lubetkin, EI, Gold, MR et al 2004, ‘Mapping the SF-12 to the EuroQol EQ-5D Index
in a national US sample’, Medical Decision Making, 24: 247-254.

Re-awakening Australia
114 Deloitte Access Economics
Fransen, M, Wilsmore, B, Winstanley, J 2006, ‘Shift work and work injury in the New
Zealand Blood Donors’ Health Study’, Occupational and Environmental Medicine, 63:
352-358.
Gami, AS, Pressman, G and Caples, SM 2004, Association of atrial fibrillation and obstructive
sleep apnea’, Circulation, 110(4): 364-367.
George, C 2001, ‘Reduction in motor vehicle collisions following treatment of sleep apnoea
with nasal CPAP’, Thorax, 56: 508-512.
Gottlieb, DJ, Redline, S, Nieto, FJ et al 2006, ‘Association of usual sleep duration with
hypertension: the sleep heart health study’, Sleep, 29(8): 1009-1014.
Gottlieb, DJ, Vezina, RM, Chase, C et al 2004, ‘Sleep-disordered breathing symptoms are
associated with poorer cognitive function in 5-year-old children’, The Journal of
Pediatrics, 145(4): 458-464.
- 2003 ‘Symptoms of sleep-disordered breathing in 5-year-old children are associated
with sleepiness and problem behaviors’, Pediatrics, 112(4): 870-877.
Gottlieb, DJ, Yenokyan, G, Newman, AB et al 2010, ‘Prospective study of obstructive sleep
apnea and incident coronary heart disease and heart failure: the Sleep Heart Health
Study’, Circulation, 122(4): 352-360.
Grossman, M 1972, ‘On the concept of health capital and the demand for health’, Journal of
Political Economy, 80:223-255.
Gruntstein, R 2002, ‘Insomnia: diagnosis and management’, Australian Family Physician,
31(11): 1-6,
Guilleminault, C, Korobkin, R, Winkle, R 1981, ‘A review of 50 children with obstructive
sleep apnea syndrome’, Lung, 159: 275-287.
Guilleminault, C, Winkle, R, Korobkin, R et al 1982, ‘Children and nocturnal snoring:
evaluation of the effects of sleep related respiratory resistive load and daytime
functioning’, European Journal of Pediatrics, 139: 165-171.
Haagsma, JA, Polinder, S, van Beeck, EF et al 2009, ‘Alternative approaches to derive
disability weights in injuries: do they make a difference?’, Quality of Life Research,
18: 657-665.
Happe, S, Reese, JP, Stiasny-Kolster, K et al 2009, ‘Assessing health related quality of life in
patients with restless legs syndrome’, Sleep Medicine, 10: 295-305.
He, J, Kryger, M, Zorick, F et al 1988, ‘Mortality and apnea index in obstructive sleep apnea:
experience in 385 male patients’, Chest, 94: 9-14.
Heitmueller, A 2007, ‘The chicken or the egg? Endogeneity in labour market participation of
informal carers in England’, Journal of Health Economics, Vol. 26, pp. 536-559.

Re-awakening Australia
115 Deloitte Access Economics
Hening, W, Walters, A, Allen, RP, et al 2004, ‘Impact, diagnosis and treatment of Restless
Legs Syndrome (RLS) in a primary care population: the REST (RLS epidemiology,
symptoms and treatment) primary care study’ Sleep Medicine, 5:237-246.
Hillman, D, Murphy, AS, Antic, R et al 2006, ‘The economic cost of sleep disorders’, Sleep,
29(3): 299-305.
Hook, L 2006, CPAP -What is it?, www.ekhuft.nhs.uk/EasysiteWeb/getresource.axd?AssetID
=23168, accessed 11 May 2011.
Ip, MS, Lam, B, Lauder, IJ et al 2001, ‘A community study of sleep-disordered breathing in
middle-aged Chinese men in Hong Kong’, Chest, 119:62–69.
Ip, MS, Lam, B, Ng, MM et al 2002, ‘Obstructive sleep apnea is independently associated
with insulin resistance’, American Journal of Respiratory Critical Care Medicine, 165:
670-676.
Ip, MS, Lam, B, Tang, LC, et al 2004, ‘A community study of sleep-disordered breathing in
middle-aged Chinese women in Hong Kong: prevalence and gender differences’,
Chest, 125: 127–134.
Javaheri, S 2006, ‘Sleep disorders in systolic heart failure: a prospective study of 100 male
patients. The final report’, International Journal of Cardiology, 106: 21-28.
Jenkinson, C, Stradling, J and Petersen, S 1998, ‘How should we evaluate health status? A
comparison of three methods in patients presenting with obstructive sleep apnoea’,
Quality of Life Research, 7: 95-100.
-1997, Comparison of three measures of quality of life outcome in the evaluation of
continuous positive airways pressure therapy for sleep apnoea, Journal of Sleep
Research, 6:199– 204.
Jennum, P and Kjellberg, J 2011, ‘Health social and economic consequences of sleep
disordered breathing: a controlled national study’, Thorax, (forthcoming).
Kapur, V, Blough, KD et al 1999, ‘The medical costs of undiagnosed sleep apnea’, Sleep,
22(6): 749-755.
Katz, DA and McHorney, CA 2002, ‘The relationship between chronically disrupted sleep
and healthcare use’, Journal of Family Practice, 51(3): 229-235.
Kee, K and Naughton, M 2009, ‘Sleep apnoea: a general practise approach’, Australian
Family Physician, 38(5): 284-288.
Kessler RC, Berglund PA, Coulouvrat C et al 2011, ‘Insomnia and performance of US
workers: results from the America Insomnia Survey’ Sleep 34(9):1161-1171.
Kim, J, In, K, Kim, J, et al 2004, ‘Prevalence of sleep-disordered breathing in middle-aged
Korean men and women’ American Journal of Respiratory Critical Care Medicine,
170:1108–1113.
Re-awakening Australia
116 Deloitte Access Economics
Kind, P, Hardman, G, Macran, S 1999, UK population norms for EQ-5D, Centre for Health
Economics University of York, Discussion Paper 172.
Knox, SA, Harrison, CM, Britt, HC et al 2008, ‘Estimating prevalence of chronic morbidities in
Australia’, Medical Journal of Australia, 189(2): 66-70.
Krakow, B, Melendrez, D, Ferreira, E et al 2001, ‘Prevalence of insomnia symptoms in
patients with sleep- disordered breathing’, Chest, 120(6): 1923-1929.
Kribbs, NB, Pack, AI, Kline, LR, et al 1993, ‘Objective measurement of patterns of nasal CPAP
use by patients with obstructive sleep apnea’, American Review of Respiratory
Disease, 147:887-895.
Kripke, DF, Garfinkel, L, Wingard et al 2002, ‘Mortality associated with sleep duration and
insomnia’, Archives of General Psychiatry, 59(2): 131-6.
Kushida, C, Martin, M, Nikam, P et al 2007, ‘Burden of restless legs syndrome on health-
related quality of life’, Quality of Life Research, 16: 617-624.
Kwok, LK, Ng, KKD et al 2003, ‘BP and arterial distensibility in children with primary snoring’,
Chest, 123: 1561-1566.
Lack, L, Miller, W and Turner, D 1988, ‘A survey of sleeping difficulties in an Australian
population’, Community Health Studies, 12(2): 200-7.
Lee, HB, Hening, WA and Allen, RP 2008, ‘Restless legs syndrome is associated with DSM-IV
major depressive disorder and panic disorder in the community’, Journal of
Neuropsychiatry Clinical Neuroscience, 20(1): 101-105.
Lees, M, Roberts, G, Tabberer, M et al 2008, ‘Cost-effectiveness of licensed treatment
options for restless legs syndrome in the UK and Sweden’, Current Medical Research
and Opinion, 24(10): 2919-2930.
Leger D, Guilleminault, C, Bader, G et al 2002, ‘Medical and socio-professional impact of
insomnia’, Sleep, 25(6): 625-629.
Leger, D, Massuel, MA and Metlaine, A 2006, ‘Professional correlates of insomnia’, Sleep,
29(2): 171-178.
Leger, D, Scheuermaier, K, Phillip, P et al 2001, ‘SF-36: evaluation of quality of life in severe
and mild insomniacs compared with good sleepers’, Psychosomatic Medicine, 63: 49-
55.
Lindberg, E, Carter, N, Gislaso, T et al 2001, ‘Role of snoring and daytime sleepiness in
occupational accidents’, American Journal of Respiratory Critical Care Medicine, 164:
2031-2035.
Lindberg, E, Gislason, T 2000, ‘Epidemiology of sleep-related obstructive breathing’, Sleep
Medicine Review, 4: 411-433.

Re-awakening Australia
117 Deloitte Access Economics
Loghmanee, PA and Sheldon, SH 2010, ‘Pediatric obstructive sleep apnea: an update’,
Pediatric Annals, 39(12): 784-789.
Luo, N, Johnson, JA, Shaw, JW et al 2005, ‘Self-reported health status of the general adult
U.S. Population as assessed by the EQ-5D and health utilities index’, Medical Care,
43(11): 1078-1086.
Magee, CA, Iverson, DC and Caputi, P 2010, ‘Sleep duration and obesity in middle-aged
Australian adults’, Obesity Journal, 18(2): 420-421.
Marshall, NS, Wong KH, Liu, PY et al 2009, ‘Sleep apnea as an independent risk factor for all-
cause mortality: the Busselton Health Study’, Sleep, 31(8): 1079-1085.
Marshall, NS, Wilsmore, B, McEvoy, D, et al 2007, ‘Polysomnography in Australia—trends in
provision’, Journal of Clinical Sleep Medicine, 3(3): 281-284.
McArdle, N, Devereux, G, Heidarnejad, H, Engleman, HM, Mackay ,TW and Douglas, NJ,
‘Long-term use of CPAP therapy for sleep apnea/hypopnea syndrome’, American
Journal of Respiratory and Critical Care Medicine, 159:1108–14.
McDaid, C, Griffin, S, Weatherly, H et al 2009, ‘Continuous positive airway pressure devices
for the treatment of obstructive sleep apnoea-hypoapnea syndrome: a systematic
review and economic analysis’, Health Technology Assessment, 13:4.
MacMahon, S, Peto, R and Cutler, J et al 1990, ‘Blood pressure, stroke and coronary heart
disease. Part 1, prolonged differences in blood pressure: prospective observational
studies corrected for the regression diluation bias’, The Lancet, 335:765-774.
McNicholas, WT and Bonsignore, MR 2007, ‘Sleep apnoea as an independent risk factor for
CVD: current evidence, basic mechanisms and research priorities’, European
Respiratory Journal, 29: 159-178.
Mant, A, King, M, Saunders, N et al 1995, ‘Four year follow-up of mortality and sleep-
related respiratory disturbance in non-demented seniors’, Sleep, 18: 433-438.
Mar, J, Rueda, JR and Duran-Cantolla, J 2003, ‘The cost-effectiveness of nCPAP treatment in
patients with moderate-to-severe obstructive sleep apnoea’, European Respiratory
Journal, 21: 515-522.
Marcus, CL 2001 ‘Sleep-disordered breathing in children’ American Journal of Respiratory
Critical Care Medicine, 164: 16-30.
Marin, JM, Carrizo, SJ, Vincente, E et al 2005, ‘Long-term cardiovascular outcomes in men
with obstructive sleep apnoea-hypopnoea with or without treatment with
continuous positive airway pressure: an observational study’, Lancet, 365: 1046-
1053.
Mathers, C, Vos, T, Stevenson, C 1999, The burden of disease and injury in Australia, AIHW
Cat No PHE 17.

Re-awakening Australia
118 Deloitte Access Economics
Mathur, S 2002, Epidemic of coronary heart disease and its treatment in Australia,
Australian Institute of Health and Welfare (AIHW), cat. no. CVD21, Canberra.
Medicare Australia 2011, Medicare item reports, https://www.medicareaustralia.gov.au/sta
tistics/mbs_item.shtml, accessed 1 June 2011.
Merlin, T, Liufu, Z and Wang, S 2010, Unattended sleep studies in the diagnosis and
reassessment of obstructive sleep apnea, MSAC application 1130, Assessment Report,
Commonwealth of Australia, Canberra, ACT.
Mooe, T, Franklin, K, Holmstrom, K et al 2001, ‘Sleep disordered breathing and coronary
artery disease: long-term prognosis’, American Journal of Respiratory Critical Care
Medicine, 164: 1910-1913.
Mooe, T, Gullsby, S, Rabben, T et al 1995, ‘Sleep-disordered breathing: a novel predictor of
atrial fibrillation after coronary artery bypass surgery’, Coronary Artery Disease, 7:
475-478.
Montplaisir, J, Boucher, S, Poirier, G et al 1997, ‘Clinical, polysomnographic, and genetic
characteristics of restless legs syndrome: a study of 133 patients diagnosed with new
standard criteria’, Movement Disorders, 12(1): 61-65.
MSAC (Medical Services Advisory Committee) 2010, Application No. 1130 – unattended
sleep studies in the diagnosis and reassessment of obstructive sleep apnoea,
http://www.msac.gov.au/internet/msac/publishing.nsf/Content/BAE45713D7D0FDE
BCA257817001CB46D/$File/1130_MSAC_PSD.pdf, accessed 6 June 2011.
Mulgrew, AT, Nasvadi, G, Butt, A et al 2007, ‘Risk and severity of motor vehicle crashes in
patients with obstructive sleep apnoea/hypopnoea’, Thorax, 63: 536-541.
Murray, C and Acharya, AK 1997, ‘Understanding DALYs’, Journal of Health Economics, 16:
703-730.
Murray, C, Lopez, A 1997, ‘Alternative projections of mortality and disability by cause 1990-
2020: Global Burden of Disease Study’, Lancet, 349: 1498-1504.
Musci, I, Molnar, MZ, Ambrus, C 2005, ‘Restless legs syndrome, insomnia and quality of life
in patients on maintenance dialysis’, Nephrology Dialysis Transplantation, 20: 571-
577.
National Commission on Sleep Disorders Research 1993, Wake up America: a national sleep
alert, Report to the United States Congress and the Secretary US Department of
Health and Human Services, January.
National Health Service 2008, Continuous positive airway pressure for obstructive sleep
apnoea/hypopnoea syndrome ,Understanding NICE guidance, National Institute for
Health and Clinical Excellence.
National Stroke Foundation 2011, Facts, figures and statistics, http://www.strokefoundatio
n.com.au/facts-figures-and-stats, accessed on 11 March 2011.
Re-awakening Australia
119 Deloitte Access Economics
Naughton, M and Pierce, R 1991, ‘Sleep apnoea’s contribution to the road toll’, Australian
and New Zealand Journal of Medicine, 21: 833-834.
Nichol, MB, Sengupta, N and Globe DR 2001, ‘Evaluating quality-adjusted life years:
estimation of the health utility index (HUI2) from the SF-36’, Medical Decision
Making, 21: 105-112.
Nieto, F, Young, T, Lind, B et al 2000, ‘Association of sleep-disordered breathing, sleep
apnea, and hypertension in a large community-based study’, Journal of the American
Medical Association, 283: 1829-1836.
O’Brien, LM, Holbrook, CR, Mervis, CB et al 2003, ‘Sleep and neurobehavioral
characteristics of 5- to 7-year-old children with parentally reported symptoms of
attention-deficit/hyperactivity disorder’, Pediatrics, 111: 554-563.
O’Connor, GT, Caffo, B, Newman, AB et al 2009, ‘Prospective study of sleep-disordered
breathing and hypertension: the sleep heart health study’, American Journal of
Respiratory and Critical Care Medicine, 12: 1129-1164.
Ohayon, MM 1997, ‘Prevalence of DSM-IV diagnostic criteria of insomnia: distinguishing
insomnia related to mental disorders from sleep disorders’, Journal of Psychiatric
Research, 31(3): 333-346.
Ohayon, MM, Caulet, M, Priest, RG et al 1997a, ‘DSM-IV and ICSD-90 insomnia symptoms
and sleep dissatisfaction’, The British Journal of Psychiatry, 17(10): 382-388.
-M, Philip, P 1997b, ‘How sleep and mental disorders are related to complaints of
daytime sleepiness’, Archives of Internal Medicine, 157: 2645-2652.
Ohayon, MM, Partinen, M 2002, ‘Insomnia and global sleep dissatisfaction in Finland’,
Journal of Sleep Research, 11(4): 339-346.
Ohayon, MM, Reynolds, CF 2009, ‘Epidemiological and clinical relevance of insomnia
diagnosis algorithms according to the DSM-IV and the International Classification of
Sleep Disorders (ICSD)’, Sleep Medicine, 10(9): 952-960.
Ohayon, MM, Roth, T 2002, ‘Prevalence of restless legs syndrome and periodic limb
movement disorder in the general population’, Journal of Psychomatic Research,
53(1): 547-554.
Office of Best Practice Regulation (OBPR) 2008, Best practice regulation guidance note:
Value of a statistical life, Department of Finance and Deregulation, http://www.finan
ce.gov.au/obpr/docs/ValuingStatisticalLife.pdf, accessed 13 May 2011.
Partinen M and Guilleminault, C 1990, ‘Daytime sleepiness and vascular morbidity at seven-
year follow-up in obstructive sleep apnea patients’, Chest, 97: 27–32.
Partinen, M, Jamieson, A and Guilleminault, C 1988, ‘Long-term outcome for obstructive
sleep apnea syndrome patients: mortality’, Chest, 94: 1200-1204.

Re-awakening Australia
120 Deloitte Access Economics
Patel, SR and Hu, FB 2008, ‘Short sleep duration and weight gain: a systematic review’,
Obesity, 16(3): 643-653.
Peker, Y, Carlson, J and Hedner, J 2006, ‘Increased incidence of coronary artery disease in
sleep apnoea: a long-term follow-up’, European Respiratory Journal, 28(3): 596-602.
Peker, Y, Hedner, J, Kraiczi, H et al 2000, ‘Respiratory disturbance index: an independent
predictor of mortality in coronary artery disease’, American Journal of Respiratory
and Critical Care Medicine, 162: 81-86.
Peppard, P 2009, ‘Is obstructive sleep apnea a risk factor for hypertension?—Differences
between the Wisconsin Sleep Cohort and the Sleep Heart Health Study’, Journal of
Clinical Sleep Medicine, 5(5): 404-405.
Peppard, P, Szklo-Coxe, M, Mae, K et al 2006, ‘Longitudinal association of sleep-related
breathing disorder and depression’, Archives of Internal Medicine, 16: 1709-1715.
Peppard, P, Young, T, Palta, M et al 2000, ‘Prospective study of the association between
sleep-disordered breathing and hypertension’, New England Journal of Medicine,
342: 1378-1384.
Philip, P and Akerstedt, T 2006, ‘Transport and industrial safety, how are they affected by
sleepiness and sleep restriction?’, Sleep Medicine Reviews, 10: 347-356.
Philip, P, Sagaspe, P, Lagarde, E et al 2010, ‘Sleep disorders and accidental risk in a large
group of regular registered highway drivers’, Sleep Medicine, 11: 973-979.
Phillips, B, Hening, W, Britz, P et al 2006, ‘Prevalence and correlates of restless legs
syndrome’, Chest, 129(1): 76-80.
Phillips, B, Mannino, DM 2007, ‘Do insomnia complaints cause hypertension or
cardiovascular disease?’, Journal of Clinical Sleep Medicine, 3(5): 489-494.
Picchietti, D, Allen, RP, Walters, AS et al 2007, ‘Restless legs syndrome: prevalence and
impact in children and adolescents–the Peds REST study’, Pediatrics, 120: 253-266.
Picchietti, D and Winkelman, JW 2005, ‘Restless legs syndrome, periodic limb movements in
sleep and depression’, Sleep, 28(7): 891-898.
Pierce, RJ 1999, ‘Driver sleepiness: occupational screening and the physician's role’,
Australian and New Zealand Journal of Medicine Editorial, 29(5): 658-661.
Porthan, KH, Melin, JH, Kupila, JT et al 2004, ‘Prevalence of sleep apnea syndrome in lone
atrial fibrillation: a case-control study’, Chest, 125(3): 879-885.
Productivity Commission 2003, Evaluation of the Pharmaceutical Industry Investment
Program, Research Report, AusInfo, Canberra.
Punjabi, NM 2008, ‘The epidemiology of adult obstructive sleep apnea’, Proceedings of the
American Thoracic Society, 5: 136-143.

Re-awakening Australia
121 Deloitte Access Economics
Punjabi, NM, Caffo, BS, Goodwin, JL et al 2009, ‘Sleep-disordered breathing and mortality: a
prospective cohort study’, PLOS Medicine, 6(8): 1-9.
Punjabi, NM, Shahar, E, Redline, S et al 2004, ‘Sleep-disordered breathing, glucose
intolerance, and insulin resistance’, American Journal of Epidemiology, 160(6): 521-
530.
Punjabi, NM, Sorkin, JD, Katzel, LI et al 2002, ‘Sleep disordered breathing and insulin
resistance in middle aged and overweight men’, American Journal of Respiratory
Critical Care Medicine, 165: 677-682.
Ram, S, Seirawan, H, Kumar, SKS et al 2010, ‘Prevalence and impact of sleep disorders and
sleep habits in the United States’, Sleep Breath, 14: 63-70.
Redline, S, Yenokyan, G, Gottlieb, D et al 2010, ‘Obstructive sleep apnea-hypopnea and
incident stroke: the sleep heart health study’, American Journal of Respiratory and
Critical Care Medicine, 182: 269-277.
Reichmuth, KJ, Austin, D and Skatrud, JD 2005, ‘Association of sleep apnea and type II
diabetes: a population based study’, American Journal of Respiratory Critical Care
Medicine, 172: 1590-1595.
Reserve Bank of Australia 2011a, Exchange Rate Data, http://www.rba.gov.au/statistics/his
t-exchange-rates/index.html, accessed 02 June 2011.
2011b, Wage price index –labour costs-G06, http://www.rba.gov.au/statistics/by-
subject.html, accessed 02 June 2011.
Resnick, HE, Redline, S, Shahar, E, et al 2003, ‘Diabetes and sleep disturbances: findings
from the sleep heart study’, Diabetes Care, 26: 702-709.
Reynolds, C, Christiansen, C, Taska, L et al 1983, ‘Sleep in narcolepsy and depression. Does
it look alike?’, The Journal of Nervous and Mental Disease, 171: 290-295.
Rice, TM, Peek-Asa, C, Kraus, JF 2003, ‘Nighttime driving, passenger transport, and injury
crash rates of young drivers’, Injury Prevention, 9(3): 245-250.
Roberts, R, Shema, S, Kaplan, G et al 2000, ‘Sleep complaints and depression in an aging
cohort: a prospective perspective’, American Journal of Psychiatry, 157: 81-88.
Roth, B and Nevsimalova, S 1975, ‘Depression in narcolepsy and hypersomnia’, Schweiz
Arch Neurol Neurochir Psych, 116: 291–300.
Roth, T 2007, ‘Insomnia: Definition, Prevalence, Etiology and Consequences’, Journal of
Clinical Sleep Medicine, 3(5): S7-S10.
Saarenpaa-Heikkila, O, Laippala, P and Koivikko, M 2000, ‘Subjective daytime sleepiness in
schoolchildren’, Family Practice, 17: 129–133.
Safe Work Australia 2011, National Data Set for Compensation-based statistics,
http://nosi.ascc.gov.au/, accessed 10 May 2011.

Re-awakening Australia
122 Deloitte Access Economics
-2010, Work-related traumatic injury fatalities, Australian 2007-08,
-2009, The cost of work-related injury and illness for Australian employers, workers
and the community: 2005-06, Australian Safety and Compensation Council.
Sassani, A, Findley, LJ, Kryger, M et al 2004, ‘Reducing motor-vehicle collisions, costs, and
fatalities by treating obstructive sleep apnea syndrome’, Sleep, 27(3): 453-458.
Saunamäki, T and Jehkonen, M 2007, ‘Depression and anxiety in obstructive sleep apnea
syndrome: a review’, Acta Neurologica Scandinavica, 116: 277–288.
Scott, HM, Scott, WG and Mihaere, K 2007, ‘Economic evaluation of the treatment of
obstructive sleep apnoea syndrome in Aeotearea/New Zealand’, International Review
of Business Research Papers, 3(2): 237-261.
Shah, NA, Yaggi, HK and Concato, J 2010, ‘Obstructive sleep apnoea as a risk factor for
coronary events or cardiovascular death’, Sleep Breath, 14: 131-136.
Shahar, E, Whitney, C, Redline, S et al 2001, ‘Sleep-disordered breathing and cardiovascular
disease: cross-sectional results of the Sleep Heart Health Study’, American Journal of
Respiratory and Critical Care Medicine, 163: 19-25.
Sharma, SK, Kumpawat, S, Banga, A et al 2006, ‘Prevalence and risk factors of obstructive
sleep apnea syndrome in a population of Delhi, India’, Chest, 130(1): 149-156.
Shaw, JE, Punjabi, NM, Wilding, JP et al 2008, ‘Sleep-disordered breathing and type 2
diabetes: a report from the International Diabetes Federation Taskforce on
Epidemiology and Prevention’, Diabetes Research and Clinical Practice, 81(1): 2-12.
Simon, H (eds) 2009, Obstructive sleep apnea – treatment, University of Maryland Medical
Center, http://www.umm.edu/patiented/articles/continuous_positive_airflow_press
ure_cpap_devices_used_sleep_apnea_000065_8.htm, accessed 14 May 2011.
Snedecor, SJ, Botteman, MF and Bojke, C 2009, ‘Cost-effectiveness of Eszopiclone for the
treatment of adults with primary chronic insomnia’, SLEEP, 32(6): 817-824.
Spiegelhalder, K, Scholtes, C and Riemann, D 2010, ‘The association between insomnia and
cardiovascular diseases’, Nature and Science of Sleep, 2: 71-78.
Stewart, MD, Besset, A and Bebbington, P 2006, ‘Insomnia comorbidity and impact and
hypnotic use by age groups in a national survey population aged 16 to 74 years’,
Sleep, 29(11): 1391-1397.
Stouthard, M, Essink-Bot, ML, Bonsel, GJ et al 1997, Disability weights for diseases in the
Netherlands, http://dare.uva.nl/en/record/30262, accessed 24 March 2011.
Stradling, J, Thomas, G, Warley, A et al 1990, ‘Effects of adenotonsillectomy on behaviour
and psychological functioning’, European Journal of Pediatrics, 155: 56–62.
Stuart, C 1984, ‘Welfare costs per dollar of additional tax revenue in the United States’,
American Economic Review, 74(3): 352-362.

Re-awakening Australia
123 Deloitte Access Economics
Sucena, M, Liistro, G, Aubert, G, Rodenstein, G and Pieters, T 2006, ‘Continuous positive
airway pressure treatment for sleep apnoea: compliance increases with time in
continuing users’, European Respiratory Journal, 27: 761–766.
Sullivan, PW and Ghushchyan, V 2006, ‘Preference-based EQ-5D index scores for chronic
conditions in the United States’, Medical Decision Making, 26:410–20.
Swanson , J Arnedt,T, Rosekind, M, et al 2011, ‘Sleep disorders and work performance:
findings from the 2008 National Sleep Foundation Sleep in America poll’, Journal of
Sleep Research, Journal of Sleep Research, 20( 3): 487–494.
Taheri, S, Lin, L, Austin, D et al 2004, ‘Short sleep duration is associated with reduced leptin,
elevated ghrelin and increased body mass index’, PLOS Medicine, 1(3): 210-217.
Tasali, E and Ip, MSM 2008, ‘Obstructive sleep apnea and metabolic syndrome: alterations
in glucose metabolism and inflammation’, Proceedings of the American Thoracic
Society, 5: 207-217.
Teng, AY, Betts, G, Williamson, B et al 2003, ‘Sleep-disordered breathing and
neurocognitive function in children’, Sleep Medicine, 4S1: S46: A214.
Teran-Santos, J, Jimenez-Gomez, A, Cordero-Guevara, J 1999, ‘The association between
sleep apnoea and the risk of traffic accidents’, New England Journal of Medicine, 340:
847-851.
The AusDiab Report 2001, Diabetes and associated disorders in Australia- 2000, the
accelerating epidemic: the Australian Diabetes, Obesity and Lifestyle Study (AusDiab),
http://www.diabetes.com.au/pdf/AusDiab_Report.pdf, accessed 10 March 2011.
Thrift, AG, Dewey, HM, Macdonell, RA et al 2000, ‘Stroke incidence on the east coast of
Australia’, Stroke, 31: 2087-2092.
Tousignant, P, Cosio, MG, Levy, RD et al 1994, ‘Quality adjusted life years added by
treatment of obstructive sleep apnea’, Sleep, 17(1): 52-60.
Treasury 2008, Architecture of Australia’s tax and transfer system, http://taxreview.treasur
y.gov.au/content/downloads/report/Architecture_of_Australias_Tax_and_Transfer_
System_Revised.pdf, accessed 23 January 2011.
Udwadia, ZF, Doshi, AV, Lonkar, SG and Singh, CI 2004, ‘Prevalence of sleep disordered
breathing and sleep apnea in middle-aged urban Indian men’, American Journal of
Respiratory Critical Care Medicine; 169:168–173.
Ulfberg, J, Carter, N and Edling, C 2000, ‘Sleep-disordered breathing and occupational
accidents’, Scandanavian Journal of Work Environment and Health, 26(3): 237-242.
Urschitz, MS, Guenther, A, Eggebrecht, A et al 2003, ‘Snoring, intermittent hypoxia and
academic performance in primary school children’, American Journal of Respiratory
Critical Care Medicine, 168: 464-468.

Re-awakening Australia
124 Deloitte Access Economics
Valham, F, Mooe, T, Rabben, T et al 2008, ‘Increased risk of stroke in patients with coronary
artery disease and sleep apnea: a 10 year follow up’, Circulation, 118: 955-960.
Van den Berg B, Brouwer W, van Exel J, Koopmanschap M, van den Bos GAM, and Rutten, F
2006, ‘Economic valuation of informal care: Lessons from the application of the
opportunity cost and proxy good methods’, Social Science & Medicine, 62:835-845.
Vandeputte, M and de Weerd, A 2003, ‘Sleep disorders and depressive feelings: a global
survey with the Beck depression scale’, Sleep Medicine, 4: 343-345.
Walsh, KJ and Engelhardt, LC 1999, ‘The direct economic costs of insomnia in the United
States for 1995’, Sleep, 22(2): 386-393.
Walters, AS, Mandelbaum, DE, Lewin, DS et al 2000, ‘Dopaminergic therapy in children with
restless legs/periodic limb movements in sleep and ADHD’, Pediatric Neurology, 22:
182-186.
Watson, R, Greenberg, G and Bakos, L 1987, ‘Sleep apnea and depression’, Sleep Research,
16: 293.
Watson, NF and Mystkowski, SK 2008, ‘Aerophagia and gastroesophageal reflux disease in
patients using continuous positive airway pressure: a preliminary observation’,
Journal of Clinical Sleep Medicine, 4(5):434-438.
Wells, R, Freedland, K, Carney, R et al 2007, ‘Adherence, reports of benefits, and depression
among patients treated with continuous positive airway pressure, Psychosomatic
Medicine, 69:449–454.
Winkelman, J, Prager, M and Lieb, R 2005, ‘Anxietas Tibiarum: depression and anxiety
disorders in patients with restless legs syndrome’, Journal of Neurology, 252: 67-71.
Winkelman, J, Shahar, E and Sharief, I 2008, ‘Association of restless legs syndrome and
cardiovascular disease in the Sleep Heart Health Study’, Neurology, 70: 35-42.
Wolk, R, Kara, T and Somers, V 2003, ‘Sleep-disordered breathing and cardiovascular
disease”, Circulation, 108(1): 9-12.
World Health Organization (WHO) 2011, Choosing interventions that are cost-effective
(WHO CHOICE), cost effectiveness thresholds, http://www.who.int/choice/costs/CER_
thresholds/en/index.html, accessed March 20, 2011.
-2004, Global burden of disease 2004 update: disability weights for diseases and cond
itions, http://www.who.int/healthinfo/global_burden_disease/GBD2004_DisabilityW
eights.pdf accessed 24 March 2011.
-1992, The ICD-10 Classification of mental and behavioural disorders,
Yaggi, HK, Concato, J and Kernan, WN 2005, ‘Obstructive sleep apnea as a risk factor for
stroke and death’, New England Journal of Medicine, 353: 2034-2041.

Re-awakening Australia
125 Deloitte Access Economics
Yee, B and Killick, R 2009, ‘Restless legs syndrome’, Australian Family Physician, 38(5): 296-
300.
Young, T 2009, ‘Rationale, design and findings from the Wisconsin Sleep Cohort Study:
toward understanding the total societal burden of sleep-disordered breathing’, Sleep
Medicine Clinics, 4: 37-46.
Young, T, Finn, L, Peppard, PE et al 2008, ‘Sleep disordered breathing and mortality:
eighteen-year follow-up of the Wisconsin Sleep Cohort’, SLEEP, 31(8): 1071-1078.
Young, T, Palta, M, Dempsey, J, Skatrud, J, Weber, S and Badr, S 1993, ‘The occurrence of
sleep-disordered breathing among middle-aged adults’, New England Journal of
Medicine, 328(17): 1230-1235.
Young, T, Peppard, P and Gottlieb, D 2002, ‘Epidemiology of obstructive sleep apnea – a
population health perspective’, American Journal of Respiratory Critical Care
Medicine, 165: 1217-1239.
Young, T, Peppard, P, Taheri, S 2005, ‘Excess weight and sleep-disordered breathing’,
Journal of Applied Physiology, 99: 1592-1599.

Re-awakening Australia
126 Deloitte Access Economics
Appendix A: Sleep disorder ICSD to
ICD-10 mapping International Classification of Sleep Disorders ICD-10 Code Name 1. Dyssomnias
A. Intrinsic Sleep Disorders
1. Psychophysiological Insomnia 307.42-0 F51.0 (Nonorganic Insomnia)
2. Sleep State Misperception 307.49-1 F51.8 (Other Nonorganic Sleep Disorder)
3. Idiopathic Insomnia 780.52-7 G47.0 (Disorders of Initiating and Maintaining Sleep
(Insomnias))
4. Narcolepsy 347 G47.4 (Narcolepsy and Cataplexy)
5. Recurrent Hypersomnia 780.54-2 G47.8 (Other Sleep Disorder)
6. Idiopathic Hypersomnia 780.54-7 G47.1 (Disorders of Excessive Somnolence
(Hypersomnias))
7. Posttraumatic Hypersomnia 780.54-8 G47.1 (Disorders of Excessive Somnolence
(Hypersomnias))
8. Obstructive Sleep Apnea
Syndrome
780.53-0 G47.3 (Sleep Apnea)
E66.2 (Pickwickian Syndrome)
9. Central Sleep Apnea Syndrome 780.51-0 G47.3 (Sleep Apnea)
R06.3 (Periodic Breathing)
10. Central Alveolar
Hypoventilation Syndrome
780.51-1 G47.3 (Sleep Apnea)
11. Periodic Limb Movement
Disorder
780.52-4 G25.8 (Other Specified Extrapyramidal and Movement
Disorders)
12. Restles Legs Syndrome 780.52-5 G25.8 (Other Specified Extrapyramidal and Movement
Disorders)
13. Intrinsic Sleep Disorder NOS
B. Extrinsic Sleep Disorders
1. Inadequate Sleep Hygiene 307.41-1 F51.078.8 (Nonorganic Insomnia)
2. Environmental Sleep Disorder 780.52-6 F51.078.8 (Nonorganic Insomnia)
3. Altitude Insomnia 289 G47.070.2 (Disorders of Initiating and Maintaining Sleep
(Insomnias))
4. Adjustment Sleep Disorder 307.41-0 F51.8 (Other Nonorganic Sleep Disorder)
5. Insufficient Sleep Syndrome 307.49-4 F51.8 (Other Nonorganic Sleep Disorder)
6. Limit-Setting Sleep Disorder 307.42-4 F51.8 (Other Nonorganic Sleep Disorder)
7. Sleep-Onset Association
Disorder
307.42-5 F51.8 (Other Nonorganic Sleep Disorder)
8. Food Allergy Insomnia 780.52-2 G47.078.4 (Disorders of Initiating and Maintaining Sleep
(Insomnias))
9. Nocturnal Eating (Drinking)
Syndrome
780.52-8 F50.8 (Other Eating Disorder )
10. Hypnotic-Dependent Sleep
Disorder
780.52-0 F13.2 (Dependence Syndrome)
11. Stimulant-Dependent Sleep
Disorder
780.52-1 F14.2 /
F15.2
(Dependant Syndrome)
12. Alcohol-Dependent Sleep
Disorder
780.52-3 F10.2 (Dependance Syndrome)
13. Toxin-Induced Sleep Disorder 780.54-6 F51.018.8 (Non-organic Insomnia)
14. Extrinsic Sleep Disorder NOS 780.52-9
C. Circadian Rythm Sleep
Disorders
1. Time Zone Change (Jet Lag)
Syndrome
307.45-0 G47.2 (Disorders of The Sleep-Wake Schedule)
2. Shift Work Sleep Disorder 307.45-1 G47.2 (Disorders of The Sleep-Wake Schedule)
3. Irregular Sleep-Wake Pattern 307.45-3 G47.2 (Disorders of The Sleep-Wake Schedule)
4. Delayed Sleep Phase Syndrome 780.55-0 G47.2 (Disorders of The Sleep-Wake Schedule)
5. Advanced Sleep Phase
Syndrome
780.55-1 G47.2 (Disorders of The Sleep-Wake Schedule)
6. Non-24-Hour Sleep-Wake 780.55-2 G47.2 (Disorders of The Sleep-Wake Schedule)

Re-awakening Australia
127 Deloitte Access Economics
Disorder
7. Circadian Rhythm Sleep Disorder
NOS
780.55-9
2. Parasomnias
A. Arousal Disorders
1. Confusional Arousals 307.46-2 F51.8 (Other Nonorganic Sleep Disorder)
2. Sleepwalking 307.46-0 F51.3 (Sleepwalking (Somnambulism))
3. Sleep Terrors 307.46-1 F51.4 (Sleep Terrors (Night Terrors))
B. Sleep-Wake Transition
Disorders
1. Rhythmic Movement Disorder 307.3 F98.4 (stereotyped movement disorder)
2. Sleep Starts 307.47-2 G47.8 (other sleep disorder)
3. Sleep Talking 307.47-3 F51.8 (other non-organic sleep disorder)
4. Nocturnal Leg Cramps 729.82 R25.2
C. Parasomnias usually
asscociated with REM Sleep
1. Nightmares 307.47-0 F51.5 (Nightmares)
2. Sleep Paralysis 780.56-2 G47.4 (Narcolepsy and Cataplexy)
3. Impaired Sleep-Related Penile
Erections
780.56-3 N48.4 (Other Disorders of Penis)
4. Sleep-Related Painful Erections 780.56-4 G47.048.8 (Disorders of Initiating and Maintaining Sleep
(Insomnias) Other Disorders of Penis)
5. REM Sleep Related Sinus Arrest 780.56-8 I46.8 (Cardiac Arrest)
6. REM Sleep Behavior Disorder 780.59-0 G47.8 (Other Sleep Disorder )
D. Other Parasomnias
1. Sleep Bruxism 306.8 F45.8 (Other Somatoform Disorder )
2. Sleep Enuresis 780.56-0 F98.0 (Nonorganic Enuresis )
3. Sleep-Related Abnormal
Swallowing Syndrome
780.56-6 F45.8 (Other Somatoform Disorder )
4. Nocturnal Paroxysmal Dystonia 780.59-1 G47.8 (Other Sleep Disorder)
5. Sudden Unexplained Nocturnal
Death Syndrome
780.59-3 R96.0 (Instantaneous Death)
6. Primary Snoring 780.53-1 R06.5 (Mouth Breathing)
7. Infant Sleep Apnea 770.8 P28.3 (Primary Sleep Apnoea of Newborn )
8. Congenital Central
Hypoventilation Syndrome
770.81 G47.3 (Sleep Apnoea)
9. Sudden Infant Death Syndrome 798 R95 (Sudden Infant Death Syndrome)
10. Benign Neonatal Sleep
Myoclonus
780.59-5 G25.8 (Other Specified Extrapyramidal and Movement
Disorders )
11. Other Parasomnia NOS 780.59-9
3. Medical/Psychiatric Sleep
Disorders
A. Associated with Mental
Disorders
1. Psychoses 292-299 F51.020-29 (Nonorganic Insomnia)
F51.120-29 (Nonorganic Hypersomnia)
2. Mood Disorders 296-301 F51.030-
F39
(Nonorganic Insomnia)
F51.130-
F39
(Nonorganic Hypersomnia)
3. Anxiety Disorders 300 F51.040-43 (Nonorganic Insomnia)
F51.140-43 (Nonorganic Hypersomnia)
4. Panic Disorder 300 F51.040/41 (Nonorganic Insomnia)
F51.140/41 (Nonorganic Hypersomnia)
5. Alcoholism 303 F10.8 (Other Mental and Behavioural Disorders)
B. Associated with Neurological
Disorders
1. Cerebral Degenerative Disorders 330-337 G47.084/G
10/G11/G2
4
(Disorders of Initiating and Maintaining Sleep
(Insomnias))
G47.184/G
10/G11/G2
4
(Disorders of Excessive Somnolence
(Hypersomnias))
2. Dementia 331 G47.001/G
30/G31/G9
(Disorders of Initiating and Maintaining Sleep
(Insomnias))

Re-awakening Australia
128 Deloitte Access Economics
1
G47.101/G
30/G31/G9
1
(Disorders of Excessive Somnolence
(Hypersomnias))
3. Parkinsonism 332-333 G47.020-23 (Disorders of Initiating and Maintaining Sleep
(Insomnias))
G47.120-23 (Disorders of Excessive Somnolence
(Hypersomnias))
4. Fatal Familial Insomnia 337.9 G47.8 (Other Sleep Disorder)
5. Sleep-Related Epilepsy 345 G40.8 (Other Epilepsy)
6. Electrical Status Epilepticus of
Sleep
345.8 G41.8 (Other Status Epilepticus)
7. Sleep-Related Headaches 346 G44.8 (Other Specified Headache Syndromes)
G47.043/G
44
(Disorders of Initiating and Maintaining Sleep
(Insomnias))
G47.143/G
44
(Disorders of Excessive Somnolence
(Hypersomnias))
C. Associated with Other Medical
Disorders
1. Sleeping Sickness 86 B56 (African Trypanosomiasis)
2. Nocturnal Cardiac Ischemia 411-414 I20 (Angina Pectoris)
I25 (Chronic Ischaemic Heart Disease)
3. Chronic Obstructive Pulmonary
Disease
490-494 G47.040-44 (Disorders of Initiating and Maintaining Sleep
(Insomnias))
4. Sleep-Related Asthma 493 G47.944/45
/67
(Sleep Disorder, Unspecified)
5. Sleep-Related Gastroesophageal
Reflux
530.1 G47.020/21 (Disorders of Initiating and Maintaining Sleep
(Insomnias))
6. Peptic Ulcer Disease 531-534 G47.025/26
/27
(Disorders of Initiating and Maintaining Sleep
(Insomnias))
7. Fibrositis Syndrome 729.1 G47.079.0 (Disorders of Initiating and Maintaining Sleep
(Insomnias))
4. Proposed Sleep disorders
1. Short Sleeper 307.49-0 F51.8 (Other Nonorganic Sleep Disorder)
2. Long Sleeper 307.49-2 F51.8 (Other Nonorganic Sleep Disorder)
3. Subwakefulness Syndrome 307.47-1 G47.8 (Other Sleep Disorder )
4. Fragmentary Myoclonus 780.59-7 G25.8 (Other Specified Extrapyramidal and Movement
Disorders)
5. Sleep Hyperhidrosis 780.8 R61 (Hyperhidrosis )
6. Menstrual-Associated Sleep
Disorder
780.54-3 N95.1 (Menopausal and Female Climacteric States)
G47.094 (Disorders of Initiating and Maintaining Sleep
(Insomnias))
7. Pregnancy-Associated Sleep
Disorder
780.59-6 G47.026.8 (Disorders of Initiating and Maintaining Sleep
(Insomnias))
8. Terrifying Hypnagogic
Hallucinations
307.47-4 F51.8 (Other Nonorganic Sleep Disorder)
9. Sleep-Related Neurogenic
Tachypnea
780.53-2 R06.8 (Other and Unspecified Abnormalities of
Breathing)
10. Sleep-Related Laryngospasm 780.59-4 F51.038.5 (Nonorganic Insomnia)
11. Sleep Choking Syndrome 307.42-1 F51.006.8 (Nonorganic Insomniather and Unspecified
Abnormalities of Breathing )
Note: Greyed ICD-10 codes were not included in the report. These were excluded because the sleep disorders
were captured in an ICD-10 category where sleep disorders comprised an undeterminable proportion of the
category.
Limitation of our work
General use restriction
This report is prepared solely for the use of the Sleep Health Foundation. This report is not intended to and should not be used or relied upon by anyone else and we accept no duty of care to any other person or entity. Selected passages, tables or diagrams may be reproduced provided acknowledgment of the source is included. Permission for any more extensive reproduction must be obtained from Deloitte Access Economics Pty Ltd.

Contact us
Deloitte Access Economics
ACN: 49 633 116
Level 1
9 Sydney Avenue
Barton ACT 2600
PO Box 6334
Kingston ACT 2604 Australia
Tel: +61 2 6175 2000
Fax: +61 2 6175 2001
www.deloitte.com/au/economics
Deloitte Access Economics is Australia’s pre-
eminent economics advisory practice and a
member of Deloitte's global economics
group. The Directors and staff of Access
Economics joined Deloitte in early 2011.
Deloitte refers to one or more of Deloitte Touche
Tohmatsu Limited, a UK private company limited
by guarantee, and its network of member firms,
each of which is a legally separate and
independent entity. Please see
www.deloitte.com/au/about for a detailed
description of the legal structure of Deloitte
Touche Tohmatsu Limited and its member firms.
About Deloitte
Deloitte provides audit, tax, consulting, and
financial advisory services to public and private
clients spanning multiple industries. With a
globally connected network of member firms in
more than 150 countries, Deloitte brings world-
class capabilities and deep local expertise to help
clients succeed wherever they operate. Deloitte's
approximately 170,000 professionals are
committed to becoming the standard of
excellence.
About Deloitte Australia
In Australia, the member firm is the Australian
partnership of Deloitte Touche Tohmatsu. As one
of Australia’s leading professional services firms.
Deloitte Touche Tohmatsu and its affiliates provide
audit, tax, consulting, and financial advisory
services through approximately 5,400 people
across the country. Focused on the creation of
value and growth, and known as an employer of
choice for innovative human resources programs,
we are dedicated to helping our clients and our
people excel. For more information, please visit
our web site at www.deloitte.com.au.
Liability limited by a scheme approved under Professional Standards Legislation.
Member of Deloitte Touche Tohmatsu Limited
© 2011 Deloitte Access Economics Pty Ltd


