Page 1
157
CHAPTER-5
RECEIVABLE MANAGEMENT
5.1 INTRODUCTION
5.2 GOALS OF RECEIVABLE MANAGEMENT
5.3 CREDIT PROCEDURE
5.4 TERMS OF PAYMENT
5.5 OPTIMUM CREDIT POLICY
5.6 CREDIT EVALUATION
5.7 CONTROL OF ACCOUNTS RECEIVABLE
Page 2
158
5.1 Introduction of Receivable Management Receivable is most prominent force of the modern business. It is considered as an
essential marketing tool, acting as a bridge for the movement of goods through production and
distribution stages to customers finally. A firm grants trade credit to protect it sale from the
competition and to attract the potential customers to buy it product at favorable term. When
the firm sells its product or services and does not receive cash for it immediately, the firm is
said to have granted trade credit to customers. Trade credit thus, creates receivable or book
debt, which the firm is expected to collect in the near future.
Receivable represents the amount due from customers (book debts) or debtors as a
result of selling goods on credit. The term debtors is defined as ‘debt’ owned to the firm by
customers arising from sale of goods or services in the ordinary course of business. The three
characteristics of receivables the element of risk, economic value and futurity explain the
basis and the need for efficient management of receivables. The element of risk should be
carefully analyzed. Cash sales are totally risk-less but not the credit sales, as the cash payment
has yet to be received. To the buyer the economic value in goods and services process
immediately at the time of sale, while the seller expect an equivalent value to be received
later on. The cash payment for goods and services received by the buyer will be made by him
in a future period. The customer from whom receivable or book debts have to be collected in
future are called Trade debtor and represent the firm’s claim on assets.
Receivable management, also termed credit management, deals with the formulation
of credit policy, in terms of liberal or restrictive, concerning credit standard and credit period,
the discount offered for early payment and the collection policy and procedures undertaken. It
does so in such a way that taken together these policy variables determines an optimal level of
investment in receivables where the return on that investment is maximum to the firm. The
credit period extended by business firm usually ranges from 15 to 60 days. When goods are
sold on credit, finished goods get converted into accounts receivable (trade debtors) in the
books of the seller. In the books of the buyer, the obligation arising from credit purchase is
represented as accounts payable (trade creditors). Accounts receivable is the total of all credit
extended by a firm to its customer.
A firms investment in accounts receivable depends upon how much it sells on credit
and how long it takes to collect receivable. Accounts receivable (or sundry debtors)
constitute the 3rd most important assets category for business firm after plant and equipment
Page 3
159
and inventories and also constitute the 2nd most important current assets category for business
firm after inventories.
Poor management of accounts receivable are : neglect of various overdue accounts,
sharp rise in the bad debt expense, and the collection of debts expense and taking the
discount by customers even though they pay after the discount date and even after that date.
Since accounts receivable represent a sizable investment on the part of most firms in the case
of public enterprises in India it forms 16 to 20 percent of current assets. Efficient management
of these accounts can provide considerable saving to the firm.
Factors involving in Receivable management:-
1. The terms of credit granted to customers deemed creditworthy.
2. The policies and practices of the firm in determining which customers are to be
granted credit.
3. The paying practices of credit customers.
4. the vigor of the sellers collection policies and practice.
5. The volume of credit sales.
5.2 Goals of Receivable Management:- The basic goal of credit management is to maximize the value of the firm by achieving
a trade off between the liquidity (risk and profitability). The purpose of credit management is
not to maximize sales, nor to minimize the risk of bad debt. If the objective were to maximize
sales, then the firm would sell on credit to all. On the contrary, if minimization of bad debt
risk were the aim, then the firm would not sell on credit to anyone. In fact, the firm should
manage its credit in such a way that sales are expanded to an extent to which risk remains
within an acceptable limit. Thus to achieve the goal maximizing the value, the firm should
manage its trade credit.
The efficient and effective credit management does help to expand sales and can prove
to be an effective tool of marketing. It helps to retain old customers and win new customers.
Well administrated credit means profitable credit accounts. The objectives of receivable
management is to promote sales and profits until that point is reached where the return on
investment is further funding of receivables is less than the cost of funds raised to finance that
additional credit.
Granting of credit and its management involve costs. To maximize the value of the
Page 4
160
firm, these cost must be controlled. These thus include the credit administration expenses, bad
debts losses and opportunity cost of the funds tied up in receivable. The aim of credit
management should be to regulate and control these cost, not to eliminate altogether. The cost
can be reduced to zero, if no credit is granted. But the profit foregone on the expected volume
of sales arising due to the extension of credit.
Debtors involve funds, which have an opportunity cost. Therefore, the investment in
receivables or debtors should be optimized. Extending liberal credit pushes sales and thus
results in higher profitability but the increasing investment in debtors results in increasing
cost. Thus a trade off should be sought between cost and benefits to bring investment in
debtors at an optimum level. Of course the level of debtors, to a great extent is influenced by
external factors such as industry norms, level of business activity, seasonal factors and the
degree of completion. But there are several internal factors which includes credit terms,
standards, limits and collection procedures. The internal factors should be well administered
to optimize the investment in debtors.
5.3 Credit procedure For effective management of credit, the firm should lay down clear-cut guidelines and
procedures for granting credit to individual customer and collecting the individual accounts.
The firm should not follow the policy of treating all customers equal for the purpose of
extending credit. The credit evaluation procedure of the individual accounts should involve
the following steps :
(1) Credit information :-
In extending credit to the customers, firm would ensure that receivables are collected
in full and on the due date. As discussed earlier, investment in receivables involves costs. If
the firm fails to collect its receivables, there is a greater loss to the firm-loss of bad debt and
cost of investment. Therefore, credit should be granted to those customers who have the
ability to make payment on the due date. Collecting credit information involves expenses. The
cost of collecting information should, therefore, be less than the potential profitability. In
addition to cost, the time required to collect information should also be considered. The
decision to grant credit cannot be delayed for long because of the time involved in collection
the credit information. Depending on these two factors of time and cost, any or a combination
of the following sources may be employed to collect the information.
(a) financial statement:-
Page 5
161
One of the easiest way to obtain information regarding the financial condition and
performance of the prospective customer is to scrutinize his financial statements-balance sheet
and the profit and loss account.
(b) Bank references :-
Another source of collecting credit information is the bank where the customer maintains his
account. The firm should seek to obtain the information through its bank. Alternatively, the
customer can be requested to instruct its banker to provide information required by the firm.
Then, the firm can approach the bank. But in India the bankers do not give very clear answers
to the enquiries made by the firm.
(c) Trade references :-
The firm can ask the prospective customer to give trade references. The firm may
insist to give the names of such persons or firms with whom the customer has current
dealings. This is a useful source to obtain credit information at no cost. Many times a sources
to obtain credit information at no cost. Many times a customer can furnish misleading
references. To guard against this, the honesty and seriousness of the referee should be
examined.
(d) Credit bureau reports :-
To get comprehensive and correct information, credit bureau organizations which specialize
in providing credit information, are employed in the advanced countries. In India also there is
urgent need for such organizations. To begin with, the various trade associations and
chambers of commerce can be developed to provide the useful credit information to their
members.
(e) Prices and Yields on Securities :-
For listed companies, valuable references can be derived from stock market data. Higher price
earning multiple an lower the yield on bank , other thing being equal lower will be the credit
risk.
2. Credit investigation
After having obtained the credit information, the firm will get an idea regarding the
matters which should be further investigated. The factors that affect the extent and nature of
credit investigation are.
(i) New or existing customers.
(ii) Business line, background and the related trade risk of customers.
Page 6
162
(iii) Perishable or seasonal product.
(iv) Credit policies and practices of company.
The firm which is up-to date in credit management, can maintain each customer’s
credit file. A regular examination of the customer’s credit file will reveal to the firm the credit
standing of the customer. Credit investigation involves cost. Credit decision without adequate
investigation can be more expensive in terms of excessive collection costs and possible bad
debt losses. Credit investigation should be carried so long as the saving in terms of speedy
collections and prevention of bad debt losses resulting from it exceed its costs.
3. Credit analysis :-
In the sequence of the credit appraisal, the next step is to conduct the credit analysis of
the applicant. The evaluation of the applicant’s financial conditions should be done very
carefully. The applicant should be asked to provide the financial statements which will form
a basis to analyses the performance and trends of the applicant’s business activities.
4. Credit limit :-
Once the firm has taken a decision to extend credit to the applicant, the amount and
duration of the credit have to be decided. The decision on the magnitude of credit will depend
upon the amount of contemplated sale and the customer’s financial strength. The credit line
must be reviewed periodically in order to know the development in the account. The
tendencies of slow paying are found, the credit line can be revised downward. A customer
may ask for the amount of credit in excess of his credit line. The firm has not only to
determine the amount of credit but also the duration of credit. Keeping in view the industry
norm, the normal collection period should be determined.
5. Collection procedures :-
The collection procedures of the firm should be clear-cut and well- administered. The
purpose of collections policy should be to speed up the collection of dues. If collection are
delayed, alternative arrangement of finance to sustain production and sales will have to be
made. The chances of bad debts also increase as the collection is delayed.
5.4 Terms of payment:-
The seller has financial soundness, it may extend liberal credit to the buyer. Most
commonly however, some arrangement is in between chosen wherein the trade cycle is
financed partly be the seller, partly by the buyer and partly by some financial intermediary.
The major terms of payment are discussed below.
Page 7
163
(i) Cash terms-when goods are sold on cash terms, the payment is received either
before the goods are shipped or when the goods are delivered.
(ii) Open account- In this term, the seller first sends the goods and then sends the
invoice (bill). The credit term are stated in invoice which is acknowledged by the
buyer. There is no formal acknowledgement of indebt ness by the buyer.
(iii) Credit period: - Length of time. The customers are allowed to pay of its
purchases. It is defined in days.
(iv) Cash discount :- Firms generally offer cash discount to induce customers to
make prompt payment it refer in %
(v) Billings: - to streamline billings, it is a common practice to send a single bill
every month.
(vi) Consignment: - When goods are sent on consignment, they are merely shipped
but not sold to the consignee. The consignee acts as an agent to the seller
((consigner). The title of the goods is retained by the seller till they are sold by
the consignee to a third party. Periodically, sales proceeds are remitted by the
consignee to a seller.
(vii) Draft :- it is represent an unconditioned order issued by the seller asking the
buyer to pay on demand (demand draft) or at a certain future date (time draft),
the amount specified on it
(viii) Letter of credit: - It is issued by a bank on behalf of the customer (buyer) to the
seller. As per this documents, the bank agrees to honour drafts drawn on it for
the supplies made to the customer if the seller fulfill the conditions laid down in
the L/C.
(ix) Revolving Charge Plan: - The charge card phenomenon has become very
popular for financing purchases of a variety of customers items. American
express, Visa, Mster card and similar plans require an individual to provide
detailed background information and a signed request for credit on demand. If
the application is approved, a card is issued; it allows the individual to provide
detailed background information and a signed request for credit on demand. If
the application is approved, a card is issued; it allows the individual to make
credit purchases by showing the card and signing a draft. The draft becomes a
formal not acknowledging the debt.
Page 8
164
5.5 Optimum credit policy
Credit policy refers to those decision variables that influence the amount of trade
credit i.e. the investment in receivables. The firm’s investment in receivable are affected by
general economic conditions, industry norms, pace of technological change, competition etc.
Though the firm has no control on these factors, yet they have a great impact on it and it can
certainly influence the level of trade credit through its credit policy within their constraints
imposed externally. The purpose of any commercial enterprise is the earning of profit. Credit
itself is utilized to increase sales, but sales must return a profit. Further, whenever some
external factors change, the firm can accordingly to administer credit and collection polices
may be assigned to a financial executive or marketing executive or both of them jointly
depending upon the original structure and the objectives of the firm.
Different types of Credit Policies are :-
1. Loose or Expansive Credit Policy:- Firms following this policy tend to sell on credit to
customers very liberally. Credit are granted even to those whose credit worthiness is
not proved, not known and are doubtful.
Advantages of Loose or Expansive Credit Policy :’
(i) Increase in sales (higher sales).
(ii) Increase in profit (higher profit),
Disadvantages of Loose or Expansive Credit Policy:’
(iii) Heavy bad/debts.
(iv) Problem of liquidity
(v) Increase in cost of credit management.
2. Tight or Restrictive Credit Policy: - Firms following this policy are very selective in
extending credit. They sell on credit, only to those customers who had proved credit
worthiness.
Advantages of tight or restrictive credit policy:-
(i) minimize cost
(ii) Minimize chances of bad debts.
(iii) Higher sales in long run.
(iv) Higher profit in long run.
(v) Do not pose the serious problem of liquidity
Disadvantages of Tights or Restrictive Credit Policy:-
Page 9
165
(i) Sales may decrease.
(ii) Restrict Profit Margin.
(iii) Cordial business relationships can not be maintained
Benefits of credit extension:-
(i) Increases the sales of the firm.
(ii) Makes the credit policy liberal.
(iii) Increase the profits or the firm.
(iv) The market value of the firms share would rise.
Cost of credit Extension:-
(i) Bad debt losses
(ii) Production and selling cost.
(iii) Administrative expenses.
(iv) Cash discounts and opportunity cost.
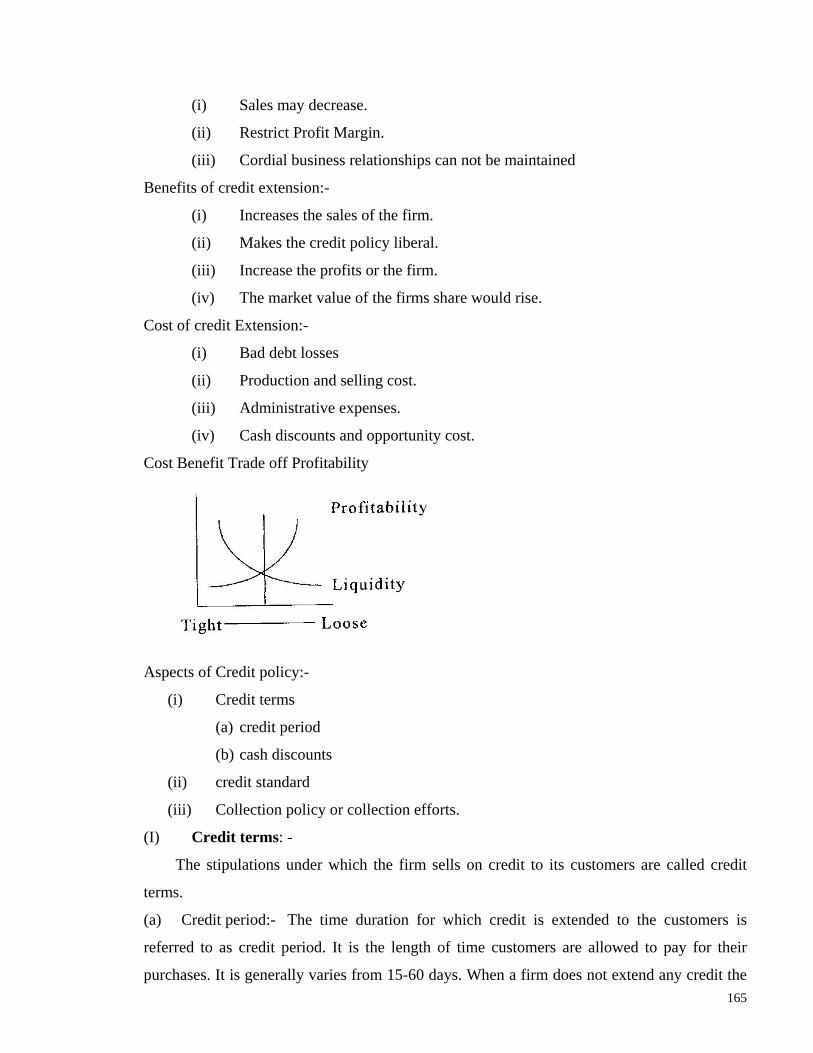
Cost Benefit Trade off Profitability
Aspects of Credit policy:-
(i) Credit terms
(a) credit period
(b) cash discounts
(ii) credit standard
(iii) Collection policy or collection efforts.
(I) Credit terms: -
The stipulations under which the firm sells on credit to its customers are called credit
terms.
(a) Credit period:- The time duration for which credit is extended to the customers is
referred to as credit period. It is the length of time customers are allowed to pay for their
purchases. It is generally varies from 15-60 days. When a firm does not extend any credit the
Page 10
166
credit period would obviously be zero. It is generally stated in terms of a net date for example,
if firm allows 30 days of credit with no discount to induce early payments credit then its credit
terms are stated at ‘net 30’. Usually the credit period of the firm is governed by industry
norms, but firms can extend credit for longer duration to stimulate sales. If the firm’s bad
debts build up, it may tighten up its credit policy as against the industry norms. According to
Martin H Seidhen, “Credit Period is the duration of time for which trade credit is extended.
During this period the overdue amount must be paid by the customer. The length of credit
period directly affects the volume of investment in receivables and indirectly the net worth of
the company. A long credit period may blast sales but it also increase investment in
receivables and lowers the quality of trade credit.”
(b) Cash Discounts :- It is the another aspect of credit terms. Many firms offer to grant cash
discount to their customers in order to induce them to pay their bill early. The cash discount
terms indicate the rate of discount and the period for which discount has been offered. If a
customer does not avail this offer, he is expected to make the payment by the net date. In the
words of Martin H. Seiden “Cash Discount prevents debtors from using trade credit as a
source of working Capital.”
Liberalizing the cash discount policy may mean that the discount % is increased and
or the discount period is lengthened. Such an action tends to enhance sales (because the
discount in regarded as price reduction), reduce the average collection period (as customers
pay promptly). Cash Discount is a premium on payment of debts before due date and not a
compensation for the so called prompt payment.
(II) Credit Standard: -
The credit standard followed by the firm has an impact of sales and receivables. The
sales and receivables level are likely to be high, if the credit standard of the firm are relatively
low. In contrast, if the firm has relatively low credit standard, the sales and receivables level
are expected to be relatively high. The firms credit standard are influenced by three “C” of
credit. (a) Character – the willingness of the customers to pay (b) Capacity – the ability of the
customers to pay (c) Condition- the prevailing economic conditions.
Normally a firm should lower its credit standards to the extent profitability of
increased sales exceed the associated costs. The cost arising due to credit standard realization
are administrative cost of supervising additional accounts and servicing increased volume of
receivables, bad debt losses, production and selling cost and cost resulting from the slower
Page 11
167
average collection period.
The extent to which credit standard can be liberalized should depend upon the
matching between the profits arising due to increased sales and cost to be incurred on the
increased sales.
(III) Collection Policy :- This policy is needed because all customers do not pay the firm’s
bill in time. There are certain customers who are slow payers and some are non-payers.
Therefore the collection policy should aim at accelerating collections from slow payers and
non payers and reducing bad debt losses. According to R.K. Mishra “A collection policy
should always emphasize promptness, regularity and systematization in collection efforts. It
will have a psychological effect upon the customers, in that it will make them realize the
attitude of the seller towards the obligations granted.”
The collection programme of the firm aimed at timely collection of receivables, may
consist of many things like monitoring the state of receivable, dispatch of letter to customers
whose due date is approaching, telegraphic and telephone advice to customers around the due
date, threat of legal action to over due accounts, legal action against over due accounts.
The firm has to be very cautions in taking the steps in order to collect from the slow
paying customers. If the firm is strict in its collection policy with the permanent customers,
who are temporarily slow payers due to their economic conditions, they will get offended and
may shift to competitors and the firm may loose its permanent business. In following an
optimal collection policy the firm should compare the cost and benefits. The optimal credit
policy will maximize the profit and will consistent with the objective of maximizing the
value of the firm.
5.6 Credit Evaluation Before granting credit to a prospective customers the financial executive must judge, how
creditworthy is the customer. In judging the creditworthiness of a customers, often financial
executive keep in mind as basic criteria the four C’s. (i) Capital – refers to the financial
resources of the firm. (ii) Capacity – refers to the ability of the customers to pay in time. (iii)
Character – refers to the reputation of the customer for honest and fair dealings. (iv) Collateral
– it represents the security offered by the customer in the form of mortgages.
Credit evaluation involves a large number of activities ranging from credit
investigation to contact with customers, appraisal review, follow up, inspection and recovery.
These activities required decision making skills which can partly be developed through
Page 12
168
experience but partly it has to be learned externally, this is particularly true in area of pre
credit appraisal and post credit follow up.
It is an important element of credit management. It helps in establishing credit terms.
In assessing credit risk, two types of error occur – (i) A good customer is misclassified as a
poor credit risk. (ii) A bad customer is misclassified as a good credit risk.
Both the errors are costly. Type (i) leads to loss of profit on sales to good customer
who are denied credit. Type (ii) leads in bad debt losses on credit sales made to risky
customer. While misclassification errors can not be eliminated wholly, a firm can mitigate
their occurrence by doing proper credit evaluation.
Three broad approaches used for credit evaluation are
A. Traditional Credit Analysis:-This approach to credit analysis calls for assuming a
prospective customer in terms of 5 C’s of credit.
(i) Character (ii) Capacity (iii) Capital (iv) Collateral (v) Conditions.
To get the information on the 5 C’ firm may rely on the following.
1. financial statements
2. Bank references
3. Trade references
4. Credit agencies
5. Experience of the firm
6. Prices and Yields on Securities
B. Sequential Credit Analysis:- This method is more efficient method than above method.
In this analysis, investigation is carried further if the benefits of such analysis out
weighs its cost.
C. Numerical Credit Scoring :- This system involve the following steps.
1. Identifying factors relevant for credit evaluation.
2. Assign weights to these factors that reflect their relative importance.
3. Rate the customer on various factors, using a suitable rating scale method (usually a
5point Scale or a 7point Scale is used).
4. For each factor, multiply the factor rating with the factor weight to get the factor score.
5. Add all the factor score to get the overall customer rating index.
6. Based on the rating index, classify the rating index.
D. Discriminate Analysis:- The credit index described above is somewhat adhoc in nature
Page 13
169
and is based on weights which are subjective in nature. The nature of discriminate analysis
may be employed to construct a better risk index.
Under this analysis the customer is divided into two categories:
(i) Who pay the dues (x)
(ii) Who have defaulted (o)
The straight line seems to separate the x’s from o’s, not completely but does a fairly
good job of segregating the two groups.
The equation of this straight line is
Z = 1 Current Ratio + 0.1 return on equity
A customer with a Z score of more than 3 is deemed credit worthy and a customer
with a Z score less than 3 its considered not credit worthy i.e. the higher the Z
score the stronger the credit rating.
E Risk Classification Scheme :- On the basis of information and analysis in the credit
investigation process, customers may be classified into various risk categories.
1. Customers With no risk of default
2. customer with negligible risk of default (< 2%)
3. Customer with less risk of default (2% to 5%)
4. Customer with some risk of default (5% to 10%)
5. Customer with significant risk of default (> 10%)
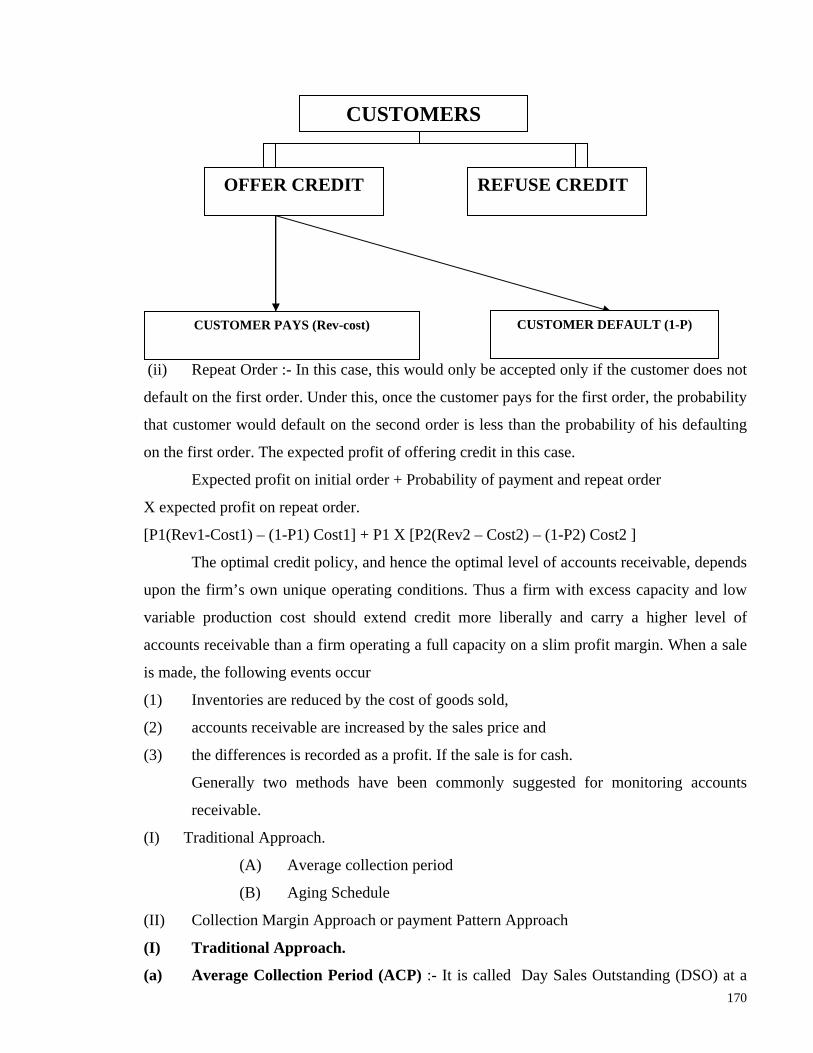
Credit Granting Decision :- After assessing the credit worthiness of a customer, next
step is to take credit granting decision.
There are two possibilities.
(i) No repetition of order.
Profit = P(Rev-Cost) -(1-P) Cost
Where P is the probability for that the customer pays his dues, (1-P) is the probability that the
customer defaults, Rev is revenue for sale and cost is the cost of goods sold.
The expected profit for the refuse credit is 0. Obliviously, if the expected profit of the
course of action offer credit is positive, it is desirable to extend credit otherwise not.
Page 14
170
(ii) Repeat Order :- In this case, this would only be accepted only if the customer does not
default on the first order. Under this, once the customer pays for the first order, the probability
that customer would default on the second order is less than the probability of his defaulting
on the first order. The expected profit of offering credit in this case.
Expected profit on initial order + Probability of payment and repeat order
X expected profit on repeat order.
[P1(Rev1-Cost1) – (1-P1) Cost1] + P1 X [P2(Rev2 – Cost2) – (1-P2) Cost2 ]
The optimal credit policy, and hence the optimal level of accounts receivable, depends
upon the firm’s own unique operating conditions. Thus a firm with excess capacity and low
variable production cost should extend credit more liberally and carry a higher level of
accounts receivable than a firm operating a full capacity on a slim profit margin. When a sale
is made, the following events occur
(1) Inventories are reduced by the cost of goods sold,
(2) accounts receivable are increased by the sales price and
(3) the differences is recorded as a profit. If the sale is for cash.
Generally two methods have been commonly suggested for monitoring accounts
receivable.
(I) Traditional Approach.
(A) Average collection period
(B) Aging Schedule
(II) Collection Margin Approach or payment Pattern Approach
(I) Traditional Approach.
(a) Average Collection Period (ACP) :- It is called Day Sales Outstanding (DSO) at a
CUSTOMERS
OFFER CREDIT REFUSE CREDIT
CUSTOMER PAYS (Rev-cost) CUSTOMER DEFAULT (1-P)
Page 15
171
given time ‘t’ may define as the ratio of receivable outstanding at that time to average daily
sales figure.
Accounts receivable at time “t” ACP = _______________________________ Average daily sales According to this method accounts receivable are deemed to be in control if the ACP
is equal to or less than a certain norm. If the value of ACP exceed the specified norm,
collection are considered to be slow.
The company had made cash sales as well as credit sales, it would have concentrated
on credit sales only, and calculate average daily credit sales.
The widely used index of the efficiency of credit and collection is the period or
number of day’s sales outstanding in receivable. The receivable turnover is simply ACP/360
days.
Thus receivable turnover is six times a year, the collection period is necessarily 60
days.
(b) Aging Schedule:– An aging Schedule breaks down a firm’s receivable by age of
account, the purpose of classifying receivables by age group is to gain a closer control over
the quality of individual accounts. It requires going back to the receivables ledger where the
dates of each customer’s purchases and payments are available.
To evaluate receivable for control purpose, it may be considered desirable to compare
this information with earlier age classification in that very firm and also to compare this
information with the experience of other firms of same nature. Financial executives get such
schedule prepared at periodic intervals for control purpose.
So Aging Schedule classifies outstanding accounts receivable at a given point of time
into different age brackets. The actual aging schedule of the firm is compared with some
standard aging schedule to determine whether accounts receivable are in control. A problem is
indicated if the actual aging schedule shows a greater proportion of receivable, compared with
the standard aging schedule, in the higher age group.
An inter firm comparison of aging schedule of debtors is possible provided data
relating to monthly sales and collection experience of competitive firm are available. This tool
therefore, cannot be used by an external analyst who has got no approach to the details of
receivable.
The above both approaches have some deficiencies. Both methods are influenced by
Page 16
172
pattern of sales and payment behavior of customer. The aging schedule is distorted when the
payment relating to sales in other months are normal.
II. Payment Pattern Approach:-
This pattern is developed to measure any changes that might be occurring in
customer’s payment behavior.
It is defined in terms of proportion or %. For analyzing the payment pattern of several
months, it is necessary to prepare a conversion matrix, which shows the credit sales in each
month and the pattern of collection associated with it.
The payment pattern approach is not dependent on sales level. It focuses on the key
issue, the payment behavior. It enables one to analyze month by month pattern as against the
combined sales and payment patterns.
From the collection pattern, one can judge whether the collection is improving, stable,
or deteriorating. A secondary analysis is that it provides a historical record of collection %
that can be useful in projecting monthly receipts for each budgeting period.
5.7 Control of Accounts Receivable
Some of the important techniques for controlling accounts receivable are ration
analysis, discriminate analysis, decision tree approach, and electronic data processing.
Information system with regard to receivables turnover, age of each account, progress of
collection size of bad debt losses, and number of delinquent accounts is also used as one of
the control measures.
Ratio analysis is widely used in the control of accounts receivable. Some of the
important rations used for this purpose are discussed below:
(1) Average collection Period (Receivables x 365/Annual credit Sales)
The average collection period indicates the average time it takes to convert receivables
into cash. Too low an average collection period may reflect an excessively restrictive credit
policy and suggest the need for relaxing credit standards for an acceptable account. On the
other hand too high an average collection period may indicate an excessively liberal credit
policy leading to a large number of receivables being past due and some being not collectable.
(2) Receivables Turnover (Annual Credit Sales/Receivables)
The ratio also indicates the slowness of receivables. Both the average collection period
ratio and receivables ratio must be analyzed in relation to the billing terms given on the sales.
If the turnover rates are not satisfactory when compared with prior experience, average
Page 17
173
industry turnover and turnover ratio of comparable companies in the same industry, an
analysis should be made to determine whether there is any laxity in the credit policy or
whether the problem is in collection policy.
(3) Receivables to Sales (Receivables/Annual Credit Sales x 100)
Receivables can be expected to fluctuate in direct relation to the volume of sales,
provided that sales terms and collection practices do not change. More lenient credit policy
may result into increase in slow paying customers, decrease in collection. Such customers
should be identified from the ratio of receivables to sales. In absence of credit sales figures
total sales is used. The receivables figures in the calculation ordinarily represent, ear-end
receivables figures may be deceptive therefore, an average of the monthly closing balances
figures may be more reliable.
(4) Receivables as percentage of Current assets (Receivables/Total Current asset Investment)
The ratio explains the amount of receivables per rupee of current asset investment and
its size in current assets. Comparison of the ratio over a period offers an index of a firm’s
changing policies with regard to the level of receivables in the working capital.
Some other ratios are:-
1. Size of receivable = receivable/total current assets
2. Size of debtors = Debtors/ total current assets
3. Size of loans and advances = loans and advances/ total current assets
1. Size of receivable
Table 5.1
Size of Receivable Co./ Year 2000-01 2001-02 2002-03 2003-04 2004-05 2005-06 2006-07 2007-08 2008-09 Avg.
ACL 0.447 0.443 0.397 0.343 0.254 0.258 0.227 0.229 0.234 0.003
GSCL 0.548 0.573 0.589 0.605 0.425 0.488 0.352 n.a 0.456 0.007
SIL 0.505 0.305 0.318 0.508 0.573 0.422 0.524 0.604 0.645 0.008
SCL 0.467 0.460 0.416 0.411 0.336 0.403 0.182 0.219 0.395 0.005
SDCL 0.528 0.444 0.477 0.411 0.553 0.647 0.568 0.270 0.157 0.002
UCL 0.000 0.000 0.000 0.517 0.476 0.427 0.439 0.454 0.411 0.005
Avg. 0.499 0.445 0.439 0.380 0.357 0.370 0.309 0.264 0.314 0.004
Source: computed from annual reports of respective companies
The size of receivable of all the cement companies shows fluctuating trend throughout
Page 18
174
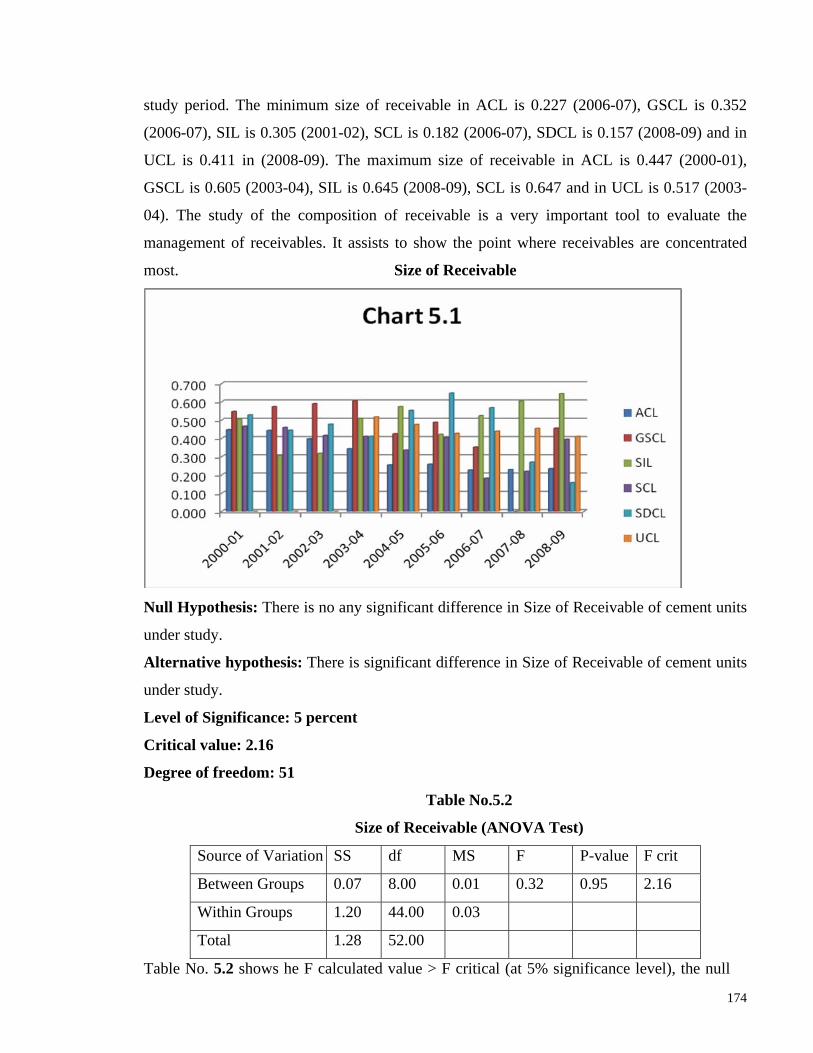
study period. The minimum size of receivable in ACL is 0.227 (2006-07), GSCL is 0.352
(2006-07), SIL is 0.305 (2001-02), SCL is 0.182 (2006-07), SDCL is 0.157 (2008-09) and in
UCL is 0.411 in (2008-09). The maximum size of receivable in ACL is 0.447 (2000-01),
GSCL is 0.605 (2003-04), SIL is 0.645 (2008-09), SCL is 0.647 and in UCL is 0.517 (2003-
04). The study of the composition of receivable is a very important tool to evaluate the
management of receivables. It assists to show the point where receivables are concentrated
most. Size of Receivable
Null Hypothesis: There is no any significant difference in Size of Receivable of cement units
under study.
Alternative hypothesis: There is significant difference in Size of Receivable of cement units
under study.
Level of Significance: 5 percent
Critical value: 2.16
Degree of freedom: 51
Table No.5.2
Size of Receivable (ANOVA Test)
Source of Variation SS df MS F P-value F crit
Between Groups 0.07 8.00 0.01 0.32 0.95 2.16
Within Groups 1.20 44.00 0.03
Total 1.28 52.00
Table No. 5.2 shows he F calculated value > F critical (at 5% significance level), the null
Page 19
175
hypothesis is accepted and alternative hypothesis is rejected and hence it is concluded that
Size of Receivable of cement companies does not differ significantly.
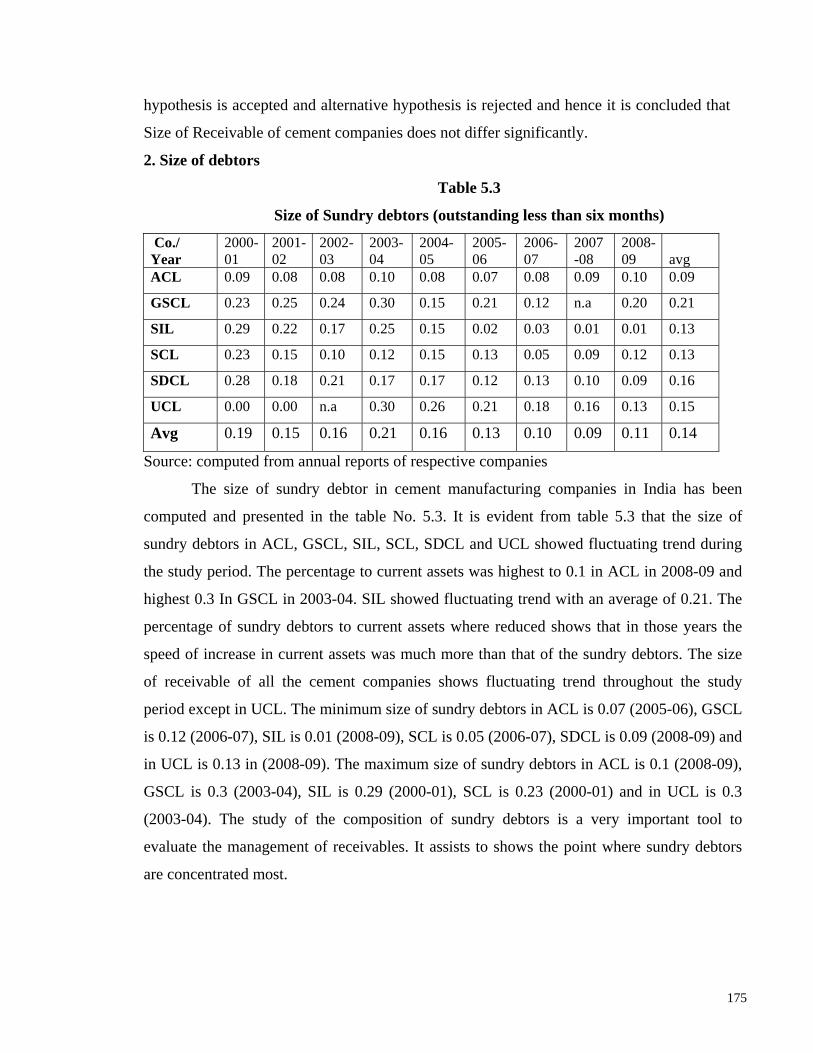
2. Size of debtors
Table 5.3
Size of Sundry debtors (outstanding less than six months)
Co./ Year
2000- 01
2001- 02
2002- 03
2003- 04
2004- 05
2005- 06
2006- 07
2007 -08
2008-09 avg
ACL 0.09 0.08 0.08 0.10 0.08 0.07 0.08 0.09 0.10 0.09
GSCL 0.23 0.25 0.24 0.30 0.15 0.21 0.12 n.a 0.20 0.21
SIL 0.29 0.22 0.17 0.25 0.15 0.02 0.03 0.01 0.01 0.13
SCL 0.23 0.15 0.10 0.12 0.15 0.13 0.05 0.09 0.12 0.13
SDCL 0.28 0.18 0.21 0.17 0.17 0.12 0.13 0.10 0.09 0.16
UCL 0.00 0.00 n.a 0.30 0.26 0.21 0.18 0.16 0.13 0.15
Avg 0.19 0.15 0.16 0.21 0.16 0.13 0.10 0.09 0.11 0.14
Source: computed from annual reports of respective companies
The size of sundry debtor in cement manufacturing companies in India has been
computed and presented in the table No. 5.3. It is evident from table 5.3 that the size of
sundry debtors in ACL, GSCL, SIL, SCL, SDCL and UCL showed fluctuating trend during
the study period. The percentage to current assets was highest to 0.1 in ACL in 2008-09 and
highest 0.3 In GSCL in 2003-04. SIL showed fluctuating trend with an average of 0.21. The
percentage of sundry debtors to current assets where reduced shows that in those years the
speed of increase in current assets was much more than that of the sundry debtors. The size
of receivable of all the cement companies shows fluctuating trend throughout the study
period except in UCL. The minimum size of sundry debtors in ACL is 0.07 (2005-06), GSCL
is 0.12 (2006-07), SIL is 0.01 (2008-09), SCL is 0.05 (2006-07), SDCL is 0.09 (2008-09) and
in UCL is 0.13 in (2008-09). The maximum size of sundry debtors in ACL is 0.1 (2008-09),
GSCL is 0.3 (2003-04), SIL is 0.29 (2000-01), SCL is 0.23 (2000-01) and in UCL is 0.3
(2003-04). The study of the composition of sundry debtors is a very important tool to
evaluate the management of receivables. It assists to shows the point where sundry debtors
are concentrated most.
Page 20
176
Size of Sundry debtors (outstanding less than six months)
Null Hypothesis: There is no any significant difference in Size of Sundry debtors
(outstanding less than six months) of cement units under study.
Alternative hypothesis: There is significant difference in Size of Sundry debtors
(outstanding less than six months) of cement units under study.
Level of Significance: 5 percent
Critical value: 2.16
Degree of freedom: 51
Table No.5.4
Size of Sundry debtors (outstanding less than six months) (ANOVA Test)
Source of
Variation SS df MS F P-value F crit
Between
Groups 0.07 8.00 0.01 1.52 0.18 2.16
Within
Groups 0.26 43.00 0.01
Total 0.33 51.00
Table No.5.4 shows the F calculated value > F critical (at 5% significance level),
the null hypothesis is accepted and alternative hypothesis is rejected and hence it is
concluded that Size of Sundry debtors (outstanding less than six months) of cement
Page 21
177
companies does not differ significantly.
Table 5.5
Size of Sundry debtors (outstanding over six months)
Co./ Year 2000-01 2001-02 2002-03 2003-04 2004-05 2005-06 2006-07 2007-08 2008-09 Avg.
ACL 0.007 0.010 0.009 0.012 0.007 0.005 0.002 0.001 0.001 0.006
GSCL 0.142 0.152 0.101 0.083 0.071 0.033 0.087 n. a 0.053 0.090
SIL 0.052 0.027 0.015 0.000 0.027 0.000 0.001 0.000 0.000 0.013
SCL 0.116 0.156 0.106 0.136 0.067 0.078 0.037 0.029 0.046 0.086
SDCL 0.047 0.045 0.024 0.018 0.006 0.007 0.000 0.000 0.000 0.016
UCL 0.000 0.000 n.a 0.019 0.005 0.014 0.009 0.007 0.013 0.008
Avg. 0.060 0.065 0.051 0.045 0.030 0.023 0.023 0.007 0.019 0.036
Source: computed from annual reports of respective companies
The Size of Sundry debtors (outstanding over six months) in cement
manufacturing companies in India has been computed and presented in the table No. 5.5.
It is evident from table 5.5 that the Size of Sundry debtors (outstanding over six months)
in ACL, GSCL,SIL,SCL,SDCL and UCL showed fluctuating trend during the study
period. The percentage to current assets was highest to 0.012 in ACL in 2003-04 and
highest 0.152 in GSCL in 2001-02. SIL showed fluctuating trend with an average of
0.013. The percentage of The Size of Sundry debtors (outstanding over six months) to
current assets where reduced shows that in those years the speed of increase in current
assets was much more than that of the Size of Sundry debtors (outstanding over six
months). The size of receivable of all the cement companies shows fluctuating trend
throughout the study period except in UCL. The minimum size of The Size of Sundry
debtors (outstanding over six months) in ACL is 0.001 (2008-09), GSCL is 0.033 (2005-
06), SIL is 0.00 (2007-08), SCL is 0.029 (2007-08), SDCL is 0.00 (2008-09) and in UCL
is 0.00 in (2008-09). The maximum size of The Size of Sundry debtors (outstanding over
six months) in ACL is 0.012 (2003-04), GSCL is 0.152 (2000-01), SIL is 0.052 (2000-
01), SCL is 0.156 (2001-02) and in UCL is 0.019 (2003-04).
Page 22
178
Size of Sundry debtors (outstanding over six months)
Null Hypothesis: There is no any significant difference in Size of Sundry debtors
(outstanding over six months) of cement units under study.
Alternative hypothesis: There is significant difference in Size of Sundry debtors
(outstanding over six months) of cement units under study.
Level of Significance: 5 percent
Critical value: 2.16
Degree of freedom: 51
Table No.5.6
Size of Sundry debtors (outstanding over six months)(ANOVA Test)
Source of Variat SS df MS F P-value F crit
Between Groups 0.02 8.00 0.00 1.18 0.33 2.16
Within Groups 0.08 43.00 0.00
Total 0.10 51.00
Table No.5.6 shows he F calculated value > F critical (at 5% significance level), the null
hypothesis is accepted and alternative hypothesis is rejected and hence it is concluded that
Size of Sundry debtors (outstanding over six months) of cement companies does not differ
significantly.
Page 23
179
Table no.5.7 Average collection period (in Days) Co./ Year
2000- 01
2001- 02
2002- 03
2003- 04
2004- 05
2005- 06
2006- 07
2007- 08
2008- 09 Avg.
ACL 9 9 8 8 8 6 4 7 10 8
GSCL 58 56 58 65 48 24 18 NA 13 42
SIL 29 72 90 28 13 5 3 3 2 27
SCL 63 66 43 42 44 41 35 26 15 42
SDCL 43 50 33 39 58 22 17 17 15 33
UCL 0 0 NA NA 22 17 12 12 10 10
Avg. 34 42 47 37 32 19 15 13 11 27
Source: computed from annual reports of respective companies
Average collection period (in Days) of selected cement companies from 2000-01 to
2008-09 are shown in the Table No 5.7. Average collection period (in Days) ACL showed
fluctuating trend with an average of 8. The ratio was 9 days in 2000-01 and it went up to 8
days in 2004-05. The ratio was the highest of 10 days in 2008-09 and the lowest was in 4
days in 2006-07. The Average collection period (in Days) of GSCL ranged between 13
days in 2008-09 and 65 days in 2003-04. The ratio was on an average of 42 days. The ratio
of SIL ranged between 2 days in 2008-09 and 90 days in 2002-03 with an average of 90
days. The ratio of SCL was showing fluctuating trend throughout the study period with an
average of 27 days. The ratio SDCL was also indicating highly fluctuating trend with an
average of 42 days. The range was 15 days and 66 days during the study period. Average
collection period (in Days) of UCL was minimal of 10 days during the year of 2008-09 and
22 during the year of 2004-05 with an average of 10 days.
Average collection period (in Days)
Page 24
180
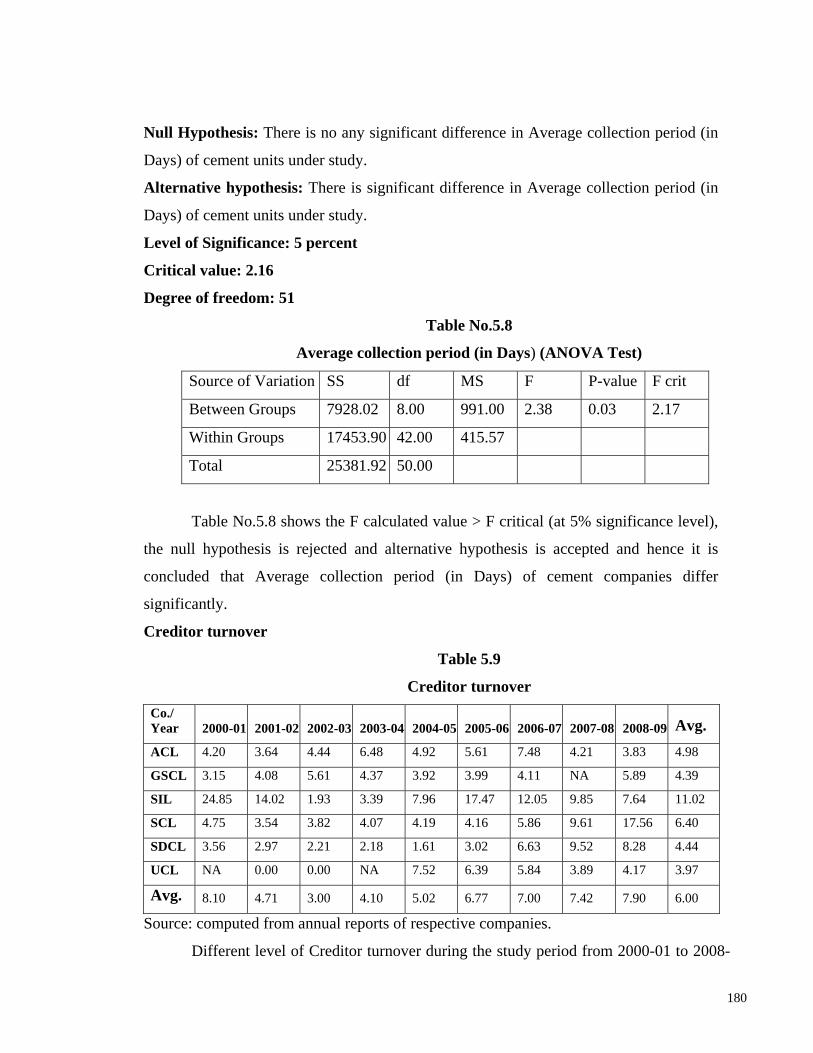
Null Hypothesis: There is no any significant difference in Average collection period (in
Days) of cement units under study.
Alternative hypothesis: There is significant difference in Average collection period (in
Days) of cement units under study.
Level of Significance: 5 percent
Critical value: 2.16
Degree of freedom: 51
Table No.5.8
Average collection period (in Days) (ANOVA Test)
Source of Variation SS df MS F P-value F crit
Between Groups 7928.02 8.00 991.00 2.38 0.03 2.17
Within Groups 17453.90 42.00 415.57
Total 25381.92 50.00
Table No.5.8 shows the F calculated value > F critical (at 5% significance level),
the null hypothesis is rejected and alternative hypothesis is accepted and hence it is
concluded that Average collection period (in Days) of cement companies differ
significantly.
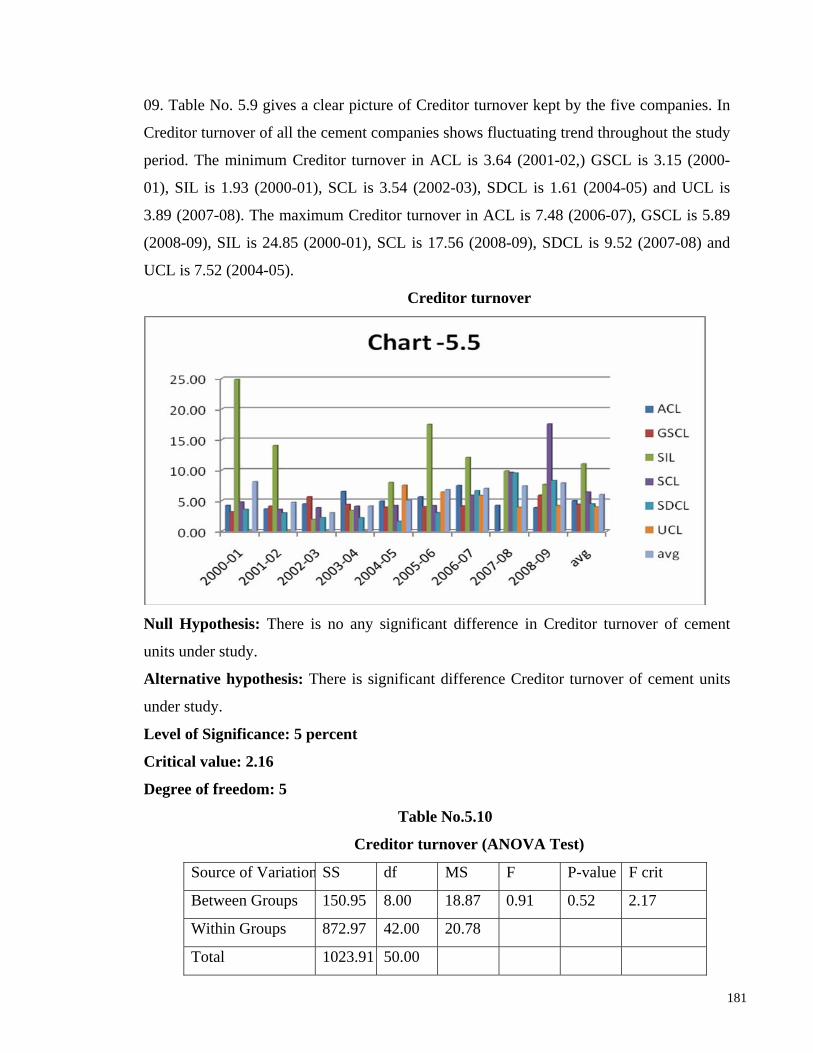
Creditor turnover
Table 5.9
Creditor turnover Co./ Year 2000-01 2001-02 2002-03 2003-04 2004-05 2005-06 2006-07 2007-08 2008-09 Avg. ACL 4.20 3.64 4.44 6.48 4.92 5.61 7.48 4.21 3.83 4.98
GSCL 3.15 4.08 5.61 4.37 3.92 3.99 4.11 NA 5.89 4.39
SIL 24.85 14.02 1.93 3.39 7.96 17.47 12.05 9.85 7.64 11.02
SCL 4.75 3.54 3.82 4.07 4.19 4.16 5.86 9.61 17.56 6.40
SDCL 3.56 2.97 2.21 2.18 1.61 3.02 6.63 9.52 8.28 4.44
UCL NA 0.00 0.00 NA 7.52 6.39 5.84 3.89 4.17 3.97
Avg. 8.10 4.71 3.00 4.10 5.02 6.77 7.00 7.42 7.90 6.00
Source: computed from annual reports of respective companies.
Different level of Creditor turnover during the study period from 2000-01 to 2008-
Page 25
181
09. Table No. 5.9 gives a clear picture of Creditor turnover kept by the five companies. In
Creditor turnover of all the cement companies shows fluctuating trend throughout the study
period. The minimum Creditor turnover in ACL is 3.64 (2001-02,) GSCL is 3.15 (2000-
01), SIL is 1.93 (2000-01), SCL is 3.54 (2002-03), SDCL is 1.61 (2004-05) and UCL is
3.89 (2007-08). The maximum Creditor turnover in ACL is 7.48 (2006-07), GSCL is 5.89
(2008-09), SIL is 24.85 (2000-01), SCL is 17.56 (2008-09), SDCL is 9.52 (2007-08) and
UCL is 7.52 (2004-05).
Creditor turnover
Null Hypothesis: There is no any significant difference in Creditor turnover of cement
units under study.
Alternative hypothesis: There is significant difference Creditor turnover of cement units
under study.
Level of Significance: 5 percent
Critical value: 2.16
Degree of freedom: 5
Table No.5.10
Creditor turnover (ANOVA Test)
Source of Variation SS df MS F P-value F crit
Between Groups 150.95 8.00 18.87 0.91 0.52 2.17
Within Groups 872.97 42.00 20.78
Total 1023.91 50.00
Page 26
182
Table No.5.10 shows the F calculated value > F critical (at 5% significance level),
the null hypothesis is accepted and alternative hypothesis is rejected and hence it is
concluded that Creditor turnover of cement companies does not differ significantly.
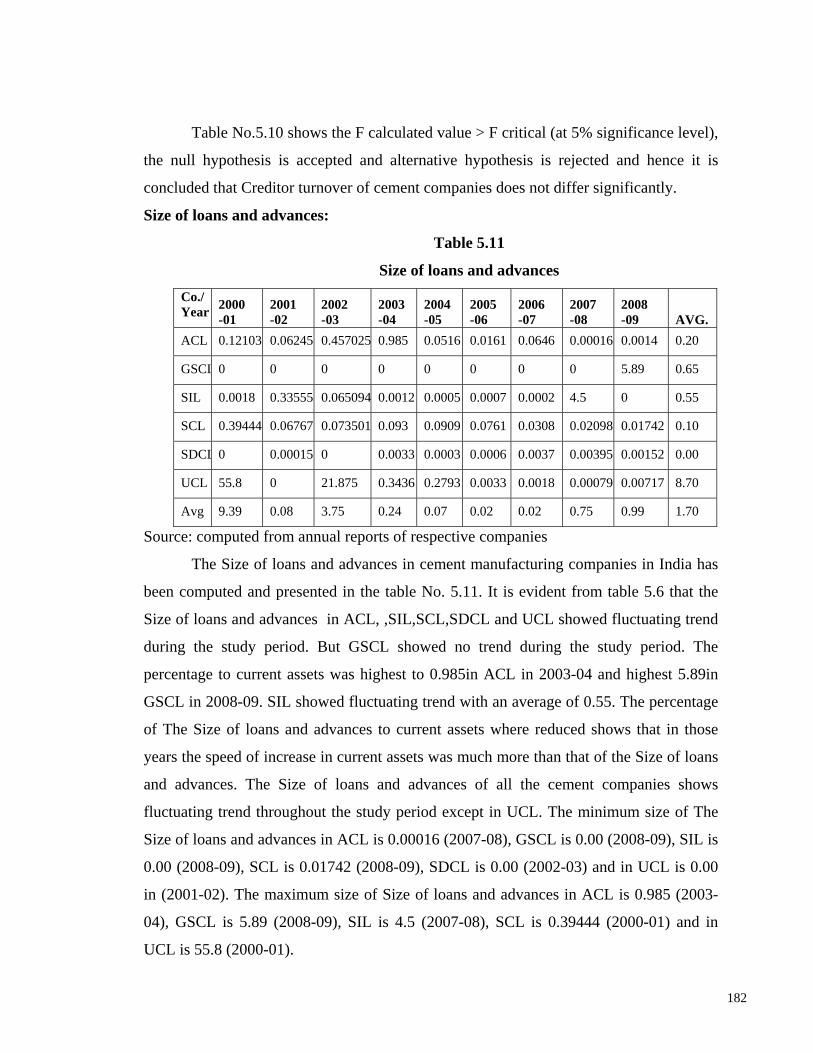
Size of loans and advances:
Table 5.11
Size of loans and advances Co./ Year 2000
-01 2001 -02
2002 -03
2003 -04
2004 -05
2005 -06
2006 -07
2007 -08
2008 -09 AVG.
ACL 0.12103 0.06245 0.457025 0.985 0.0516 0.0161 0.0646 0.00016 0.0014 0.20
GSCL 0 0 0 0 0 0 0 0 5.89 0.65
SIL 0.0018 0.33555 0.065094 0.0012 0.0005 0.0007 0.0002 4.5 0 0.55
SCL 0.39444 0.06767 0.073501 0.093 0.0909 0.0761 0.0308 0.02098 0.01742 0.10
SDCL 0 0.00015 0 0.0033 0.0003 0.0006 0.0037 0.00395 0.00152 0.00
UCL 55.8 0 21.875 0.3436 0.2793 0.0033 0.0018 0.00079 0.00717 8.70
Avg 9.39 0.08 3.75 0.24 0.07 0.02 0.02 0.75 0.99 1.70
Source: computed from annual reports of respective companies
The Size of loans and advances in cement manufacturing companies in India has
been computed and presented in the table No. 5.11. It is evident from table 5.6 that the
Size of loans and advances in ACL, ,SIL,SCL,SDCL and UCL showed fluctuating trend
during the study period. But GSCL showed no trend during the study period. The
percentage to current assets was highest to 0.985in ACL in 2003-04 and highest 5.89in
GSCL in 2008-09. SIL showed fluctuating trend with an average of 0.55. The percentage
of The Size of loans and advances to current assets where reduced shows that in those
years the speed of increase in current assets was much more than that of the Size of loans
and advances. The Size of loans and advances of all the cement companies shows
fluctuating trend throughout the study period except in UCL. The minimum size of The
Size of loans and advances in ACL is 0.00016 (2007-08), GSCL is 0.00 (2008-09), SIL is
0.00 (2008-09), SCL is 0.01742 (2008-09), SDCL is 0.00 (2002-03) and in UCL is 0.00
in (2001-02). The maximum size of Size of loans and advances in ACL is 0.985 (2003-
04), GSCL is 5.89 (2008-09), SIL is 4.5 (2007-08), SCL is 0.39444 (2000-01) and in
UCL is 55.8 (2000-01).
Page 27
183
Size of loans and advances
Null Hypothesis: There is no any significant difference in Size of loans and advances of
cement units under study.
Alternative hypothesis: There is significant difference Size of loans and advances of
cement units under study.
Level of Significance: 5 percent
Critical value: 2.16
Degree of freedom: 51
Table No.5.12
Size of loans and advances (ANOVA Test)
Source of
Variation SS df MS F P-value F crit
Between Groups 466.55 8.00 58.32 0.87 0.55 2.15
Within Groups 3026.39 45.00 67.25
Total 3492.94 53.00
Table No.5.12 shows the F calculated value > F critical (at 5% significance level), the null
hypothesis is accepted and alternative hypothesis is rejected and hence it is concluded that
Size of loans and advances of cement companies does not differ significantly.
Page 28
184
Turnover of accounts receivable
Table No. 5.13 Co./ Year 2000-1 2001-2 2002-3 2003-4 2004-5 2005-6 2006-7 2007-8 2008-9 Avg. ACL 7.97 8.57 8.73 14.22 19.38 20.36 27.99 17.62 12.97 15.31
GSCL 4.54 5.02 4.82 4.10 7.32 10.96 13.07 n.a 18.65 8.56
SIL 6.31 3.37 2.84 5.19 9.34 7.45 5.87 3.49 4.66 5.39
SCL 4.50 5.10 7.76 7.16 7.85 7.95 8.88 9.12 21.64 8.88
SDCL 5.28 6.60 7.46 7.96 2.87 7.52 6.25 14.02 13.77 7.97
UCL 0.56 0.00 n.a 9.46 9.82 11.51 13.03 10.63 12.89 8.49
Avg. 4.86 4.77 6.32 8.02 9.43 10.96 12.51 10.98 14.10 9.10
Source: computed from annual reports of respective companies
Table No. 5.13 shows Turnover of accounts receivable of cement industry India from
2000-01 to 2008-09. The ratio of ACL was 7.97 in 2000-01 which increased to 8.57 in
2001-02 and 14.22 in 2003-04. The ratio increased and reached at highest level of 27.99
in 2006-07 with an average of 15.31. The ratio GSCL indicated highly fluctuated trend
during the study period with an average of 8.56. The ratio of SIL ranged between 2.84 in
2002-03 and 9.34 in 2004-05 with an average of 5.39. The ratio of SCL ranged between
4.5 in 2000-01 and 21.64 in 2008-09 with an average of 8.88. The ratio of SDCL ranged
between 2.87 to 14.02 with an average of 7.97. The ratio UCL showed fluctuating trend
during the study period with a range of 8.49 to 13.03. The average ratio has been of 8.49.
Turnover of accounts receivable
Page 29
185
Null Hypothesis: There is no any significant difference in Turnover of accounts
receivable of cement units under study.
Alternative hypothesis: There is significant difference Turnover of accounts receivable
of cement units under study.
Level of Significance: 5 percent Critical value: 2.16
Degree of freedom: 51
Table No.5.14
Turnover of accounts receivable (ANOVA Test)
Source of Variation SS df MS F P-value F crit
Between Groups 524.38 8.00 65.55 2.68 0.02 2.16
Within Groups 1051.74 43.00 24.46
Total 1576.12 51.00
Table No.5.14 shows the F calculated value > F critical (at 5% significance level),
the null hypothesis is rejected and alternative hypothesis is accepted and hence it is
concluded that Turnover of accounts receivable of cement companies differ significantly.
*****
Page 30
186
REFERENCES 1. Agarwal, N.K.: Management of Working Capital, Op. Cit., P.54
2. Beckman, T.N.: Op. Cit., P.208
3. C.R. Cook: Credit Policies-Impact on Sales & Profit Cost & Management,
(Hemilton, Ontario, Canada, Volume 37, October, 1963, P.387
4. Edward T. Curtis: Credit Department Organization & Operations, (New York:
American Management Association Inc., Research Study No. 34, 1959), PP.14-17,
5. Harry Gross: Financing for Small & Medium sized Business, Op. Cit., P.80
6. Harry Gross: Op. Cit., P.84
7. I.M. Pandey : Op. Cit., P.381
8. James C. Van Home: Op. Cit., PP.116-117
9. Joseph L. Wood: Business Finance Hand Book, "Credit & Collection" in Doris Lillian
(Ed.), (New York: Prentice Hall, 1953), P.243
10. Joy, O.M.: Introduction to Financial Management (Madras: Institute for Financial
Management and Research, 1978), P.210.
11. Martin H. Seiden: The Quality of Trade Credit, (New York: National Bureau of
Economic Research, 1964), P.39
12. Prasanna Chandra: Financial Management, Op. Cit., P.291
13. R.J. Chambers: Financing Management (Sydney: The Law Book Co., Ltd., 1967),
PP.273-274
14. R.K. Mishra: Op. Cit., P.99
15. R.K. Mishra: Problems of Working Capital Op. Cit, P.94
16. Robert N. Anthony: Management Accounting, Op. Cit., P.291