Page 1
Monetary Authority of Singapore Economic Policy Group
17 September 2014
The Singapore economy ceded growth momentum in Q1 2016 The domestic economy grew by a marginal 0.2% q-o-q saar (quarter-on-quarter seasonally-
adjusted annualised rate) in Q1 2016, a significant step-down from the robust 6.2%
expansion in Q4 2015. The muted outcome largely reflected a slowdown in services during
the quarter, including in wholesale trade and finance & insurance. In comparison,
manufacturing expanded robustly, buoyed by an upsurge in the pharmaceuticals segment.
Global growth is expected to be muted in 2016 Global economic activity remained subdued in Q1 2016, amid some unevenness in G3
growth. The Eurozone performed better than expected and Japan picked up from the
previous quarter of contraction, but US growth slipped further after a disappointing outturn
late last year. In Asia ex-Japan, a lacklustre outlook for global trade will continue to dampen
activity in the year ahead. On the whole, global GDP growth is projected to pull back to
3.7% in 2016, from 3.9% in 2015.
Singapore’s GDP is projected to grow by 1–3% in 2016 The domestic economy is likely to see modest growth over the coming quarters, with GDP
projected to expand by 1–3% for 2016. Trade-related sectors such as manufacturing and
transport & storage will continue to face external headwinds. Modern services should
remain a key source of support, even as growth momentum moderates alongside weaker
offshore lending and fund management activities. Meanwhile, public spending on social
services and infrastructure will impart some resilience to the domestic-oriented segments.
Core inflation will pick up gradually over the course of 2016 MAS Core Inflation is expected to rise over the course of 2016, as the disinflationary effects
of oil as well as budgetary and other one-off measures ease. However, the increase will be
mild, given the weak external price outlook, subdued economic growth prospects, and a
reduction in labour market tightness. For the whole of 2016, core inflation is likely to come
in at the lower half of the 0.5–1.5% forecast range, barring a sharp rise in global oil prices.
Lower COE premiums and housing rentals will continue to dampen CPI-All Items inflation,
which is expected to average between −1.0% and 0.0% in 2016. Is i
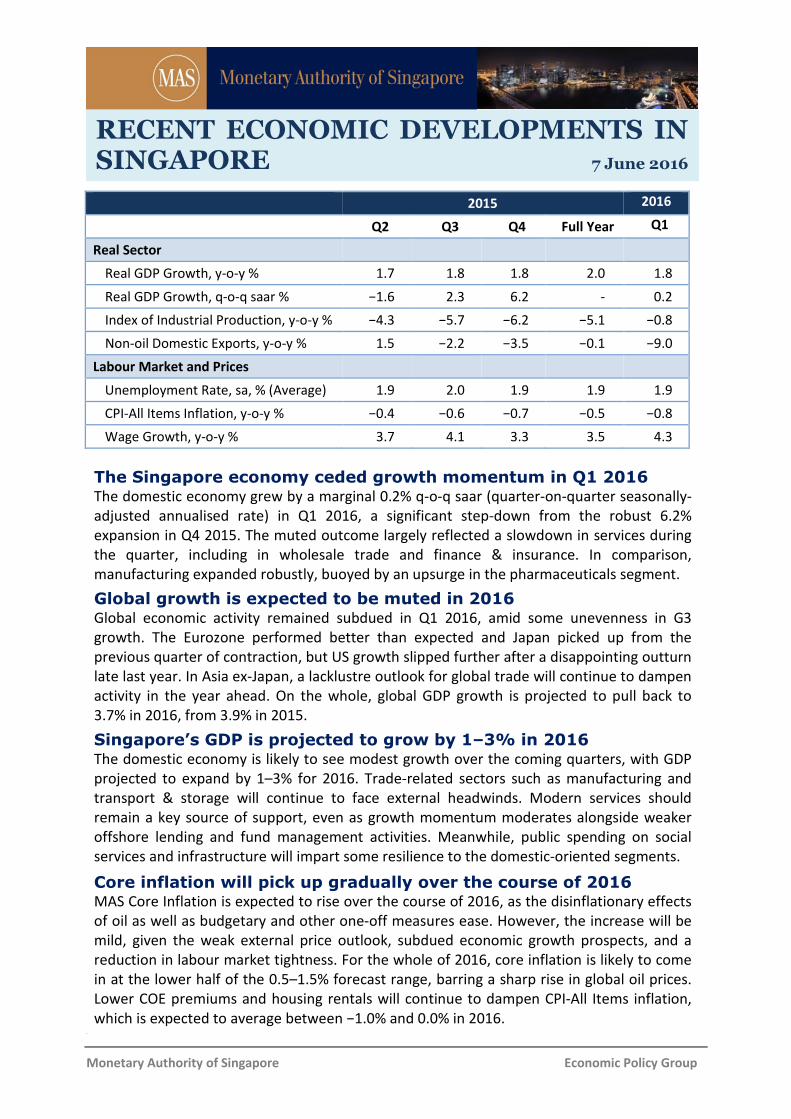
2015 2016
Q2 Q3 Q4 Full Year Q1
Real Sector
Real GDP Growth, y-o-y % 1.7 1.8 1.8 2.0 1.8
Real GDP Growth, q-o-q saar % −1.6 2.3 6.2 - 0.2
Index of Industrial Production, y-o-y % −4.3 −5.7 −6.2 −5.1 −0.8
Non-oil Domestic Exports, y-o-y % 1.5 −2.2 −3.5 −0.1 −9.0
Labour Market and Prices
Unemployment Rate, sa, % (Average) 1.9 2.0 1.9 1.9 1.9
CPI-All Items Inflation, y-o-y % −0.4 −0.6 −0.7 −0.5 −0.8
Wage Growth, y-o-y % 3.7 4.1 3.3 3.5 4.3
RECENT ECONOMIC DEVELOPMENTS IN SINGAPORE 7 June 2016
Page 2
Monetary Authority of Singapore 2 Economic Policy Group
A. External Developments
G3 growth rose in Q1 2016 on the back of resilient domestic
demand in the Eurozone and a turnaround in Japan
GDP growth in the G3 picked up to 1.5% q-o-q saar in Q1 2016, from a dismal 0.7% in Q4
2015. The improvement came from the Eurozone and Japan, as domestic demand boosted
growth in the former and the latter experienced a recovery from weather-related drags on
private consumption in the previous quarter. In comparison, the anticipated recovery in the
US, after a weaker-than-expected performance in Q4 2015, did not materialise. Overall,
reflecting continued weak investment and the cumulative loss of momentum over the past
two quarters, the projection for G3 growth in 2016 has been revised down to 1.4% from
1.7% in March 2016.
The US economy slowed further in Q1 2016.
GDP growth came in at 0.8% q-o-q saar, well
below the 1.4% registered in Q4 2015 and
2.0% in Q3. Nonetheless, the weak outcome
in the first quarter could be partly due to
some residual seasonality in the data, with
underlying growth assessed to be somewhat
stronger. According to the preliminary
estimates, the slowdown in Q1 2016 was due
to a combination of softer consumption
spending, a continued decline in private
investment, and weak exports. Personal
consumption growth eased to 1.9% q-o-q saar in Q1 from 2.4% in the preceding quarter,
largely due to a pullback in demand for durable goods, as services spending held relatively
firm. Meanwhile, business fixed investment contracted, weighed down by a 6.2% fall in
non-residential investment—in part a reflection of the slump in the oil and gas sector.
However, residential investment continued to pull ahead of the rest of the economy,
posting a 17.1% increase on the back of rising house prices and higher new home sales. Net
exports and inventory destocking acted as drags, subtracting 0.2% point each from overall
GDP growth in Q1.
Economic activity in the US is expected to pick up in the next few quarters. Labour market
conditions have stayed relatively firm on the whole. Although nonfarm payroll growth
slowed unexpectedly to 38,000 in May from 123,000 in April, the monthly average of
150,000 new jobs created in the first five months of this year still exceeded the long-run
sustainable growth rate estimated by the US Federal Reserve.1 Moreover, wage increases
have also picked up pace to 0.7% q-o-q sa in Q1 2016, from 0.5% in Q4 2015, while average
hourly earnings rose by 2.5% y-o-y in Apr–May. The ongoing recovery in the labour market,
Stronger growth in the Eurozone and Japan
more than offset the US slowdown in Q1.
Source: CEIC
1 The long-run sustainable employment growth rate, which is the number of jobs required to keep the unemployment rate
unchanged, is estimated by the Federal Reserve Bank of Chicago to be around 80,000 jobs per month.
2010 2011 2012 2013 2014 2015 2016-10
-5
0
5
10
15
% Q
OQ
SA
AR
Q1
US
JapanEurozone
Page 3
Monetary Authority of Singapore 3 Economic Policy Group
alongside sustained improvements in housing, should provide continued support to
consumption spending. Retail sales figures for April were encouraging, with sales rising by a
creditable 3.0% y-o-y, led by a pickup in auto sales. Further, industrial production in the
same month rose by 0.7% m-o-m sa after an extended period of sluggishness, although the
mining sector continued to contract. On the whole, GDP growth in the US is expected to
come in at 1.8% in 2016, before improving to 2.3% in 2017.
Economic activity in the Eurozone gathered pace in Q1 2016, recording its fastest pace of
growth in four quarters. GDP growth accelerated to 2.1% q-o-q saar, from the previous
quarter’s print of 1.3%. Preliminary data pointed to robust domestic demand, including
government spending, providing the boost, while external demand remained subdued.
Among the major economies, Germany and France recorded solid growth of 2.7% and 2.6%
q-o-q saar respectively, well exceeding their averages of 1.7% and 1.2% since the sovereign
debt crisis abated in Q2 2013. For Germany in particular, the pace of rebalancing towards
domestic demand was faster than expected, while consumption and investment staged an
unexpectedly strong rebound in France after the November 2015 Paris terror attacks.
Despite being mired in political uncertainty, Spain turned in yet another quarter of fairly
rapid gains, expanding by 3.1% q-o-q saar in Q1, while the Italian economy managed to
grow by 1.0% q-o-q saar. Elsewhere, the Greek economy lapsed back into contraction for
the second time in three quarters, standing in contrast to Cyprus, which saw growth more
than double in Q1 as it exited the EU’s bailout programme.
The Eurozone economy should continue on a moderate expansion path in 2016, although
the growth momentum could slow. Domestic demand will remain a key driver of the
recovery, supported by accommodative monetary policy, sustained improvements in the
labour market, as well as a slightly expansionary fiscal stance. Nonetheless, the faster pace
of growth seen in Q1 2016 may not be sustained. The Eurozone Composite Output PMI
dipped further to 53.1 in May—its weakest reading since Jan 2015—as new orders
continued on a broad downtrend. Moreover, consumer and business confidence softened
amid the bout of financial market volatility early this year, which could in turn restrain
domestic demand. On the external front, the region’s subdued export performance will
likely pose a continued drag to growth, on account of lacklustre demand in key trading
partners such as China, and the uncertainty over a possible UK exit from the EU. All in, GDP
growth in the Eurozone is projected at 1.6% in both 2016 and 2017.
The Japanese economy returned to growth in Q1 2016, as a bounce-back in private
consumption helped to avert a technical recession. On a q-o-q saar basis, GDP increased by
1.7% in Q1 2016, reversing the contraction in Q4 2015. Private consumption growth
rebounded to 1.9% q-o-q saar, as consumers compensated for weaker spending in the
previous quarter due to unseasonal weather. However, corporate investment spending
disappointed as firms maintained a cautious outlook. Residential investment fell for a
second quarter in Q1, by 3.0% q-o-q saar, while non-residential investment contracted by
5.3%, after expanding by 4.7% in Q4 2015. Meanwhile, net exports contributed 0.8% point
Page 4
Monetary Authority of Singapore 4 Economic Policy Group
to Q1 GDP growth, with stronger exports to the advanced economies more than offsetting
the protracted weakness in Asian markets.
Despite the encouraging performance in Q1 2016, Japan is expected to post only modest
growth this year. While the pickup in real wage growth and still-healthy corporate profits
should support a gradual improvement in domestic demand, the tepid external
environment and subdued investment prospects will cap the extent of the recovery.
Further, the recent appreciation of the yen may dampen business sentiment and dent
corporate profits, which could further hold back capital spending and restrain salary
increments. In the near term, GDP growth in Q2 will be weighed down by the impact of the
April earthquake in the Kumamoto region, as automobile production in particular was
temporarily disrupted. All in, Japan’s growth is anticipated to come in at 0.5% in 2016, with
a similar pace of expansion projected for 2017.
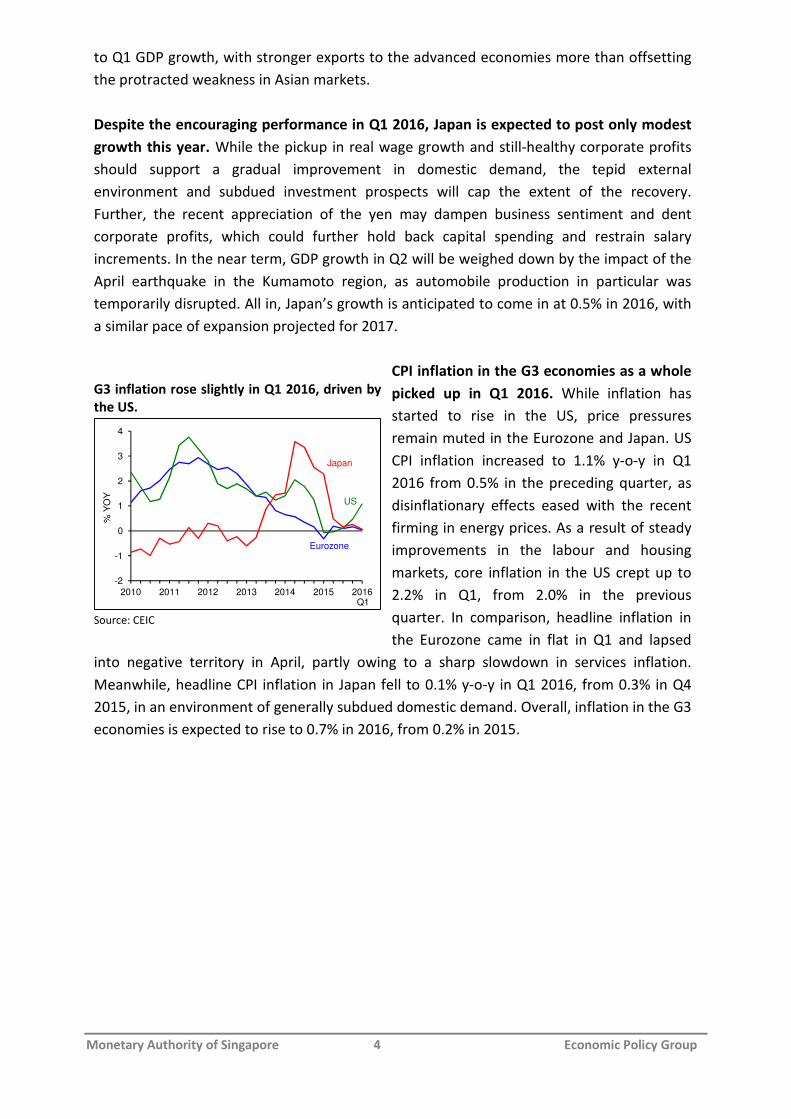
CPI inflation in the G3 economies as a whole
picked up in Q1 2016. While inflation has
started to rise in the US, price pressures
remain muted in the Eurozone and Japan. US
CPI inflation increased to 1.1% y-o-y in Q1
2016 from 0.5% in the preceding quarter, as
disinflationary effects eased with the recent
firming in energy prices. As a result of steady
improvements in the labour and housing
markets, core inflation in the US crept up to
2.2% in Q1, from 2.0% in the previous
quarter. In comparison, headline inflation in
the Eurozone came in flat in Q1 and lapsed
into negative territory in April, partly owing to a sharp slowdown in services inflation.
Meanwhile, headline CPI inflation in Japan fell to 0.1% y-o-y in Q1 2016, from 0.3% in Q4
2015, in an environment of generally subdued domestic demand. Overall, inflation in the G3
economies is expected to rise to 0.7% in 2016, from 0.2% in 2015.
G3 inflation rose slightly in Q1 2016, driven by
the US.
Source: CEIC
2010 2011 2012 2013 2014 2015 2016-2
-1
0
1
2
3
4
% Y
OY
Q1
US
Japan
Eurozone
Page 5
Monetary Authority of Singapore 5 Economic Policy Group
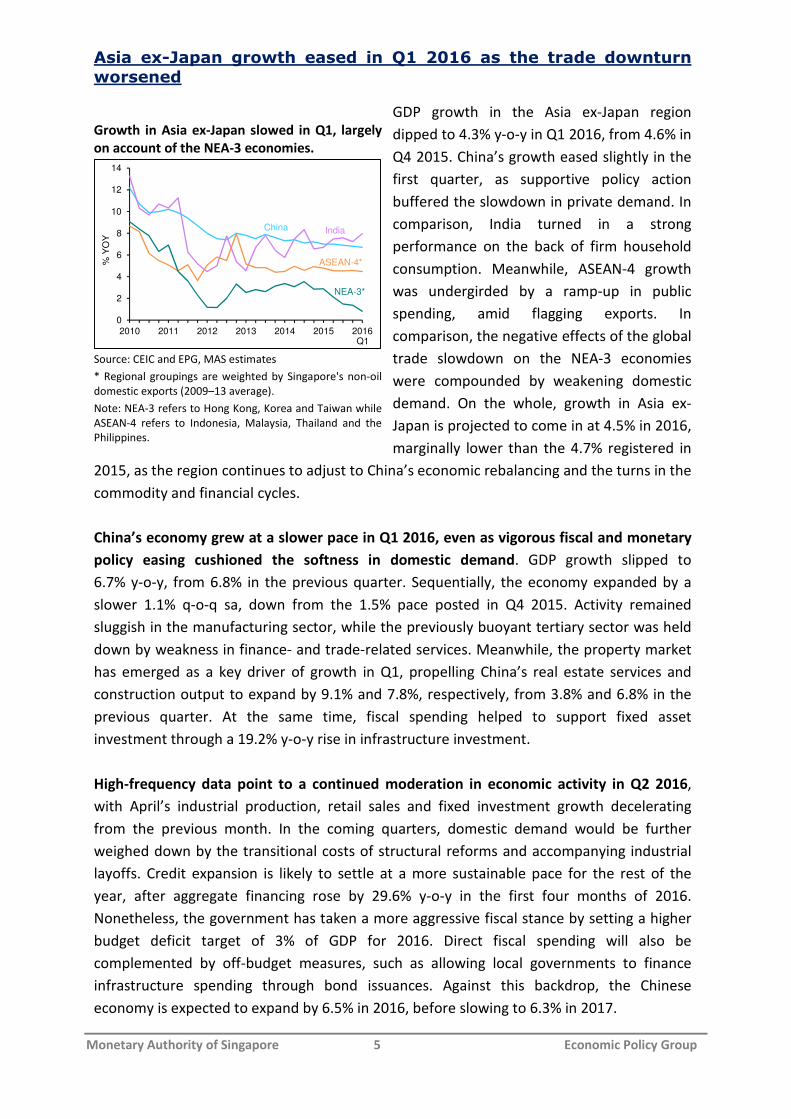
Asia ex-Japan growth eased in Q1 2016 as the trade downturn worsened
GDP growth in the Asia ex-Japan region
dipped to 4.3% y-o-y in Q1 2016, from 4.6% in
Q4 2015. China’s growth eased slightly in the
first quarter, as supportive policy action
buffered the slowdown in private demand. In
comparison, India turned in a strong
performance on the back of firm household
consumption. Meanwhile, ASEAN-4 growth
was undergirded by a ramp-up in public
spending, amid flagging exports. In
comparison, the negative effects of the global
trade slowdown on the NEA-3 economies
were compounded by weakening domestic
demand. On the whole, growth in Asia ex-
Japan is projected to come in at 4.5% in 2016,
marginally lower than the 4.7% registered in
2015, as the region continues to adjust to China’s economic rebalancing and the turns in the
commodity and financial cycles.
China’s economy grew at a slower pace in Q1 2016, even as vigorous fiscal and monetary
policy easing cushioned the softness in domestic demand. GDP growth slipped to
6.7% y-o-y, from 6.8% in the previous quarter. Sequentially, the economy expanded by a
slower 1.1% q-o-q sa, down from the 1.5% pace posted in Q4 2015. Activity remained
sluggish in the manufacturing sector, while the previously buoyant tertiary sector was held
down by weakness in finance- and trade-related services. Meanwhile, the property market
has emerged as a key driver of growth in Q1, propelling China’s real estate services and
construction output to expand by 9.1% and 7.8%, respectively, from 3.8% and 6.8% in the
previous quarter. At the same time, fiscal spending helped to support fixed asset
investment through a 19.2% y-o-y rise in infrastructure investment.
High-frequency data point to a continued moderation in economic activity in Q2 2016,
with April’s industrial production, retail sales and fixed investment growth decelerating
from the previous month. In the coming quarters, domestic demand would be further
weighed down by the transitional costs of structural reforms and accompanying industrial
layoffs. Credit expansion is likely to settle at a more sustainable pace for the rest of the
year, after aggregate financing rose by 29.6% y-o-y in the first four months of 2016.
Nonetheless, the government has taken a more aggressive fiscal stance by setting a higher
budget deficit target of 3% of GDP for 2016. Direct fiscal spending will also be
complemented by off-budget measures, such as allowing local governments to finance
infrastructure spending through bond issuances. Against this backdrop, the Chinese
economy is expected to expand by 6.5% in 2016, before slowing to 6.3% in 2017.
Growth in Asia ex-Japan slowed in Q1, largely
on account of the NEA-3 economies.
Source: CEIC and EPG, MAS estimates
* Regional groupings are weighted by Singapore's non-oil
domestic exports (2009–13 average).
Note: NEA-3 refers to Hong Kong, Korea and Taiwan while
ASEAN-4 refers to Indonesia, Malaysia, Thailand and the
Philippines.
0
2
4
6
8
10
12
14
2010 2011 2012 2013 2014 2015 2016
% Y
OY
Q1
IndiaChina
ASEAN-4*
NEA-3*
Page 6
Monetary Authority of Singapore 6 Economic Policy Group
India’s GDP growth accelerated in Q1 2016, as robust private consumption compensated
for slackening investment. The economy expanded by 7.9% y-o-y in Q1, up from 7.2% in Q4
2015. The strong outturn was underpinned by robust household consumption growth,
which picked up to 8.3% y-o-y in Q1, led by urban residents. However, a source of concern
was the decline in fixed investment of 1.9% y-o-y—the first contraction in two years—which
reflected continued sluggishness in private capex, in turn weighed down by tighter financing
conditions, a debt overhang, and subdued global demand. In the year ahead, growth is
anticipated to be narrowly based, with private consumption as the main driver. The
impending civil service pay hike, a normal monsoon, and ongoing public investment will
lend additional support, though there are no immediate signs of a turnaround in exports
and private capital expenditure. All in, GDP growth is expected to rise modestly to 7.7% in
FY2017, from 7.6% in FY2016.2
The NEA-3 economies experienced a further step-down in activity, buffeted by an uneven
G3 recovery and the slowdown in China. As a whole, the region grew by a mere 0.6% q-o-q
saar in Q1 after expanding by a sub-par 1.2% in the preceding quarter, as hitherto resilient
domestic demand faltered. In Hong Kong, GDP contracted by 1.8% q-o-q saar in Q1, more
than reversing the 0.8% expansion in Q4 2015, due to deteriorating private consumption
and renewed weakness in gross capital formation. While Taiwan saw its growth momentum
pick up to 3.1% q-o-q saar from 0.8% in the previous quarter due largely to import
compression, GDP has been contracting for three straight quarters in year-ago terms.
Korea’s economic performance in Q1 was also weaker, with growth dipping to
2.1% q-o-q saar from 2.7% in the preceding quarter, owing to a retrenchment in private
consumption as tax rebates on consumer durables expired.
The region faces the prospect of below-trend growth for another year. Retail sales in Hong
Kong are expected to remain depressed, amid further declines in Chinese tourist arrivals.
Taiwan’s economic outlook is clouded by some uncertainty over the policy direction of the
new administration, faltering global demand for consumer electronics, as well as changing
structural trade patterns, with China reducing its dependence on intermediate imports of IT
components. In Korea, elevated household debt levels will blunt the efficacy of the
accommodative monetary policy put in place since June 2015, even as the country’s
manufacturers continue to face sluggish external demand and stiff competition from China.
Overall, NEA-3 growth is projected to slow to 1.8% this year, from 1.9% in 2015, before
picking up to 2.2% in 2017.
The ASEAN-4 economies expanded at a tepid pace in Q1, as weakness in external demand
continued to exert a drag on economic activity. The region recorded a fourth consecutive
quarter of lacklustre growth of 4.5% y-o-y in Q1, compared with the average of 5.0% in
2011–15. Real exports contracted in Malaysia and Indonesia during the first quarter, while
recording slower growth in the Philippines. Although Thailand posted a rebound in exports,
2 India reports its economic figures on a Financial Year basis. FY2017 refers to the period from April 2016 to March
2017.
Page 7
Monetary Authority of Singapore 7 Economic Policy Group
this was largely on account of a robust services performance, particularly in tourism-related
sectors. Meanwhile, private investment growth in the region stayed soft, reflecting the
export underperformance as well as weak economic sentiment in several countries. Private
consumption remained the lynchpin of growth, supported by resilient labour markets and
the boost to real incomes from low energy prices. In Indonesia, Thailand and the
Philippines, a ramp-up in public infrastructure building also provided a lift to overall
investment activity.
Growth in the ASEAN-4 region is projected to slow further in 2016, on account of the
mediocre global outlook and softening domestic demand in some economies. Malaysia is
expected to see the largest downshift in growth, from 5.0% in 2015 to 4.2% this year. Being
the region’s most open economy, Malaysia is significantly affected by the weakness in
external demand, while domestic demand growth will be constrained by ongoing fiscal
consolidation as well as weak consumer and investor confidence. GDP growth in Thailand is
likely to stay anaemic at 2.9% this year, as domestic demand continues to be held back by
high household debt and political uncertainty. Meanwhile, Indonesia’s growth is expected
to improve to 5.0% in 2016, from 4.8% in 2015. Following the economic reforms undertaken
last year and a more business-friendly environment, investor sentiment has improved
discernibly alongside higher public development spending. In addition, the policy rate cuts
implemented by BI in Jan–Mar 2016 will provide a fillip to business and household
spending. The Philippines remains the strongest performer among the ASEAN-4 countries,
with an expected growth outturn of around 5.9% in 2016, similar to last year’s pace. The
expansion will be supported by continued outperformance in exports as a result of
improving merchandise trade competitiveness, as well as solid increases in modern services
exports such as business process outsourcing. For the region as a whole, however, GDP
growth is projected to ease to 4.4% in 2016, from 4.6% last year, before recovering to 4.7%
in 2017.
Headline inflation in Asia ex-Japan edged
higher in Q1 2016. CPI inflation for the region
came in at 2.7% y-o-y in Q1, up from 2.3% in
Q4. China and the NEA-3 saw an increase in
price pressures, while inflation in India and
ASEAN-4 remained largely unchanged. In
China, headline inflation picked up to
2.1% y-o-y in Q1 2016 from 1.5% in the
previous quarter, as pork prices rose in
response to a supply shortage. Nevertheless,
producer prices fell at a slower rate of 4.8%
y-o-y, helped by the property market rebound
and government stimulus. In the NEA-3, CPI
inflation rose to 1.5% y-o-y in Q1 2016 from
1.1% in Q4 2015, as a cold spell in the region led to higher food prices. Within the ASEAN-4
CPI inflation rose slightly in Asia ex-Japan.
Source: CEIC and EPG, MAS estimates
* Regional groupings are weighted by 2013 nominal GDP.
** India’s series uses CPI (Industrial Workers) prior to
2012.
0
4
8
12
16
2010 2011 2012 2013 2014 2015 2016
% Y
OY
Q1
India**
China
ASEAN-4*
NEA-3*
Page 8
Monetary Authority of Singapore 8 Economic Policy Group
economies, headline inflation stayed low at 3.0% y-o-y in Q1, partly due to weak energy
prices, especially in Indonesia. Malaysia, however, saw a surge in inflation in Q1, due to
upward adjustments to administrative prices as a follow-through to the Goods and Services
Tax (GST) implemented last April. Headline inflation in India was unchanged at 5.3% in Q1
from the previous quarter, with food price inflation holding steady. For 2016, headline
inflation in Asia ex-Japan is expected to edge up to 2.5%, from 2.3% in 2015.
Table 1: Consensus Forecasts of GDP Growth
2014 2015 Forecast
2016 2017
Percent
Industrial
US 2.4 2.4 1.8 2.3
Japan 0.0 0.6 0.5 0.5
Eurozone 0.9 1.5 1.6 1.6
UK 2.9 2.3 1.9 2.2
NEA-3
Hong Kong 2.7 2.4 1.7 1.9
Korea 3.3 2.6 2.6 2.8
Taiwan 3.9 0.6 1.3 2.1
ASEAN-4
Indonesia 5.0 4.8 5.0 5.3
Malaysia 6.0 5.0 4.2 4.4
Thailand 0.8 2.8 2.9 3.3
Philippines 6.2 5.9 5.9 5.9
China 7.3 6.9 6.5 6.3
India* 6.6 7.2 7.6 7.7
Source: CEIC and Consensus Economics, May 2016
* Figures are reported on a Financial Year basis; FY2017 refers to
the period from April 2016 to March 2017.
Page 9
Monetary Authority of Singapore 9 Economic Policy Group
B. Domestic Developments
Singapore’s growth weakened in Q1 2016
The domestic economy began the year on a muted note, with growth easing sharply to
0.2% q-o-q saar in Q1, from 6.2% in the preceding quarter. The loss of momentum reflected
in part a pullback in the modern services cluster. Specifically, the financial sector’s
performance was weighed down by weakening credit demand from the region, as well as
lower fee income from fund management activities. The support from domestic-oriented
activities had also waned, with sluggish retail performance dampening the cluster’s growth.
In comparison, the trade-related industries provided some countervailing support, with the
manufacturing sector growing more strongly than expected.
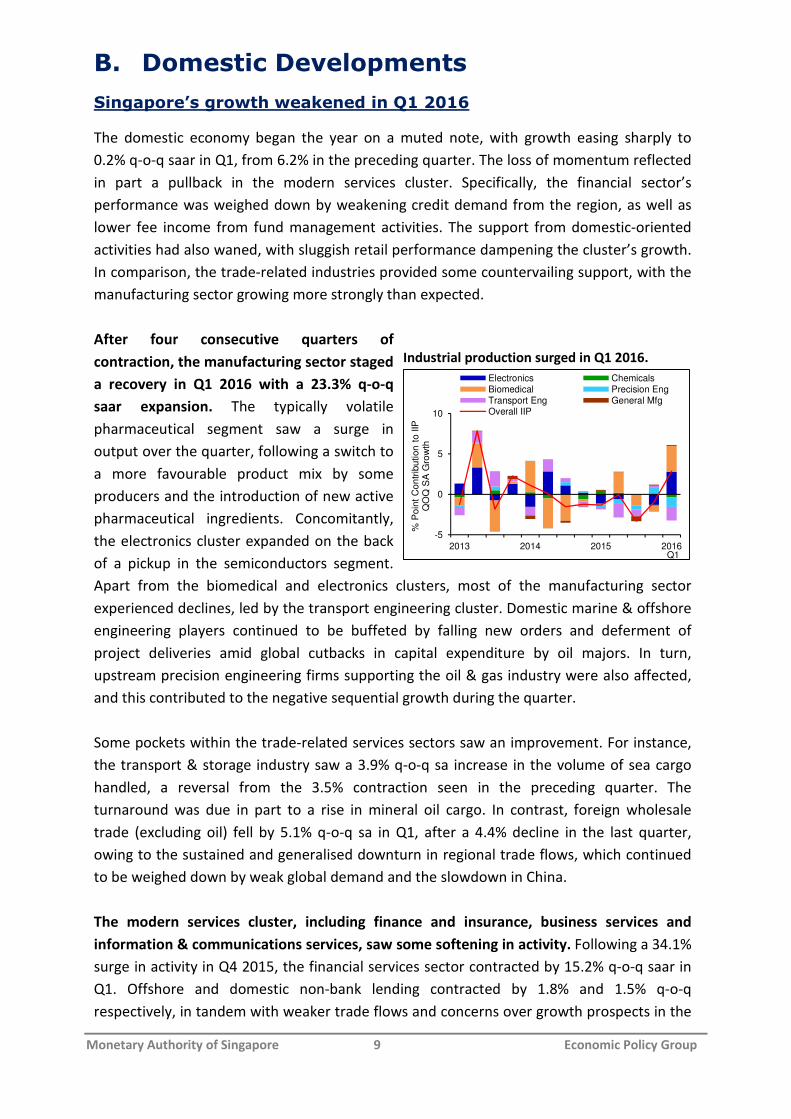
After four consecutive quarters of
contraction, the manufacturing sector staged
a recovery in Q1 2016 with a 23.3% q-o-q
saar expansion. The typically volatile
pharmaceutical segment saw a surge in
output over the quarter, following a switch to
a more favourable product mix by some
producers and the introduction of new active
pharmaceutical ingredients. Concomitantly,
the electronics cluster expanded on the back
of a pickup in the semiconductors segment.
Apart from the biomedical and electronics clusters, most of the manufacturing sector
experienced declines, led by the transport engineering cluster. Domestic marine & offshore
engineering players continued to be buffeted by falling new orders and deferment of
project deliveries amid global cutbacks in capital expenditure by oil majors. In turn,
upstream precision engineering firms supporting the oil & gas industry were also affected,
and this contributed to the negative sequential growth during the quarter.
Some pockets within the trade-related services sectors saw an improvement. For instance,
the transport & storage industry saw a 3.9% q-o-q sa increase in the volume of sea cargo
handled, a reversal from the 3.5% contraction seen in the preceding quarter. The
turnaround was due in part to a rise in mineral oil cargo. In contrast, foreign wholesale
trade (excluding oil) fell by 5.1% q-o-q sa in Q1, after a 4.4% decline in the last quarter,
owing to the sustained and generalised downturn in regional trade flows, which continued
to be weighed down by weak global demand and the slowdown in China.
The modern services cluster, including finance and insurance, business services and
information & communications services, saw some softening in activity. Following a 34.1%
surge in activity in Q4 2015, the financial services sector contracted by 15.2% q-o-q saar in
Q1. Offshore and domestic non-bank lending contracted by 1.8% and 1.5% q-o-q
respectively, in tandem with weaker trade flows and concerns over growth prospects in the
Industrial production surged in Q1 2016.
2013 2014 2015 2016
-5
0
5
10%
Po
int
Co
ntr
ibu
tion
to I
IP
QO
Q S
A G
row
th
Electronics ChemicalsBiomedical Precision EngTransport Eng General MfgOverall IIP
Q1
Page 10
Monetary Authority of Singapore 10 Economic Policy Group
region. Notably, ACU non-bank loans extended to East Asia and domestic non-bank lending
to corporates in the trade-related segments eased significantly in the quarter. Among the
sentiment-sensitive activities, the fund management industry suffered a pullback in fees
and commissions earned in Q1, after the lump-sum recognition of performance bonuses in
the preceding quarter. However, the impact of this reversal was partially mitigated by the
robust performance of the forex segment, with average daily turnover spiking 36% in q-o-q
terms.
Concomitantly, the subdued business environment filtered through to weaker outturns in
the business services and information & communications sectors. The business services
sector experienced a mild decline of 0.2% q-o-q saar in Q1, compared to the 1.8%
expansion in Q4 2015, as corporate demand for rental & leasing, accounting and
consultancy services eased. Likewise, the information and communications sector saw a
3.1% q-o-q saar contraction in Q1, as activity softened in the telecommunications and
media-related segments.
Tourism-related activities grew at a healthy pace in Q1 2016, largely spurred by a rise in
Asian visitor arrivals, particularly from China. Notably, tourist arrivals from this key market
surged by 52% q-o-q, on the back of recent initiatives by the Singapore Tourism Board to
expand its online marketing presence in China. For instance, multi-year partnerships had
been inked with several popular Chinese online travel services and review sites, to promote
Singapore’s offerings as a travel destination and encourage the sharing of travellers’ post-
trip experiences.
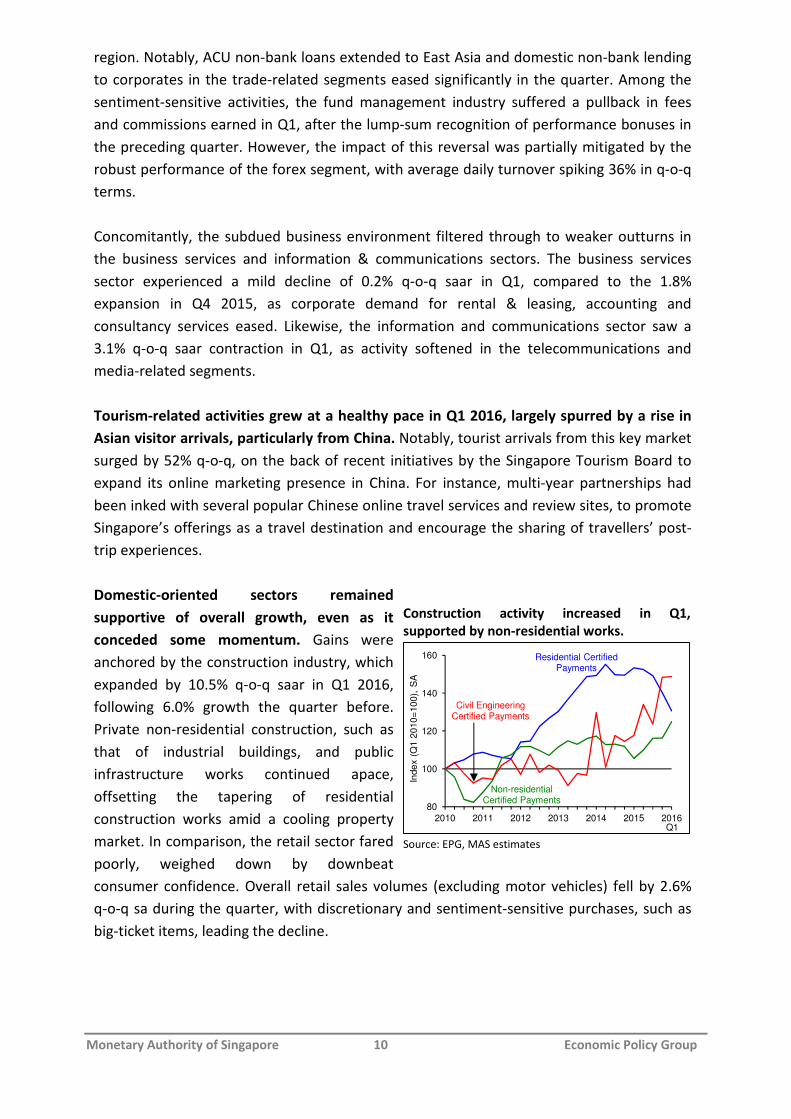
Domestic-oriented sectors remained
supportive of overall growth, even as it
conceded some momentum. Gains were
anchored by the construction industry, which
expanded by 10.5% q-o-q saar in Q1 2016,
following 6.0% growth the quarter before.
Private non-residential construction, such as
that of industrial buildings, and public
infrastructure works continued apace,
offsetting the tapering of residential
construction works amid a cooling property
market. In comparison, the retail sector fared
poorly, weighed down by downbeat
consumer confidence. Overall retail sales volumes (excluding motor vehicles) fell by 2.6%
q-o-q sa during the quarter, with discretionary and sentiment-sensitive purchases, such as
big-ticket items, leading the decline.
Construction activity increased in Q1,
supported by non-residential works.
Source: EPG, MAS estimates
2010 2011 2012 2013 2014 2015 2016
80
100
120
140
160
Inde
x (
Q1
20
10
=10
0),
SA
Residential CertifiedPayments
Civil Engineering Certified Payments
Non-residential Certified Payments
Q1
Page 11
Monetary Authority of Singapore 11 Economic Policy Group
The Singapore economy is likely to remain on a modest growth path in the quarters ahead
Against the subdued global economic backdrop, the Singapore economy is likely to
experience modest growth. For 2016, GDP is projected to expand by 1–3%. The slowdown
in China will continue to weigh on the region’s near-term outlook, as well as prospects for
global commodities, and in turn dampen demand for Singapore’s goods and services such
as chemicals, merchanting and financial intermediation.
The sluggish demand conditions are likewise mirrored in the global IT industry. Weak
spending on IT products, such as PCs and mobile devices, and elevated inventory levels are
expected to tip worldwide semiconductor revenue into its second consecutive year of
decline, after a poor performance in 2015.3 This would have a knock-on impact on
Singapore’s electronics cluster. Nevertheless, there are tentative signs that the domestic
electronics industry could soon be reaching a trough, with sentiments starting to improve. A
net weighted balance of 9% of electronics firms expected business conditions to pick up in
Apr–Sep 2016, according to EDB’s latest Business Expectations of the Manufacturing Sector
Survey, compared to a reading of −32% three months ago.
Meanwhile, modern services should provide support in 2016. The global proliferation and
adoption of new technologies have generated firm demand for ICT services, and this will in
turn confer positive spillovers to the domestic ICT sector. In addition, as the government’s
“Smart Nation” initiative—which includes procurement of a wide range of IT services and
infrastructure4—gathers pace, the stream of planned ICT projects will provide a fillip to the
information & communications services sector. In the financial services industry,
demographic trends and increasing awareness of financial planning should continue to
provide structural support to the insurance segment, given that Singapore’s life insurance
penetration rate is still relatively low when compared to regional developed economies
such as Hong Kong and Korea.5
Turning to the domestic-facing sectors, a steady stream of public infrastructure projects
underpinned by ongoing upgrades to social services and transport facilities will sustain
construction activity. Government expenditure on healthcare and education will also help
to meet pent-up demand for essential services.
Nonetheless, there are downside risks to growth. Transitional drags in China from the
ongoing reforms and excess capacity in its manufacturing industries could weigh more
heavily on prospects in the region. A reprisal of the volatility witnessed in the Chinese stock
3 In April 2016, Gartner downgraded its worldwide semiconductor revenue growth forecast to −0.6%.
4 In May 2016, the Government announced that a projected S$2.8 billion worth of ICT tenders will be called in FY2016—the
highest figure since 2012. The enhancement of ICT infrastructure to better support the data and digital services needs of a
Digital Government will account for more than half of the projected budget.
5 Singapore’s life insurance penetration rate (gross life insurance premiums as a percentage of GDP) stands at 5.7% as of 2014.
This is lower than Hong Kong (12.7%), Japan (7.2%) and Korea (7.4%), according to the latest (2014) OECD insurance statistics.
Page 12
Monetary Authority of Singapore 12 Economic Policy Group
and currency markets in 2015 and early 2016 would also dampen investor and business
sentiments. Further, the regional economies are vulnerable to large capital outflows should
there be an unexpected tightening of monetary conditions in the US this year.
Page 13
Monetary Authority of Singapore 13 Economic Policy Group
C. Labour Market and Consumer Prices
Overall net employment gains slowed to 11,400 in Q1 2016
Preliminary estimates showed that overall net employment grew by 11,400 in Q1 2016,
following the gain of 16,100 in the preceding quarter. Hiring in the services sectors
moderated, even as the manufacturing sector continued to experience headcount losses.
Meanwhile, employment gains picked up slightly in the construction sector.
The manufacturing sector shed 2,000 workers in Q1 2016, which was less than the average
quarterly employment decline of 5,500 in 2015. Nonetheless, the latest contraction in
headcount continues to reflect ongoing restructuring in the sector, as well as weaker
demand conditions as global growth slowed.
The services sector added 11,900 workers in the first quarter, a step-down from the 21,500
jobs created in the preceding period. This was partly due to the exit of temporary workers
in the retail trade and accommodation & food services industries, who were previously
employed to meet the seasonal pickup in consumer demand during the year-end festive
period. Meanwhile, job creation remained resilient in education, healthcare and other
social services, given the ongoing capacity expansions in these sectors. At the same time,
the acceleration of building activity boosted job gains in construction to 1,600 in Q1 2016,
from 900 in Q4 2015.
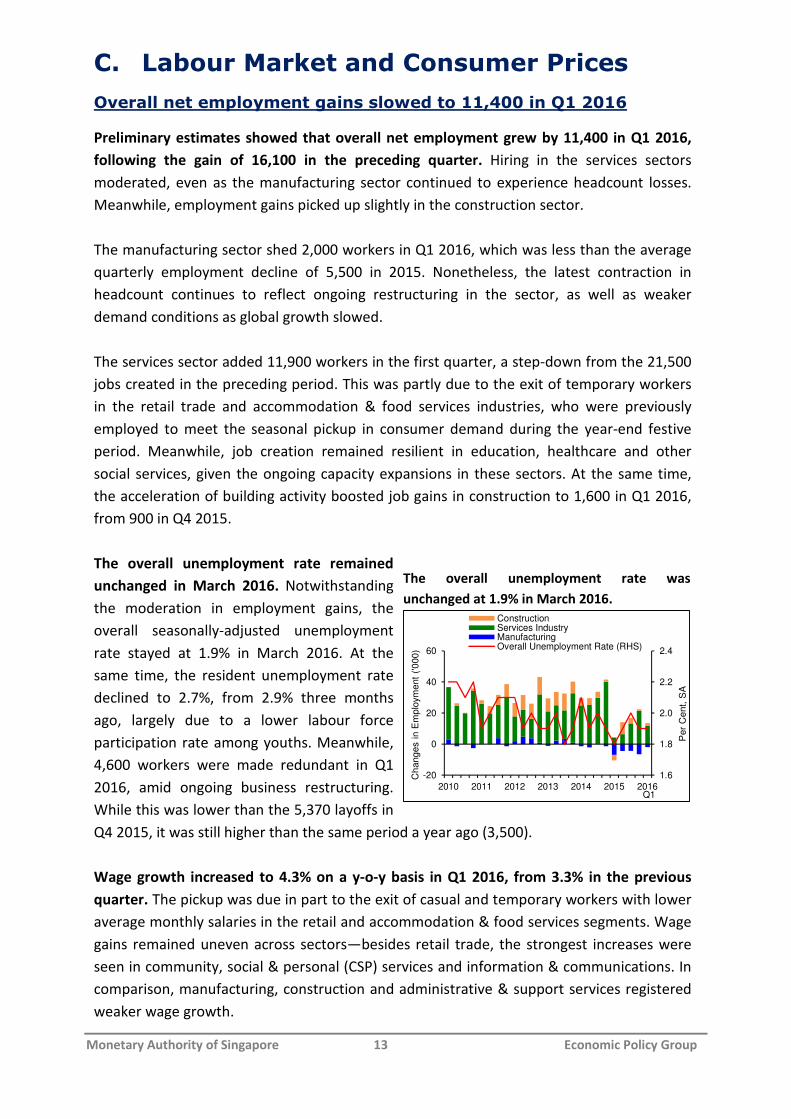
The overall unemployment rate remained
unchanged in March 2016. Notwithstanding
the moderation in employment gains, the
overall seasonally-adjusted unemployment
rate stayed at 1.9% in March 2016. At the
same time, the resident unemployment rate
declined to 2.7%, from 2.9% three months
ago, largely due to a lower labour force
participation rate among youths. Meanwhile,
4,600 workers were made redundant in Q1
2016, amid ongoing business restructuring.
While this was lower than the 5,370 layoffs in
Q4 2015, it was still higher than the same period a year ago (3,500).
Wage growth increased to 4.3% on a y-o-y basis in Q1 2016, from 3.3% in the previous
quarter. The pickup was due in part to the exit of casual and temporary workers with lower
average monthly salaries in the retail and accommodation & food services segments. Wage
gains remained uneven across sectors—besides retail trade, the strongest increases were
seen in community, social & personal (CSP) services and information & communications. In
comparison, manufacturing, construction and administrative & support services registered
weaker wage growth.
The overall unemployment rate was
unchanged at 1.9% in March 2016.
2010 2011 2012 2013 2014 2015 2016
1.6
1.8
2.0
2.2
2.4
-20
0
20
40
60
Per
Ce
nt,
SA
Ch
ang
es i
n E
mp
loym
ent
('0
00
)
ConstructionServices IndustryManufacturingOverall Unemployment Rate (RHS)
Q1
Page 14
Monetary Authority of Singapore 14 Economic Policy Group
In the near term, overall employment gains are expected to be modest, given subdued
labour demand as well as supply constraints. Wage pressures are likely to moderate in line
with the weak economic environment and the easing in overall labour market tightness.
However, wage increments will continue to be stronger in industries where manpower
shortages are more acute, such as CSP services.
Core and overall inflation diverged in Q1 2016
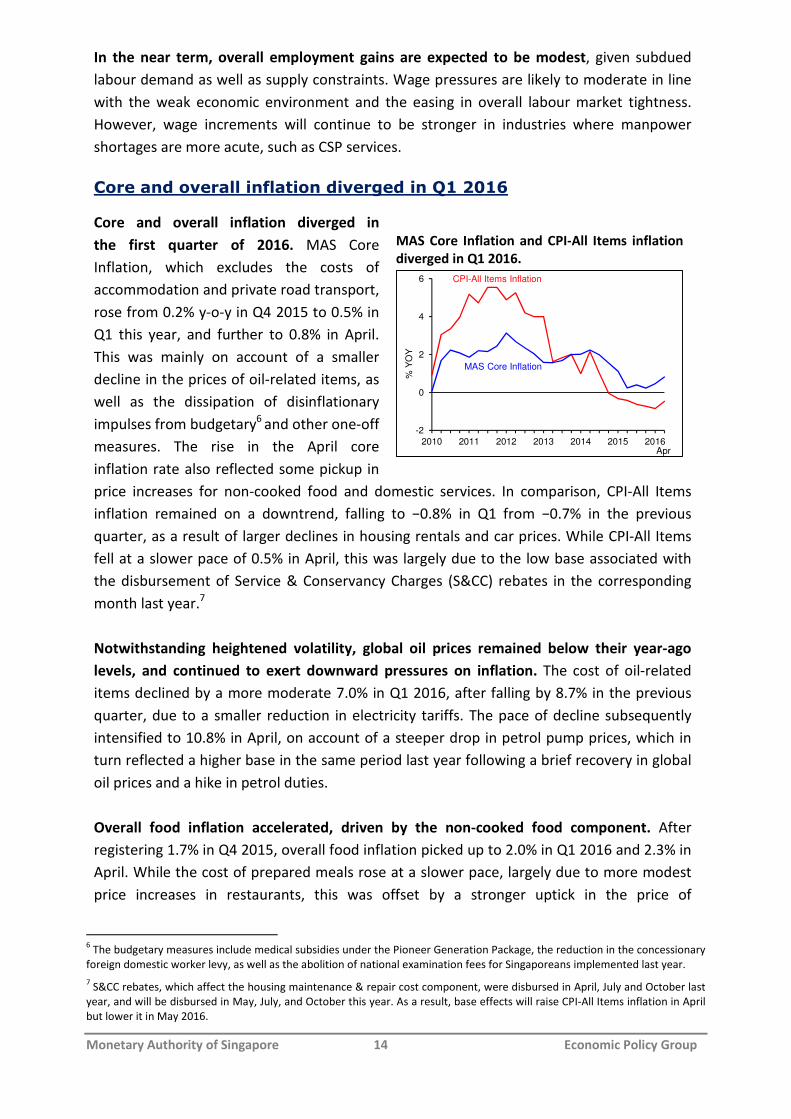
Core and overall inflation diverged in
the first quarter of 2016. MAS Core
Inflation, which excludes the costs of
accommodation and private road transport,
rose from 0.2% y-o-y in Q4 2015 to 0.5% in
Q1 this year, and further to 0.8% in April.
This was mainly on account of a smaller
decline in the prices of oil-related items, as
well as the dissipation of disinflationary
impulses from budgetary6 and other one-off
measures. The rise in the April core
inflation rate also reflected some pickup in
price increases for non-cooked food and domestic services. In comparison, CPI-All Items
inflation remained on a downtrend, falling to −0.8% in Q1 from −0.7% in the previous
quarter, as a result of larger declines in housing rentals and car prices. While CPI-All Items
fell at a slower pace of 0.5% in April, this was largely due to the low base associated with
the disbursement of Service & Conservancy Charges (S&CC) rebates in the corresponding
month last year.7
Notwithstanding heightened volatility, global oil prices remained below their year-ago
levels, and continued to exert downward pressures on inflation. The cost of oil-related
items declined by a more moderate 7.0% in Q1 2016, after falling by 8.7% in the previous
quarter, due to a smaller reduction in electricity tariffs. The pace of decline subsequently
intensified to 10.8% in April, on account of a steeper drop in petrol pump prices, which in
turn reflected a higher base in the same period last year following a brief recovery in global
oil prices and a hike in petrol duties.
Overall food inflation accelerated, driven by the non-cooked food component. After
registering 1.7% in Q4 2015, overall food inflation picked up to 2.0% in Q1 2016 and 2.3% in
April. While the cost of prepared meals rose at a slower pace, largely due to more modest
price increases in restaurants, this was offset by a stronger uptick in the price of
MAS Core Inflation and CPI-All Items inflation
diverged in Q1 2016.
6 The budgetary measures include medical subsidies under the Pioneer Generation Package, the reduction in the concessionary
foreign domestic worker levy, as well as the abolition of national examination fees for Singaporeans implemented last year.
7 S&CC rebates, which affect the housing maintenance & repair cost component, were disbursed in April, July and October last
year, and will be disbursed in May, July, and October this year. As a result, base effects will raise CPI-All Items inflation in April
but lower it in May 2016.
2010 2011 2012 2013 2014 2015 2016
-2
0
2
4
6
% Y
OY
MAS Core Inflation
CPI-All Items Inflation
Apr
Page 15
Monetary Authority of Singapore 15 Economic Policy Group
non-cooked food. The latter reflected the expiry of various temporary supermarket price
discounts in January, as well as some supply disruptions due to adverse weather conditions
in the region more recently.
Services inflation fell in Q1 but picked up in April. Services inflation fell to 0.5% from 0.8%
in Q4 2015. While healthcare costs rose as the disinflationary effects of enhanced
medication subsidies dissipated, this was more than offset by smaller fee increases for
education and telecommunication services, and lower public transport fares. However,
services inflation edged up to 0.7% in April, mainly on account of a stronger pickup in the
costs of holiday travel and domestic services, and the dissipation of the disinflationary
effects from the waiver of national examination fees in April last year.
The costs of accommodation and private road transport continued to fall. Private road
transport cost fell by a steeper 3.9% in Q1 and 7.1% in April, compared to the 1.7%
decrease in Q4. This was primarily due to a larger drag from car prices as Certificate of
Entitlement (COE) premiums trended down further. Meanwhile, accommodation cost was
3.2% lower in Q1, following the 3.0% drop in the previous quarter, as the housing rental
market continued to soften. While actual and imputed rentals fell at a faster pace in April,
the decline in overall accommodation cost moderated to 0.9% on a year-ago basis, due to
the low base associated with the disbursement of S&CC rebates in April last year.
Looking ahead, cost pressures are likely to remain subdued. External sources of inflation
should stay generally muted, given ample supply buffers in the major commodity markets
and weak global demand conditions. Notably, global oil prices are expected to average
lower for the whole of 2016 compared to last year. On the domestic front, wages are
expected to increase at a more moderate pace in 2016 compared to last year. The pass-
through of wage costs to consumer prices will also be tempered by the subdued economic
environment. Car prices and housing rentals will continue to dampen overall inflationary
pressures, given the expected increase in the supply of COEs and newly-completed housing
units, respectively.
MAS Core Inflation is likely to be in the lower half of the 0.5–1.5% forecast range for 2016,
barring a sharp rise in global oil prices. While core inflation is expected to pick up over the
course of this year as the disinflationary effects of oil8 as well as budgetary and other one-
off measures ease, the increase will be gradual and mild, given the weak external price
outlook, subdued economic growth prospects, and reduction in labour market tightness.
Meanwhile, car prices and housing rentals will contribute negatively to overall inflation this
year, given the increased supply of car COEs and residential units. CPI-All Items inflation is
projected to remain negative throughout 2016, and average −1.0–0.0% for the whole year.
8 With global Brent oil prices currently expected to be higher in H2 2016 compared to H1, the year-on-year drag of direct oil-
related items on core inflation is likely to become smaller towards the end of the year.
Page 16
Monetary Authority of Singapore 16 Economic Policy Group
D. Macroeconomic Policies
Monetary Policy: MAS set the rate of appreciation of the S$NEER
policy band to zero percent in April 2016
The Singapore economy is expected to grow at a
modest pace in 2016. Prospects for global
economic growth have dimmed. The modest
pace of expansion in the G3 economies and the
slowdown in China’s growth will continue to
exert a drag on the external-oriented sectors of
the Singapore economy. In comparison,
domestic-oriented sectors such as healthcare
and education should remain broadly supportive.
On balance, Singapore’s GDP growth is projected
to come in at 1–3% in 2016, following the 2.0%
growth registered in 2015.
MAS Core Inflation will pick up only gradually, and average slightly below 2% over the
medium term. Reflecting the diminishing drag from oil prices, as well as from budgetary and
other one-off measures, core inflation is expected to pick up gradually over the course of this
year. However, the pace of increase will be milder than anticipated in October 2015. Apart
from a weaker external price outlook, wage growth is expected to moderate in view of the
softening labour market, even as the subdued economic outlook will weigh on economic
sentiment and restrain the extent to which cost increases are passed on to consumer prices.
MAS Core Inflation for 2016 is likely to be in the lower half of the 0.5–1.5% forecast range,
barring a sharp rise in global oil prices. Reflecting the continued drag from car prices and
housing rentals, CPI-All Items inflation is projected to remain negative throughout 2016 and
average −1.0−0% for the whole year. Beyond 2016, the economy is unlikely to see an
acceleration of price increases arising from aggregate demand-side pressures. MAS Core
Inflation will therefore remain subdued and average slightly below 2% over the medium term.
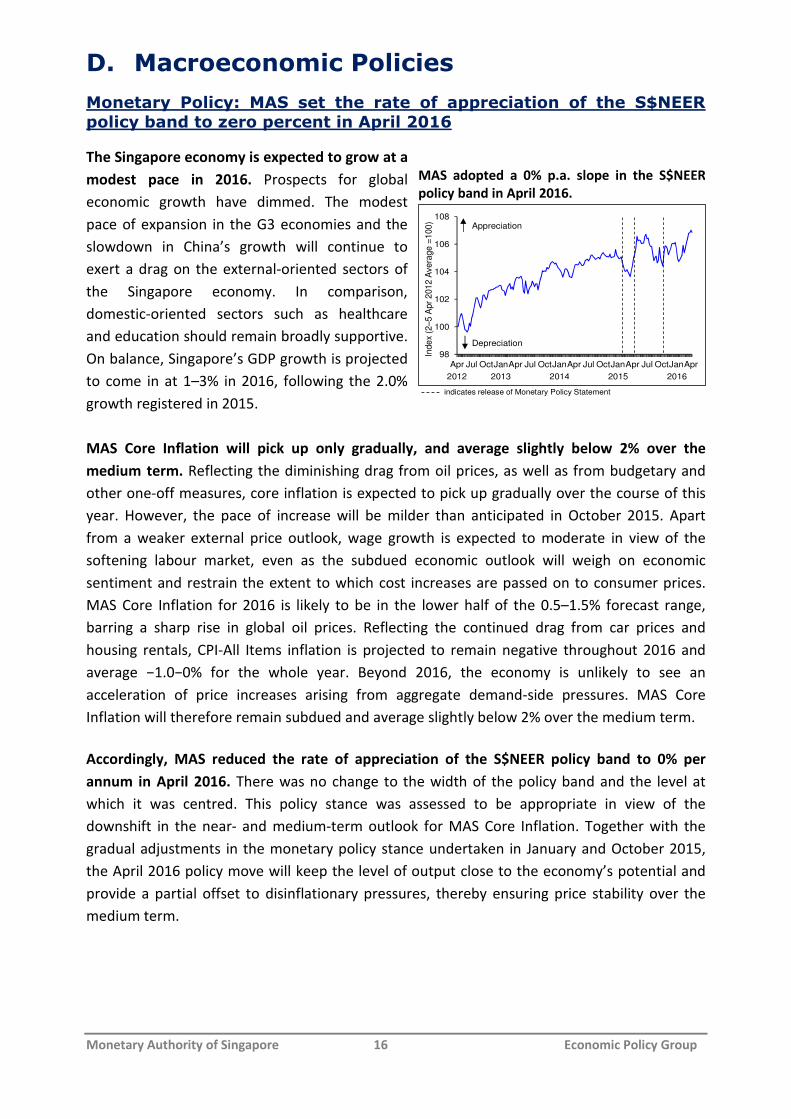
Accordingly, MAS reduced the rate of appreciation of the S$NEER policy band to 0% per
annum in April 2016. There was no change to the width of the policy band and the level at
which it was centred. This policy stance was assessed to be appropriate in view of the
downshift in the near- and medium-term outlook for MAS Core Inflation. Together with the
gradual adjustments in the monetary policy stance undertaken in January and October 2015,
the April 2016 policy move will keep the level of output close to the economy’s potential and
provide a partial offset to disinflationary pressures, thereby ensuring price stability over the
medium term.
MAS adopted a 0% p.a. slope in the S$NEER
policy band in April 2016.
98
100
102
104
106
108
Apr Jul OctJanApr Jul OctJanApr Jul OctJanApr Jul OctJanApr
Inde
x (2
–5
Apr
201
2 A
vera
ge
=1
00
)
2012
Appreciation
Depreciation
indicates release of Monetary Policy Statement
2013 20152014 2016
Page 17
Monetary Authority of Singapore 17 Economic Policy Group
Fiscal Policy: The FY2016 Budget built on the momentum of previous Budgets to sustain restructuring and foster a more equitable society
The FY2015 Budget outcome was a smaller deficit of $4.9 billion (1.2% of GDP), compared to
the $6.7 billion shortfall projected earlier. This was mainly due to lower-than-expected special
transfers under the Productivity and Innovation Credit and Wage Credit Schemes.
Budget 2016 built on and expanded the themes of economic restructuring and fostering a
caring and resilient society that had been established in earlier Budgets. First, it shifted the
focus of restructuring from economy-wide initiatives to micro-level measures. To this end,
Budget 2016 launched the $4.5 billion Industry Transformation Programme (ITP) to help firms
and industries build up capabilities to leverage on new growth opportunities. The ITP provided
measures to encourage firms and industries to adopt labour-saving techniques and increase
automation. This included the development and deployment of robots in key labour-intensive
sectors such as healthcare and construction. To encourage firms to expand and internationalise
their operations, the ITP also provided tax incentives for mergers and acquisitions and the
development of new markets abroad. The ITP also introduced several schemes to facilitate
business development, strengthen industry research and development, and boost
entrepreneurial activities.
Second, Budget 2016 expanded its scope to support workers at risk of being displaced by
economic restructuring. While previous Budgets had emphasised the importance of upskilling
and lifelong learning, Budget 2016 launched a number of complementary schemes to mitigate
the risks of prolonged unemployment that could arise from an extended period of
restructuring. The “Adapt and Grow” scheme will help workers, especially Professionals,
Managers, Executives and Technicians (PMETs), to re-skill and undertake mid-career
professional programmes. This was complemented by expanded wage support schemes to
encourage firms to hire PMETs who had been made redundant.
Third, the Budget implemented programmes to support the economically vulnerable and
enhance social mobility. Previous Budgets had established a firm base of support for the
economically vulnerable through key programmes such as Workfare, GST Vouchers, and the
Pioneer Generation Package. Budget 2016 followed up with the details of the implementation
of the Silver Support Scheme, which had been introduced in 2015. Under this scheme,
Singaporeans aged 65 and above who are at the bottom 20–30% of the income distribution will
receive cash payments of up to $750 per quarter. At the same time, the Budget developed new
measures to enhance intergenerational social mobility through the KidSTART and Fresh Start
Housing Scheme. These programmes would provide assistance to children from disadvantaged
families and give low-income families living in rental flats a second chance to own their own
homes, respectively.
The Budget also provided near-term relief measures targeted at vulnerable businesses and
households. Budget 2016 acknowledged that the confluence of an external slowdown and
domestic restructuring have presented challenges to businesses and households. As such, the
Page 18
Monetary Authority of Singapore 18 Economic Policy Group
Budget introduced a suite of measures aimed at relieving the cash flows of firms, especially
small and medium-sized enterprises (SMEs), and households. For businesses, the corporate
income tax rebate was raised from 30% of tax payable to 50% for Years of Assessment 2016
and 2017, while the scheduled hike in the foreign worker levy for the Marine and Process
sectors was deferred for another year in view of the global cyclical challenges facing the oil and
gas sectors. The Budget also introduced the SME Working Capital Loan to ensure that viable
SMEs would continue to have access to funding. For households, Budget 2016 provided S&CC
rebates and one-off GST Voucher special payments targeted at lower-income households.
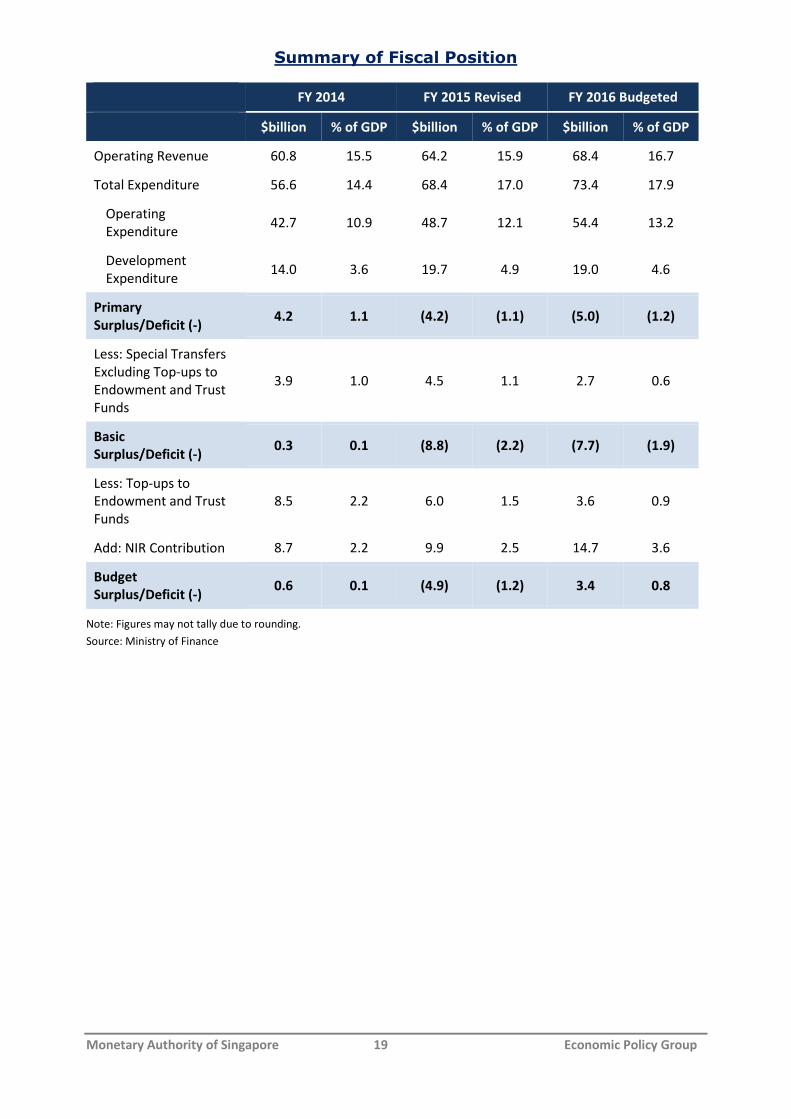
For FY2016, the government has projected an overall budget surplus of $3.4 billion (0.8% of
GDP). This includes special transfers, top-ups to trust and endowment funds, and the
contribution from net investment returns. The basic balance, which includes special transfers
only (excluding top-ups to endowment and trust funds), is projected to record a deficit of $7.7
billion (1.9% of GDP).
Page 19
Monetary Authority of Singapore 19 Economic Policy Group
Summary of Fiscal Position
FY 2014 FY 2015 Revised FY 2016 Budgeted
$billion % of GDP $billion % of GDP $billion % of GDP
Operating Revenue 60.8 15.5 64.2 15.9 68.4 16.7
Total Expenditure 56.6 14.4 68.4 17.0 73.4 17.9
Operating
Expenditure 42.7 10.9 48.7 12.1 54.4 13.2
Development
Expenditure 14.0 3.6 19.7 4.9 19.0 4.6
Primary
Surplus/Deficit (-) 4.2 1.1 (4.2) (1.1) (5.0) (1.2)
Less: Special Transfers
Excluding Top-ups to
Endowment and Trust
Funds
3.9 1.0 4.5 1.1 2.7 0.6
Basic
Surplus/Deficit (-) 0.3 0.1 (8.8) (2.2) (7.7) (1.9)
Less: Top-ups to
Endowment and Trust
Funds
8.5 2.2 6.0 1.5 3.6 0.9
Add: NIR Contribution 8.7 2.2 9.9 2.5 14.7 3.6
Budget
Surplus/Deficit (-) 0.6 0.1 (4.9) (1.2) 3.4 0.8
Note: Figures may not tally due to rounding.
Source: Ministry of Finance
Page 20
Monetary Authority of Singapore 20 Economic Policy Group
Selected Indicators
Land Area (Sq km) 719.1 Li teracy Rate* (%) 96.8
Tota l Popul ati on ('000) 5,535.0 Real Per Capita GDP (US$) 51,428
Labour Force ('000) 3,610.6 Gros s Nationa l Savings (% of GNI) 48.4
Res i dent Labour Force Participati on Rate (%) 68.3
* Refers to resident population aged 15 years and over.
COMPONENTS OF NOMINAL GDP
SECTORAL (% of GDP), 2015
COMPONENTS OF NOMINAL GDP
EXPENDITURE (% of GDP), 2015
Manufacturing 19.8 Pri vate Cons umption 36.6
Wholesa le & Retai l Trade 15.6 Pri vate Gros s Fixed Capi ta l Formation 20.5
Bus i ness Services 15.5 Publ i c Consumption 10.4
Fi nance & Ins urance 12.6 Publ i c Gross Fi xed Capital Formation 5.0
Transportation & Storage 7.4 Increas e i n Stocks 0.8
Cons truction 5.2 Net Exports of Goods & Services 26.8
Informati on & Communications 4.2
Accommodation & Food Services 2.1
MAJOR EXPORT DESTINATIONS
(% SHARE), 2015
MAJOR ORIGINS OF IMPORTS
(% SHARE), 2015
Total Exports (S$ Bi l l ion) 476.3 Tota l Imports (S$ Bi l l ion) 407.8
Chi na 13.8 China 14.2
Hong Kong 11.4 US 11.2
Malays i a 10.9 Mal ays ia 11.1
Indones ia 8.2 Ta iwan 8.3
US 6.3 Japan 6.3
ASEAN 29.6 ASEAN 21.5
NEA-3 19.8 NEA-3 15.3
EU 8.1 EU 12.6
Source: IE Singapore
MAJOR DOMESTIC EXPORTS
BY COMMODITY (% SHARE), 2015
MAJOR IMPORTS
BY COMMODITY (% SHARE), 2015
Domestic Exports (S$ Bi l l ion) 233.4 Tota l Imports (S$ Bi l l ion) 407.8
Mineral Fuel s 31.1 El ectroni cs 29.4
Electronics 20.8 Mineral Fuels 21.8
Chemica ls 20.4 Machi nery & Trans port Equi pment (ex. Electronics ) 18.3
Machi nery & Transport Equipment (ex. Electronics) 11.7 Manufactured Arti cles 8.8
Manufactured Articl es 8.5 Chemi ca ls 7.7
Manufactured Goods 2.6 Manufactured Goods 6.9
Source: IE Singapore
GENERAL INDICATORS, 2015
____________________________
Note: Labour market statistics were obtained from the Ministry of Manpower, while trade and index of industrial production
(IIP) data were provided by IE Singapore and EDB respectively. All other data in this document were obtained from the
Building and Construction Authority, Department of Statistics, or Ministry of Trade and Industry, unless otherwise stated.
Page 21
Monetary Authority of Singapore 21 Economic Policy Group
OVERALL ECONOMY 2014 2015 2014 Q4 2015 Q1 2015 Q2 2015 Q3 2015 Q4 2016 Q1 Mar-16 Apr-16
GDP at current prices (S$ bi l) 388.2 402.5 101.0 100.1 100.3 100.1 102.0 100.3 na na
GDP (US$ bil ) 306.4 292.7 78.0 73.8 74.6 71.9 72.5 71.4 na na
Real GDP Growth (YOY % change) 3.3 2.0 2.8 2.7 1.7 1.8 1.8 1.8 na na
Real GDP Growth (QOQ SAAR % change) na na 6.9 0.2 -1.6 2.3 6.2 0.2 na na
By Sector (YOY % change):
Manufacturing 1/
2.7 -5.2 -1.2 -2.9 -5.2 -6.0 -6.7 -1.0 0.1 2.9
Electronics 1/
-0.2 -6.8 -2.8 -4.7 -3.8 -6.3 -12.2 3.0 5.8 10.9
Non-electronics 1/
3.8 -4.5 -0.5 -4.2 -4.5 -5.4 -3.8 -2.2 -2.0 0.0
Finance & Insurance 9.1 5.3 12.5 8.1 6.6 4.6 2.4 2.4 na na
Business Services 1.6 1.5 1.6 2.4 0.6 2.0 0.8 0.3 na na
Construction 3.5 2.5 0.2 -1.6 3.6 3.0 4.9 6.2 na na
Transportation & Storage 2.6 0.0 0.4 1.3 -1.0 0.4 -0.9 -0.4 na na
Information & Communications 7.0 4.2 8.6 5.2 5.8 2.5 3.3 3.2 na na
Wholesale & Retai l Trade 2.1 6.1 1.9 5.7 5.5 6.4 6.8 1.8 na na
Accommodation & Food Services 1.7 0.2 1.7 -0.3 -1.1 1.1 0.9 1.5 na na
By Expenditure Component (YOY % change):
Consumption 1.7 4.9 2.9 3.5 3.8 6.1 6.3 3.7 na na
Private 2.2 4.5 3.1 3.5 4.5 4.6 5.5 3.0 na na
Public -0.1 6.6 2.2 3.7 1.0 12.2 9.4 5.9 na na
Gross Fixed Capital Formation -2.6 -1.0 -1.1 -4.2 2.3 -1.6 -0.7 -0.5 na na
Private -5.2 -2.2 -2.4 -3.5 0.4 -1.8 -3.9 -3.2 na na
Public 10.4 3.8 4.9 -6.6 10.6 -0.7 13.8 9.6 na na
External Demand 4.3 2.5 3.8 4.1 0.4 2.7 2.8 -0.8 na na
TRADE
Total Exports, fob (YOY % change) 0.8 -7.2 -4.2 -6.0 -9.0 -8.0 -5.7 -11.6 -14.3 -8.0
Non-Oi l Domestic Exports -1.5 -0.1 -0.1 4.0 1.5 -2.2 -3.5 -9.0 -15.7 -7.9
Re-Exports 2.5 -0.9 -1.0 1.1 -5.6 -0.5 1.4 -6.5 -5.7 -4.0
Total Imports, ci f (YOY % change) -0.6 -12.1 -6.0 -16.1 -13.0 -9.1 -9.9 -7.4 -9.0 -12.0
WAGE-PRICE INDICATORS
Unemployment Rate (SA,%) 2.0 1.9 1.9 1.8 1.9 2.0 1.9 1.9 na na
Average Nominal Wages (S$ per month) 4,727 4,892 5,040 5,259 4,611 4,493 5,205 5,483 na na
Consumer Price Index Inflation (YOY % change) 1.0 -0.5 0.0 -0.3 -0.4 -0.6 -0.7 -0.8 -1.0 -0.5
MAS Core Inflation (YOY % change) 1.9 0.5 1.6 1.1 0.2 0.4 0.2 0.5 0.6 0.8
FINANCIAL INDICATORS
S$ Exchange Rate Against: (end-period)
US Dollar 1.3213 1.4139 1.3213 1.3765 1.3474 1.4253 1.4139 1.3511 1.3511 1.3445
100 Japanese Yen 1.1060 1.1743 1.1060 1.1447 1.1014 1.1884 1.1743 1.2020 1.2020 1.2533
Euro 1.6072 1.5457 1.6072 1.4876 1.5080 1.6045 1.5457 1.5290 1.5290 1.5306
Interest Rates (end-period, % p.a.)
3-month Fixed Deposit Rate 0.14 0.18 0.14 0.17 0.16 0.18 0.18 0.19 0.19 0.19
3-month S$ SIBOR 2/
0.46 1.19 0.46 1.01 0.82 1.14 1.19 1.06 1.06 1.01
Prime Lending Rate 5.35 5.35 5.35 5.35 5.35 5.35 5.35 5.35 5.35 5.35
Money Supply (end-period)
Broad Money, M2 (YOY % change) 3.3 1.5 3.3 4.1 3.6 3.2 1.5 2.1 2.1 2.7
Straits Times Index (end-period) 3/
3,365.2 2,882.7 3,365.2 3,447.0 3,317.3 2,790.9 2,882.7 2,840.9 2,840.9 2,838.5
YOY % change 6.2 -14.3 6.2 8.1 1.9 -14.8 -14.3 -17.6 -17.6 -18.6
GOVERNMENT BUDGET 4/
Operating Revenue (S$ mil ) 59,995 63,562 14,034 14,340 16,857 17,888 14,477 15,600 na na
Total Expenditure (S$ mil) 54,805 61,155 14,214 18,565 12,127 14,352 16,111 24,848 na na
Operating Expenditure 41,758 45,359 11,326 13,960 7,988 11,123 12,289 16,686 na na
Development Expenditure 13,047 15,797 2,888 4,605 4,140 3,230 3,822 8,163 na na
Primary Surplus/Deficit (S$ mil) 5,190 2,407 -179 -4,224 4,730 3,535 -1,634 -9,249 na na
% of GDP 1.3 0.6 -0.2 -4.2 4.7 3.5 -1.6 -9.2 na na
BALANCE OF PAYMENTS
Current Account Balance (% of GDP) 17.5 19.8 18.5 21.4 16.7 20.7 20.3 17.7 na na
Goods Balance 26.0 28.2 26.5 30.8 26.9 26.5 28.6 26.1 na na
Services Balance -1.5 -1.3 -1.0 -1.5 -2.4 -0.7 -0.7 -1.5 na na
Primary Income Balance -4.9 -4.7 -4.9 -5.6 -5.4 -2.7 -5.2 -4.4 na na
Secondary Income Balance -2.0 -2.4 -2.1 -2.3 -2.3 -2.4 -2.4 -2.5 na na
Capital & Fin Account Balance (% of GDP) 15.1 19.1 18.1 24.3 13.3 20.5 18.5 25.8 na na
Direct Investment -9.6 -10.2 -11.5 -12.1 -6.8 -13.3 -8.5 -4.6 na na
Portfolio Investment 17.4 18.7 0.1 17.5 10.4 19.5 27.3 -14.9 na na
Financial Derivatives -3.9 -6.8 -5.7 -4.6 -7.4 -8.3 -6.9 6.9 na na
Other Investment 11.2 17.4 35.1 23.5 17.1 22.6 6.5 38.4 na na
Overall Balance (% of GDP) 2.2 0.4 0.1 -1.3 2.7 0.5 -0.3 -8.9 na na
Official Foreign Reserves (US$ mil) 5/
256,860 247,747 256,860 248,404 253,280 251,640 247,747 246,196 246,196 250,352
Months of Imports 8.4 10.0 8.4 8.6 9.3 9.7 10.0 10.2 10.2 10.5
Source:1/ Index of Industrial Production from EDB.2/ ABS Benchmarks Administration Co Pte Ltd3/ Straits Times Index from SGX. 4/ Ministry of Finance
5/ MAS
na: Not a vai l able