Recent progresses in the calculation of the aggregate exposure to fragrance ingredients Bob Safford Presentation for the IDEA Workshop: Validity of the QRA Methodology & Possibilities of Further Refinement. Brussels, 19 th March, 2013
Transcript
Recent progresses in the calculation of the aggregate exposure to fragrance
ingredients
Bob Safford
Presentation for the IDEA Workshop: Validity of the QRA Methodology & Possibilities of Further Refinement. Brussels, 19th March, 2013
The importance of estimating exposure
• Fundamental to the toxicological risk assessment of ingredients and contaminants in all products
Risk = Hazard x Exposure
• For skin sensitisation the risk is currently determined as: Acceptable Exposure Level Consumer Exposure Level
• The accuracy of the CEL has a direct influence on the outcome of the QRA
• As we are dealing with consumer products, consumer habits dictate the amount of exposure
Exposure assessment
Hazard characterisation
Hazard identification
Ingredient level
Amount of product
Area of exposure
Retention factor
Consumer habits
Product type
Frequency of use
Risk characterisation
Consumer habits and QRA
Consumer Exposure level
• How much product is used per occasion and how often is the product used? – Determines the total amount of product that the
consumer could be exposed to
• How does the consumer use the product? – Determines how much product the consumer is
actually exposed to (e.g. leave-on vs. rinse-off) – Determines surface area of skin over which the
product is used
• It is recognised that the QRA methodology for fragrances can be limited by the current shortcomings in calculation of the CEL – point estimates are used for consumer use amounts (generally 90th
percentile) as determined in recent surveys (e.g. COLIPA, CTFA)
– Area of use is defined by product type (e.g. AP/deo spray is used on underarms)
– Surface area of use is as defined from a variety of published sources
– CELs are generally based on single products
• “Some key areas for potential refinement are (1) improved exposure data (i.e., habits and practices, human parameter data) to further refine CEL and extend it to include occupational/professional exposure to consumer products . . .” - Api et al., 2007
Consumer Exposure level
Aggregate exposure
• A fragrance ingredient may be used in several product types which are used together by consumers as part of a daily routine
• In order to conduct an accurate risk assessment for skin sensitisation it is necessary to consider the overall exposure (aggregate exposure) to fragrance from multiple products used on the same area of skin
• Simple addition is often used, but will give a conservative estimate of exposure - it cannot be assumed that all consumers will use all products on any one day
• Also, simple addition may be useful for systemic exposure, but is more complex for dermal exposure
– concomitant use of deodorant and hand cream does not lead to aggregate exposure since the application sites are different
– Sensitisation Assessment Factors vary between product types that may be used on the same area of skin
RIFM Expert Group on Aggregate Exposure
• An expert group was formed in 2010 in order to define how the estimation of consumer exposure to fragrances (both systemic and dermal exposure) could be further developed and refined to take account of aggregate exposure
• The conclusions of the group were that a Monte Carlo model should be developed, incorporating the most up-to-date available data on consumer habits
• Creme Global were selected to build the model on the strength of their recognised expertise in food intake modelling, and their previous involvement in the COLIPA Consumer Exposure project
• This Expert Group has been working for many months alongside the Creme team in the development of an aggregate exposure model
• In order to build a model to calculate aggregate exposure for consumers the following data were required:
– Products to be included – Frequency of use and co-use of these product – Skin sites of application of the products – Amount of product used per occasion – Surface area of product application areas (for sensitisation - μg/cm2) – Retention factor – Chemical concentration of fragrance ingredient in the product
• In an ideal world, these data would be available from single surveys conducted in
each country
• In the real world such surveys do not exist, and the data are only available from separate sources
• Monte Carlo modelling was therefore required to simulate a virtual population of consumers from the available data
Data requirements for the Creme Aggregate Exposure model
The choice of products to be used in the model were based on the following criteria: • Personal care and cosmetics products
• Products representative of those used on a daily basis by male and/or
female consumers
• Products account for a major part of exposure from personal care and cosmetic products
• Adequate data are available on product use and typical consumer habits
Rationale for choice of products to be included
Product category Product
Body lotion
Body lotion (mass market) Body lotion (prestige) Body lotion (other)
Deodorant Deodorant/antiperspirant spray
Deodorant/antiperspirant non-spray
Body spray
Oral care Toothpaste
Mouthwash
Cosmetic styling
Lipstick
Liquid/makeup foundation
Hair styling products (excluding hairspray)
Hydroalcoholics
Eau de toilette
Eau de parfum
Aftershave / cologne (splash-on)
Shower products
Shower gel / body wash
Shampoo
Rinse-off conditioner
Moisturisers Face moisturizer Hand cream
Products included in the model
• In the SCCS Notes of Guidance for the Testing of Cosmetic Ingredients and their Safety Evaluation: 7th Revision (SCCS, 2011), aggregate exposure to cosmetics products is calculated to be 17.4g/day based on addition of deterministic values for a range of products.
• The products used in this model account for 96.7% of this figure (16.8g), with the remainder in the SCCS calculation coming from make-up remover, eye make-up, mascara and eyeliner.
• In addition, the current model also includes fine fragrance products which are not included in the SCCS aggregate exposure calculation.
Products included in the model
Frequency of product use and co-use (use habits)
Use habits of the products were obtained from Kantar Worldpanel. The main features of the surveys are: • Surveys conducted in France, Germany, GB, Spain, Italy, Russia, Poland, the U.S.
& China • Online survey consisting of a characteristics questionnaire, a self-completion
seven day diary • Collect data on the toiletry and cosmetic products and brands that consumers
use, how often they use them, where they apply the products (parts of the body and location when used) and the reasons for use
• The diary and questionnaires are sent out to the same panellists once every six months and the diaries are completed over a period of one week. Diaries are completed across all weeks of the year
• Kantar Worldpanel have stringent quality checks to produce an aggregated database for analysis
• Database is weighted • Kantar Worldpanel Usage has collected data using this method since 1995.
Data were obtained from a number of consumer product consumption surveys in 2007 and 2008 in the following countries: 1) France (6383 panellists) 2) Germany (7068 panellists) 3) Spain (3045 panellists) 4) Great Britain (9713 panellists) 5) United States of America (10237 panellists) Data from a total of 36446 panellists in total giving a record for each usage occasion of each of the products of interest
Kantar Worldpanel data used in model
The data were provided separately for the US and EU regions. For each region, two data files were obtained: 1. Subject data file, which contained a single record / row for each subject
containing the subject code, age, gender, country and statistical weighting factor.
2. Consumption data file - this file contained a record for each usage occasion of the products of interest in a diary format recording the subject code, day of the week, time of day, product used and application site. In this way the full co-use habits and patterns for these subjects/products were captured.
Data provided by the Kantar surveys
Application Sites
The Kantar surveys contained data on the application sites of: – body lotion – body spray – deodorant/antiperspirant spray – deodorant/antiperspirant non-spray – eau de parfum – eau de toilette – aftershave (EU only) – face moisturizer (EU only) – hand cream (EU only)
For some products, application sites were not recorded. For these, the application sites were assumed to be as follows: – Hair styling – scalp, palms – Shampoo – scalp, hands – Rinse-off conditioner – scalp, hands – Lipstick – lips – Liquid make-up foundation – face – Mouthwash – mouth, lips – Toothpaste – mouth, lips
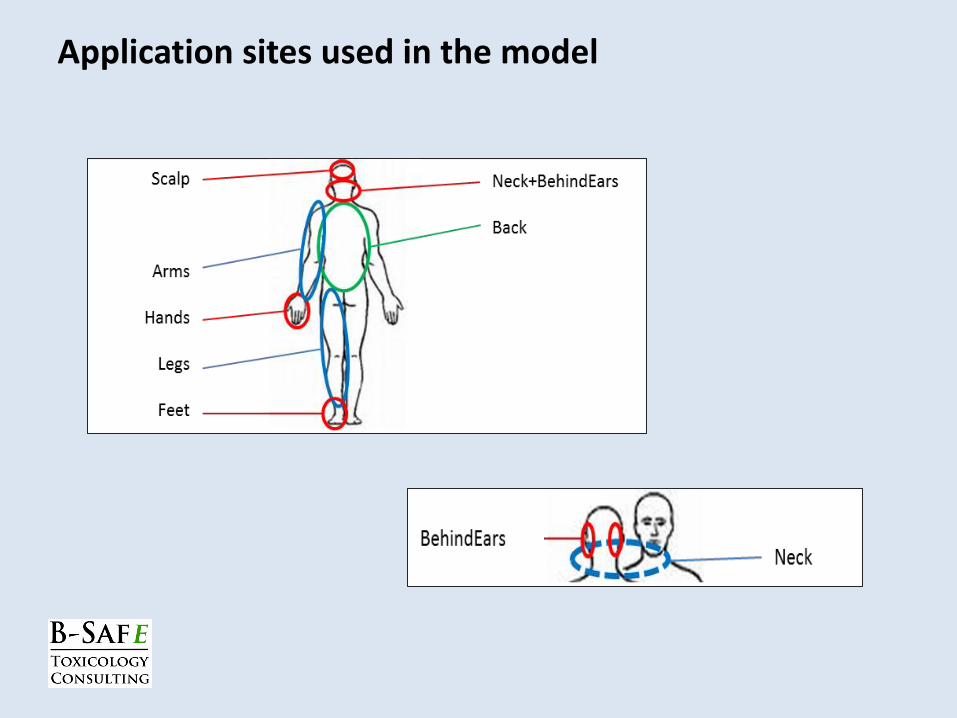
• Panellists in the EU region were presented with slightly different application site options to those in the US region
• It was necessary, therefore, to define a set of application sites which was consistent with the two data sources
• The options in the US and EU regions were therefore rationalised to a list of 18 application sites
Application Sites
Application sites used in the model
Application sites used in the model
Product amount per application
• The Kantar survey data does not include the amount of product used on each use event
• It was necessary, therefore, to sample amount per application data from other surveys:
– COLIPA (now Cosmetics Europe) – Hall et al., 2005, 2009 – CTFA (now Personal Care Products Council) – Loretz et al., 2005, 2006, 2008
• In addition, use data for hydroalcoholic products was supplemented with data
from Tozer et al., 2004.
Product Source(s) Publication
Body lotion
(Mass/Prestige/Other)
Europe (COLIPA) Hall et al., 2005
USA (CTFA) Loretz et al., 2005
Deo spray Europe (COLIPA) Hall et al., 2005
Deo roll-on Europe (COLIPA) Hall et al., 2005
USA (CTFA) Loretz et al., 2006
Body spray Amount per Use, approximated as Deo Spray
Toothpaste Europe (COLIPA) Hall et al., 2005
Mouthwash Europe (COLIPA) Hall et al., 2009
Lipstick Europe (COLIPA) Hall et al., 2005
USA (CTFA) Loretz et al., 2005
Liquid makeup foundation Europe (COLIPA)
USA (CTFA) Loretz et al., 2006
Hair styling Europe (COLIPA) Hall et al., 2009
Eau de toilette USA (CTFA) Loretz et al., 2006
Tozer et al., 2004
Eau de parfum USA (CTFA) Loretz et al., 2006
Tozer et al., 2004
Aftershave Amount per Use, approximated as Eau de Toilette
Shower gel Europe (COLIPA) Hall et al., 2009
USA (CTFA) Loretz et al., 2006
Shampoo Europe (COLIPA) Hall et al., 2005
USA (CTFA) Loretz et al., 2006
Rinse-off conditioner USA (CTFA) Loretz et al., 2008
Face moisturizer Europe (COLIPA) Hall et al., 2005
USA (CTFA) Loretz et al., 2005
Hand cream Europe (COLIPA) Hall et al., 2009
Amount per application
Surface area of application
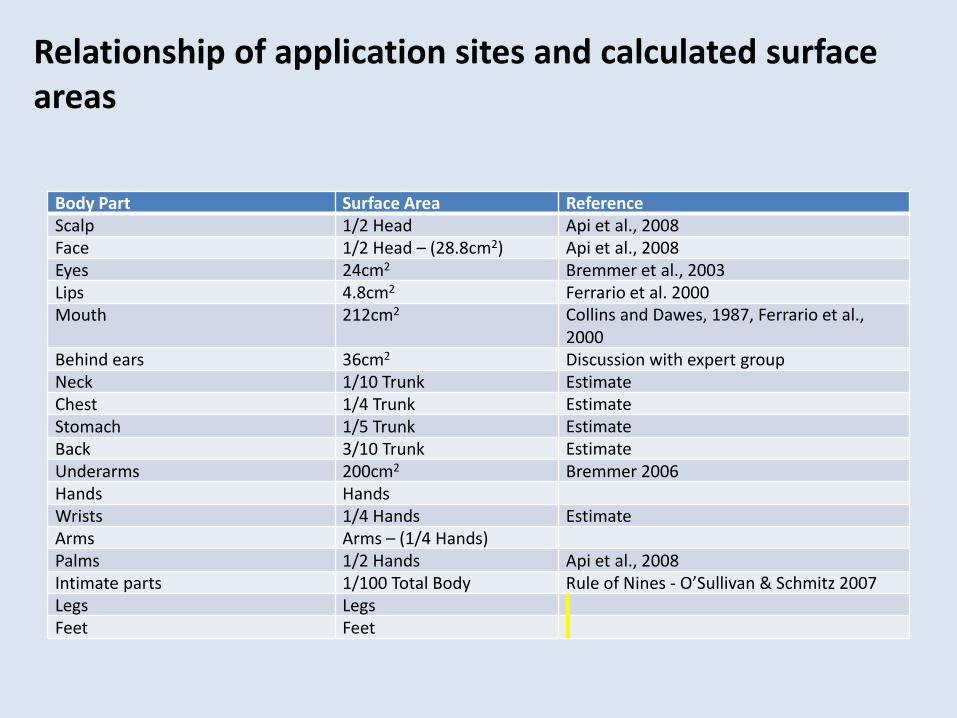
• In order to calculate the amount of product/ingredient per skin surface area, it is necessary to determine the surface areas of the 18 defined sites of application
• In the model, body surface areas are calculated from bodyweight and height data using the Dubois formula (Dubois and Dubois, 1916) - SA = a x Wb x Hc W=bodyweight, H=height a, b and c are constants applied for individual body areas as defined in the USA EPA Exposure Factors Handbook
• The body surface areas in the EPA Exposure Factors Handbook do not exactly match the 18 sites of application previously defined. It was necessary therefore to determine relationships between the EPA calculation and application sites.
• In addition, for some application sites where surface areas could not be calculated, values were taken from published sources
Body Part Surface Area Reference Scalp 1/2 Head Api et al., 2008
Face 1/2 Head – (28.8cm2) Api et al., 2008
Eyes 24cm2 Bremmer et al., 2003
Lips 4.8cm2 Ferrario et al. 2000
Mouth 212cm2 Collins and Dawes, 1987, Ferrario et al., 2000
Arms Arms – (1/4 Hands) Palms 1/2 Hands Api et al., 2008
Intimate parts 1/100 Total Body Rule of Nines - O’Sullivan & Schmitz 2007
Legs Legs Feet Feet
Relationship of application sites and calculated surface areas
• In the Kantar surveys, subject body weights and heights were not recorded, so it was necessary to derive these values from an alternative source
• Paired body weights and heights were taken from the 2007-2008 NHANES survey (Centers for Disease Control and Prevention (CDC) & National Center for Health Statistics (NCHS) 2008). This contained body weights and heights for 8,861 US subjects
Male, 18-24 Female, 18-24
Male, 25-34 Female, 25-34
Male, 35-49 Female, 35-49
Male, 50-64 Female, 50-64
Male, 65+ Female, 65+
NHANES
• In this way, subjects in the Kantar survey can be more accurately matched with an appropriate bodyweight and height value
• From these data, distributions of bodyweight and height were built for subjects split into 10 demographic groups based on gender and age
Surface area calculations for EU
• A corresponding data set with paired bodyweight and height data for the EU countries of interest could not be identified
• The bodyweight and height for the EU subjects was therefore modelled on the NHANES distributions.
• Appropriate scaling factors were applied to the distributions to adjust for inter-country variations. These were defined by comparing average bodyweight and height values for males and females in each of the 4 EU countries with the corresponding average values for the US.
Country Average Bodyweight
(kg) Male
Scale Factor Average Bodyweight
(kg) Female
Scale Factor
France 77.73 0.878 66.78 0.891
Germany 84.51 0.954 71.63 0.956
Spain 73.23 0.827 62.56 0.835
GB 80 0.903 67.3 0.898
US (NHANES) 88.5 1 74.9 1
Retention factors
Product Retention Factor
Body Lotion (Mass, Prestige, Other)
100%
Deo Spray 23.5%
Deo Roll-on 100%
Body Spray 23.5%
Toothpaste 10%
Mouthwash 1%
Lipstick 100%
Liquid Make-up Foundation
100%
Hair Styling 10%
Eau de Toilette 100%
Eau de Parfum 100%
Aftershave 100%
Shower gel 1%
Shampoo 1%
Rinse-off Conditioner 1%
Face Moisturizer 100%
Hand Cream 100%
• Standard retention factors were used for most products (SCCS, 2011)
• For oral care products Retention Factors were taken from Api et al., 2007
• For aerosol products (Deo spray and Body spray), a retention factor of 23.5% was taken, based on the relative amount of product deposited on skin for ethanol based aerosols (Steiling et al., 2012)
• The concentration of the fragrance under investigation for each of the product types can be entered into the model by the user
• Values are entered as the concentration of fragrance in the fragrance mixture, and the concentration of the fragrance mixture in the products
• These can be input as a single (deterministic) value, a range of values or a distribution
• A case study is currently being conducted, based on 9 fragrances. In this case data input is:
– concentration levels for “fragrance ingredient in the fragrance mixture” are empirical values as provided by one of the fragrance manufacturer members of this project.
– Concentration levels for the “fragrance mixture in the cosmetic product“ are point estimates (provided by RIFM).
Concentration of fragrance ingredient in product
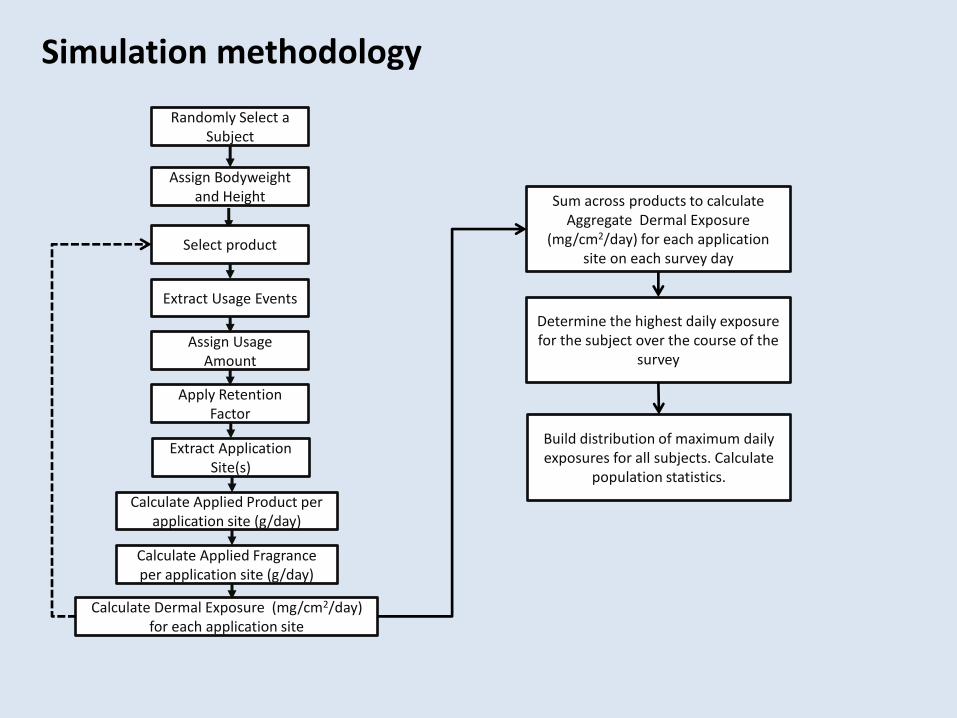
Assign Bodyweight and Height
Randomly Select a Subject
Extract Usage Events
Assign Usage Amount
Apply Retention Factor
Extract Application Site(s)
Calculate Applied Product per application site (g/day)
Calculate Applied Fragrance per application site (g/day)
Calculate Dermal Exposure (mg/cm2/day) for each application site
Sum across products to calculate Aggregate Dermal Exposure
(mg/cm2/day) for each application site on each survey day
Select product
Build distribution of maximum daily exposures for all subjects. Calculate
population statistics.
Determine the highest daily exposure for the subject over the course of the
survey
Simulation methodology
Comparison of usage habits for different deodorant products
Comparison of usage habits for toothpaste across age groups
Comparison of usage habits for hair styling products across gender groups
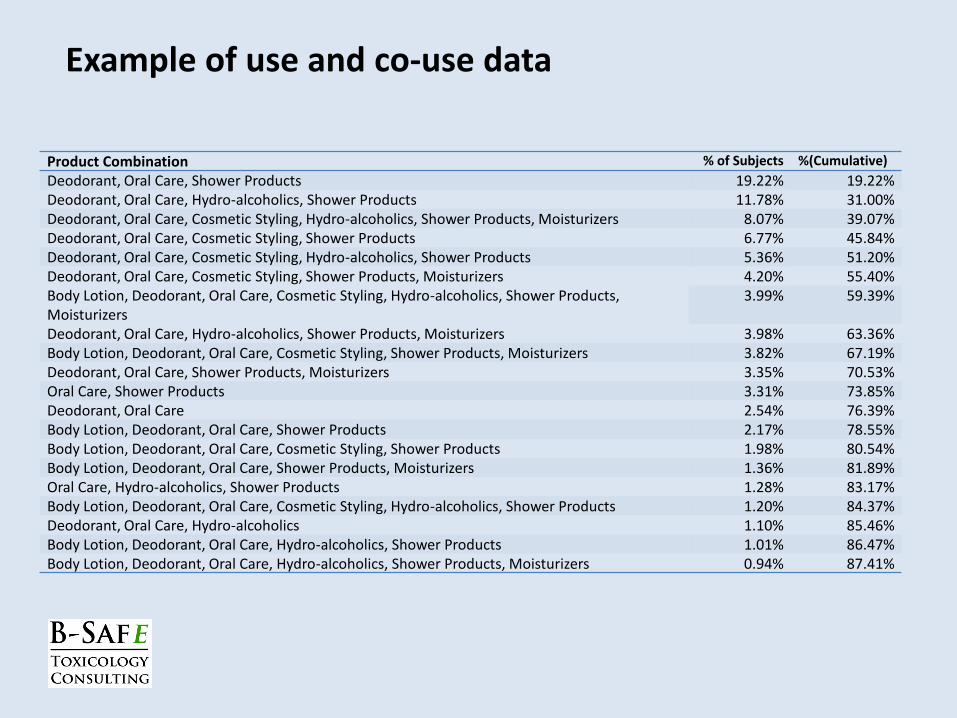
Product Combination % of Subjects %(Cumulative)
Deodorant, Oral Care, Shower Products 19.22% 19.22%
Deodorant, Oral Care, Hydro-alcoholics, Shower Products 11.78% 31.00%
Deodorant, Oral Care, Cosmetic Styling, Shower Products 6.77% 45.84%
Deodorant, Oral Care, Cosmetic Styling, Hydro-alcoholics, Shower Products 5.36% 51.20%
Deodorant, Oral Care, Cosmetic Styling, Shower Products, Moisturizers 4.20% 55.40%
Body Lotion, Deodorant, Oral Care, Cosmetic Styling, Hydro-alcoholics, Shower Products, Moisturizers
3.99% 59.39%
Deodorant, Oral Care, Hydro-alcoholics, Shower Products, Moisturizers 3.98% 63.36%
Body Lotion, Deodorant, Oral Care, Cosmetic Styling, Shower Products, Moisturizers 3.82% 67.19%
Deodorant, Oral Care, Shower Products, Moisturizers 3.35% 70.53%
Oral Care, Shower Products 3.31% 73.85%
Deodorant, Oral Care 2.54% 76.39%
Body Lotion, Deodorant, Oral Care, Shower Products 2.17% 78.55%
Body Lotion, Deodorant, Oral Care, Cosmetic Styling, Shower Products 1.98% 80.54%
Body Lotion, Deodorant, Oral Care, Shower Products, Moisturizers 1.36% 81.89%
Oral Care, Hydro-alcoholics, Shower Products 1.28% 83.17%
Body Lotion, Deodorant, Oral Care, Cosmetic Styling, Hydro-alcoholics, Shower Products 1.20% 84.37%
Deodorant, Oral Care, Hydro-alcoholics 1.10% 85.46%
Body Lotion, Deodorant, Oral Care, Hydro-alcoholics, Shower Products 1.01% 86.47%
Body Lotion, Deodorant, Oral Care, Hydro-alcoholics, Shower Products, Moisturizers 0.94% 87.41%
Example of use and co-use data
• Incorporates 19 individual products representing seven product categories. Together these product account for 96.7% of daily exposure to cosmetics products as calculated by the SCCS (2010).
• Utilises consumer habits data from Kantar Worldpanel surveys conducted in 2007/8 recording the use and co-use of cosmetic and personal care products involving a total of 36446 subjects in the USA and Europe.
• Subjects in the surveys recorded product usage as part of their daily routines, and were not provided with products which would invariably lead to a modification of routine.
• Data on amounts of product used were taken from consumer studies carried out recently in the USA and the UK. Again, these studies were conducted with a minimum disruption to normal daily habits
• Subjects in the Kantar Worldpanel surveys recorded application sites for most of the products used, making it possible to more accurately calculate dermal exposure (as dose per unit area of skin).
Creme Aggregate Exposure Model - highlights
• Combines the consumer data with skin surface area calculated using bodyweight and height data from the USA NHANES surveys
• Data on inclusion levels of fragrances can be input as a range or distribution of values reflecting actual use level in products
• Dermal penetration values can be included where these have been established (for determining systemic exposure)
• Use of this model overcomes the shortcomings of calculating aggregate exposure using typical deterministic addition methods
Crème Aggregate Exposure Model - highlights
Crème Aggregate Exposure model – some assumptions
• Frequency of product use/co-use – The Kantar data are representative of the whole population of the country – The habits and practices of the 4 EU countries are representative of the wider
EU15 population.
• Amount of product use – Amount per use distributions for all EU countries are the same as from those
for Scotland, taking into account the appropriate scaling factors – Amount of product recorded in USA surveys are representative of the whole of
the USA
• Surface areas – Body weight and height distributions for EU countries are the same as those
for the USA, taking into account appropriate scaling factors – Calculations based on the Dubois formula provide accurate estimates for
surface areas – The proportions of larger body parts used to derive constituent parts (e.g. a
scalp is half a head, a neck is 1/10 of a trunk) are accurate
• Retention factors are accurate
Aggregate exposure model – current status
• Creme Global have developed the model, and it is currently undergoing refinement for some parameters
• Data have been collected from fragrance houses in the Expert Group on concentrations of 9 fragrances incorporated into current fragrance mixes
• These data along with point estimates for concentrations of fragrance mix in product will be used in a case study to calculate aggregate systemic and dermal exposure values
• Further data are being collected from IFRA member companies via questionnaire on levels of fragrance ingredients in fragrance mixtures, and level of use of fragrance mixtures in products.
• Once the model is completed, rollout to member companies is planned along with a publication
Aggregate Exposure Phase 2 and beyond
• Currently the model can be used to determine aggregate dermal exposure to a range of personal care and cosmetics products
• Further development of the model will include: – Inclusion of further personal care products – Bar soap, Liquid soap
and Hairspray – Consideration of exposure from household care and laundry products – Inclusion of inhalation exposure from aerosol and aircare products
• Expansion of the model is proposed to include ingestion of flavours from
foods (Phase 2.2)
• Expansion of the model is also planned to cover other regions of the world such as S.E. Asia
Anne Marie Api - RIFM Peter Cadby – Consultant Catherine Clapp - Unilever Damien Comiskey – Creme Global EJ Daly – Creme global Graham Ellis - Givaudan Christie Gavin – Verto Solutions Haitian Lu - Givaudan Cian O’Mahony – Creme Global Conor McGauran – Creme Global Cronan McNamara – Creme Global Stephen Robison - Consultant Ben Smith - Firmenich Sarah Tozer – Procter & Gamble