IRS Research Bulletin Recent Research on Tax Administration and Compliance Selected Papers Given at the 2007 IRS Research Conference Georgetown University School of Law Washington, DC June 13-14, 2007 Compiled and Edited by James Dalton and Martha Gangi* Statistics of Income Division Internal Revenue Service *Prepared under the direction of Janet McCubbin, Chief, Special Studies Branch
Transcript
IRS Research Bulletin
Recent Research on Tax Administration and Compliance
Selected Papers Given at the 2007 IRS Research Conference
Georgetown University School of Law Washington, DC June 13-14, 2007
Compiled and Edited by James Dalton and Martha Gangi* Statistics of Income Division Internal Revenue Service
*Prepared under the direction of Janet McCubbin, Chief, Special Studies Branch
IRS Research Bulletin iii
ForewordThis edition of the IRS Research Bulletin (Publication 1500) features select-ed papers from the latest IRS Research Conference, held at the Georgetown University School of Law in Washington, DC, on June 13-14, 2007. Confer-ence presenters and attendees included researchers from all areas of the IRS, representatives of other Government agencies, and academic and private sector experts on tax policy, tax administration, and tax compliance.
The conference began with a keynote address by James Mackie III, Director, Revenue Estimating Division, Office of Tax Analysis, U.S. Depart-ment of the Treasury. Dr. Mackie discussed the President’s Fiscal Year 2008 Budget proposals to reduce the tax gap. The President and the Department of the Treasury are committed to working with Congress to reduce the tax gap without unduly burdening compliant taxpayers. Identifying the sources of noncompliance is critical to designing and implementing effective, tar-geted remediation. The 2008 Budget proposals were informed by National Research Program data, including estimates confirming that noncompliance is highest among taxpayers whose incomes are not subject to third-party information reporting and the finding that more than 40 percent of the gross tax gap is from underreporting of net business income. Seven of the legisla-tive proposals would expand information reporting. In addition, Treasury’s overall strategy includes a multiyear commitment to compliance research, and the proposed Budget includes $410 million in new funding for research, information technology investments, enhanced enforcement activity, and improvements in taxpayer service, all aimed at reducing the tax gap. Dr. Mackie applauded the IRS’s plans to conduct individual income tax compli-ance studies in successive years, beginning with Tax Year 2006 returns. He called for new research on other types of taxes and on the effect of taxpayer service on compliance.
Mark Mazur, Director, Research, Analysis, and Statistics, then led a panel discussion on optimal tax administration. The panelists echoed some of Dr. Mackie’s themes, such as the need to balance compliance improve-ments against taxpayer burden and administrative costs. The remainder of the conference included sessions on the interplay of tax policy and compli-ance; the effect of tax practitioners on compliance and a view of compliance from the practitioner perspective; disentangling factors contributing to the tax gap and NRP methodologies and plans; compliance and administrative burdens; and taxpayer preferences for services and the effect of service on compliance.
We hope that this volume will enable IRS executives, managers, employees, and stakeholders to stay abreast of the latest trends and research findings affecting Federal tax administration. The research featured here is intended to provide a starting place from which to conduct further analysis.
IRS Research Bulletiniv
AcknowledgmentsThe IRS Research Conference was the result of substantial effort and preparation over a number of months by many people. The conference program was assembled by a committee representing research organiza-tions throughout the IRS. Members of the program committee included Mark Mazur (Director, Office of Research, Analysis, and Statistics), Janice Hedemann (Director, Office of Research), Janet McCubbin (Statistics of In-come Division), Melissa Kovalick (Research, Analysis, and Statistics), Alan Plumley and Kim Bloomquist (Office of Research), Michael Hayes (Office of Program Evaluation and Risk Analysis), Peter Adelsheim and Caroline Trinkwalder (Small Business and Self- Employed Division), Donald Evans (Tax Exempt and Government Entities Division), Joel Friedman (Wage and Investment Division), and David Stanley (Large and Midsize Business Divi-sion). Melissa Kovalick and Bobbie Vaira (Statistics of Income Division) oversaw numerous details to ensure that the conference ran smoothly.
This volume was prepared by Paul Bastuscheck, Heather Lilley, and Lisa Smith (layout and graphics) and James Dalton and Martha Eller Gangi (editors), all of the Statistics of Income Division. The authors of the papers are responsible for their content, and views expressed in these papers do not necessarily represent the views of the Department of the Treasury or the Internal Revenue Service.
We appreciate the contributions of everyone who helped make the IRS Research Conference a success.
Janice HedemannDirector, Office of Research
Janet McCubbinStatistics of Income Division
Co-chairpersons, 2007 IRS Research ConferenceDecember 2007
Note: The papers included in this volume may also be found on the IRS Web site at www.irs.gov/taxstats. From this page, click on “Conference Papers,” under “Products, Publications, and Papers,” then click on “2007” under “IRS Research Conferences.”
IRS Research Bulletin v
Contents
Foreword ........................................................................................ iii
1. Optimal Tax Administration
A Framework for Optimal Tax Administration, Alan H. Plumley ...3
2. Tax Policy and Tax Compliance
Tax Rate Preferences: Understanding the Effects of Perceived and Actual Current Tax Assessments, Peggy A. Hite, John Hasseldine, and Darius J. Fatemi ...................................................................... 23
Charitable Contributions in a Voluntary Compliance Income Tax System: Itemized Deductions versus Matching Subsidies, Alex Turk, Maryamm Muzikir, Marsha Blumenthal, and Laura Kalambokidis .................................................................................. 51
3. Tax Practitioners—Perspectives and Impact
Evaluating Preparation Accuracy of Tax Practitioners: A Bootstrap Approach, Kim M. Bloomquist, Michael F. Albert, and Ronald L. Edgerton .......................................................................................... 77
Impact of Taxpayer Representation on the Outcome of Earned Income Credit Audits, Jeff A. Wilson, Tom Beers, Amy Ibbotson, Mike Nestor, Mark Hutchens, Carol Hatch, and Mark Everett ..... 91
The Obstacles of Voluntary Compliance from the Taxpayer’s Perspective, Beanna J. Whitlock ................................................... 115
Comments on Tax Practitioners—Perspectives and Impact, John Scholz ............................................................................................ 123
2007 IRS Research Conference
IRS Research Bulletinvi
4. Disentangling the Tax Gap
National Research Program—Methods and Plans, Bob Brown and Drew Johns ................................................................................... 135
Comments on Disentangling the Tax Gap, Eric Toder ............... 155
5. Compliance and Administrative Burdens
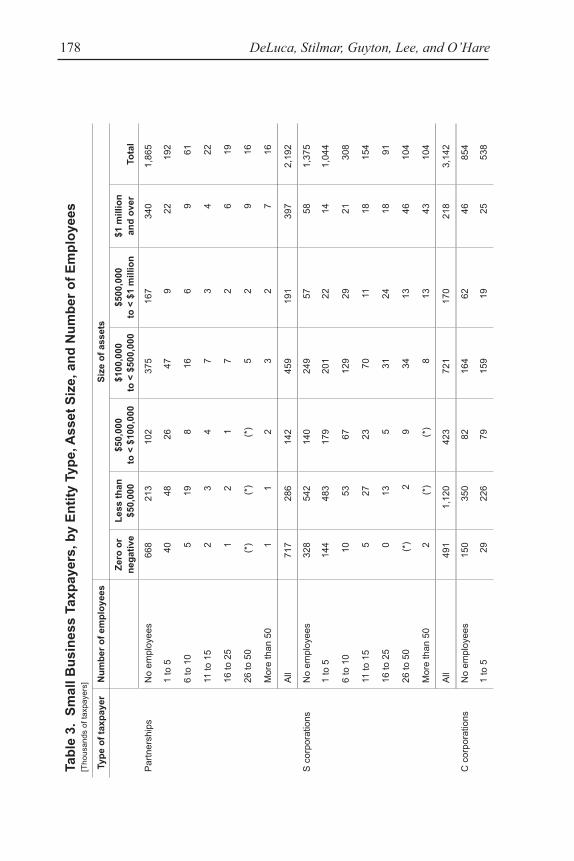
Aggregate Estimates of Small Business Taxpayer Compliance Burden, Donald DeLuca, Scott Stilmar, John Guyton, Wu-Lang Lee, and John O’Hare ................................................................... 163
Tax Complexity and its Impact on Tax Compliance and Tax Administration in Australia, Margaret McKerchar ..................... 201
Comments on Compliance and Administration, Jane Gravelle ... 221
6. Taxpayer Service—Preferences and Effects
Taxpayer Services and Tax Compliance, James Alm, Michael Jones, and Michael McKee ........................................................... 227
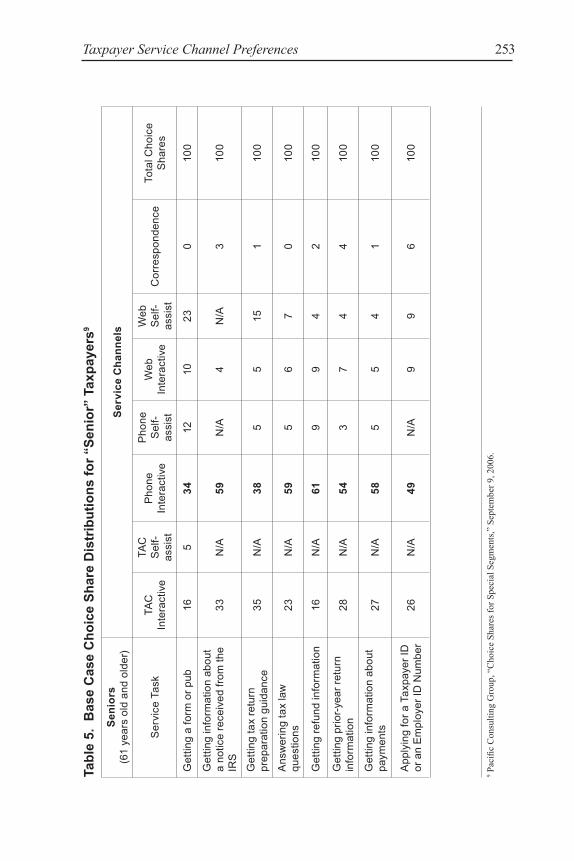
Taxpayer Service Channel Preferences, Ben Shackleford ............ 241
Lab Research on Customer Preferences and the Relationship Between Service and Compliance, Kathleen Holland and Howard Rasey ............................................................................................. 261
7. Appendix
Conference Program ..................................................................... 271
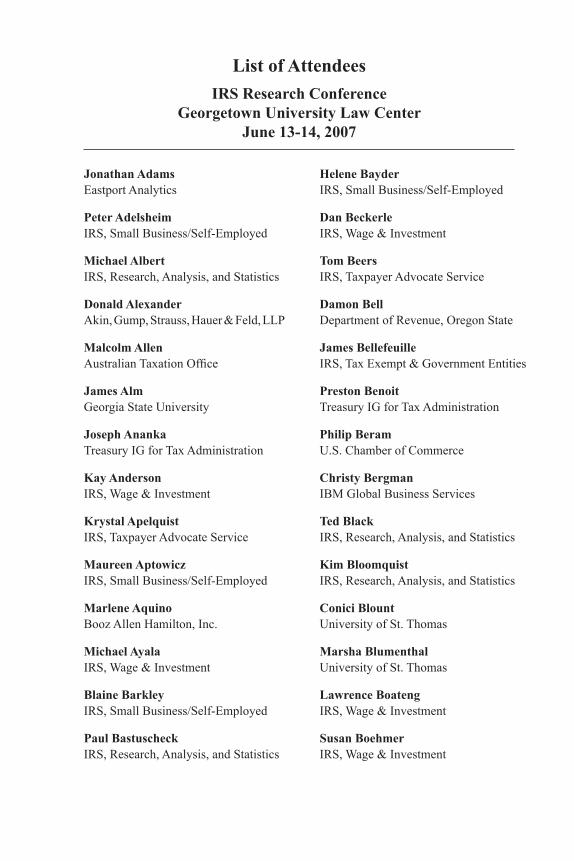
List of Attendees ........................................................................... 275
D1
Optimal Tax Administration
Plumley
A Framework for Optimal Tax Administration
Alan H. Plumley, Internal Revenue Service
F ew people concern themselves with how well the tax system is administered—until they have to deal with the tax administra-tor. Worse yet, there is very little consensus on how the tax system
should be administered—particularly what its ultimate objective should be. Fortunately, more and more people are asking the right kinds of questions. For example, in connection with recent hearings on the tax gap, members of Congress asked the Internal Revenue Service (IRS) several important questions:
What is the right-sized IRS budget to increase voluntary compli-ance by 1 percent? By 5 percent?
How would the rate of voluntary tax compliance be affected by sustained growth in the IRS budget of $500 million over each of 5 years?
What would be the optimal use of these resources in providing improved services, stronger enforcement, and enhanced informa-tion technology?
Unfortunately, the answer to each of these questions is that we do not currently know. Therefore, this paper attempts to provide a framework for how a tax administration agency might address these, and similar, questions. I need to emphasize, however, that our understanding of what constitutes optimal tax administration is not very advanced. What follows, then, is not an official IRS position, but rather one observer’s attempt to move the debate along by framing important questions and by suggesting various ways of addressing them. This approach uses a benefit-cost framework that is very familiar to economists and many policymakers. In the context of this frame-work, I lay out a series of principles and steps that the IRS could decide to take to improve tax administration. These steps may not all be feasible, but the issues they are aimed at will need to be addressed if the IRS is to make significant strides toward improved tax administration. In order to answer such crucial questions, the IRS and its stakeholders need to answer three more fundamental questions:
1. Theory: How can we identify the best use of resources to achieve our objective, given our constraints?
Plumley4
2. Objective: What, specifically, should the IRS be trying to achieve?
3. Plan: What should we do in the short and long term to make progress toward optimal use of IRS resources?
Although there is much room for debate on these questions,1 there are 15 key principles that I believe should guide the quest for optimal tax administration. I list and explain those principles below, organized (except for the first, introductory, one) under those three fundamental questions. My focus is on Federal tax administration in the U.S., but most of the principles probably apply equally well to other tax administrations as well. I again emphasize that these are primarily my own views, rather than those of the Office of Research more generally. This paper is meant to stimulate thinking and discussion about optimal tax administration.
Principle #1. The stakes are huge. Suboptimal tax administration results in too little voluntary compliance (e.g., the gross tax gap is estimated to be $345 billion for Tax Year 2001), a large number of inadvertent errors by taxpayers, unnecessary compliance burden placed on taxpayers, and a dis-proportionate share of the overall tax burden borne by compliant taxpayers. Furthermore, not having a framework for optimal tax administration makes it impossible to know how to manage the IRS budget as effectively as pos-sible. This gets right to the heart of what the IRS should be doing—affecting not just budget deficits, but also touching the lives of most Americans very directly.
Theory: How Can We Identify the Best Use of Our Resources?Before we can achieve optimal tax administration, we need to define it. For-tunately, there is a well-established body of theoretical thought that can be applied to tax administration. This gives rise to the next five principles.
Principle #2. Optimal tax administration can be modeled as a con-strained optimization problem, with allowance for off-model judgments when necessary. The administration of tax laws can be guided by a single, explicit objective, subject to explicit constraints. The objective function specifies what is to be optimized. In the case of tax administration (as in many other contexts), the objective ought to be to maximize the net benefits (i.e., benefits minus costs) of all our activities (i.e., our uses of resources).
1 See Plumley and Steuerle (2004).
A Framework for Optimal Tax Administration 5
The constraints account for budgetary and other practical limitations, which may or may not vary over time. Formally stated, the ultimate objective of the IRS is to:
Maximize: Benefits – Costs Subject to: Budget and other constraints
Defining the benefits, costs, and other constraints, of course, is critical and the subject of the next section (“Ultimate Objective”). However, before considering those details, four additional principles should be emphasized.
Principle #3. Model features that cannot (yet) be quantified empirically or theoretically can in some cases be quantified (or at least plausibly bounded) by consensus assumptions. Otherwise, such factors should be accounted for subjectively to modify the model’s output. The benefit of deriving explicit assumptions whenever possible by developing consensus among the key decisionmakers is that the ones who ultimately make the decisions can thereby establish rules for themselves from a holistic (rather than parochial) perspective in an internally consistent, objective (rather than crisis) atmosphere. Not (yet) being able to quantify certain components of the model empirically must not cause us to abandon the quest to do so, nor prevent us from becoming progressively more rigorous over time.
Principle #4. The optimal solution to the constrained optimization prob-lem is the allocation of resources that equalizes the marginal benefit/cost (“bang for the buck”) across all opportunities to use those resources, as long as the benefits and costs include all of the elements of the ultimate objective. If the marginal benefit/cost ratios (i.e., the benefit produced by the last dollar or the next dollar spent) are not equalized, then more net benefit can be obtained by shifting resources from activities with low marginal ben-efit/cost ratios to those with higher benefit/cost at the margin.
Principle #5. Whether allocating the budget across organizations and programs, selecting discretionary workload within programs, or select-ing discretionary issues to pursue on a given case, the same ultimate objective should be applied. However, not all components of the ultimate objective will necessarily apply in each of these contexts. For example, the impact of an audit on the voluntary compliance of the general population may not be affected by how many lines on the tax return are examined. The principle that there should be just one ultimate objective means, for example, not only that, when resources are applied optimally, the benefit arising from the last dollar spent on audits of large corporations should equal the benefit of the last dollar spent on the document matching program, the benefit of
Plumley6
the last dollar spent on taxpayer assistance, and the benefit of the last dollar spent on criminal investigations, but also that the same agencywide marginal benefit/cost ratio governs both which enforcement cases to pursue and which issues to pursue on those cases. That is, cases and issues with an expected marginal benefit/cost ratio less than the agencywide ratio should not be pursued. It also means that, if the budget were expanded, the agencywide marginal benefit/cost ratio would be decreased, enabling more cases to be worked (at the extensive margin) and more discretionary issues to be pur-sued (at the intensive margin) on all cases worked—even on those cases that would have been worked with a smaller budget.
Principle #6. Other (more common) approaches to tax administra-tion almost certainly do not lead to optimal decisions, will often lead to internally inconsistent decisions, and should be avoided. These include allocating resources and selecting workload based on:
The distribution of the tax gap: Although it may seem natural to focus efforts on the areas where noncompliance is worst, that is generally not optimal for operational programs. That is because the largest components of the tax gap are often also the compo-nents that are the least cost-effective to combat (at least with cur-rent methods). That is often why noncompliance is worse among those components. Ultimately, expanding current activities in those components would typically result in less of the tax gap being reduced than if the same resources were applied to more cost-effective activities.
The noncompliance rate in each activity: This is really the same as the previous point, since the noncompliance rate is merely the tax gap divided by the amount of true tax liability.
Average benefit/cost in each activity: This presumes that all additional work in a given activity will be, on average, just as cost-effective as work in the “base.” That would be the best as-sumption if we selected workload completely randomly, but for most types of work, we attempt (and generally manage) to select the most cost-effective workload within each activity, resulting in declining marginal cost-effectiveness as the level of effort increases.
Direct yield in each activity: This is quite common both for workload selection and in allocating resources across various activities—partly because it is easy. Unfortunately, it typically
A Framework for Optimal Tax Administration 7
uses a measure of yield other than the tax that is actually paid, and it focuses on direct enforcement results only. Moreover, the cost necessary to generate the yield is often not taken into account in a rigorous way, if at all. As a result, the overall net benefit generat-ed is bound to be significantly less than could have been achieved with a more optimal allocation of the same resources.
Even if all we were interested in were maximizing direct enforce-ment dollars, as illustrated in the example below, we must be guided by cost-effectiveness, not the average. In this example, cases 2 and 3 each (and in combination) have a lower average yield than case 1, but, together, they generate more yield than case 1 for the same cost and should, therefore, be pursued before case 1.
No-change rates: If a taxpayer is audited, for example, and the audit determines that the taxpayer reported the correct amount of tax, that audit is generally thought of as a “waste” of both the taxpayer’s and the IRS’s time and efforts. Therefore, IRS has historically sought to minimize the number of such cases as a per-centage of all cases worked. There is a problem with using that as the sole objective, however: it is quite possible that a category of work with a relatively high no-change rate nonetheless has a very high overall marginal benefit/cost ratio—even after taking into account the fact that the cost incurred on the no-change cases yields no direct benefit. That is because the direct benefit of the change cases and the indirect effects of both the change and the no-change cases can compensate for the lack of direct benefit from the no-change cases. Without quantifying all of those, it is not clear that we should minimize no-change rates. In fact, once we quantify those component effects, we would be able to allocate resources according to marginal benefit/cost, so that the no-change rate would be unnecessary anyway.
Table 1. Hypothetical Comparison of Yield/Cost and Average Yield
CaseExpected yield
(A)Expected cost
(B) Yield/cost
(A/B)Average
yield
1 200 100 2.0 200
2 150 50 3.02.75 137.5
3 125 50 2.5
Table 1. Hypothetical Comparison of Yield/Cost and Average Yield
CaseExpected yield
(A)Expected cost
(B) Yield/cost
(A/B)Average
yield
1 200 100 2.0 200
2 150 50 3.02.75 137.5
3 125 50 2.5
Plumley8
Rules of thumb: Ratios of amounts reported on a return, average amounts reported, and comparisons with prior years or with other taxpayers, for example, can be very misleading. Although such rules of thumb can be helpful in some cases, they invariably do not take everything into account, and they are not a good substi-tute for rigorous estimates of benefit/cost that take into account all the relevant factors. Unless a rule of thumb is itself a rough indicator of benefit-to-cost, it will not likely be a helpful basis for allocating resources.
Vague perceptions of noncompliance: Lacking specific em-pirical findings, it is tempting to make decisions on the basis of subjective perceptions. Yet, unless these subjective judgments attempt to quantify marginal benefit/cost, and are all that is avail-able in the short term, they could easily do more harm than good.
Ultimate Objective: What Should We Be Trying to Achieve?Principle #7. The current IRS mission statement is not specific enough to identify, by itself, the optimal way to administer the tax laws. It out-lines general purposes and values only.
The current (1998) IRS Mission Statement is:
Provide America’s taxpayers top quality service by helping them un-derstand and meet their tax responsibilities and by applying the tax law with integrity and fairness to all.
In contrast, the previous (1984) IRS Mission Statement was:
The purpose of the Internal Revenue Service is to collect the proper amount of tax revenue at the least cost to the public, and in a manner that warrants the highest degree of public confidence in our integrity, efficiency, and fairness.
This statement was closer to a statement of ultimate objective and can serve as a guide for resource allocation. For example, it identifies “collect[ing] the proper amount of tax” as the primary benefit to be sought. This includes both voluntary and enforced payments. “Proper” acknowl-edges that taxpayers should be refunded any overpayments just as much as they should be required to pay any underpayments. “Collect the proper amount of tax” also implies two more things: what really matters is what is
A Framework for Optimal Tax Administration 9
finally paid (not just what is reported on returns or recommended or assessed through enforcement), and it is tax (not interest and penalties) that is the ultimate benefit. The statement also makes it clear that these benefits should be derived as cost-effectively and fairly as possible. Put another way, the costs borne by the public (both IRS costs and taxpayer burden), and the steps that the IRS takes to foster “the highest degree of public confidence in our integrity, efficiency, and fairness,” are all means to the end of collecting the proper amount of tax; they are not ends in and of themselves. Although not everything that the IRS must do has a tax revenue impact (either directly or indirectly), the 1984 Mission Statement captures the bulk of IRS’s role in administering the tax laws. A more explicit statement of this objective fol-lows in Principle #8.
Principle #8. The ultimate objective of the IRS is to maximize the weighted net benefits (weighted benefits minus weighted costs), subject to the relevant constraints. Specifically, the benefits, costs, weights, and constraints should include the following:
Benefits: There are six major benefits that IRS should seek to achieve: tax revenue paid timely, enforcement revenue paid sooner rather than later, other late payments, revenue protected, overpayments refunded through efficient returns processing and enforcement, and tax payments more closely aligned with true liabilities. These are explained below.
Tax revenue paid timely: This is the ultimate intent of the Tax Code and the ultimate benefit (both to the IRS and to taxpayers). In practice, it encompasses several things:
Tax paid in regular deposits throughout the year, both directly by taxpayers and indirectly through withholding agents;
Tax remitted with filed returns;
The indirect effect (i.e., improved voluntary compliance in the general population) of taxpayer service activities; and
The indirect effect of enforcement activities. This is gener-ally considered the deterrent effect of IRS enforcement. It includes both the improvement in subsequent compliance behavior among those who are contacted through enforce-ment (the “subsequent-year effect”) and the improvement in the voluntary compliance of those who are not contacted (the “ripple effect” of enforcement). In reality, it is quite likely that the ripple effect arises from both a deterrent mechanism
Plumley10
and an assurance mechanism. The latter is likely the expla-nation for an improvement in compliance among those who do not consider themselves probable targets of a particular type of enforcement, such as criminal investigations; they probably improve their compliance behavior (or do not erode it) when they conclude that scofflaws are being found and punished fairly and effectively, giving them greater assur-ance that the tax laws are being administered fairly and taking away potential reasons to participate in petty noncom-pliance in protest themselves.
Enforcement revenue paid sooner rather than later: It would certainly be better (e.g., less costly and quicker) if all tax obliga-tions were paid voluntarily and timely, but, if payments have to be enforced, those tax payments are nonetheless benefits that should be taken into account. Specifically:
This is the direct effect of enforcement activities (additional revenue paid late because of enforcement contacts).
The actual benefit is dollars of tax collected (not just recom-mended or assessed).
Penalties and interest should probably be weighted less than tax (possibly not treated as benefits at all for resource al-location purposes). Even if the inclusion of interest fully accounts for the time value of the money, there are added benefits to the money being paid on time. That is, we should not prefer an outcome that imposes penalties on taxpayers (and therefore increases revenues) over one in which they pay in full and on time.
Late payments of tax should similarly be weighted less than timely payments. This could be handled by applying an agreed-upon discount rate to late payments.
Other late payments: These are amounts of tax that are paid late, but they are paid without IRS intervention. Examples include:
Amounts paid late because the taxpayer forgot to enclose a check for the balance due with the return. As long as the pay-ment is made before the IRS sends the taxpayer a notice, it is not considered enforcement revenue.
A Framework for Optimal Tax Administration 11
Amounts paid before a filing extension but after the payment due date (which is generally the original due date of the return).
Amounts paid with amended returns that are filed voluntarily after the original due date.
Amounts paid with returns that are filed late without any IRS prompting.
Amounts paid in response to IRS soft notices (e.g., attempts to clarify information or suggest future behavior, without actually making an assessment).
As with enforced payments, these other late payments should be weighted less than timely payments in the ultimate objective function.
Revenue protected: Money that would have been paid out to taxpayers (but should not have been), were it not for IRS interven-tion, should be counted as a benefit of IRS activities. However, whenever we attempt to estimate total benefits, to avoid double-counting, we should include only amounts that are not already in-cluded with timely paid tax, such as disallowed refundable credits and claims for refunds on fraudulent returns.
Overpayments refunded through efficient returns process-ing and enforcement: We should not include overpayments as benefits; they are paid unnecessarily or by mistake. Whenever we attempt to estimate total benefits, they should be netted out. However, the amount of each valid refund should be considered a benefit for resource allocation and workload selection purposes. This should include:
Valid refunds claimed on timely or amended returns;
Overpayments detected by math error and returns processing; and
Overpayments detected by enforcement.
It is important to note, however, that while amounts that taxpay-ers overpaid and were refunded should be considered as positive benefits (rather than subtracted from total benefits), overpayments that neither the taxpayers nor the IRS detect should not be consid-
Plumley12
ered a benefit. Rather, they are a cost—most likely attributable to complexity, ignorance, confusion, etc. Therefore, undetected overpayments should be considered a type of compliance cost (or burden). See “Taxpayer and Other Private Costs” below.
Having tax payments more closely aligned with true liabilities: Just as compliant taxpayers benefit from the fairness achieved when their overpayments are corrected, they also benefit when noncompliant taxpayers are required to pay their tax in full. This sometimes has monetary benefits that are not already taken into account in the refunds and enforced payments described above. For example, tax enforcement generally fosters fair business com-petition, which allows compliant taxpayers to stay in business and earn higher profits. Moreover, compliant taxpayers generally ben-efit from a smaller tax gap to the extent that it is associated with some combination of lower tax burdens, lower budget deficits, or more public goods and services.
Costs: There are two main categories of cost. These are generally the means to achieving the benefits. Marginal benefit/cost estimates that are used for resource allocation must reflect the full cost of the activi-ties in question—including all overhead, indirect, and follow-on costs.
IRS Costs: These are the amounts included in the IRS budget ap-propriations for the year in question. For any current fiscal year, these amounts are fixed. IRS can perhaps influence the budget somewhat for future years but not in the current year. Resources are therefore limited, forcing a prioritization of work—identifying the best combination of tax administration activities and the best workload to maximize net benefits. Having separate budget ap-propriations for different IRS activities imposes some constraints on this optimal use of the overall level of resources, however, and these constraints may or may not significantly limit the overall net benefits that can be achieved.
Taxpayer and Other Private Costs: Taxpayers incur various costs in order to comply with their tax obligations. These take the form of out-of-pocket expenses, time, and frustration. Taxpayers need to keep records, obtain forms and publications, complete and submit forms, make payments, etc. Many taxpayers choose to pay for goods and services that will help them with these tasks. In addition, third parties incur costs to provide information reporting and withholding services for taxpayers and the IRS. All of these
A Framework for Optimal Tax Administration 13
costs should be taken into account when IRS allocates its resourc-es, though IRS costs and private costs may be weighted (valued) differently. (See Principle #11 for more details.)
Weights: When components of Benefits and Costs are combined, they will likely need to be weighted differently to reflect differences in inherent value. For example:
Late payments should be weighted less than timely payments, perhaps through the use of a discount rate.
Refunds of overpayments detected through enforcement could be weighted differently from payments of additional assessed tax.
Private compliance costs could be weighted differently from government costs.
These weights generally cannot be derived theoretically or empirically, and so must be determined by consensus among the ultimate decision-makers, reflecting their best judgments.
Other Constraints: Within a given fiscal year, the IRS operates under a fixed budget and a fixed Internal Revenue Code. However, IRS ac-tions are often constrained by other things, as well, such as the geo-graphic distribution of taxpayers and employees, the job market in each location, employee training needs, and government hiring rules. As long as these constraints can be quantified, they can be accounted for in a model that seeks to maximize net benefits.
Nonrevenue Benefits: Some IRS functions (e.g., most of the Tax-Exempt/Government Entities operating division, much of MITS—In-formation Technology support—and other support functions) are not directly revenue-related. There are several options for addressing these functions:
If the benefits of these functions can be expressed in dollars, they can be included among the other benefits and weighted separately.
If the cost of these functions is mostly overhead to facilitate prefiling, filing, and postfiling operations, then that should be reflected in the cost of those programs.
Otherwise, resources can be allocated to these functions out-side of an optimization framework—much as they are now.
Plumley14
Principle #9. Three forms of fairness are accounted for by the benefits and costs described above:
Underpayments of tax are prevented or corrected to the maximum extent possible, given the weight chosen for this benefit.
Overpayments of tax are prevented or corrected to the maximum extent possible, given the weight chosen for this benefit.
All activities would be funded (and all workload would be select-ed) on the same objective basis. Taxpayers and taxpayer groups would all be treated similarly because enforcement and service activities would all be guided by this simple objective. This ac-counts for both direct and indirect effects (not direct alone), and all activities and workload would compete for resources based on their marginal cost-effectiveness in producing net benefits consis-tent with our ultimate objective.
Principle #10. If we take all of the right benefits and costs into account, then it is not optimal to pursue noncompliance that is not cost-effective at the margin. But is it fair? The answer is both yes and no. It is important to remember that the objective includes as a benefit (a major benefit) the indirect impact of IRS activities on voluntary compliance—both among the taxpayers we contact and those in the general population whom we do not contact. As long as the objective takes into account all of the benefits that taxpayers and the IRS realize from our efforts (as well as all of the costs), there is no remaining fairness issue. For example, pursuing work that is less cost-effective would mean that less of the tax gap would be closed, which would be unfair to compliant taxpayers. Ultimately, the fairness to noncom-pliant taxpayers (potential targets of enforcement) is not as important as the fairness to compliant taxpayers. However, having said that, we must not ignore pockets of high noncompliance. We should use the tax gap as a guide in allocating our research resources, developing better (more cost-effective) ways to improve voluntary compliance and enforcement where the risk is the greatest and the gains are likely to be greatest, as well. (See also Principle #6 above.)
Principle #11. Reduction of taxpayer compliance costs (burden) is not an independent objective. Taxpayer costs are an integral component of the net benefit calculation, but reduction of burden is not a stand-alone objec-tive. In fact, imposing some kinds of burden on taxpayers and third parties is sometimes the best way to maximize net benefits because the alternatives provide far fewer benefits and/or cost much more. Therefore, taxpayer
A Framework for Optimal Tax Administration 15
burden reduction should not be viewed as a goal that is independent of the overall IRS objective. This is easier to understand when we see the distinc-tion between necessary burden and unnecessary burden.
Necessary burden includes all cost-effective alternatives to more onerous methods (e.g., IRS action alone). That is, private com-pliance costs are necessary if they produce more net benefit than would be possible without them. A clear example of necessary burden is the cost of existing third-party information reporting, which is far more cost-effective at promoting voluntary compli-ance than an alternative IRS enforcement program would be in the absence of such reporting. More subtle is the fact that, though IRS forms, instructions, and publications impose some burden on taxpayers, they are far less burdensome than the alternative: an Internal Revenue Code (and regulations) not accompanied at all by forms, instructions, and other information that help taxpayers to understand and comply with the law.
Unnecessary burden, in contrast, does not increase net benefits cost-effectively. In this case, more cost-effective alternatives should be found. For example, although tax forms and instruc-tions are not inherently unnecessary, any confusion or unneces-sary work that they cause is unnecessary burden.
Reducing unnecessary burden and imposing necessary burden are means to the end of increasing net benefits; they are not ends in themselves.
Principle #12. Customer satisfaction and employee satisfaction (as measured by surveys) are also means to achieve our ultimate objective; they are not ends that compete with that objective. We want taxpayers to be satisfied not only because it is right, but because, when they are satisfied, they are more likely to be compliant (increasing the benefits). Likewise, when employees are satisfied, they may work more efficiently, thereby increasing the benefits and/or reducing costs. We would not want to increase customer or employee satisfaction if that meant reducing the net benefit (e.g., by reducing voluntary compliance or by increasing costs). Although tax policy is often formulated to maximize some notion of overall social welfare, once that policy is fixed in the tax laws and regulations, the role of tax administration is to use its resources as cost-effectively as possible to collect as close to the aggregate amount of tax imposed by law as possible. Neither customer nor employee satisfaction is generally a good measure of how well IRS has achieved that objective.
Plumley16
Priorities: How Do We Get From Here to There?Principle #13. Senior IRS decisionmakers need to develop consensus on the components and form of the ultimate objective (including the weights assigned to the components). These cannot all be derived empirically or the-oretically. This consensus could change over time, but it should reflect their best judgment (working in concert with the Department of the Treasury and Congress, as well as with taxpayer and other stakeholder groups) of what the IRS should try to achieve. Furthermore, it will take determined leadership to ensure that all IRS functions cooperate to compile the data necessary to estimate the marginal cost-effectiveness (bang for the buck) of each activity as a function of level of effort, and to update those data annually.
Principle #14. IRS needs to take a long-term view of compiling the right data and developing the estimates necessary to model optimal resource allocation, etc. It may take more than 10 years, but we should be closer to ideal 10 years from now than we are today. It will require a serious cross-functional effort (operations and research organizations working together). (The IRS Enforcement Revenue Information System is an instructive prec-edent for such an undertaking. It was costly to develop in terms of dollars and time, but it is now relied upon as a crucial IRS database—compiling very useful data on every IRS enforcement case.) It is helpful that the IRS, with the support of Treasury and the Congress, has committed to a long-term National Research Program to collect taxpayer compliance data, which may prove useful in estimating the indirect effects of IRS programs on the voluntary compliance behavior of the general population, but other data will be needed specifically to estimate the marginal cost-effectiveness of those operational programs (see Principle #15).
Principle #15. IRS needs to estimate marginal direct and indirect benefit/cost for each activity (both enforcement and service activities) as a function of resource levels. Short-term approximations can be used and improved over time. Specifically, the IRS research community, working with IRS leadership from all of the divisions and functions, should pursue several critical priorities to move the Service in the right direction:
Short Term (2 Years): Even though good, comprehensive estimates of marginal benefit-to-cost will require much more time to develop, much can be done in the short term. Three initial priorities stand out:
Develop consensus on key components of our ultimate objective:
What benefits and costs (to IRS and to taxpayers) should be included;
A Framework for Optimal Tax Administration 17
What relative weights to assign to the various benefits and costs; and
What discount rate to apply to future amounts.
This consensus is foundational to defining what we should be trying to achieve, and must reflect the judgment and commit-ments of senior IRS leadership as well as key stakeholders. (See Principle #13.)
Develop preliminary estimates of marginal direct revenue/cost for each program as a function of budget outlay. This could be based on Enforcement Revenue Information System (ERIS) data on total enforcement revenue collected (which would not include all benefits, but would be a step in the right direction) and on budget data on expenditure by program. Such an analysis would not be as detailed as would be possible with data that could be compiled over a longer term, but it would be much better than using average amounts, recommended audit results, and not taking cost-effectiveness into account at all.
Derive assumed marginal indirect revenue/cost curves for each program based on the consensus judgments of senior IRS deci-sionmakers. This would be an update of a 1998 exercise conduct-ed by PricewaterhouseCoopers in which senior IRS executives developed consensus on the relative magnitudes of the indirect effects of various enforcement and service activities.2 These rela-tive magnitudes could then be used to derive presumed indirect revenue/cost curves for each program, based on a curve estimated statistically for Examination.3 The derived curve for each pro-gram would be a multiple or fraction of the known curve, where the multiples and fractions are based on the consensus relative magnitudes.
Although this approach is far from ideal, it is does have some ad-vantages. It can move us in the right direction in a relatively short time. It captures the best judgment of key decisionmakers outside of budget pressures, replacing much of the subjective and incon-sistent reasoning that is often applied during the budget process. It also allows resources to be allocated according to consensus rules based on the right principles, and can be used in conjunc-
2 See Plumley (2002).3 See, for example, Plumley (1996).
Plumley18
tion with estimates of the marginal direct effect, which would be estimated separately. Fundamentally, this approach is better than current attempts to foster voluntary compliance by maintaining arbitrary minimum coverage constraints, and it is certainly better than doing nothing at all to account for indirect effects.
Long Term (10 Years): The best way to develop robust and compre-hensive estimates of marginal benefit-to-cost for each IRS activity is to compile the right kind of data and to apply appropriate research meth-ods. Both of these will require a long-term effort and will need to be updated regularly. (See Principle #14.) This research should include several key components:
Develop consensus among IRS researchers and a panel of aca-demic researchers as to the types of methodologies likely to be able to produce good estimated marginal benefit/cost curves as a function of level of effort (or cost) for each IRS activity (both enforcement and nonenforcement activities). The long-term data needs should flow from the selected methodologies; we should not expect to be able to estimate marginal benefit/cost functions solely from data systems designed to manage operational programs.
Compile detailed cost data for each activity. This will be needed for any estimation method but should be compiled in a way that will facilitate the selected approach. For example, it will have to be decided what variables the costs should be associated with for the eventual analysis (e.g., type of activity, type of taxpayer, geographic area, etc.). The cost data should be comprehensive (capturing both hours and dollars), including direct time applied, indirect time (training, leave, recordkeeping, etc.), support costs (human resources, management, secretarial, etc.), capital and overhead costs (equipment, supplies, facilities, etc.), and contract costs (for data, services, etc.). Compiling cost data of this nature in a consistent way across all IRS activities will be a major cross-functional undertaking—similar, perhaps, to what was needed to create the Enforcement Revenue Information System (ERIS). It likely would not impose more administrative requirements on front-line employees, but instead would capture existing informa-tion in a common format. Like ERIS, it would be hard to create but would become an invaluable source of information once it is fully functional.
A Framework for Optimal Tax Administration 19
Compile detailed and standardized output data for each activity. Much of this is probably already compiled, but not in a standard-ized way across all activities (e.g., by type of taxpayer, geographic area, etc.). This would include direct enforcement revenue (for estimating marginal direct effects) but also outputs from service activities.
Compile detailed data on taxpayer compliance behavior, such as returns filed (and when) and amounts of tax paid voluntarily and on time (including the method and timing of payment), as well as late payments (particularly nonenforced late payments)—all by type of tax and the same geographic and type of taxpayer indica-tors defined for the cost and output data. These data would be used to develop estimates of the indirect effects of both enforce-ment and service activities—estimates that will likely require on the order of 10 years of data.
Compile data on non-IRS factors likely to influence compli-ance behavior, such as economic, demographic, and attitudinal variables, as well as tax law changes. These would need to be compiled in the same geographic and time dimensions used for compiling all the data described above.
Introduce more variation (geographically and over time) in spending on specific IRS enforcement and nonenforcement activi-ties than would normally be the case. In essence, these varia-tions would be controlled field experiments designed to estimate the marginal impact of these activities on taxpayer compliance behavior, where all other relevant factors (both IRS and non-IRS factors) are controlled for statistically (rather than with standard control groups).4
4 Multiple factors undoubtedly shape voluntary compliance behavior: presumably most IRS activities plus other factors outside of IRS control. A change in taxpayer behavior that appears to be associated with a change in IRS actions could actually be caused by one or more other factors, so that we must control for all relevant factors simultaneously. A simple way to do this is to identify a control group that is identical to the treatment group in all respects other than the treatment. However, given the large number and wide variety of potential determinants of compliance behavior (and the fact that we do not necessarily know what they all are), a control group in this context would probably have to be quite large and dispersed across the country, raising the likelihood that it would be influenced by the treatment. Furthermore, if a significant determinant of compliance behavior (e.g., religion) is not controlled for, its impact would be attributed incorrectly to the IRS intervention. That would not be a problem when controlling for compliance determinants statistically—as long as the excluded variable was not correlated with the IRS variables of interest.
Plumley20
ConclusionIRS can undoubtedly make better use of existing and new resources to achieve greater benefit and impose less cost on taxpayers. To do that, we need to be explicit about our ultimate objective and allocate resources at the margin accordingly. Developing that capability will likely take a concerted, long-term (10-year), cross-functional effort to gather the right data every year and to introduce extra variation in our activities, making it easier to estimate their direct and indirect impacts at the margin. We can take other steps in the short term to make some improvements. However, allocating re-sources according to the distribution of the tax gap is not the right approach.
AcknowledgmentsI wish to thank Joel Slemrod for comments and suggestions on earlier drafts of this paper, and for bearing with me on points of (what I believe to be mi-nor) disagreement. Janet McCubbin and Mark Mazur also provided valuable suggestions.
References
Plumley, Alan H. (1996), The Determinants of Individual Income Tax Com-pliance: Estimating the Impacts of Tax Policy, Enforcement, and IRS Responsiveness, IRS Publication 1916 (Revised 11-96).
Plumley, Alan H. (2002), “The Impact of the IRS on Voluntary Tax Com-pliance: Preliminary Empirical Results,” National Tax Association, Proceedings of the Ninety-Fifth Annual Conference, pp. 355-363.
Plumley, Alan H. and C. Eugene Steuerle (2004), “Ultimate Objectives for the IRS: Balancing Revenue and Service,” in The Crisis in Tax Administration, edited by Henry J. Aaron and Joel Slemrod, Brookings Institution Press, Washington, D.C., pp. 311-346.
D2
Tax Policy and Tax Compliance
Hite Hasseldine Fatemi Turk Muzikir Blumenthal Kalambokidis
Tax Rate Preferences: Understanding the Effects of Perceived and Actual
Current Tax Assessments Peggy A. Hite, Indiana University; John Hasseldine, University of
Nottingham; and Darius J. Fatemi, University of Denver
S ome researchers and policymakers argue that public attitudes toward fair tax rates should be discounted. Problems include assertions that attitudes are not uniformly held, there are public misperceptions, and
taxpayers are self-interested (Blum and Kalven, 1953; Keene, 1983; Slem-rod, 1983). Gerbing (1988), however, demonstrated that tax rate structure significantly impacts taxpayer perceptions of overall tax system fairness, and prior studies have reported a significant positive association between tax rates and evasion (Webley et al., 1991; Alm et al., 1992). Given that the Federal tax gap is estimated at over $300 billion (IRSOB, 2004), public ac-ceptance or rejection of the Federal tax system could be a major factor in its success or failure.
One of the reasons researchers have asserted that taxpayer preferences are illusive is that behavioral anomalies bias the process toward particular preferences (Krishna and Slemrod, 2003). A wide variety of framing biases have been identified (Schelling, 1981; Shefrin and Thaler, 1988; McCaffery and Baron, 2004). For example, prior studies have shown that taxpayers favor higher tax rates when they are asked to respond in percentages rather than in dollar amounts (Hite and Roberts, 1991; McCaffery and Baron, 2003). The literature has not yet examined the behavioral impact of another potential source of bias, the status quo effect for actual tax assessments, on tax rate preferences. That is, do perceptions and awareness of the current tax rate structure influence stated preferences for what tax rates should be? The present study examines how status quo tax liabilities, both real and per-ceived, affect preferences for progressivity.
Specific contributions of this study include the following. First, the study examines a variety of features that could proxy as measures of pro-gressivity to better understand what aspect of progressivity is driving the responses. Prior behavioral research has used the Suits Index (Suits, 1977) but has not specifically emphasized the need to elicit the preferred rate on very low incomes, the preferred rate on very high incomes, or the range of tax rates as dependent variables. In this study, not only is the Suits Index examined, but also features that are most likely to be salient to taxpayers are used, such as the lowest marginal rate, the highest marginal rate, tendency to assess negative taxes, range of tax rates assessed, and measures of relative
Hite, Hasseldine, and Fatemi24
tax burden. Second, this is the first study requiring subjects to provide both dollar and percentage responses, forcing them to mathematically reconcile their preferences. This negates the potential measurement error in previous studies, given that those results differ depending on which type of dependent variable is used. Third, this study explicitly tests for a status quo effect of the current income tax system. Prior research has not done this, even though those results may have been influenced by subjects who were parroting the current rate structure because of its familiarity. This study examines the effect of actual U.S. tax liabilities, perceived tax liabilities under the current U.S. income tax system, and the anchoring effect of a hypothetical set of tax liabilities. Fourth, the experiment examines responses for a hypotheti-cal taxpayer with a very high income of $300,000. Prior research examined incomes in which $100,000 was the highest income, but, currently, the top marginal tax rates do not begin until taxable income exceeds $349,701. Fifth, this study extends past research that found subjects were resistant to information on negative taxes. The present study examines how access to actual and hypothetical but comparable rates affect preferences toward nega-tive taxes.
The results show that subjects who are given information about current tax liabilities tend to assess lower overall taxes (except at the highest income level), lower taxes for low-income taxpayers, a higher range of taxes, and steeper progressivity as measured by the Suits Index and relative tax burden, than do subjects without that status quo information. They also show that informative data on actual negative taxes are significantly influential, but the anchoring effect using hypothetical data is not. Even though tax assessment generally result in lower tax preferences for subjects with status quo infor-mation compared to subjects without status quo information, tax preferences for those with the information are significantly higher than the actual status quo information itself. This indicates that subjects are influenced by those rates, but they do not merely mimic the displayed rates. Similarly, subjects’ perceptions of current tax liabilities affect their assessments of fair tax li-abilities. Those who perceive current taxes as relatively high tend to report relatively high fair tax assessments. The implication is that tax rate prefer-ences are influenced by each respondent’s a priori perceptions. Thus, re-searchers and policymakers wanting to document tax rate preferences should provide accurate tax data to the respondents so that any potential impact of status quo rates will be based on knowledge and not merely on erroneous misperceptions.
Tax Rate Preferences 25
Theory and Hypothesis DevelopmentProgressivityDetermining an equitable tax rate structure is problematic. Walster et al. (1973) suggested that equity is too self-interested to be universal, but Rawls (1971) argued otherwise. He asserted that there is a public conception of justice, and this was later confirmed by Porcano (1984). Porcano examined perceptions of distributive justice in assessing fair tax rates. The experi-mental design included 18 hypothetical taxpayers with varying demograph-ics (age, marital status, and number of dependents) and incomes ($6,000, $20,000, or $60,000). Total hypothetical incomes added up to $516,000, and the tax revenue needed was set at $100,000, a forced average tax of just under 20 percent. The results reflected a preference for progressive tax rates, including tax relief for low-income taxpayers ($6,000 incomes). Thus, the author concluded that public concepts of distributive justice are dominated by the contributions rules (ability-to-pay) and the needs rules.1 Consistent with the Porcano study, Hite and Roberts (1992) found that equity percep-tions are significantly more salient than are self-interests.
Although there are some underlying constructs that garner support such as contributions and needs rules, the consensus on an exact tax rate structure is less clear. Prior research has found that preferences for tax rates are evenly split among two broad categories: proportional or flat taxes and moderately progressive rates (Hite and Roberts, 1991; McCaffery and Bar-on, 2004). To examine tax rate preferences, McCaffery and Baron (2004) gave a questionnaire to subjects solicited on the World Wide Web. Subjects were given a moderately progressive set of tax rates ranging from 12 percent to 30 percent for four incomes ranging from $20,000 to $160,000. Using a within-subjects design, respondents were asked whether a flat tax (either 19.2 percent or 28.8 percent) or a steeply progressive tax (ranging from either -19.2 percent to 38.4 percent or -28.2 percent to 57.6 percent) was relatively more fair or less fair than the original set of moderately progres-sive rates. Subjects, on average, indicated the flat and steeply progressive rates were significantly less fair than the given standard. Thus, research-ers concluded that moderate progressivity is preferred over flat and steeply progressive systems. That conclusion, however, cannot be generalized to all flat or steeply progressive systems. Subjects may not have preferred the flat tax in that study because both scenarios (19.2 percent and 28.8 percent) were high rates, especially for low-income taxpayers. The two steeply progres-sive sets of rates could have been relatively unfavorable for several reasons. 1 Public consensus was also documented by Wildavsky (1996), who found that taxpayers across the country agreed that the maximum tax burden a taxpayer with $200,000 of income should have is an average 25 percent.
Hite, Hasseldine, and Fatemi26
The authors assert that subjects did not like the negative tax concept in which low-income taxpayers did not pay any income taxes but instead re-ceived monetary help from the government. This is a potential explanation, but other explanations also exist. Subjects may have disapproved of the zero tax liability at the $40,000 income level. They may have disapproved of the highest marginal rates of 38.4 percent on $160,000 as well as 57.6 percent on $160,000. In addition, they may have disagreed with the wide ranges from -19.2 percent to 38.4 percent (a 57.6-point differential) and from -28.8 percent to 57.6 percent (an 86.4-point differential). Those are large spreads compared to the 18-point differential for the moderately progressive set of income tax rates (ranging from 12 percent to 30 percent) that was used for the comparison.
Hite and Roberts (1991) documented a taxpayer preference for slight progressivity based on respondents’ assessments of what fair taxes should be for a given set of hypothetical incomes. In addition to calculating aver-age tax rates at each level of income, researchers calculated the Suits Index (Suits, 1977) for the respondents’ answers. The Suits Index measures the relationship between the cumulative percentage of total tax burden and the cumulative percentage of total income (Hite and Roberts, 1991). A score of -1 indicates maximum regressivity, 0 indicates a proportionate tax, and +1 indicates maximum progressivity. Hite and Roberts (1991) calculated an in-dex of .18 using their respondents’ tax assessments on hypothetical incomes, indicating a preference for a mildly progressive system. The Suits Index from Statistics of Income (SOI) data at the time of the study was estimated at .218. Finding that taxpayers prefer a mildly progressive system, as mea-sured by the Suits Index, was consistent with a set of qualitative questions that compared five different tax rate structures (four progressive sets and one flat set). When asked which system is the most fair, preferences were divided primarily among three sets of rates: 34 percent of the respondents indicated the 20-percent flat tax is most fair, 33 percent indicated progressive rates from 14 percent-45 percent are most fair, and 28 percent indicated a preference for progressive rates ranging from 15 percent-33 percent. When asked about the other two sets of rates, 79 percent of all subjects disagreed that progressive rates from 18 percent-59 percent are fair, and 86 percent disagreed that rates from 23 percent-66 percent are fair. These results are consistent with the assertion that there is public sentiment against steep pro-gressivity, as measured by the spread and highest marginal rates.
Tax Rate Preferences 27
Status QuoDespite nearly 40 changes in individual tax rates in the 90-year history of U.S. income taxes (Hite and Roberts, 1991), public opinion regarding tax rates is not well understood. Research has shown that taxpayers tend to indi-cate a slight preference for mildly progressive tax rates (Porcano, 1984; Hite and Roberts, 1991; McCaffery and Baron, 2004). That conclusion, however, could be a mere reflection of the current tax rate structure, indicating a status quo effect. It is unclear whether current tax rates set expectations for what tax rates should be or whether public opinions favoring mildly progressive tax systems have influenced congressional laws to reduce high marginal tax rates, thereby creating the moderately progressive tax rates that the U.S. cur-rently has.
A possible explanation for the preferred mildly progressive system over the flat and steeply progressive systems in the McCaffery and Baron study (2004) could be the subjects’ fixation on their standards of comparison. Subjects were asked to compare a proposed set of rates to a given standard ranging from 12 percent to 30 percent. Thus, they could have anchored on the initial standards as if it were a valid or presumed acceptable standard. Moreover, that standard of comparison did not substantially differ from actual nominal tax rates at the time of the study. Under 2001 tax law (when the study was conducted), the statutory rates ranged from 10 percent (with the new rebate) to 39.1 percent. Thus, subjects could have fixated on the actual nominal tax rates. Respondents might have believed those rates were more fair, or they may have been biased by familiarity with the status quo and therefore resistant to unfamiliar alternatives.
In 1989, Hite and Roberts (1991) surveyed households across the United States about different types of income tax rate structures. On aver-age, subjects assigned tax rates ranging from 11 percent for the minimum tax rate to 28 percent for the maximum tax rate. Since statutory tax rates at the time of the study were 15 percent to 28 percent, the authors cautioned that respondents could have been influenced by the current status quo. When examining standards of fairness in a profit-seeking transaction, prior re-searchers documented the importance of a reference transaction (Kahneman et al., 1986). They noted that a reference transaction is frequently a relevant precedent, but the basis for fairness could be driven by the fact that it is a normal state of affairs rather than because it is just. This argument presumes that people eventually conform to the established standard. To be eventually accepted, the status quo standard would need to be known.
Hite, Hasseldine, and Fatemi28
McCaffery and Baron (2004) examined status quo bias in a tax setting. They did not examine the salience of actual tax rates, but they presented a variety of tax assessments as the initial bases to compare a proposed set of tax assessments. Their results showed that Web-based subjects, more often than not, preferred the specified starting point to any change. The general resistance to change was described as a reaction to the resulting winners and losers caused by the decision choices. The tax choices involved tradeoffs between single and married taxpayers with and without children, and sub-jects were predominantly females with a median age of 30.
Studies in cognitive psychology have shown that, all else equal, sub-jects are resistant to change (Samuelson and Zeckhauser, 1988). Much of the research on perceptions of tax fairness is based on survey questions that take the status quo ante for granted (McCaffery and Baron, 2004). The pres-ent study is an experiment that directly tests the effect of status quo inertia. The information makes the status quo apparent and serves as a valid refer-ence point for those subjects. Some of the subjects are asked to report what they think current tax assessments are for the same set of given incomes. Hence, the study examines the impact of actual knowledge about status quo tax assessments, as well as perceptions of what status quo tax assessments currently are.
Knowledge or BiasThe seminal status quo study by Samuelson and Zeckhauser (1988) ex-amined experimental data with student subjects, as well as actual health insurance and TIAA/CREF investment data. When choosing between types of health insurance policies and retirement investment allocations, people tended to continue with their previous choices, demonstrating status quo inertia. Similarly, when subjects were given hypothetical decision frames, they tended to stick with the status quo option.
The researchers concluded that status quo bias could result from a psychological commitment related to sunk cost misperceptions, regret avoidance, and a desire for consistency. They also noted, however, that status quo effects could result from cognitive misperceptions, and status quo inertia could be the consequence of rational decisionmaking in the presence of transition costs or uncertainty. The researchers asserted that their experi-mental scenarios did not include any information asymmetry; yet they did concede that some decision settings could have been interpreted as implicitly rational and therefore plausibly retained. If status quo tax rates are provided
Tax Rate Preferences 29
to subjects, subjects may be tempted to accept them as fair, given the cost of acquiring evidence to the contrary. After all, when policymakers alter tax rates, they begin with factual status quo information and make changes from there. Hence, the first null hypothesis tests whether subjects who are provid-ed data regarding actual tax rate assessments for a set of incomes are likely to be influenced by those assessments when reporting fair tax liabilities.
H1: When provided with a set of current tax assessments, subjects’ as-sessments for fair tax liabilities will not differ from those not receiving that information.
Ex Ante Perceptions The above hypothesis suggests that a significant difference between the groups with and without status quo information supports a status quo effect. It is important to distinguish between a status quo effect and a status quo bias. As noted earlier, status quo inertia does not prove a bias if there is some implicit rationality behind the status quo choice.
To the extent providing status quo data represents factual knowledge, the ultimate responses could be informed choices which should be a posi-tive factor, not a bias. Based on referent cognitions theory, Wartick (1994) and Roberts (1994) found that tax education and information about the tax system significantly increased positive attitudes toward the tax system.
Whether biased or informed, the first hypothesis reflects the sentiment expressed in previous tax preference studies that respondents may have been parroting current tax rates rather than providing unbiased tax rate prefer-ences. The conjecture, however, presumes that respondents actually knew what those current tax rates were. In other words, a status quo effect could result from the presentation of actual tax assessments, or it could result from a priori perceptions of what current tax assessments are. To the extent that ex ante perceptions of current tax liabilities influence what fair assessments should be, then that would demonstrate a status quo effect. If the ex ante perceptions are not consistent with actual Government-assessed tax liabili-ties, then the effect would be based on a misperception, which is indicative of a bias. Thus, the second hypothesis tests for the effect of perceived tax liabilities on assessments of fair tax liabilities.
H2: Subjects’ beliefs about what tax liabilities are currently assessed will not be positively associated with their assessments of what fair tax assessments should be.
Hite, Hasseldine, and Fatemi30
AnchoringAnother way to test for a status quo effect related to knowledge or bias is to test for an anchoring effect based on a hypothetical set of tax liabilities rather than actual tax liabilities. Samuelson and Zeckhauser (1998) argue that status quo anchoring is a type of cognitive misperception. It involves using an initial value as a starting point and then adjusting that value for the incremental facts. If subjects in the present study are significantly influ-enced by the actual status quo assessments, as well as by the hypothetical income tax liabilities, then it would imply that subjects are being influenced by the anchor of any status quo position, not by the substance or knowledge inherent in the actual status quo data. Thus, the third hypothesis tests for an anchoring effect by using a hypothetical set of tax liabilities.
H3: When provided with a hypothetical set of tax assessments, sub-jects’ assessments of fair tax liabilities will not significantly differ from those without the hypothetical data.
Research MethodThis experiment tests for a perceived status quo effect and for an anchor-ing effect. Thus, besides providing status quo data to one set of subjects, another set of subjects is given a hypothetical set of tax assessments as an anchor, and some subjects are asked to report the tax assessments that they believe current tax law requires. Pairwise comparisons are made to evaluate the impact of the status quo manipulation versus the control group, the an-chor manipulation versus the control group, and the status quo group versus the anchor group.
Subjects Preferences for tax rates are difficult to assess. Using adult taxpayers, prior research has documented a significant relationship between tax rate prefer-ences and self-interest, indicating that high-income taxpayers tend to prefer flat tax rates and low-income taxpayers tend to prefer progressive tax rates (Gerbing, 1988; Hite and Roberts, 1991). Hite and Roberts (1992), however, found that tax attitudes were more affected by equity factors than by self-interests. Similarly, Porcano (1984) concluded that his student and faculty subjects did not make tax assessments based on self-interest. Moreover, the author reported that the findings were consistent for both types of subjects. Student subjects were also used in one of the first and most prominent fram-ing studies (Schelling, 1981). That research reported significant differences
Tax Rate Preferences 31
in progressivity preferences when a two-child family is allowed an exemp-tion compared to assessing a premium for the childless family. Given that students are considered to be a relatively homogeneous group of subjects compared to the adult taxpaying population, students are an appropriate choice of subjects for testing the theoretical impact on preferred tax rates when different sets of information on current tax rates are examined (Ashton and Kramer, 1980). In addition, an advantage to using students in this study is the opportunity to examine aspects of progressivity that have not been controlled or specifically examined in prior studies because of time and com-plexity limitations that could deter adult taxpayers from participating.
On the first day of class in January 2004, upper-level undergraduate students majoring in accounting at a large public university were asked to complete a questionnaire surveying their opinions about Federal income taxes. The students were enrolled in one of three introductory tax classes. Of the 121 completed surveys, none of the students had previously taken a tax class, the average self-reported GPA was 3.36, and 24 percent of the respondents were female.
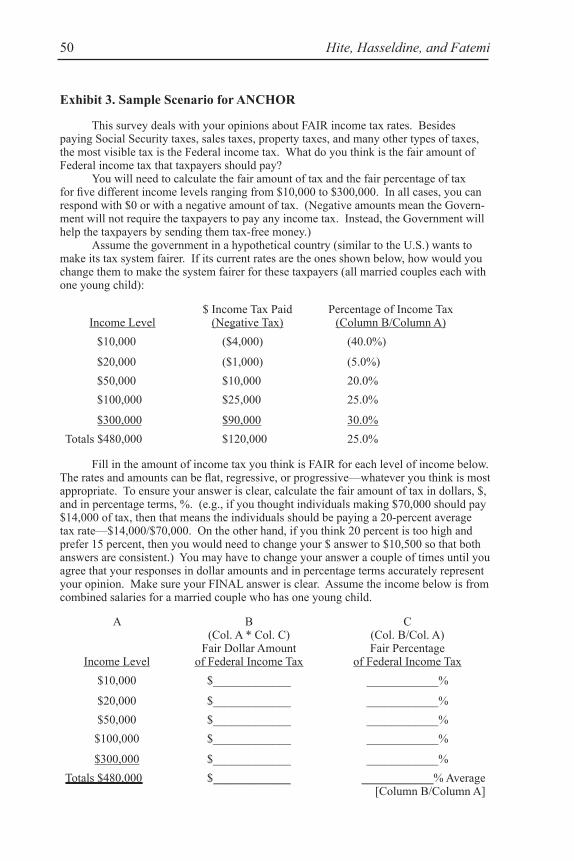
TaskStudents were asked to provide fair tax assessments for a hypothetical set of five taxpayers with incomes of $10,000, $20,000, $50,000, $100,000, and $300,000. The students were randomly assigned into one of four groups, and differences among groups on their fair tax assessments were examined. The first group was not given any additional information but was merely asked to report what tax liabilities would be fair for each income level. The second, third, and fourth groups were first asked to report what tax liabilities they thought current tax law requires a married couple with one dependent child to pay for each level of income (Exhibit 2). A priori beliefs about current tax assessments are used as covariates in the subsequent ANCO-VAS. After responding to the perception about current tax assessments, the third group was given actual 2003 status quo assessments (Exhibit 1), and the fourth group was given a hypothetical set of tax assessments (Exhibit 3). These three groups then provided fair tax assessments for each level of income.
As noted earlier, prior research has shown that tax preferences ex-pressed as percentage tax rates are significantly higher than tax preferences expressed in dollar amounts (Hite and Roberts, 1991; McCaffery and Baron, 2003, 2004). McCaffery and Baron (2003) argue there is a progressivity illusion because using a dollar frame makes flat rates appear progressive. Roberts et al. (1994) suggest that taxpayers’ familiarity with concrete dol-
Hite, Hasseldine, and Fatemi32
lar amounts may increase the subjects’ comprehension, causing the dollar amounts to be the more correctly intended response. Furthermore, subjects are likely to recall the higher, marginal rates rather than the average tax rate on all of the income.2
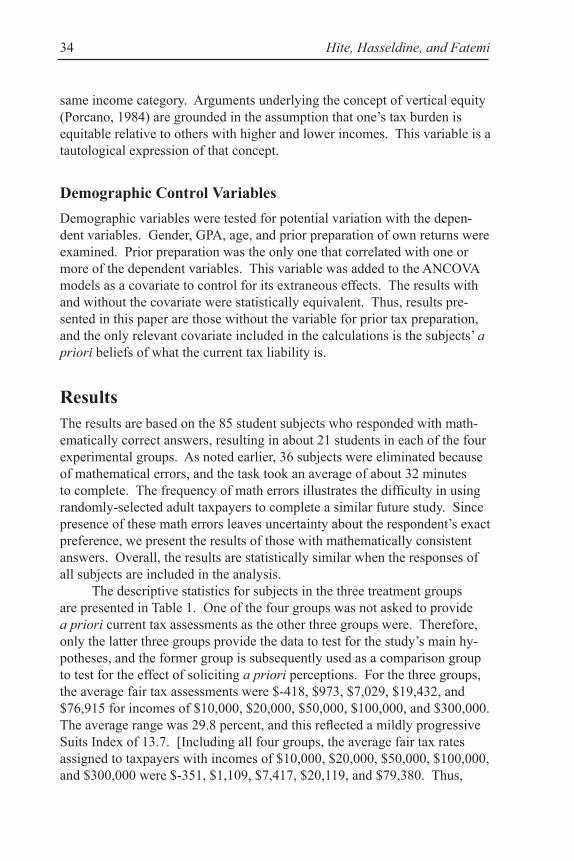
There is no evidence establishing which assessment, dollars or percent-ages, is more reliable. To increase the reliability of the responses, subjects in this study are asked to report their tax assessments in both dollars and percentage terms. Hence, progressivity illusion is minimized, and concrete comprehension is maximized. Although the reliability of the responses was enhanced, the mathematical difficulty was also increased. Even though the subjects were accounting majors armed with calculators, 24 out of 121 made mathematical errors in which the dollar response was not equivalent to the percentage response on the fair tax assessments, and another 12 made math-ematical errors when providing their perceptions of current tax assessments. Since those responses are ambiguous, the results presented in this paper are based on the remaining 85 respondents with mathematically correct respons-es.3 The frequency of mathematical errors on this task is consistent with the frequent math errors that IRS consistently reports as a common error on tax returns. In addition, some of the error rate may be driven by the diffi-culty respondents have when they try to reconcile tax rate preferences with opinions about what the dollar liability should be. This supports the notion that studies on progressivity preferences should measure those preferences in both dollars and percentages. This would, however, be a difficult task for the average taxpayer in a behavioral study.
Independent VariablesThe experiment used STATUS QUO tax assessments as the manipulated variable for group 3 and ANCHOR, a set of hypothetical tax liabilities, for group 4. STATUS QUO is coded as “0” for the scenario that did not mention what actual tax assessments would have been assessed by the IRS in 2003 for the given set of hypothetical incomes. It is coded as “1” for the scenario that did present that information. Similarly, ANCHOR is coded as “1” when the hypothetical information is provided to the subjects and “0” when it is not.
2 In 2004, the average Federal income tax rate for all taxpayers was 12.1 percent; it was 15.2 percent in 2001 and 13.7 percent in 1989 (http://www.irs.gov/pub/irs-soi/04in06tr.xls).3 The significant outcomes for STATUS QUO presented in Table 2 are essentially equivalent when the mathemati-cally incorrect responses are included.
Tax Rate Preferences 33
Dependent VariablesFindings from prior research reporting taxpayer preferences for moder-ately progressive tax structures are based either on average tax assessments for hypothetical incomes or on rating alternative sets of nominal tax rate structures. The present study used multiple measures for multiple facets of progressivity. The STATUS QUO effect and the ANCHOR effect were examined on several attributes of progressivity: Suits Index, lowest income bracket, highest income bracket, range of tax rates, and relative tax burden for various income levels.
The first dependent variable is the Suits Index. The index provides a parsimonious measure capturing the overall steepness of a set of tax as-sessments to the respective set of taxpayer incomes (Suits, 1977; Hite and Roberts, 1991). Since this outcome variable is for the student subjects, it is not intended to represent public opinion about the exact level of desired pro-gressivity; it is merely a well-established summary statistic to measure the resulting difference in progressivity for varying context frames. The second aspect of progressivity is the tax assessment preference for a low-income bracket of $10,000 for a married couple’s household. McCaffery and Baron (2003, 2004) assert that taxpayers are averse to assessing negative taxes, or Government supplements via the income tax system, although Porcano (1984) found some evidence of support for negative taxes.
The third dependent variable measures the average tax assigned to a household income of $300,000, the highest income bracket. Under 2006 tax law, taxable income over $336,550 was taxed at a marginal rate of 35 percent, but the average rate would be less than 28 percent for a married couple who does not itemize and who has one young child. Many taxpay-ers may judge progressivity by the highest marginal tax rate, because they agree that higher rates for higher incomes are appropriate. Nonetheless, most agree that a maximum fair rate exists. It is quite plausible that taxpay-ers assume progressivity is synonymous with high marginal rates, i.e., that a tax system with a 60-percent top rate is more progressive than a system with a 40-percent top rate. That is not necessarily true; yet the maximum tax rate is a visible attribute that could readily affect taxpayer perceptions about fair tax rates.
Another dependent variable is the range of tax rates that each re-spondent assesses. The minimum rate (tax on $10,000) is subtracted from the maximum rate (tax on a $300,000 household). Lastly, the relative tax burden for each income group is examined. This dependent variable is calculated by dividing the percentage of total taxes assessed for a specific income group relative to the percentage of total income received by that
Hite, Hasseldine, and Fatemi34
same income category. Arguments underlying the concept of vertical equity (Porcano, 1984) are grounded in the assumption that one’s tax burden is equitable relative to others with higher and lower incomes. This variable is a tautological expression of that concept.
Demographic Control VariablesDemographic variables were tested for potential variation with the depen-dent variables. Gender, GPA, age, and prior preparation of own returns were examined. Prior preparation was the only one that correlated with one or more of the dependent variables. This variable was added to the ANCOVA models as a covariate to control for its extraneous effects. The results with and without the covariate were statistically equivalent. Thus, results pre-sented in this paper are those without the variable for prior tax preparation, and the only relevant covariate included in the calculations is the subjects’ a priori beliefs of what the current tax liability is.
ResultsThe results are based on the 85 student subjects who responded with math-ematically correct answers, resulting in about 21 students in each of the four experimental groups. As noted earlier, 36 subjects were eliminated because of mathematical errors, and the task took an average of about 32 minutes to complete. The frequency of math errors illustrates the difficulty in using randomly-selected adult taxpayers to complete a similar future study. Since presence of these math errors leaves uncertainty about the respondent’s exact preference, we present the results of those with mathematically consistent answers. Overall, the results are statistically similar when the responses of all subjects are included in the analysis.
The descriptive statistics for subjects in the three treatment groups are presented in Table 1. One of the four groups was not asked to provide a priori current tax assessments as the other three groups were. Therefore, only the latter three groups provide the data to test for the study’s main hy-potheses, and the former group is subsequently used as a comparison group to test for the effect of soliciting a priori perceptions. For the three groups, the average fair tax assessments were $-418, $973, $7,029, $19,432, and $76,915 for incomes of $10,000, $20,000, $50,000, $100,000, and $300,000. The average range was 29.8 percent, and this reflected a mildly progressive Suits Index of 13.7. [Including all four groups, the average fair tax rates assigned to taxpayers with incomes of $10,000, $20,000, $50,000, $100,000, and $300,000 were $-351, $1,109, $7,417, $20,119, and $79,380. Thus,
Tax Rate Preferences 35
the average range was 30 percent (from 26 percent to -4 percent). This is reflected in a mildly progressive Suits Index of .13.]
TABLE 1DESCRIPTIVE STATISTICS FOR DEPENDENT VARIABLES+
Dependent Mean (s.d.) ActualVariables Assessment N Mode STATUS QUOFair Tax on $10,000 $ -4181a 61 $ 0 $ -3,5471b
Fair Tax on $100,000 $ 19,4324a 61 $ 20,000 $10,3454b
( 6,935)
Fair Tax on $300,000 $ 76,9155a 61 $ 75,000 $76,5255a
(24,310)
Fair Range 29.81 61 0 61(24.71)
Fair Suits Index .137 61 0 33(.102)
Current Tax on $10,000 $ 6661c 61 $ 1,000 $ -3,547(1,583)
Current Tax on $20,000 $ 2,7072c 61 $ 3,000 $ -2,570(1,630)
Current Tax on $50,000 $ 10,1033c 61 $ 10,000 $ 3,003( 3,401)
Current Tax on $100,000 $ 27,1314c 61 $ 30,000 $10,345( 7,581)
Current Tax on $300,000 $ 97,4265c 61 $ 105,000 $76,525(24,915 )
+Paired t-test indicated that 1-5a, b, and c differ significantly from each other, as did all income levels except at$300,000.~
~
Expressed in percentage terms, the average fair tax for incomes of $10,000, $20,000, $50,000, $100,000,and $300,000 are respectively -4 percent, 5 percent, 14 percent, 19 percent, and 26 percent. For averageperception of current taxes, the respective rates are 7 percent, 14 percent, 20 percent, 27 percent, and32 percent.
Hite, Hasseldine, and Fatemi36
Suits Index. Hite and Roberts (1991) report that taxpayer preferences in the spring of 1989 reflected an average Suits Index of .18, which corre-sponded to their calculation of a .22 index on 1987 SOI data. This suggests that the tax system in the late 1980s was mildly progressive and was con-sistent with taxpayer preferences at the time. In the present study, the Suits Index on the 2003 tax assessments for five different married couples (each with one young child), as presented in Exhibit 1 and used in the experiment as the STATUS QUO, is .33. This Suits Index is more progressive than the Hite and Roberts (1991) results and the 1987 SOI results. Higher progres-sivity under current law is largely a function of the negative tax assessed to households with $10,000 and $20,000 incomes who qualify for the earned income credit and the child tax credit. SOI tables report that nearly half of the data for low-income categories include tax returns filed by dependent taxpayers who do not qualify for such credits. Thus, data from SOI tables appear less progressive than they actually are, because child and earned income credits are not apparent in the composite data.
The overall assessed taxes, as provided by subjects in the present study, resulted in a .137 Suits Index, suggesting preferences for a much more moderate tax rate system. The focus in this study is not on the actual index but on whether that index (representing a summary statistic for relative ex-tent of progressivity) varies when respondents are informed about actual tax assessments. Based on a pairwise comparison of the control group who did not get the information (mean Suits Index of .09) and the status quo group (mean .21), the latter index differed significantly (F = 25.07, p < .001, shown in Table 2, Panel A). Thus, the data support Hypothesis 1. Subjects receiv-ing the status quo data tended to assess a more progressive system, albeit still mildly progressive.
Range of Tax Rates. Taxpayer preferences for tax rates may be influ-enced by statutory tax rates printed in the annual tax instruction booklet and publicized in the media (e.g., 2003 rates are 10 percent, 15 percent, 25 percent, 28 percent, 33 percent, and 35 percent). These differ greatly from average tax rates. The highly visible statutory rates reflect a range of 25 per-cent (35-percent maximum less a 10-percent minimum rate, when a rate is assessed). In reality, many low-income taxpayers have a negative tax, mak-ing the range much larger. In contrast, for average rates based on the current assessed tax liabilities (shown in Exhibit 1) the range was 61 percent (25.5 percent to -35.5 percent). Panel B of Table 2 shows that Hypothesis 1 is sup-ported, as the range was significantly higher for the STATUS QUO group than for the control group (relative means of 43 and 19, F = 17.40, p < .001). If taxpayers assume that a larger range represents a more progressive tax, then range can provide a simple proxy for desired progressivity measures.
Tax Rate Preferences 37
TABLE 2ANOVA RESULTS FOR ACTUAL STATUS QUO
MANIPULATION ON PROGRESSIVITY WHILE CONTROLLINGFOR A PRIORI PERCEPTIONS
Means S.D. N F-testsPanel A:Suits Index Control .086 .059 24
*p < .05, **p < .01, ***p< .001 based on ANOVAS for STATUS QUO.a The covariate is each subject’s a priori perception of tax liability.b Relative tax burden is percentage of tax assessed divided by percentage of income received which is aconstant for each income category. Consequently, the F-test for significance is the same whether thedependent variable is percentage of tax or relative tax burden.
Relative Tax Burden (RTB). The share of taxes that should be borne by a specific income group is often influenced by the share of total income received by that group. Using 2003 tax liabilities as shown in Exhibit 1, the share of taxes computed for each level of income are -4.2 percent, -3.1 percent, 3.6 percent, 12.4 percent, and 91.3 percent. When percentage share of taxes is divided by respective percentage share of income (2.1 percent, 4.2 percent, 10.4 percent, 20.8 percent, and 62.5 percent), the respective RTBs calculated for the experimental scenario are -2.0 percent, -.74 percent, .35 percent, .60 percent, and 1.46 percent. As a result of the 2003 increased child credit, reduced tax rates, and increased deductions for a married couple, the relative tax burdens on the low-income group were greatly decreased. This relative decrease, of course, is mirrored by the significant increase on the highest income group.
Hite, Hasseldine, and Fatemi38
The STATUS QUO group had significantly lower RTBs at the $10,000, $20,000, $50,000, and $100,000 levels, and a significantly higher RTB at the $300,000 level (p < .001). Panel C of Table 2 shows the RTBs for the STATUS QUO and comparison group (respectively, -.84, -.21, .47, .82, and 1.29 versus .27, .54, .75, .94, and 1.12). The latter RTBs for those without the actual 2003 tax liabilities had the following percentage share of tax al-locations by respective level of income: .6 percent, 2.2 percent, 7.8 percent, 19.6 percent, and 69.8 percent. These tax allocations are consistent with the taxpayer responses in Hite and Roberts (1991) which were 1 percent, 3 per-cent, 9 percent, 16 percent, and 71 percent. In contrast, the tax allocations by income level for the STATUS QUO group were -1.7 percent, -.9 percent, 4.9 percent, 17.1 percent, and 80.6 percent, which reflects a significantly higher tax allocation for the high-income level because of low allocations for the low-income levels.
Average Tax on $10,000. After running a series of experiments on the Internet, McCaffery and Baron (2003, 2004) concluded that subjects are unwilling to assess a negative tax on low-income taxpayers. The present study further tests that assertion by giving subjects information on negative taxes under current law. Status quo information is expected to increase the respondents’ likelihood of giving a negative tax assessment. The STATUS QUO effect was separately examined for just the low-income scenario. Panel A of Table 3 shows that the mean tax reported by the STATUS QUO group was a negative tax of ($1,626), and the mean tax for the control group was $527 at the $10,000-income level. The significant difference (F = 21.85, p <.001) reflects the test of a comparison between the STATUS QUO group and the control group that included a priori perceptions of tax liability on $10,000 as a covariate. (The effect of the a priori perception is discussed later in the paper.) Thus, the likelihood of a negative tax is much greater for the STATUS QUO group. Knowing that current law provides a negative tax for low-income taxpayers resulted in the assessment of fair tax liabili-ties that tended to be negative, supporting the primary hypothesis. This increased tendency to assess a negative tax, when current tax liabilities are known, explains the wider, significant range of rates reported for the status quo group.
Average tax on $300,000. Taxpayers may prefer a progressive tax system, but they may also believe in a maximum income tax rate that any taxpayer should have to pay. After all, Wildavsky (1996) found that respon-dents nationwide believed that a taxpayer family of four with a $200,000 in-come should not pay more than a combined total of 25 percent for all types of taxes. The present study examined the status quo effect of actual tax law assessments on preferences for a maximum tax rate. The STATUS QUO
Tax Rate Preferences 39
TABLE 3ANCOVA RESULTS FOR STATUS QUO MANIPULATION FORSPECIFIC INCOMES WHILE CONTROLLING FOR A PRIORI
Status Quo $ -1,626 $2,162 21Overall $ -478 $1,950 45
Covariate 2.22Main Effect 21.85***
Panel B: $20,000(AR2=.41) Control $ 2,204 $1,675 24
Status Quo $ -780 $2,618 21Overall $ 812 $2,611 45
Covariate 7.83**Main Effect 29.02***
Panel C: $50,000(AR2=.33) Control $ 7,927 $3,439 24
Status Quo $ 5,048 $4,373 21Overall $ 6,584 $4,121 45
Covariate 15.47***Main Effect 10.27**
Panel D: $100,000(AR2=.26) Control $20,146 $7,136 24
Status Quo $17,278 $6,971 21Overall $18,808 $4,127 45
Covariate 14.93***Main Effect 3.42*
Panel E: $300,000(AR2=.12) Control $72,438 $25,261 24
Status Quo $80,920 $23,186 21Overall $76,396 $24,418 45
Covariate 6.51**Main Effect .91
*p < .10, **p < .01, ***p< .001 based on ANOVAS for STATUS QUO.
effect was significant at all income levels in this study except for the $300,000 level (F = .91, p > .05). The means as shown in Panel E of Table 3 were $72,438 for the control group and $80,920 for the STATUS QUO group compared to the actual 2003 tax liability of $76,525. The lack of dif-ference at the $300,000 level is consistent with the Wildavsky study (1996) asserting that taxpayers nationwide were in agreement that the maximum average tax rate for upper-income taxpayers should be around 25 percent. Hence, the first hypothesis is not supported at the highest income level. The overall average tax rate of 26 percent appears to represent a consensus for these student subjects, which is not unlike the 25 percent reported by Wil-davsky (1996).
Hite, Hasseldine, and Fatemi40
Status Quo PerceptionsTo demonstrate the effect of current perceptions on fair tax assessments, ANCOVAS were computed for each level of income. Perceived current tax liability was used as a covariate to control for a priori perceptions of what current law requires, while simultaneously testing for the strong status quo treatment effect (see Exhibit 2). Table 3 shows that the covariate for a priori perceptions significantly affected the fair tax assessments. Those who perceived current taxes as high tended to assess higher “fair” tax liabilities than did those who perceived current taxes as relatively lower. This finding suggests that subjects’ reports of fair tax assessments are affected by their own perceptions of the status quo. Consequently, it could be inferred that subjects should be made aware of actual current tax assessments so that any misperceptions about current tax liabilities could be mitigated.
The STATUS QUO group was asked to report a priori perceptions prior to receiving actual 2003 tax liabilities. Table 3 shows that status quo manipulation and a priori perception were significantly associated with the fair tax assessment on $20,000, $50,000 and $100,000. At the $10,000 level, status quo manipulation dominated the a priori effect. Subjects were more willing to abandon their prior perceptions and accept current policies of negative taxes for the lowest income level. However, at the $300,000 level, the STATUS QUO treatment was not significant, but the a priori perception about current tax liability on $300,000 was significant, which supports the second hypothesis and emphasizes the strength of those perceptions.
A test of the adjusted R2 indicated that adding a priori perceptions at the $20,000, $50,000, and $100,000 levels significantly increased (p<.01) the explanatory power of the models over and beyond what the status quo main effect contributed. At the $20,000 level, the adjusted R2 increased to .41 from .29, to .33 from .18 at $50,000, and to .26 from .14 at $100,000. At $300,000, status quo manipulation was not significant, and all of the ex-planatory power was driven by the a priori perception (AR2=.12). The only response not significantly affected by a priori perception was at the $10,000 level where the results were only attributable to the status quo manipulation.
The acceptability of those a priori perceptions was examined by calculating paired t-tests at each level of income for subjects’ current tax as-sessments compared to their fair tax assessments. Table 1 shows the means for the fair tax assessments and a priori current tax perceptions at all five in-come levels for the combined three groups who were asked to provide the a priori perceptions. Perceived current tax liabilities were significantly higher than fair tax assessments at every income level (p < .001). The respective means at $10,000, $20,000, $50,000, $100,000, and $300,000 for percep-
Tax Rate Preferences 41
tions of current assessments were $666, $2,707, $10,103, $27,131, and $97,426 and were ($418), $973, $7,029, $19,432, and $76,915 for reported fair assessments. Subjects apparently believed current tax liabilities are too high.
In order to analyze the effect of soliciting perceptions of current tax liabilities, a fourth group was asked to report fair tax assessments without being asked about current tax perceptions. This group was compared to the group who reported current and fair tax assessments without a confounding status quo or anchor manipulation. The fair tax assessments were not signif-icantly different at any of the five levels of income (p<.05). The implication is that the subjects’ ultimate decision about fair taxes is affected by a priori perceptions even when those perceptions are not explicitly solicited.
Next, paired t-tests were calculated to compare the correctness of current perceptions to actual tax liabilities as shown in the STATUS QUO manipulation (also shown in Table 1). Current perceptions at every income level exceeded the STATUS QUO liabilities (p < .001). In addition, paired t-tests were calculated to examine whether fair tax assessments significantly differed from actual 2003 tax liabilities as shown in the STATUS QUO scenario. At the $10,000, $20,000, $50,000, and $100,000 levels, fair tax assessments were significantly higher than the 2003 actual tax liabilities (p < .001). However, at $300,000, fair tax liabilities did not significantly differ from actual 2003 assessments. In sum, perceptions of current tax liabilities were higher than fair tax assessments, and fair tax assessments were higher (except for the $300,000 income) than actual 2003 tax assessments.
Anchoring EffectGiven the significant STATUS QUO effects reported in Tables 2 and 3, a possibility exists that the manipulation was significant because of its initial anchoring position rather than the knowledge-value inherent in the data. To test solely the anchoring position, a set of hypothetical tax liabilities for the five income levels was created (see Exhibit 3). One group of subjects received the hypothetical data, while the control group did not. Table 4 presents the results of comparing the ANCHOR group against the control group with a priori tax liability perceptions as the covariate. At every level of income, no significant difference was found for the ANCHOR effect (p > .10). Consequently, the anchor effect was insignificant on Suits, range, and RTBs (except at RTB for $10,000, p = .047). Hence, the third hypothesis is not supported. Merely suggesting possible tax rates was not sufficient to influence preferences, but factual knowledge about current assessments was significantly influential.
Hite, Hasseldine, and Fatemi42
TABLE 4ANCOVA RESULTS FOR ANCHOR MANIPULATION
WHILE CONTROLLING FOR A PRIORI PERCEPTIONSMeans S.D. N F-Value
Discussion and ConclusionsThe results from research on rate preferences are somewhat problematic in that tax rate preferences are typically based only on the average rates. The present study reports several measures of progressivity to better understand what aspect of progressivity is driving the responses. In addition, prior
Tax Rate Preferences 43
research on taxpayer preferences for progressivity has reported either group averages for tax rates, group averages for dollar assessments, or frequency of preferences for qualitative comparisons of different sets of tax rates. The research concludes that taxpayers prefer moderately progressive tax systems. No prior study, however, has specifically emphasized the preferred rate on very low incomes, the preferred rate on very high incomes, or the range of tax rates as dependent variables. When examining preferences on progres-sivity, it is important to look at a variety of measures, because the extent of progressivity is not perfectly correlated with the range of tax rates or the highest marginal tax rate. Nonetheless, those are most likely the features that are salient to respondents. Furthermore, progressivity can be altered in a variety of ways. For example, it can be lessened by reducing only the top marginal rates or by reducing the rate of acceleration between all income brackets. It can be increased by raising not only the nominal rates at the up-per end but by accelerating the negative tax for low-income taxpayers. Addi-tionally, changes in progressivity can be more subtle. Reduced dividend and capital gain tax rates decrease progressivity, while restricted deductions and limited credits for upper-income taxpayers effectively increase progressivity.
This study examines the effect of knowing what current tax assess-ments are. Because perceptions of progressivity, can be captured by a variety of measures, we report the effects of STATUS QUO on the follow-ing measures: Suits Index, relative tax burden, assessed tax for low-income taxpayers, assessed tax for high-income taxpayers, and range between lowest and highest tax rates.
The results indicate that, when subjects with information about current tax liabilities are compared to subjects without that information, informed subjects tend to assess lower overall taxes, lower taxes for low-income tax-payers, a higher range of taxes, and steeper progressivity as measured by the Suits Index and relative tax burden. Even so, while status quo tax assess-ments lead to lower tax preferences compared to subjects without status quo information, those tax assessments are still significantly higher than the ac-tual status quo information. The implication is that average Federal income tax liabilities under current law may be much lower than most taxpayers realize, since media coverage highlights marginal tax rates, not average tax rates. If true, then knowledge of actual assessments may improve taxpayer perceptions of the fairness of current tax rates. Our data suggest this is true. Not only did fair tax assessments exceed 2003 tax data, but subjects’ percep-tions of current tax liabilities were significantly higher than their fair tax assessments.
Another important result is how similar the subjects’ allocations of tax burden are to the tax burden allocations reported by Hite and Roberts
Hite, Hasseldine, and Fatemi44
(1991) using a nationwide sample of taxpayers. This was especially true for subjects who did not receive any status quo information.
We also tested for the influence of a priori perceptions regarding tax liabilities, and the results strongly support a bias driven by a priori percep-tions. Although subjects indicated that perceived current tax liabilities were higher than fair assessments should be, those with higher current tax percep-tions tended to assess higher fair tax assessments. Thus, it appears responses from subjects providing fair tax assessments are influenced by their a priori perceptions of what current law requires. The implication is that researchers and policymakers wanting to solicit taxpayer rate preferences should control for these a priori beliefs. Furthermore, if subjects are influenced by misper-ceptions of what current tax liabilities are, then subjects should be informed about factual data on current tax liabilities to mitigate the a priori perception bias.
Another significant finding in this study is that the STATUS QUO manipulation, providing actual tax liabilities, was not solely due to its an-choring position. When we presented subjects with a hypothetical set of tax liabilities, they were not significantly influenced by those data. In contrast, presentation of the actual tax data was quite significant. Hence, the results of this study tend to support prior research (Wartick, 1994; Roberts, 1994) that cognitive information could significantly improve taxpayer attitudes toward the tax system.
The lack of an anchoring effect could be a function of the tax rates chosen for the anchor treatment. Clearly, a wide variety of alternative tax assessments could be tested by future research. McCaffery and Baron (2004) used hypothetical tax systems as a comparison data set, and their sub-jects were affected by the initial anchor which they labeled as a status quo effect. Our study could have described the anchor treatment as actual rates rather than hypothetical, but that would have been a deceptive manipulation.
A limitation of this study is that it only examined the tax liabilities for married couples with one dependent child. Using actual tax information results in a lower tax liability for a married couple with one child than using a single taxpayer without a child. Prior research has found that taxpayers believe tax liabilities should not differ by marital status, but taxes should be lower when there are dependent children (Hulse and Wartick, 1998; Chris-tensen et al., 2000).
Another limitation of this study is whether providing the actual STATUS QUO “biased” the ultimate responses. Knowing what current tax assessments are may have led to more precise, knowledgeable responses, or it may have led to biased responses that mimic assessments that are required under current tax law, under the presumption that current law is merely a
Tax Rate Preferences 45
familiar option. Among the actual responses, however, only one subject re-peated the exact status quo responses, and average preferences significantly differed from the actual 2003 data that were provided.
Given that the subjects’ a priori beliefs influenced their responses, future research should consider controlling for potential misperceptions by measuring those a priori perceptions, as well as providing informative fac-tual data. Furthermore, the methodology used in this study should be tested on a representative random sample of adult taxpayers. Although many of the results in this study are consistent with taxpayer preferences reported in other studies, student subjects have not had any substantial experience with filing tax returns. Thus, if possible, future researchers may want to test these findings on an adult, taxpaying, representative random sample. However, research should give careful attention to the length and difficulty of getting mathematically correct responses, given that tax agencies frequently report mathematical error as one of the most common errors that taxpayers make.
Future research should also examine what the precise measure for progressivity preferences should be. The Suits Index for example has been heavily utilized in the debate on progressivity, but that measure can be af-fected by a variety of intrinsic data (e.g., the lowest tax rate, the highest tax rate, and the number of taxpayers in each bracket). Moreover, it is unlikely that taxpayers would have strong preferences for that measure, as most would not understand it. In contrast, taxpayers probably do have opinions about a minimum tax rate, a maximum tax rate, and relative burdens among people with different taxpaying abilities.
References
Alm, James; Betty Jackson; and Michael McKee, “Estimating the Determinants of Taxpayer Compliance with Experimental Data,” National Tax Journal 45, No. 1 (March 1992), pp. 107-114.
Ashton, Robert H., and Sandra S. Kramer (1980), “Students as Sur-rogates in Behavioral Accounting Research: Some Evidence,” Journal of Accounting Research 18, No. 1, pp. 1-15.
Blum, William J., and H. Kalven, Jr. (1953), The Uneasy Case for Pro-gressive Taxation, The University of Chicago Press, Chicago.
Christensen, Anne L.; Peggy A. Hite; and Michael L. Roberts (2000), “An Experimental Study of the Effects of Marital Status and Family Size on Tax, Fairness Judgments,” Advances in Taxation 12, pp. 51-76.
Hite, Hasseldine, and Fatemi46
Gerbing, Monica (1988), An Empirical Study of Taxpayer Perceptions of Fairness, unpublished dissertation, University of Texas-Austin.
Hite, Peggy A., and Michael L. Roberts, “An Experimental Investigation of Taxpayer Judgments on Rate Structure in the Individual Income Tax System,” Journal of American Taxation Association 13, No. 2 (Fall 1991), pp. 47-63.
and (1992), “An Analysis of Tax Reform Based on Taxpayers’ Perceptions of Fairness and Self-interest,” Advances in Taxation 4, pp. 115-138.
Hulse, David, and Martha Wartick (1998), “An Experimental Study of Taxpayer Preferences Regarding the Taxation of Married Couples,” Advances in Taxation 10, pp. 167-188.
Internal Revenue Service Oversight Board (IRSOB) (2004), IRS Oversight Board Annual Report 2004, U.S. Government Printing Office, Washington, DC.
Kahneman, Daniel; J.L. Knetsch; and Richard H. Thaler, “Fairness as a Constraint on Profit Seeking: Entitlements in the Market,” The American Economic Review 76, No. 4 (September 1986), pp. 728-741.
Krishna, A., and Joel Slemrod (2003), “Behavioral Public Finance: Tax Design as Price Presentation,” International Tax and Public Finance 10, No. 2, pp. 189-203.
Keene, K., “What Do We Know About the Public’s Attitude on Progres-sivity?” National Tax Journal 36, No. 3 (September 1983), pp. 371-376.
McCaffery, Edward J., and Jonathon Baron (2004), “Framing and Taxa-tion: Evaluation of Tax Policies Involving Household Composi-tion,” Journal of Economic Psychology 25, No. 6, pp. 679-705.
and (2003), “The Humpty Dumpty Blues: Disag-gregation Bias in the Evaluation of Tax Systems,” Organizational Behavior and Human Decision Processes 91, No. 2, pp. 230-242.
Porcano, Thomas M., “Distributive Justice and Tax Policy,” The Ac-counting Review 59, No. 4 (October 1984), pp. 619-636.
Rawls, J. (1971), A Theory of Justice, Harvard University Press, Boston.
Tax Rate Preferences 47
Roberts, Michael; Peggy Hite; and Cassie Bradley, “Understanding At-titudes toward Progressive Taxation,” Public Opinion Quarterly 58 (Winter 1994), pp. 67-86.
, “An Experimental Approach To Changing Taxpayers At-titudes toward Fairness and Compliance Via Television,” The Journal of American Taxation Association 16, No. 1 (Spring 1994), pp. 67-86.
Samuelson, W., and R. Zeckhauser (1988), “Status Quo Bias in Decision Making,” Journal of Risk and Uncertainty, pp. 7-59.
Schelling, Thomas (1981), “Economic Reasoning and the Ethics of Policy,” Public Interest 63, pp. 37-61.
Shefrin, H.M., and Richard H. Thaler, “The Behavioral Life-Cycle Hypotheses,” Economic Inquiry 26 (October 1988), pp. 609-643.
Slemrod, Joel, “Do We Know How Progressive the Income Tax System Should Be?” National Tax Journal 36, No. 3 (September 1983), pp. 361-369.
Suits, D.B., “Measurement of Tax Progressivity,” The American Eco-nomic Review 67, (September 1977), pp. 747-752.
Walster, E.; E. Bershceid; and G. Walster, “New Directions in Equity Research,” Journal of Personality and Social Psychology (Febru-ary 1973), pp. 151-176.
Wartick, Martha L., “Legislative Justification and the Perceived Fairness of Tax Law Changes: A Referent Cognitions Theory Approach,” The Journal of the American Taxation Association 16, No. 2 (Fall 1994), pp. 106-123.
Webley, Paul; H.S.J. Robben; Hank Elffers; and D. Hessing (1991), Tax Evasion: An Experimental Approach, Cambridge University Press, Cambridge, United Kingdom.
Wildavsky, Richard, How Fair Are Taxes?” Reader’s Digest (February 1996), pp. 57-61.
Hite, Hasseldine, and Fatemi48
Exhibit 1. Sample Scenario for 2003 STATUS QUO
This survey deals with your opinions about FAIR income tax rates. Besides paying Social Security taxes, sales taxes, property taxes, and many other types of taxes, the most visible tax is the Federal income tax. What do you think is the fair amount of Federal income tax that taxpayers should pay?
You will need to calculate the fair amount of tax and the fair percentage of tax for five different income levels ranging from $10,000 to $300,000. In all cases, you can respond with $0 or with a negative amount of tax. (Negative amounts mean the Govern-ment will not require the taxpayers to pay any income tax. Instead, the Government will help the taxpayers by sending them tax-free money.)
Just so you know, the 2003 Federal income tax net liability or negative tax for a married couple with one young child is as follows:
Fill in the amount of income tax you think is FAIR for each level of income below.
The rates and amounts can be flat, regressive, or progressive—whatever you think is most appropriate. To ensure your answer is clear, calculate the fair amount of tax in dollars, $, and in percentage terms, %. (e.g., if you thought individuals making $70,000 should pay $14,000 of tax, then that means the individuals should be paying a 20-percent average tax rate—$14,000/$70,000. On the other hand, if you think 20 percent is too high and prefer 15 percent, then you would need to change your $ answer to $10,500 so that both answers are consistent.) You may have to change your answer a couple of times until you agree that your responses in dollar amounts and in percentage terms accurately represent your opinion. Make sure your FINAL answer is clear. Assume the income below is from combined salaries for a married couple who has one young child.
A
Income Level
B(Col. A * Col. C)
Fair Dollar Amountof Federal Income Tax
C(Col. B/Col. A)Fair Percentage
of Federal Income Tax$10,000 $_____________ ____________%
$300,000 $_____________ ____________%Totals $480,000 $_____________ ____________% Average
[Column B/Column A]
Tax Rate Preferences 49
Exhibit 2. Sample Scenario for Current Perceptions
[Prior to responding to Exhibit 2 for the actual STATUS QUO group or Exhibit 3 for the ANCHOR group, subjects in those groups as well as the control group were asked to report what they believe tax liabilities currently are. The following excerpt was presented to the subjects:]
Fill in the amount of tax currently being paid for each level of income below. To ensure your answer is clear, calculate the amount of tax in dollars, $, and in percentage terms, %. (e.g., if you thought individuals making $70,000 pay $14,000 of tax, then that means the individuals are paying a 20-percent average tax rate—$14,000/$70,000. On the other hand, if you think 20 percent is too high and you think they are paying around 15 percent, then you would need to change your dollar answer to $10,500, so that both answers are consistent.) Make sure your final answer is clear. Assume the income below is from combined salaries for a married couple who has one young child.
$300,000 $_____________ ____________%Totals $480,000 $_____________ ____________% Average
[Column B/Column A]
Hite, Hasseldine, and Fatemi50
Exhibit 3. Sample Scenario for ANCHOR
This survey deals with your opinions about FAIR income tax rates. Besides paying Social Security taxes, sales taxes, property taxes, and many other types of taxes, the most visible tax is the Federal income tax. What do you think is the fair amount of Federal income tax that taxpayers should pay?
You will need to calculate the fair amount of tax and the fair percentage of tax for five different income levels ranging from $10,000 to $300,000. In all cases, you can respond with $0 or with a negative amount of tax. (Negative amounts mean the Govern-ment will not require the taxpayers to pay any income tax. Instead, the Government will help the taxpayers by sending them tax-free money.)
Assume the government in a hypothetical country (similar to the U.S.) wants to make its tax system fairer. If its current rates are the ones shown below, how would you change them to make the system fairer for these taxpayers (all married couples each with one young child):
Fill in the amount of income tax you think is FAIR for each level of income below. The rates and amounts can be flat, regressive, or progressive—whatever you think is most appropriate. To ensure your answer is clear, calculate the fair amount of tax in dollars, $, and in percentage terms, %. (e.g., if you thought individuals making $70,000 should pay $14,000 of tax, then that means the individuals should be paying a 20-percent average tax rate—$14,000/$70,000. On the other hand, if you think 20 percent is too high and prefer 15 percent, then you would need to change your $ answer to $10,500 so that both answers are consistent.) You may have to change your answer a couple of times until you agree that your responses in dollar amounts and in percentage terms accurately represent your opinion. Make sure your FINAL answer is clear. Assume the income below is from combined salaries for a married couple who has one young child.
A
Income Level
B(Col. A * Col. C)
Fair Dollar Amountof Federal Income Tax
C(Col. B/Col. A)Fair Percentage
of Federal Income Tax$10,000 $_____________ ____________%
$300,000 $_____________ ____________%Totals $480,000 $_____________ ____________% Average
[Column B/Column A]
Charitable Contributions in a Voluntary Compliance Income Tax
System: Itemized Deductions versus Matching Subsidies
Alex Turk and Maryamm Muzikir, Internal Revenue Service; Marsha Blumenthal, University of St. Thomas; and
Laura Kalambokidis, University of Minnesota
T he U.S. income tax system subsidizes contributions to charities by allowing individual taxpayers to itemize and deduct contributions from taxable income. In effect, taxpayers can receive a rebate from
the Government based on the contributions they make to charitable organiza-tions. There are normative reasons for subsidizing contributions. This paper explores how, rather than why, the U.S. Tax Code subsidizes contributions.
The current U.S. tax system relies on voluntary reporting of individual taxpayers’ contributions to charitable organizations. For many taxpayers, the charitable contributions are the only items on the return that are not subject to information reporting. Thus, there is potential for misreporting (both overstating and understating) the actual amounts of contributions. The ability of tax administrators to discourage misreporting is limited by two realities. First, while misreporting in the aggregate may be substantial, the average misstatement is fairly small. Second, current rules regarding the deductibility of charitable contributions already impose some burden on individual taxpayers, and ramping up documentation requirements might ac-tually discourage bona fide contributions. One alternative way to subsidize charitable contributions through the Tax Code would be to adopt a matching system. In such a system, the contributions of individual taxpayers would be matched (at some rate between 0 percent and 100 percent) by the Govern-ment. For example, if the matching rate were 50 percent, a $10 contribution from an individual would be matched by a $5 Government subsidy. Under a matching regime, the responsibility for reporting could be placed on either the donor or the recipient. If the responsibility for reporting contributions were moved from individual donors to the recipient organizations, the com-pliance burden faced by individual taxpayers would decline, along with their opportunities to misreport. On the other hand, the annual compliance burden of tax-exempt organizations would increase, as Form 990 would require ad-ditional information and documentation.
Previous laboratory economic experiments (most notably those of Eckel and Grossman) have shown that total contributions to charities are
Turk, Muzikir, Blumenthal, and Kalambokidis52
higher in a matching system, relative to one with tax-deductible contribu-tions, holding the price per dollar contributed constant. This contradicts the predictions of simple economic models that, all else equal, taxpayers would simply reduce their contributions by the amounts of the matching subsidy leaving unchanged total proceeds going to the charity. In this experimental literature, participants have not been allowed to misreport their contribu-tions. Once detection of noncompliance is imperfect, the effective subsidy rate becomes endogenous. In cases where the noncompliance is not detect-ed, the effective subsidy rate can be greater than 100 percent.
This paper explores the tax policy and tax administration implications of itemizing deductions versus matching subsidies of charitable contribu-tions. The comparison is in the context of a joint product public goods model in which individuals receive utility from total contributions to the public good and from a private good that is based on the amount of the indi-vidual’s charitable contribution. The paper proposes an experimental design to test the impact of matching rather than rebating contributions in a system with voluntary reporting of individual contributions. The design extends the previous literature in several directions. Previous experimental designs have explored voluntary compliance and charitable giving, but never in the same experiment. Our design will allow for misreporting and random auditing of contributions, with overstatements subject to a penalty.
Tax Policy Implications of Itemized Deduction versus Matching SubsidiesSubsidizing charitable contribution via an itemized deduction creates dif-fering subsidy rates (and hence prices of giving) based on the individual’s marginal tax rate. The marginal tax rate, in part, determines the subsidy or price of donating to charitable organizations for taxpayers who report con-tributions as an itemized deduction. In a progressive tax system, those with higher incomes will receive a higher subsidy rate for charitable contribu-tions. In addition, those who do not itemize receive no subsidy. This further creates a differing subsidy rate. For U.S. taxpayers, the decisions to itemize deductions versus taking the standard deduction are highly correlated with income and home ownership.
The differing subsidy rates for charitable contributions could be the desired result of the U.S. tax policy. It is more likely that it is an artifact of how the subsidy is administered. Charitable contributions could be subsi-dized at a uniform rate using a credit for or a match of contributions at some rate. However, those who do not itemize would need to report their contri-butions to receive the credit. Some have proposed extending the deduction
Charitable Contributions in a Voluntary Compliance Income Tax System 53
for charitable contributions to those who take the standard deduction. This would create additional burden for those taxpayers. A match scheme where the charitable organization reports the contributions could be used to equal-ize the subsidy rate and could potentially reduce the burden.
Tax Administration Implications of Itemized Deductions versus Matching SubsidiesThe work by Eckel and Grossman, among others, has motivated the interest in the subsidy method for charitable contributions and its impact on contri-butions to charitable organizations. There are also many tax administration issues around the subsidy framework. The primary issues are compliance and burden.
Data from IRS’s National Research Program for Tax Year 2001 are reported in Table 1 and Table 2. It seems clear that many taxpayers inac-curately report their charitable contributions. Of the roughly 43.6 million taxpayers who itemized their deductions, almost 37 million report cash con-tributions, and over 22 million taxpayers report noncash donations. Almost 46 percent of taxpayers who reported cash contributions and 37 percent of those who report noncash donations made errors. The aggregate amount of misreporting is fairly large. The net overstatement of cash contributions is around 13.6 billion dollars. The net misreported amount for noncash is around 3.8 billion dollars of overstated deductions.
Table 1. Frequency of Charitable Contributions Errors for Tax Year 2001 Using Raw NRP Data: All Returnsa
Returns that reported
(thousands)
Returns that should have
reported (thousands)
Returns with errorsb (thousands)
Errors as a percentage of returns
that should have
reported
Errors as a percentage of returns
that reported
Cash contributions 36,950 32,976 16,804 51% 45%
Noncash contributions 22,296 18,141 8,159 45% 37%
Carryover contributions from prior year 366 263 131 50% 36%a Includes all returns where the deductions were itemized on Schedule A, as well as those returns where the standard deduction was originally claimed but the deductions should have been itemized.b Returns with Errors exclude returns that had overstatements and understatements that exactly offset each other resulting in no net error. Source: National Research Program study of Tax Year 2001 individual income tax reporting compliance, tabulations of the raw data projected to the U.S. population, March 2007.
Turk, Muzikir, Blumenthal, and Kalambokidis54
While there they may be inaccuracies on a large portion of the returns, the average amount of error on each return is fairly small. For those taxpay-ers who made errors in reporting cash contributions, the average error was $811. For all returns that report noncash contributions, the average error was $369. The fact that errors are widespread but relatively small makes enforcement mechanisms unattractive alternatives for correcting the non-compliance. Other mechanisms that increase the visibility of the contribu-tions are likely to be more efficient and less burdensome methods of ensur-ing compliance.
Table 2. Magnitude of Charitable Contributions Errors for Tax Year 2001 Using Raw NRP Data: All Returnsa
Carryover contributions from prior year 10,230 9,323 888 6,791 2,427 9%a Includes all returns where the deductions were itemized on Schedule A, as well as those returns where the standard deduction was originally claimed but the deductions should have been itemized.b Net Misreported Amount excludes amounts that are reported correctly on the wrong line.c Net Misreported Amount divided by the sum of the absolute values of the amounts that should have been reported.Source: National Research Program study of Tax Year 2001 individual income tax reporting compliance, tabulations of the raw data projected to the U.S. population, March 2007.
Another factor to consider is the burden placed on individual taxpay-ers. Expanding information reporting on charitable contributions would make the transaction more visible and should improve compliance. How-ever, these requirements would undoubtedly increase the total burden placed on individuals and charitable organizations.
There are considerable documentation requirements for gifts of cash and other items, and the requirements are being ramped up. The IRS Indi-vidual Burden Model was used to simulate the burden under the scenario where charitable contributions are eliminated as an itemized deduction on Schedule A.1 The simulation analysis was done for Tax Year 2005 filings. The difference between the burden under this scenario and the baseline scenario can be interpreted as the burden associated with the charitable contribution deductions. Burden is classified and measured as both the time
1 This analysis was provided by the IRS Office of Research, Analysis, and Statistics.
Charitable Contributions in a Voluntary Compliance Income Tax System 55
burden (hours) and monetary burden (U.S. dollars.) The time burden and the monetary burden are mutually exclusive, and the total burden is the union of these two measures. The results of the simulation are reported in Table 3. The estimated average time burden for charitable contributions is between 2 and 2.8 hours per return with Schedule A. The aggregate time burden is between 81.0 and 113.6 million hours. In addition, the dollar burden is between $52.8 and $53.9 per return with Schedule A. The aggregate dollar burden is between 2.15 and 2.20 billion dollars.
Table 3. Estimated Burden of Charitable Contributions ReportingBurden measure Average burden Total burden
Time burden 2 to 2.8 hours 81 to 113.6 million hours
Monetary burden $53 to $54 2.15 to 2.2 billion dollars
Source: Individual Burden Model, IRS Research, Analysis, and Statistics.
Analysis of the 2005 tax filings suggests that, for a substantial number of taxpayers, charitable contributions are the only itemized deduction that is likely not provided to them on an information document or yearend sum-mary.2 Over 60 percent of the taxpayers who itemize deductions report only Interest Paid and Taxes Paid in addition to charitable contributions. The vast majority of this information is already subject to information reports. The error rates, in terms of magnitude, for the interest and tax items on Schedule A are relatively small.3
Previous LiteratureThe Theory of Charitable GivingThe challenge in constructing a theory of charitable giving lies in addressing a well-known inconsistency: while a standard public good model with chari-table donations predicts both substantial free-riding and suboptimal giving, the empirical evidence tells us that donations to charities are widespread and often very generous. Becker (1974) observes that the standard public good models incorporate charitable giving by supposing that charitable giving is simply another good entering the representative philanthropist’s utility function: Ui=Ui(xi,gi), where xi is his or her consumption of a private good and gi is his or her consumption of charitable giving (i.e., his or her contri-
2 Analysis of Tax Year 2005 Schedule A data in the IRS Compliance Data Warehouse, March 2007.3 Unpublished analysis of the raw TY2001 NRP reporting compliance study of individual income tax returns provided by IRS Research, Analysis, and Statistics, March 2007.
Turk, Muzikir, Blumenthal, and Kalambokidis56
bution to the public good). Becker proposes instead a utility function that takes as arguments the individual’s own consumption of a private good (xi), along with the total contributions from everyone (including this individual) to the public good (G): Ui=Ui(xi,G). In this way, an individual’s altruism, or concern for the welfare of others, enters his or her utility function in concert with the giving of others. While Becker’s utility-maximizing individuals contribute more as their incomes increase (and less as others’ incomes rise), the model still predicts substantial free-riding and inefficient provision (Sug-den, 1982,1984; Cornes and Sandler, 1984; Steinberg, 1987). As an alterna-tive, Sugden proposes that individual giving behavior is governed by a moral principle, reciprocity. The principle of reciprocity is that an individual will contribute to a public good when others do.4 For example, suppose everyone else is contributing “g.” Given this, an individual determines how much he or she would most prefer everyone were contributing, say “g*.” If g* is at least as large as g, then, by reciprocity, the individual is obliged to contribute at least g. An important result in Sugden’s model is a reduction in free-rid-ing, as an individual responds to the increased contributions of others by raising his or her own giving.
Cornes and Sandler (1984) take a different approach. In their model, utility-maximizing individuals purchase two marketed goods. One (c) yields only private benefits, while the second (q) is capable of jointly producing both public (Z) and private characteristics (x). Utility is a function of the purely private good and both the public and private characteristics produced by q: Ui=Ui(c,x,Z). Here, Cornes and Sandler also demonstrate reduced free-riding, as an increase in everyone else’s purchases of q may induce an individual to purchase more of it as well. Furthermore, they show that, in contrast to the predictions of standard models, if the two jointly-produced goods are complementary, the suboptimality of Nash equilibrium public good provision need not worsen with the size of the community.5
Free-riding in the standard public good model also arises when a public good is supported both by private donations and the Government. The neutrality hypothesis holds that Government provision of a public good, financed by lump-sum taxes, will crowd out private giving, dollar for dol-lar. As one salient example, Roberts (1984) observes that public transfers to the poor during the Great Depression reduced private charity, causing a movement among private agencies away from relieving poverty and toward other activities. Because of the considerable empirical evidence at odds with the neutrality hypothesis, theorists have sought more consistent models. 4 Sugden’s reciprocity is a weaker version of the Kantian notion of unconditional commitment.5 Hicksian complementarity: Hold x constant while Z increases and decrease c to keep utility fixed. If the willing-ness-to-pay for x increases, then x and Z are “q-complements.”
Charitable Contributions in a Voluntary Compliance Income Tax System 57
In Steinberg’s (1987) model, a public good is supported by private dona-tions and two levels of Government (Federal and local). Individual utility depends on consumption of a private good, one’s own donations to a public good, and the amount of the public good otherwise available. Crowding out, under plausible circumstances, is shown to be incomplete. Andreoni (1989,1990) supposes that individuals have two reasons for charitable giv-ing, altruism and egoism. Altruism is simply a desire for more of a public good. A purely altruistic individual will be indifferent between supporting the public good by paying a tax (Government donation) or by making a pri-vate donation, holding his or her private consumption and the giving of oth-ers constant. In this case, neutrality holds. Egoism, on the other hand, is a desire to contribute in order to derive some private benefit, perhaps a “warm glow.” A purely egoistic individual will strictly prefer making a private donation over paying a tax that funds Governmental giving, so that there will be no crowding out. Where both reasons motivate behavior, Andreoni posits “impure altruism.” In that case, direct Government grants financed by lump sum taxes will only partially crowd out private donations, and Government subsidies of charitable contributions can increase giving. For example, in the U.S. Tax Code, the charitable donations of itemizing taxpayers are subsi-dized by the provision of a tax deduction. This deduction effectively rebates a fraction of each contributed dollar back to the taxpayer. To the extent that this subsidy generates more giving than would otherwise take place, one important insight of Andreoni’s model is that this happens not (or at least not entirely) because of the price elasticity of giving, but rather because of the warm glow of giving—impure altruism.6
Laboratory ExperimentsRecently, researchers have begun to consider charitable giving from the demand side of the charity market, that is, from the perspective of fundrais-ers. Perhaps a fundraiser’s most critical objective is to select those proce-dures or practices that will produce the largest revenue stream for a charity. While fundraising professionals often employ a set of best practices gleaned from their collective, anecdotal experience, scholars have now begun to subject them to theoretical and empirical validation. One commonly-used practice is to inform potential donors that any contribution they make will be matched by another donor.7 Augmenting the donations of individuals
6 There is a considerable price and income elasticity literature. See Clotfelter (1980), Randolph (1995), Steinberg (1990), Peloza and Steel (2005), and Auten et al. (2002). While the magnitudes vary, there is both empirical and experimental evidence that giving rises as its price decreases. 7 For example, contributions may be matched by one’s employer.
Turk, Muzikir, Blumenthal, and Kalambokidis58
in this way in effect subsidizes their giving, though in a different manner than does the implicit rebate of the charitable deduction in the U.S. income tax.8 In a widely-cited laboratory experiment, Eckel and Grossman (2003) compare the donations received by charities when donations are subsidized by a match versus a rebate. They reason that a rebate subsidy (with rebate rate, r) in which an individual donating $X to a charity receives a rebate of $rX is theoretically comparable to a matching subsidy in which the match rate, m, is set so that the match-inclusive amount received by the charity is $X.9 Theoretically, comparable rebate and match subsidies will confront the donor with the same effective price per contributed dollar. Ceteris paribus, a donor would then be indifferent between the two subsidy mechanisms and, in moving between them, would adjust his or her contributions so that the charity receives the same amount.10 Using a within-subjects design (each subject choosing under both match and rebate subsidies), they find, however, that the net contributions received by a charity are significantly larger with the match subsidy. One suggested explanation for the result is the operation of a framing effect affecting how subjects perceive the subsidies. A rebate subsidy may be perceived as a reward from a third party. Giving in this case is an isolated, individual endeavor. In contrast, a match subsidy may be perceived as a cooperative endeavor, with the third party working in con-cert with the donor to provide the public good. Giving in this case is more social, assuring the individual that at least one other person is also doing his or her share. If subjects prefer the cooperative frame, so that price is not the only determining factor, then we might well expect charities to receive more in the presence of a matching subsidy. A second plausible explanation for the result is that the subjects either did not fully attend to or were unable to fully understand the difference between the subsidies, perhaps, for example, interpreting a 25-percent rebate as a less generous subsidy than a 33 1/3-percent match. To eliminate the burden on subjects of comparing the two subsidies, Eckel and Grossman (2006a) repeated their laboratory experiment
8 A hybrid rebate-matching subsidy has been a feature of the U.K. income tax system since the 1920s (Morgan, 2000). Under current Gift Aid rules, a charity receiving a donation of X pounds may claim an additional amount from Inland Revenue, equal to X[t/(1-t)] pounds, where t is the base tax rate, .22 in 2007. Taxpayers with higher tax rates are personally eligible for a rebate of the additional tax paid on the X pound gift. Donations from taxpay-ers with lower tax rates are eligible for Gift Aid provided that the taxes paid by the donors are at least as large as the corresponding gift aid amounts.9 If m is the match rate and r is the rebate rate, then the two subsidies will be “theoretically comparable” if m= r/(1-r). For example, a 25-percent rebate rate is theoretically comparable to a 33 1/3-percent match rate. Under a 25-percent rebate, a $1 gift has a price of $0.75 and transfers $1 to a charity. Under a 33 1/3-percent match, a char-ity will receive $1 when a donor contributes $0.75, matched by $0.25.10 That is, a donor will contribute a smaller gross amount in a matched subsidy than in a comparable rebated subsidy, while net contributions would be the same. For a rebate subsidy, net contribution = gross contribution; for a match subsidy, net contribution = gross contribution + match.
Charitable Contributions in a Voluntary Compliance Income Tax System 59
using a between-subjects design, assigning subjects randomly to either a match or a rebate regime. Freed of the need to recognize how the two subsi-dies differ, net contributions continue to be higher when matched than when rebated.
Building on Eckel and Grossman’s initial paper, Davis, Millner, and Reilly (2005) seek to explore the experimental phenomenon further. First, they run a replication of the original experiment, with the result that charity receipts are again higher under matching subsidies than under theoretically comparable rebate subsidies. However, they cast doubt on the framing hy-pothesis by pointing out that, in both subsidies, subjects tended to donate the same fraction of their endowments to charities, either simply or stochasti-cally (constant contribution pass rate).11 That is, rather than paying atten-tion to adjusting their contributions across subsidies, subjects just gave the same proportion of their endowments in both cases. Their hypothesis might be expected to hold if the calculation necessary to adjust contributions were difficult to understand, if subjects did not care much about making charitable contributions, or if subjects’ utilities were otherwise enhanced by inattention to this task.
Next, in order to remove any potential “cooperation” framing effect, Davis, Millner, and Reilly (2005) conduct a similar experiment, but using an investment context: subjects decide how much of their endowments to hold as cash and how much to pass to an investment account. Deposits to the investment account (A) earn a quadratic return with certainty (return = 1.5 A – 0.5 A2). In a within-subject design, each subject is offered different investment subsidies and subsidy rates, along with different endowments. The result is that deposits in their investment accounts are uniformly lower under a rebate subsidy than under a theoretically comparable matching subsidy.12 Finally, in order to explore the role of information, Davis, Mill-ner, and Reilly construct a third experiment. Returning to the charitable donation context, subjects are presented with only two allocation scenarios at a time, one of which offers a rebate and the other a theoretically compa-rable match.13 To ensure that subjects are completely cognizant about each scenario, the outcomes of each possible allocation decision are presented in a table. They find that mean charity receipts are still significantly lower
11 By stochastic constant contribution pass rate, they mean that the distribution of match pass rates that exceed rebate pass rates is symmetric with the distribution of match pass rates that are lower than rebate pass rates. 12 In a related experiment, Davis and Millner (2005) presented a more familiar retail context in which subjects were offered opportunities to purchase subsidized chocolate bars. Two findings are interesting. First, at any price, net purchase quantities are higher for a matching sales format than for a comparable rebate sales format. Second, while constant contribution behavior appears to explain a good deal of this behavior, there is also evidence of an aversion to rebates.13 The earlier experimental design presented as many as 10 allocation problems at a time.
Turk, Muzikir, Blumenthal, and Kalambokidis60
for the rebate subsidy. In concluding, these authors point out that if donors adopt a constant contribution strategy, then their gross charitable contribu-tions will be the same regardless of both the subsidy rates and the type of subsidy regime. In that case, they continue, a tax authority should avoid offering a rebate subsidy, since a rebate merely replaces a private donation with the Government’s tax expenditure.
“Matching subsidies, while less harmful, are still at best innocuous. Since matching rates do not affect private contributions, the subsidizing agency can efficiently achieve a target contribution level for a charity by simply topping up any unsubsidized privately collected sums. Se-lecting ex ante a matching subsidy level may cause the agency to either miss its target, or to pay more than necessary to achieve the target.”14
A clear implication of this reasoning is that, if the authority wishes to
offer a matching subsidy that is theoretically comparable to a given rebate subsidy, it cannot determine the appropriate matching subsidy rate without knowing how much the donor will contribute to the match. The theoretically comparable match subsidy rate is endogenous.
Field ExperimentsExtending their work to the field, Eckel and Grossman (2006) use one charitable organization’s regular mailed fundraising solicitations to study the responses of donors when they are offered either a rebate of or a match for their contributions.15 Their univariate results indicate that own donations un-der a match subsidy (excluding the match amounts) are significantly higher than donations under the equivalent rebate subsidy (before rebate). Regres-sions that allow them to control for certain socioeconomic characteristics show no significant differences in own giving by subsidy type; this implies that, once the matching contributions are included, the revenue received by the charity under a matching subsidy exceeds the revenue under an equiva-lent rebate subsidy. They also uncover some evidence that some givers are averse to rebate subsidies: only 39 percent of those offered a rebate accept-ed it, while 73 percent of those offered a match accepted it. Finally, while giving in this experiment was sensitive to the presence of a subsidy, it was not significantly affected by the level of the subsidy.
14 Davis, Millner, and Reilly (2005), page 103. While this is true for the assumption of constant contributions, it is also more generally true whenever donors do not completely adjust their giving across subsidy regimes so as to keep net contributions constant.15 Of course, because the experiment took place in the United States, subjects who itemized deductions on their income tax returns would receive an additional rebate subsidy.
Charitable Contributions in a Voluntary Compliance Income Tax System 61
The results of a similar mailed solicitation field experiment are report-ed by Karlan and List (2007). In this experiment, prior donors of a nonprofit organization are randomly assigned to treatment and control groups. The treatments consist of announcements of match offers, varied along several dimensions, including the match rate (price of giving). Because this experi-ment was conducted in the United States, a rebate subsidy was available to all itemizing subjects, in the control and treatment groups. Karlan and List’s prediction about the direction of the price effect is ambiguous. Subjects might respond to a higher match rate by giving more (e.g., due to the typi-cal influence of price on quantity demanded or because a higher match rate signals that the charity is more socially important or in greater need of dona-tions now) or by giving less (e.g., if they see the announcement as a market-ing trick or because the existence of a match reduces the marginal utility of their donations). The results show that the announcement of a matching gift matters, since both the revenue per solicitation and the probability that an individual will donate are significantly greater in the treatment groups. Interestingly, consistent with Eckel and Grossman’s field experiment find-ings, larger match ratios relative to smaller match ratios have no additional impact.
Often, a charitable organization solicits contributors at regular intervals (annual fundraising drives, for example). In a randomized field experiment among Swiss university students, Meier (2007) tests whether a temporary matching subsidy influences donations in the long run, as well as short term. As continuing students paid their tuition for the upcoming term, they were asked for voluntary contributions to two funds, CHF 7.0 to a fund offering low-interest loans to financially-strapped students and a CHF 5.0 to a fund supporting foreign students. Students in the treatment groups were told that if they donated to both funds, a matching contribution (with either a 25-per-cent or a 50-percent match rate) would be split equally between the funds. Students in the control group were solicited without this match. In six ensu-ing terms, the university repeated its request for contributions, but without the match offer treatment. The results indicate that donations to both funds rose immediately after the match offer. However, in the next term (and to a lesser extent in the ensuing terms), the number of students in the treatment groups contributing to both funds decreased significantly, relative to the controls. Overall, the impact of the matching mechanism on donations was negative.
In the U.K., where the tax authority has long offered to match chari-table contributions, at rates approaching 30 percent, a 2005-06 survey of donors showed that about 34 percent made use of Gift Aid in an average month. The likelihood of giving in this tax-effective way was stronger
Turk, Muzikir, Blumenthal, and Kalambokidis62
among large donors: 57 percent of donors giving 100 pounds or more per month used Gift Aid, in contrast to 39 percent of those giving between 5 and 25 pounds and 17 percent of those giving less than 5 pounds (NCVO-CAF, 2006).
Theoretical ModelIn this section, we explore optimal subsidized contribution behavior in the context of three cases. In the first, an individual’s utility depends only on his or her consumption of a private good and of a public good toward which he or she may contribute. Contributions are subsidized by either a rebate or a match. In the second case, contributions produce a private benefit (e.g., a “warm glow”), as well as the public good, and, again, contributions are subsidized either by a rebate or a match. Finally, we alter the second case by introducing required reporting of contributions, accompanied by random Government audits and penalties for overstatements.
Case 1Consider a society with n identical individuals. Each has an endowment (I), using it to purchase units of a private good (Y) and to make contributions (xi) to a public good (g). The government can subsidize the public good by offering either a rebate, at rate t, or a matching contribution, at rate m. The level of the public good is the result of this individual’s contribution (xi) and of the contributions of everyone else (X-i). Each individual allocates his or her endowment so as to maximize an additively separable utility function, subject to a budget constraint:16
Rebate
Max Ui = u(Y) + g(X-i + xi) subject to xi Y = I - xi + txi
The first-order condition is:
0'1' iiiii
i xXgttxxIudxdU
16 Assume that u, c, and g are all twice-differentiable, increasing, and concave.
Charitable Contributions in a Voluntary Compliance Income Tax System 63
The utility-maximizing individual continues to donate until the mar-ginal utility of the foregone private good is equal to the marginal utility of the public good.
Match
Max Ui=u(Y) + g[X-I + (1+m)xi] subject toxi Y = I-xi
The first-order condition is:p. 63
011'' mxmXgxIudxdU
iiii
Toward comparing these similar first-order conditions, suppose that the government chooses t and m so that a dollar contribution via rebate has
the same price as a dollar contribution via a match, i.e., tm
111
. Also suppose that the individual, sensing the equivalence of the two subsidies, adjusts his or her contributions so that the charity receives the same amount either way, i.e., ximatch=(1-t)xirebate. It is easy to show then that the two first-order conditions are identical. For the match first-order condition, we have:
0'1'
0111
11'1'
irebateiirebateirebate
irebateiirebate
xXgttxxIut
xtt
XgxtIu
Uffffffffffff b c B C
It is this “equivalence” that Eckel and Grossman’s experiments suggest does not hold.
Case 2Alternatively, suppose that an individual’s contribution jointly produces the public good (g) and a private benefit (c, a “warm glow”). The objective func-tion for an individual, assuming an additively separable utility function, is:
Max Ui = u(Y) + c(xi) + g(X-i + xi) xi
Turk, Muzikir, Blumenthal, and Kalambokidis64
Rebate
The budget constraint is Y = I – xi + txi. The first-order condition is:p. 64
1` a dU i
d xifffffffffffff u . I@ xi txi
b c
t@ 1` a
c. xi` a
g . X@ i xi
B C
0
dU b c B C
Match
The budget constraint here is Y = I – xi, while the public good becomes g[X-i + (1+m)xi] and the warm glow depends only on the individual’s contribution.
The first-order condition is:d xi
2` a dU i
d xifffffffffffff
@ u . I@ xib c
c. xi` a
g . X@ i 1 m
` a
xiB C
1 m` a
0 A
Suppose that the government sets the subsidy rates equivalently, with
` a
1 m` a 1
1@ tffffffffffffff
` a ` a
b c
and that the individual behaves equivalently, setting ximatch = (1-t)xirebate. Substituting in (2) yields:
2 .` a
t@ 1` a
u . I@ xirebate txirebateb c
1@ t` a
c. 1@ t` a
xirebateB C
g . X@ i xirebate
B C
0
Notice that, comparing (1) and (2’), the middle terms differ, with a smaller warm glow produced by an equivalent matched contribution. That is, an individual contributing equivalently in this setting would experience more utility with a rebate subsidy than with a matching subsidy. In order to generate indifference, contributions in a matching subsidy would need to be “more than equivalent,” relative to a rebate subsidy.
Case 3Next, we introduce a Government requirement for individuals to accurately report their contributions. The Government monitors compliance by audit-ing a fraction, ρ, of the individuals who report contributions. If the individu-al has overstated his or her contribution, the audit detects the fudged amount (f), and the Government adjusts the subsidy and imposes a penalty, rf, on the individual.
Charitable Contributions in a Voluntary Compliance Income Tax System 65
Rebate
Depending on whether the individual is audited, there are two budget con-straints:
Y = I – xi + txi + tf =A, if not audited andY = I – xi + txi – rf =B, if audited.
The sum of the marginal utilities of a small addition to warm glow and to the public good must be equal to the expected marginal utility of the (smaller) foregone Y.
(4)
AtuBru
rButAufU
i
i
ii
''1
0''1
b c b c
` a
D EV W
The optimal f is the one such that the ratio of (1-ρ) and ρ (i.e., the
odds of not being audited) is equal to the ratio of the penalty rate (r) and the rebate rate (t) multiplied by the ratio of the marginal utilities of the foregone Y in each state.
Match
The Government subsidizes contributions to charities by matching them, at rate m. Donors are required to report their contributions and are audited
Turk, Muzikir, Blumenthal, and Kalambokidis66
at rate, ρ. Individuals who overstate their donations are penalized on the fudged amount, at rate, r. An unaudited individual faces Y = I – xi and g[X-i + (1+m)(xi + fi)], while an audited individual faces Y = I – xi – rf and g[X-i + (1+m)xi].
To explore the consequences of the two subsidies being equivalent,
again set tm
111
and assume ximatch = (1 – t ) xirebate. For notational ease, let xirebate = xiR. In that case, (5) becomes (5’) and (6) becomes (6’):
t1
5 .` a
1@b c
@ u . I@ xiR txiR
b c
1@ t` a
1@ t` a
c. xiR@ txiR
b c
g . X@ i xiR f
B C
T U
@ u . I@ xiR txiR@ rfb c
1@ t` a
1@ t` a
c. xiR@ txiR
b c
g . X@ i xiR
B C
0T
f g
H I
d e
b c
` a ` a
b c B C
6 .` a
1@b c
g . X@ i xiR
11@ tfffffffffffffff g
f i
H
J
I
K@r
1@ tffffffffffffffd e
u . I@ xiR txiR@ rfb c
0
Note that, for the optimal choice of xi, the first-order conditions, (3) and (5’), are different. Similarly, the first-order conditions for the optimal choice of fi, (4) and (6’) differ. This implies that an individual who behaves equivalently in response to these equivalent subsidies will not be indifferent between
Charitable Contributions in a Voluntary Compliance Income Tax System 67
them. Utility-maximizing individuals will make nonequivalent choices of both xi and fi across the two subsidies.
Experimental DesignThis paper proposes a laboratory experiment designed to test several of the hypotheses raised by the preceding theoretical model. The experiment consists of several stages, each including elements designed to test specific hypotheses. To allow for variation in the experiment parameters, multiple participants will engage in each activity. And to allow for learning about the consequences of their choices, each participant will complete multiple rounds of the activities. At the end of the experiment, participants receive the payoff from a single round, drawn at random.
In the first stage of the experiment, subjects participate in an activity in which they can voluntarily contribute to a public good without any subsidy. The main purpose of this stage is for participants to learn how the activi-ties work and to establish a baseline for charitable giving. In the second stage, we will examine the difference between the contribution-matching and rebate systems for Government support of charities. The design of this stage will be very similar to the experiments conducted in earlier studies, described in our previous discussion of the literature. Two subsequent varia-tions on the experiment will measure the price elasticity of donations and test whether the value of the subsidy rate influences donor behavior. Finally, we will introduce noncompliance in reporting charitable contributions and examine changes in donor behavior when the subsidy is based on reported, rather than actual, contributions.
While many experiments have addressed one or the other of these is-sues—voluntary contributions or tax compliance—combining the two issues in a single design will be unique.
Stage 1: Voluntary contributions to a public goodIn this stage, participants will engage for multiple rounds in an activity in which they choose how to divide an amount of endowed income between a private and a public good. At the beginning of each round, each participant will be assigned a random amount of income, I, and will be instructed to divide that income between a private investment and a public good. The activity will be completed by multiple participants, allowing for variation in income. Contributions will be made anonymously so that each participant knows only his or her own contribution. At the end of each round, partici-
Turk, Muzikir, Blumenthal, and Kalambokidis68
pants will be told their total payouts, including the value of the public good, X.
There are several ways to structure the charity—or public good—to which experiment participants donate. One option is to generate a nonrival, nonexcludable public good within the experiment. For example, Alm and Jacobson (2007) describe a set of experiments in which participants allocate their incomes between a private investment and a public good, which yields a return to each participant in the amount of the sum of total contributions by all participants. The private investment yields a return to the individual equal to some multiple, α≥1, of the amount of income kept. Consequently, if a participant with income Ii chooses to donate xi=γ(Ii), where 0≤ γ ≤1, his or her payout will be α (1-γ)Ii + X, where X=X-i+xi and X-i is the sum of contri-butions by all the other participants.
Alternatively, the public good can be a real charity, either chosen by the participant from a list provided by the experimenter, as in Eckel and Grossman (2003), or by default, as in the natural field experiments described by Eckel and Grossman (2006, 2007). In both of these cases, actual contri-butions to the charities are made, and, at the end of a round, participants are told the size of total contributions to their charities.
While we think either approach—contributions to a real charity or a within-experiment public good—can be used to examine individuals’ propensities for voluntary giving, we also want to examine the effect of a private benefit, or warm glow, from donating. This is the element c(x) that we defined earlier. We think it will be difficult to generate the private benefit when the public good is generated within the experiment and participants are unknown to one another. Therefore, we will have participants make donations to an actual charity, chosen from a list of several diverse but well-known organizations, and provide donors with some public recognition of their contributions or a letter of gratitude from the charity.
Participants will be randomly selected into two groups. One group will be told that, at the end of the experiment, those who make donations will receive the recognition or gratitude letters. To examine the influence of the private benefit on giving behavior, the second group will not receive the recognition or letter, even if they made contributions.
With the results of this stage, we will be able to estimate the income elasticity of giving as well as test these hypotheses:
(H1.1): Donors will make voluntary contributions to a public good.
(H1.2): Controlling for income, a private benefit in the form of public recognition of giving or gratitude from the recipient will increase donations.
Charitable Contributions in a Voluntary Compliance Income Tax System 69
Stage 2: Matching versus equivalent rebateThis stage will have the same structure as the first, with the addition that participants will be told that the public good will be subsidized with a match at rate m or through a rebate at rate t. The rates will be set so that the price paid by an individual for a $1 contribution is the same in both subsidy condi-
tions, i.e.,
J
tm
111
1. Whether a participant faces the match or subsidy
regime will be randomized so that a single participant will face both regimes multiple times throughout the experiment.
At the end of each round, participants will be told the total value of the public good, including the match, if any, and the total amount of income they retain, including the rebate, if any.
The activity will be completed by multiple participants, allowing for variation in income. However, m and t remain the same throughout this stage of the experiment.
One explanation for the observed increase in donations under a match-ing regime is that the way the options are explained to participants—the way they are framed—influences outcomes. For example, in the field experiment conducted in Karlan and List (2003), prospective donors were told that the opportunity to have their contributions matched would be available for a limited time, and that the match would be provided by another concerned member of the organization.17 In our experiment, instructions will be care-fully worded to limit the influence of framing on participants’ choices. For example, both the match and the rebate will be available only for the activ-ity period, and the participant will learn the size of the payoff at the same time—the end of each activity period—for both types of subsidy. In addi-tion, participants will know that the neutral experiment administrator will provide the subsidy, rather than another donor or the Government.
With the results of this stage, we will be able to test several hypotheses about donor behavior:
(H2.1) Controlling for income, donors will make larger contributions under the matching system than under the equivalent rebate system.
(H2.2) Controlling for income, the probability of making a contribu-tion is larger under the matching system than under the rebate system.
(H2.3) The income elasticity of contributions is larger under the sub-sidy system than under the rebate system.
17 Karlan and List (2007), p. 8.
Turk, Muzikir, Blumenthal, and Kalambokidis70
Stage 3: Varying match and rebate ratesTo measure the price elasticity of giving, we will alter the experiment so that each participant is randomly selected into either the match system or the re-bate system, and remains in that system for each activity. Within each group of participants, we will vary the size of m or t, respectively. With the results of this stage, we will be able to measure the price elasticity of contributions under both systems and test this hypothesis:
(H3.1): The price elasticity of contributions is larger under a match system than under a rebate system.
Stage 4: Equal match and rebate ratesIn addition to the framing problems described above, a second explanation for larger contributions under the match system is that, when m and t are set
to be equivalent, with
J
tm
111
1, m will be greater than t. For example,
a match rate of .25 has an equivalent rebate rate of .20. It is possible that participants focus on the percentage value, ignoring the structure of the subsidy (match versus rebate), and give more because the match rate appears to be more generous. To explore this, we will alter the experiment so that m and t are equal (though no longer equivalent with regard to the price of giv-ing). The results from this stage will allow us to test this hypothesis:
(H4.1): The type of subsidy (match versus rebate) has no significant effect on donor behavior when the match rate and the rebate rate are equal.
Stage 5: Noncompliance and enforcementIn the final stage, we will introduce the possibility of noncompliance. At the beginning of each round, subjects will be randomly selected into either a matching or equivalent rebate regime and will be randomly assigned an amount of income. Participants will be instructed to make two choices: how much of their incomes to contribute to the public good and how much to report to the tax authority (the experiment administrator). Contributions will be anonymous, and the tax authority will know only the sum of contribu-tions, X, and the individual reported amounts. Before making their choices, participants will be told that the tax authority will randomly audit their reported contributions with probability equal to ρ, and that the audit will re-
Charitable Contributions in a Voluntary Compliance Income Tax System 71
veal their true contributions with certainty. This means that, whoever’s case is drawn, the experiment administrator, who already knows the size of the reported contribution, will learn the value of the actual contribution.
Under the rebate regime, participants will receive a rebate at rate t, similar to a tax deduction for charitable contributions. They will be told that being found to have misstated their contribution will result in reducing the rebate to t times the actual contribution. In addition, they will face a fine equal to some fraction, 0≤δ≤1, of the amount of the misstatement. For cases that are not drawn, the actual contribution is not revealed to the administra-tor, and no penalty occurs, even if the participant misstated contributions.
Under the matching regime, individual contributions are matched at rate m. Subjects who are audited and found to have misstated their contri-butions will receive the same fine as above, and the public good match will be reduced to m times the actual contribution. The significant difference between the two systems is that noncompliance via overstatement of contri-butions yields only a private benefit (increased rebate) in the rebate system, while overstatement under the matching system results only in expansion of the public good.
Participants will perform the activity multiple times to allow them to learn that the audit rate, the penalty rate, and the lack of consequences in the absence of audit are all credible.
This structure will allow us to estimate total noncompliance in re-porting of charitable contributions. Varying the audit rate and penalty rate allows estimation of the elasticity of compliance with regard to these variables, as has been done in other tax compliance experiments. However, our primary goal is examining how noncompliance might affect the donor behavior and the total size of the public good. Therefore, with the results of this stage, we will test these hypotheses:
(H5.1): Controlling for the rebate (match) rate and income, actual donors will overstate their contributions when the rebate (match) is a function of reported, rather than actual, contributions, and audits of the reported amounts are conducted with a probability less than 1 (or with imperfect detection).
(H5.2): Controlling for income, donors will make larger contributions under the matching system than under the equivalent rebate system when the rebate (match) is a function of reported, rather than actual, contributions, and audits of the reported amounts are conducted with a probability less than 1 (or with imperfect detection).
Turk, Muzikir, Blumenthal, and Kalambokidis72
ConclusionsSubsidizing charitable contributions as an itemized deduction creates vary-ing subsidy rates, opportunities for misreporting, and a considerable amount of burden on individual taxpayers. Subsidizing contributions via a match can disconnect the subsidy rate and the marginal tax rate and can change the opportunities and the incentive for misreporting. In addition, moving the reporting responsibility to the charitable organizations clearly reduces the burden placed on individual taxpayers. It seems intuitive that the burden reduction for individuals would more than outweigh the increase in burden placed on charitable organizations. Experimental research has shown that the matching subsidies can actually increase charitable contributions. This result is inconsistent with most simple economic models. However, a minor departure from these models can predict behavior that is consistent with the experimental research.
References
Andreoni, James (1989), “Giving with Impure Altruism: Applications to Charity and Ricardian Equivalence,” Journal of Political Economy 97(6) pp. 1147-1458.
Andreoni, James (1990), “Impure Altruism and Donations to Public Goods: A Theory of Warm-Glow Giving,” Economic Journal 100(401), pp. 464-477.
Alm, James, and Sarah Jacobson, “Using Laboratory Experiments in Public Economics,” National Tax Journal 60,1 (March 2007) pp. 129-152.
Auten, Gerald E.; Holger Sieg; and Charles T. Clotfelter (2002), “Charitable Giving, Income, and Taxes: An Analysis of Panel Data,” American Economic Review 92(1) pp. 371-382.
Becker, Gary S. (1974), “A Theory of Social Interactions,” Journal of Politi-cal Economy 82(6) pp. 1063-1093
Clotfelter, Charles T. (1980), “Tax Incentives and Charitable Giving: Evi-dence from a Panel of Taxpayers,” Journal of Public Economics 13 pp. 319-340.
Cornes, Richard, and Todd Sandler (1984), “Easy Rides, Joint Production, and Public Goods,” Economic Journal 94(375) pp. 580-598.
Charitable Contributions in a Voluntary Compliance Income Tax System 73
Davis, Douglas D.; Edward L. Millner; and Robert J. Reilly (2005), “Sub-sidy Schemes and Charitable Contributions: A Closer Look,” Experi-mental Economics 8 pp. 85-106.
Davis, Douglas D., and Edward L. Millner (2005), “Rebates, Matches, and Consumer Behavior,” Southern Economic Journal 72(2) pp. 410-421.
Eckel, Catherine C., and Philip J. Grossman (2003), “Rebate versus Match-ing: Does How We Subsidize Charitable Contributions Matter?,” Journal of Public Economics 87(3-4) pp. 681-701.
Eckel, Catherine C., and Philip J. Grossman (2006), “Subsidizing Charitable Giving with Rebates or Matching: Further Laboratory Evidence,” Southern Economic Journal 72(4) pp. 794-807.
Eckel, Catherine C., and Philip J. Grossman (2007), “Subsidizing Charitable Contributions in the Field,” working paper.
Karlan, Dean, and John A. List (2007), “Does Price Matter in Charitable Giving? Evidence from a Large-Scale Natural Field Experiment,” working paper.
Meier, Stephan (2007), “Do Subsidies Increase Charitable Giving in the Long Run? Matching Donations in a Field Experiment,” working Paper No. 06-18, Federal Reserve Bank of Boston, Research Center for Behavioral Economics and Decision-Making.
Morgan, Gareth G. (2000), “Changes in UK Tax-Effective Giving: Impli-cations for Donor Fundraising Strategies,” International Journal of Nonprofit and Voluntary Sector Marketing 5(1) pp. 19-31.
NCVO/CAF (2006), Results of the 2005/06 Survey of Individual Chari-table Giving in the UK, National Council for Voluntary Organi-zations and Charities Aid Foundation, http://www.ncvo-vol.org.uk/uploadedFiles/NCVO/Research/UK%20giving%202005-06.pdf.
Peloza, John, and Peirs Steel (2005), “The Price Elasticities of Charitable Contributions: A Meta-Analysis,” Journal of Public Policy and Mar-keting 24(2) pp. 260-272.
Randolph, William C. (1995), “Dynamic Income, Progressive Taxes, and the Timing of Charitable Contributions,” Journal of Political Economy 103(4) pp. 709-738.
Roberts, Russell D. (1984), “A Positive Model of Private Charity and Public Transfers,” Journal of Political Economy 92(1) pp. 136-148.
Turk, Muzikir, Blumenthal, and Kalambokidis74
Steinberg, Richard (1987), “Voluntary Donations and Public Expenditures in a Federalist System,” American Economic Review, 77(1) pp. 24-36.
Steinberg, Richard (1990), “Taxes and Giving: New Findings,” Voluntas 1(2) pp. 61-79.
Sugden, Robert (1982), “On the Economics of Philanthropy,” Economic Journal 92(366) pp. 341-350.
Sugden, Robert (1984), “Reciprocity: The Supply of Public Goods through Voluntary Contributions,” Economic Journal 94(376) pp. 772-787.
D3
Tax Practitioners—Perspectives and Impact
Bloomquist Albert EdgertonWilson Beers Ibbotson Nestor
Hutchens Hatch EverettWhitlock
Scholz
Evaluating Preparation Accuracy of Tax Practitioners: A Bootstrap
ApproachKim M. Bloomquist, Michael F. Albert, and Ronald L. Edgerton,
Internal Revenue Service
I n recent years, both the number and share of individual taxpayers who rely on tax practitioners to prepare their Federal income tax returns have increased steadily. In 1996, paid practitioners prepared 63 million
(53 percent) individual income tax returns. By 2005, the number of paid preparer returns topped 80 million (62 percent).1 Even more important is the share of taxes reported on paid preparer returns. In 1996, 65 percent of total taxes were reported on returns prepared by tax practitioners. By 2005, the preparer share of total reported taxes rose to 74 percent.2 This trend indi-cates the growing dependency of our nation’s tax system on the tax prepara-tion industry, and it underscores the need for the Internal Revenue Service (IRS) to understand better how commercial tax preparation influences reporting behavior.
This paper is motivated, in part, by a recent Government Accountabil-ity Office (GAO) study (GAO, 2006) that examined the return preparation accuracy of chain tax preparers in a large U.S. metropolitan area. In that study, GAO investigators posing as taxpayers submitted 19 fictitious tax returns to different offices of nationwide chain tax preparers and evaluated the accuracy of the completed returns. GAO found that preparers commit-ted numerous errors. While many of these errors had little tax consequence, eight out of 19 returns (42 percent) had a tax discrepancy of at least $1,500 (six returns with excess refunds and two returns with overstatement of tax). GAO also found that tax preparers omitted income information from returns even when the “taxpayer” provided supporting documentation.
The GAO study did not identify a specific cause or set of causes for the high error rate but cited two possible factors. First, in most States, anyone can become a paid tax preparer regardless of education or training. The preparer population includes a diverse group that includes full-time self-em-ployed CPAs and tax attorneys, as well as individuals employed part-time in seasonal positions by chain tax preparation companies. The broad range of experience reflected in this group and the variability in training needed
1 Internal Revenue Service, Taxpayer Usage Study. See http://www.irs.gov/taxstats/article/0,,id=96629,00.html, last accessed on March 26, 2007.2 Analysis of Individual Return Transaction File data.
Bloomquist, Albert, and Edgerton78
to keep up to date on a Tax Code that changes from year to year could be contributing to the large number of observed errors.
Second, while penalties exist to promote due diligence on the part of tax preparers, not all preparers are held to the same standards. For example, while paid preparers are subject to penalties for various infractions under the Internal Revenue Code (IRC) (e.g., a $1,000 penalty for aiding and abetting understatement of tax liability), only CPAs, attorneys, and enrolled agents are subject to disciplinary proceedings under Circular 230.
A third possible contributing factor not mentioned in the GAO study is a decline in the number of IRS enforcement staff available to monitor compliance by individual taxpayers and tax preparers. Between 1995 and 2005, the number of revenue agents and revenue officers fell from 24,217 to 17,817, a drop of 26 percent. In 2006, the number of full-time IRS enforce-ment staff rose to 18,524, an increase of 4 percent from the previous year but still well below levels of a decade ago.3 A reduced IRS enforcement presence may lead some practitioners to conclude that the economic gain associated with obtaining larger tax refunds for clients outweighs the odds of being investigated and fined by IRS.
While ad hoc studies like GAO (2006) are useful exploratory devices, they are not statistically representative and cannot provide information on industrywide trends. Therefore, GAO recommended that IRS conduct research to determine the extent to which paid preparers contribute to inac-curacies on individuals’ tax returns. This paper attempts to respond to this request in two ways. First, we present summary measures of return prepa-ration accuracy using population data from the IRS Office of Research’s Compliance Data Warehouse (CDW). Second, we develop a computational method for identifying tax practitioners who have a high percentage of returns with one or more errors. The method is demonstrated in a case study of preparers in the State of Connecticut.
We hasten to point out what this study is not. First, this paper does not propose a methodology for identifying intentional versus unintentional er-rors. We believe such a determination must take into consideration preparer intent which data analysis alone cannot reliably ascertain. Second, the pro-posed methodology cannot determine if errors are due to practitioner error or other factors (e.g., taxpayers who do not provide information documents). Ultimately, we believe such determinations can be made only after a careful review of quality control procedures used by individual practitioners.
3 IRS Data Book, various issues. See http://www.irs.gov/taxstats/article/0,,id=102174,00.html, last accessed on March 26, 2007.
Evaluating Preparation Accuracy of Tax Practitioners 79
In the next section, we present some measures of tax return preparation accuracy based on analysis of IRS data. In the third section, we describe a methodology for identifying tax practitioners with a high percentage of clients with potential preparation errors, referred to as the discrepancy rate. The methodology relies on bootstrap resampling of network vertices in a two-mode network consisting of practitioners and Zip Codes. Practitio-ners with discrepancy rates exceeding the one-tailed 95-percent confidence interval are identified as candidates for further analysis. The fourth section demonstrates the proposed methodology in a case study for the State of Con-necticut. Finally, the last section summarizes key points.
Preparation Accuracy on Federal Income Tax Returns: What the Data RevealIn this section, we present summary population measures of return prepara-tion accuracy. Table 1 shows two indicators of return preparation accuracy for taxpayers who self-prepare and for two categories of preparers: those with an employer identification number (EIN) and those preparers with a preparer taxpayer identification numbers (PTIN).4 The two indicators are: (1) presence of a math error and (2) a nonzero (positive or negative) dollar amount assigned by the IRS’s Automated Underreporter (AUR) program.5 The types of errors covered by the math error and AUR programs are mutu-ally exclusive.
For individual income tax returns received during 2006, 2.7 percent of returns had a math error. Self-prepared returns are more likely to have a math error than returns prepared by practitioners. In 2006, 5.0 percent of self-prepared returns had a math error versus 1.1 percent for all paid prepar-ers. However, the situation is somewhat reversed for misreporting. Approx-imately 12.2 percent of returns prepared by a tax practitioner with an EIN are identified as potential misreporter cases versus 10.2 percent for self-pre-pared returns.6 Because our interest is on practitioner errors, we focus our attention on potential misreporting errors for the remainder of this paper.
4 Business operators are required to have an EIN if they have employees, operate as a corporation or partnership, or if certain other conditions apply. In general, firms with an EIN are established businesses as opposed to a single individual operating on a part-time basis. In Processing Year (PY) 2006, there were 328,000 unique preparer EINs and 550,000 unique PTINs that were not also associated with an EIN.5 Math errors include errors in addition or subtraction, incorrect dependent SSNs, errors in filing status, exemp-tions, and incomplete schedules and forms. See GAO (2000) and IRS (2003).6 Returns flagged by the AUR program are considered potential underreporters until a case review is conducted.
Source: Individual Returns Transaction File and Automated Underreporter File
Returns with One or More Math Errors
Returns with a Potential AUR Discrepancy
Table 1. Preparation Accuracy of Federal Individual Income Tax Returns, by Preparer Type, PY 2005 and 2006
TotalReturns(1,000s)
Table 2 displays the number and percentage of tax returns with poten-tial misreported amounts by size of firm for the two categories of preparers. The main finding in this table is the negative relationship between firm size and percentage of filers with a potential AUR discrepancy. In particular, the percentage of filers with a potential AUR discrepancy is 3 to 4 percentage points higher among firms with fewer than 100 clients compared to firms with more than 5,000 clients.
Source: Individual Returns Transaction File and Automated Underreporter File
Returns with a Potential AUR Discrepancy
Firm Size(No. Clients)
Total Returns (1,000s)
Table 2. Returns with a Potential AUR Discrepancy, by Type of Preparer and Firm Size, PY 2006
Evaluating Preparation Accuracy of Tax Practitioners 81
Table 3 examines the source of potential misreporting errors by income line item for returns flagged by the AUR program. The line item with the highest overall AUR frequency is wages, salaries, and tips closely followed by State and local income tax refunds, mortgage interest, and withholding. Together, these four line items account for nearly 60 percent of all potential AUR discrepancies in 2006.
Table 3. Number (in 1,000s) of Potential AUR Discrepancies, by Line Item, PY 2006
Preparer Type
Note: Returns may have multiple AUR discrepancies. Row total includes only those categories shown.
Table 4 displays the top ten States with the highest percentage of pre-parer returns with an AUR discrepancy in PY 2005 and 2006. For the U.S., an average of 12 percent of individual tax returns prepared by a tax practitio-ner had a potential AUR discrepancy. For the most part, States that ranked in the top 10 in 2005 also ranked highest in 2006. Interestingly, California ranked third in both years. GAO (2006) cites California as one of only two States in the U.S. (the other is Oregon) that require unenrolled preparers to register with State agencies and meet continuing education requirements. Although not shown in Table 4, nearly the same ten States are the top ten States for self-prepared tax returns, although discrepancy rates range, on average, 1-2 percentage points lower than preparer rates. This is consistent with the overall average potential AUR discrepancy rates shown in Table 1.
Bloomquist, Albert, and Edgerton82
Rank State
PreparerReturns with a Potential AUR Discrepancy
(%) State
PreparerReturns with a Potential AUR Discrepancy
(%)1 Nevada 15.0% Maryland 14.7%2 Maryland 14.9% Nevada 14.4%3 California 14.0% California 14.2%4 Arizona 13.6% Arizona 13.7%5 Colorado 13.5% Connecticut 13.5%6 District of Columbia 13.4% New Jersey 13.3%7 New Jersey 13.4% Colorado 13.2%8 Georgia 13.2% District of Columbia 13.1%9 Connecticut 13.1% Georgia 13.0%
10 Arkansas 13.0% South Carolina 12.8%U.S. Average 12.0% U.S. Average 11.9%
Source: Individual Returns Transaction File and Automated Underreporter File
PY2006PY2005
Table 4. Top 10 States with the Highest Percentage of Preparer Returns with a Potential AUR Discrepancy, PY 2005-06
Thus far, we have summarized return preparation accuracy on indi-vidual tax returns with respect to the number of returns with math errors or with potential misreported amounts as determined by the IRS’s AUR program. We found that paid preparers commit far fewer math errors, both in absolute and relative terms than self-preparers. However, paid preparers account for a higher number and a larger percentage of tax returns with a potential AUR discrepancy. Therefore, we believe the focus on preparer-re-lated errors mainly should be on AUR cases. We now turn to the second aim of this paper: the development of a methodology for identifying individual tax practitioners having high inaccuracy rates.
Methodology for Evaluating Preparation Accuracy of Tax PractitionersOur aim in this section is to identify practitioners whose observed AUR discrepancy rate exceeds the rate that would be expected if clients were drawn at random from the population of taxpayers who use a preparer. The approach taken is closely related to Snijders and Borgatti (1999). They describe how resampling methods can be used to generate nonparametric statistical measures for one-mode networks. A one-mode network is where
Evaluating Preparation Accuracy of Tax Practitioners 83
all network vertices (nodes) represent one type of object (e.g., persons). Our approach differs from Snijders and Borgatti (1999) in that we employ a two-mode network with separate vertices for tax practitioners and Zip Codes.
Bootstrap ResamplingBootstrap resampling is only one of a number of techniques (e.g., jackknife, delta) used to evaluate the precision of sample statistics when the underlying distribution is unknown. Originally popularized by Efron (1979), the basic idea of the bootstrap method is that a sample containing N observations contains all of the information of the underlying population. These data are resampled with replacement wherein each artificial sample contains N ob-servations. A sampling distribution is created by drawing multiple samples and computing the statistic of interest (e.g., median, mean) for each sample. Using the sampling distribution data, and assuming approximate normality, one can compute the standard error for the test statistic using conventional methods, such as a t-test.
An alternative approach that does not rely on the normality assump-tion is to use the bootstrap sampling distribution directly to calculate the probability of obtaining an observed density as large as actually observed assuming the null hypothesis. In this case, we evaluate proportions based on the count of bootstrap samples that have a test statistic larger than the observed value. This is sometimes referred to as the percentile method and is one of several methods for obtaining approximate confidence intervals (Efron, 1981).
In mathematical terms, given a set of observations X = (X1…Xn ), we can construct a bootstrap sampling distribution (X *) using the following two-step process:
1. Draw i1, ..., in independently from the uniform distribution on {1,..., n}.
2. Set X j (X( )ji
ji
ji
jn
XXXX ,,,21= ) for j = 1,…, m and X * = (X1…Xm
).
The bootstrap sample X j is constructed by drawing n observations with replacement from the original sample X1…Xn. In principle, this means a bootstrap sample could consist of the same value repeated n times. Howev-er, the probability of this occurring is quite small, as the number of different bootstrap samples available is nn (Adibi, Cohen, Morrison, 2004). The boot-strap principle assumes X = (X1…Xn) is a random sample from a distribu-tion P, and the sample statistic ^θ = s(X) is an estimation for the population parameter θ. Finally, ^θ* = s(X *) is the bootstrap replication of θ.
Bloomquist, Albert, and Edgerton84
Sample SizeEfron (1979) points out that the bootstrap method correctly estimates (as-ymptotically) the value of a known population parameter. The minimum number of samples required to obtain reasonably accurate estimates depends on the parameter of interest. Efron and Tibshirani (1986) show a sample size of 100 is adequate to compute a coefficient of variation. However, they recommend a minimum sample size of 1,000 to compute nonparametric confidence intervals. This makes intuitive sense because confidence inter-vals typically are at the extremes of the distribution so that a large number of generated values are needed to adequately characterize the tail region.
Bootstrap ProcedureTo perform the bootstrap procedure, a two-mode network is constructed that consists of tax practitioners and taxpayers aggregated by five-digit Zip Code. Network links represent the number of clients from each Zip Code using the services of different tax preparers. Figure 1 displays a hypothetical two-mode network consisting of five preparers (with hypothetical identifiers) and four Zip Codes.
Figure 1. Bipartite Graph of Network of Five Tax Preparers and Four Zip Codes
Preparers Zip Codes
11490
14775
14980
15168
15348
20116
20134
20143
20158
12
45
55
14
20
7119
103
19
Evaluating Preparation Accuracy of Tax Practitioners 85
For each preparer in our sample, we compute the mean expected AUR discrepancy rate and the 95-percent confidence interval. To do this, we generate 1,000 bootstrap samples with each sample drawn from Zip Codes in the same proportion as the preparer’s clientele. This approach, known as stratified bootstrap resampling, reduces the probability of obtaining biased estimates when bootstrap samples are generated from data not in the original sample. For example, referring to preparer 11490 in Figure 1, a single sam-ple consists of 12 observations from Zip Code 20134 and 45 observations from Zip Code 20143. For each observation, a uniform random number (0 ≤ u < 1) is generated. If the value of u is less than or equal to the Zip Code AUR discrepancy rate (Dzip), then we assign an AUR discrepancy case to the preparer; otherwise, we assume that taxpayer does not have an AUR discrep-ancy. For sample j, we compute the mean discrepancy rate for preparer k ( j
kD ) as:
{ }1,0where11
∈∑==
ij
k xixn
Dn
i
This procedure is repeated 1,000 times, and the bootstrap replication of the population mean for each preparer k (i.e., the expected discrepancy rate) is calculated as follows:
000,1where1ˆ1
* =∑=θ=
NDN
N
j
jkk
The one-tailed 95-percent confidence interval is obtained by sorting the 1,000 observations in ascending order and selecting the cutoff as the value of the 950th observation.
Bootstrap versus Population MeasuresAn alternative to the bootstrap method is to compare preparer discrepancy rates to the Zip-weighted population average for all Zip Codes in a prepar-er’s market area and select the preparer if it exceeds the average. While this approach is somewhat simpler to implement from a computational perspec-tive than bootstrapping, it also likely will identify many more preparers with “significant” discrepancy rates than an approach based on selecting preparers who exceed the 95-percent confidence interval. In addition, the bootstrap method offers greater flexibility should researchers wish to use a differ-ent cutoff value, say the 99-percent confidence interval, in order to further isolate preparers with the most extreme discrepancy rates. Therefore, while
Bloomquist, Albert, and Edgerton86
population-based measures may be simpler to implement computationally, we believe bootstrap resampling offers greater flexibility by enabling the researcher to specify alternative cutoff values (confidence intervals) for identifying preparers.
Case StudyIn this section, we demonstrate our methodology using PY 2006 tax return data for the State of Connecticut. Our metric of preparation accuracy is the fraction of tax returns with a potential AUR discrepancy, otherwise referred to as the discrepancy rate.7 For this demonstration, we selected practitio-ners with 100 or more clients and at least 20 potential AUR cases. Our final sample included 1,178 preparers (1,014 with an EIN and 164 with a PTIN) who collectively had over 730,000 clients who filed Federal tax returns in the State of Connecticut in 2006. The median firm has 339 clients and a market area comprised of 54 Zip Codes. The average maximum number of clients from any one Zip Code was 23 percent, indicating that most pre-parers’ clients do not reside in a single Zip Code. The maximum preparer discrepancy rate is 54 percent, and the minimum is 4 percent. Finally, the median discrepancy rate for preparers in our sample is 14 percent compared to a State average of 13.5 percent (see Table 4).
Our data also include 519 Zip Codes ranging in size from 1 to 29,344 filers. The median Zip Code has 446 filers. The market area for the larg-est preparer (with respect to number of filers) includes 377 Zip Codes, and the smallest market area has 10 Zip Codes. Zip Code discrepancy rates are calculated from tax returns filed by individuals located in each Zip Code without regard to preparer used.8 The maximum Zip Code discrepancy rate is 100 percent, the minimum is 0 percent, and the median is 11 percent.
The study data are from the Entity and the AUR databases on the IRS Compliance Data Warehouse (CDW). These two data sources separately provide the total number of returns filed and the number of AUR returns by preparer and by Zip Code. The data were formatted into a comma-separated flat file with each line (record) of the file representing one practitioner. The field layout for each record is as follows:
7 Our discrepancy rate measure includes both positive and negative discrepancies. Although one could select only discrepancies in one direction (e.g., underreporting), the intended aim here is to reduce all errors regardless of source. Therefore, we include potential discrepancies from both overreporting and underreporting.8 However, the Zip Code discrepancy rate is calculated only from filers who used a paid preparer.
Evaluating Preparation Accuracy of Tax Practitioners 87
Field 1: practitioner identifier
Field 2: practitioner discrepancy rate (with two implied decimal places)
Field 3: number of Zip Codes in the practitioner’s market area
Field 4: first Zip Code identifier
Field 5: number of this practitioner’s clients from this Zip Code
Field 6: Zip Code discrepancy rate (with two implied decimal places)
Fields 4-6 are repeated for each Zip Code in this practitioner’s market area.
The input data file is processed by a program written in Java that per-forms the bootstrap resampling and computes summary statistics including mean, standard deviation, and the 95-percent confidence interval.
ResultsWe ran the bootstrap procedure on the 1,178 preparers in our dataset and sorted the output in descending order by number of excess AUR discrepancy cases for preparers exceeding the 95-percent confidence interval threshold. The number of excess cases is determined by multiplying each preparer’s number of clients by the difference between the observed and expected preparer discrepancy rates. We summarize results for the 50 preparers with the largest number of excess cases in Table 5. Among these 50 firms, the average (mean) number of clients was 957, the smallest firm had fewer than 150 clients, and the largest firm had roughly 3,000 clients.
Table 5 shows the 10 firms with the largest number of excess AUR dis-crepancy cases accounted for 2.6 percent of Connecticut filers with potential misreporting in 2006, as well as 4.7 percent of the approximately $5.8 bil-lion in net potential underreported amount.9 The top 50 firms accounted for 8.4 percent of potential AUR discrepancy cases and 11.4 percent of the net potential underreported amount. These results show that a small number of firms accounts for a significant percentage of taxpayers with a potential AUR discrepancy and a larger share of potential underreporting.
9 There were 39,025 unique preparer identification numbers (EINs and PTINs) in Connecticut in PY 2006.
Bloomquist, Albert, and Edgerton88
Preparers* Number Percent ($M) PercentTop 10 Firms 3,539 2.6% $271.6 4.7%Top 20 Firms 6,373 4.7% $384.1 6.6%Top 30 Firms 8,242 6.1% $543.4 9.3%Top 40 Firms 9,863 7.3% $625.6 10.8%Top 50 Firms 11,346 8.4% $665.3 11.4%Total 135,878 100.0% $5,816.5 100.0%*Ranked in descending order by number of “excess” filers with potential misreporting.
Returns with Potential Misreporting
Net Potential Underreported Amount
Table 5. Bootstrap Program Results for Connecticut Preparers, PY 2006
Benefits and Limitations of Bootstrap MethodologyThe primary benefit of this methodology is its low cost and ease of imple-mentation. The required data are available on existing IRS databases and can be extracted for the entire country with only a few lines of SQL code. The algorithm used to identify individual preparers is data-driven and is ap-plicable for most practitioners. However, because this method relies on Zip Code data to generate bootstrap sampling distributions, the analyst must take care to ensure a reasonable degree of independence between preparer and Zip Code observations. This condition is more likely to be met for midsize to larger firms. Even so, the proposed methodology should be thought of primarily as a screening tool and not as a technique for carrying out tests of statistical significance.
Summary and ConclusionThis paper investigated the extent to which the commercial tax preparation industry contributes to the number of inaccurately prepared returns. Such inaccuracies may negatively impact both the IRS and taxpayers through increased administrative costs, greater taxpayer burden, and possibly reduc-ing the level of voluntary compliance. We presented different measures for common types of errors encountered on individual tax returns including math errors and potential misreporting. We used these measures to describe aspects of return preparation accuracy for self-preparers and two different categories of tax practitioners: those with an EIN and those with a PTIN only. Finally, we proposed a bootstrap resampling methodology to identify individual preparers with high potential AUR discrepancy rates and demon-strated its use in a case study of preparers in the State of Connecticut.
Evaluating Preparation Accuracy of Tax Practitioners 89
Our data analysis found math errors were committed more frequently by self-preparers, but clients of paid preparers had a higher incidence of potential misreporting. There is a negative relationship between firm size and incidence of taxpayers with potential misreporting. The line items mis-reported most frequently include: wages, salaries, and tips, State and local income tax refunds, mortgage interest, and withholding.
The case study of Connecticut preparers found that a significant per-centage of potential AUR cases, as well as the associated potential net under-reported amount, can be attributed to a small number of preparers. Given this finding, we believe that a substantial reduction in the number of AUR discrepancies could be achieved by annually monitoring tax practitioners us-ing data-driven techniques like those proposed in this paper in combination with a program of outreach and education to the selected preparers. Assum-ing the program focused only on the top 2,000 tax practitioners nationwide (approximately two-tenths of 1 percent) with respect to “excess” number of AUR cases, we estimate such a program potentially could reach preparers who annually are responsible for over 715,000 potential AUR cases and $30 billion in net potential underreported income.10
AcknowledgmentsThe authors wish to thank Jim Bullis, Janet McCubbin, Mary-Helen Risler, and Professor John Scholz for comments on an earlier draft. However, the authors are responsible for any remaining errors or misinterpretations of data.
References
Adibi, J.; P. R. Cohen; and C. T. Morrison, Measuring Confidence Intervals in Link Discovery: A Bootstrap Approach, paper presented at the Tenth ACM SIGKDD International Conference on Knowledge Dis-covery and Data Mining, Seattle, WA, August 22-25, 2004.
Efron, B. (1979), Bootstrap Methods: Another Look at the Jackknife, The Annals of Statistics, 7(1), pp. 1-26.
Efron, B. (1981), Nonparametric Standard Errors and Confidence Intervals, The Canadian Journal of Statistics, 9(2), pp. 139-158.
10 This estimate assumes 7.3 percent of 9.8 million potential preparer AUR cases and 10.8 percent of $281 billion in net potential underreported income on preparer returns in PY 2006.
Bloomquist, Albert, and Edgerton90
Efron, B., and R. Tibshirani, (1986), Bootstrap Methods for Standard Er-rors, Confidence Errors, and Other Measures of Statistical Accuracy, Statistical Science, 1(1), pp. 54-75.
Internal Revenue Service, Report to Congress: IRS Tax Compliance Ac-tivities, Department of the Treasury, Internal Revenue Service, July 15, 2003.
Snijders, T. A. B., and S. P. Borgatti, (1999), Non-Parametric Standard Er-rors and Tests for Network Statistics, Connections, 22(2), pp. 161-170.
U.S. General Accountability Office (March 2000), Tax Administration: IRS Use of Nonaudit Contacts, GAO Publication GAO/GGD-00-7, Washington, DC.
U.S. General Accountability Office (2006), Paid Tax Return Preparers: In a Limited Study, Chain Preparers Made Serious Errors, GAO Publication GAO-06-563T, Washington, DC.
Impact of Taxpayer Representation on the Outcome of Earned Income
Credit AuditsJeff A. Wilson, Tom Beers, Amy Ibbotson, Mike Nestor, Mark Hutchens,
Carol Hatch, and Mark Everett, Internal Revenue Service
T he IRS administers the Earned Income Credit (EIC) to millions of taxpayers each year.1 An important aspect of effective tax adminis-tration is to ensure the accuracy of the EIC claims. One way the IRS
does this is by auditing some of the returns filed. The outcome of the audit presumably validates the taxpayers’ eligibility for the EIC. As a matter of fairness and effective tax administration, the IRS must work with taxpayers, and their representatives, to ensure that the EIC is accurately claimed.
The Taxpayer Advocate Service (TAS) wanted to look at these EIC audits to determine if using a representative impacted the outcome of the au-dit.2 Specifically, TAS wanted to know if the use of a representative enabled a taxpayer to keep his or her EIC, or at least retain a larger amount of it after the audit.
EIC audits represent approximately 43 percent of all IRS individual taxpayer audits.3 The vast majority of these taxpayers do not have profes-sional representation during the audit. This is perhaps not too surprising, given the income level of these taxpayers and their likely unfamiliarity in dealing with the IRS on issues involving complicated matters of tax law. Anecdotal reviews of EIC audits where EIC was disallowed show that, frequently, there is no significant evidence that the taxpayer was ineligible. Instead, the taxpayer failed to prove EIC eligibility.4 For example, when asked to provide school records to verify the 6 months residency require-ment, taxpayers often submit records for a single school year. Given that a typical school year overlaps 2 calendar years, this information is insufficient to prove residency to the IRS, but it is not evidence that the taxpayer is ineli-gible for the credit.
The law clearly places the burden of such proof on the taxpayer, but, if the taxpayer cannot sufficiently understand the rules, reaching the goal of a correct audit outcome is brought into question. TAS is compelled to ask if
1 More than 21 million filers claimed EIC in Tax Year 2002, EIC Fact Sheet for TY02 as of 12/31/03.2 For example, attorney, certified public accountant, enrolled agent, unenrolled agent, etc. 3 FY 2005 IRS Data Book Table 10 (42.9 percent). 4 W&I Research review of 43 closed EIC audits.
Wilson, Beers, Ibbotson, Nestor, Hutchens, Hatch, and Everett92
the lack of representation during an audit puts these taxpayers at an inherent disadvantage over those taxpayers who are represented.
Ideally, the IRS would be able to reach the right outcome on EIC eligibility regardless of the presence of a representative.5 As we will see in the body of this report, the use of a representative does appear to have a significant impact on the outcome of the audit and the amount of the EIC re-tained by the taxpayer. This finding suggests the IRS must work harder, and smarter, to reach an accurate resolution of EIC eligibility issues, particularly when the taxpayer does not have a representative.6
Given scarce resources, the IRS and taxpayers will be challenged to find a way to better verify EIC eligibility in an audit environment. The IRS simply cannot provide a representative for each taxpayer. TAS believes this study compels the IRS to find new ways of reaching out to those taxpayers who do not have representation. The awarding of EIC to ineligible taxpay-ers costs the Government billions of dollars; however, disallowing EIC to those taxpayers truly eligible for the credit is negatively impacting their already fragile financial well-being.
BackgroundPrior IRS studies indicate that a significant proportion of claimants histori-cally have not been entitled to the EIC. For example, of the estimated $31.3 billion in EIC claims made by taxpayers who filed Tax Year 1999 returns in 2000, it is estimated that between $8.5 billion and $9.9 billion (27.0 percent to 31.7 percent) should not have been paid.7 These estimates were derived by auditing a sample of 3,457 taxpayer returns that claimed the EIC. TAS is interested in knowing if taxpayers would have fared better (i.e., kept their EIC or lost less of their EIC) if they had obtained representation.
TAS recognizes the critical role that auditing serves in tax adminis-tration. IRS audits help ensure taxpayer compliance and protect the tax revenue base. However, TAS is concerned by the findings from recent focus groups and targeted interviews with taxpayer representatives regarding barri-ers taxpayers face during IRS audits. TAS conducted focus groups with tax-payer representatives at the 2005 IRS tax forums and also initiated targeted interviews with Low Income Taxpayer Clinic (LITC) attorneys to discuss problems with audit processes relevant to EIC. In particular, these groups
5 After controlling for self-selection by taxpayers who use a representative, the IRS would presumably find similar rates of EIC eligibility. 6 The IRS must also ensure that represented taxpayers do not unfairly receive EIC. 7 Compliance Estimates for Earned Income Tax Credit Claimed on 1999 Returns, Department of the Treasury, Internal Revenue Service, February 28, 2002. Tax Returns were filed in 2000 for TY1999.
Impact of Taxpayer Representation 93
sought to learn what barriers the representatives foresaw that prevented IRS and taxpayers from reaching the correct outcomes on EIC eligibility and amounts claimed. The representatives identified several barriers including inconsistent IRS requests for documentation; lost paperwork; and poor com-munication.8
TAS is concerned that these barriers are preventing the IRS from treat-ing taxpayers fairly. In particular, TAS wants to achieve a proper balance between EIC compliance and accurately determining taxpayers’ eligibility for the EIC. If these barriers are preventing the IRS and taxpayers from accurately determining the correct amount of EIC, the IRS may be inadver-tently denying taxpayers a credit they are legitimately entitled to receive.
EIC filers have several attributes that may hinder their ability to respond effectively to an audit.9 These attributes may impede communica-tion and understanding of requests made by the IRS during an audit of the taxpayer’s EIC. These problems are exacerbated by barriers raised in the aforementioned focus groups and interviews. TAS is concerned that these taxpayer attributes, and the previously discussed barriers, are leading the IRS to improperly deny taxpayers their EIC.
TAS recognizes the repercussions this may have on tax administra-tion. The National Taxpayer Advocate tasked TAS Research to explore the following issue:
Do taxpayers who have representation fare better in EIC audits than those who do not have representation?
An affirmative answer to this question would highlight the need to re-formulate IRS compliance programs that verify the EIC in such a way as to minimize the use of audits and/or modify the way the audits are conducted. This has the potential to impact tens of thousands of taxpayers who claim the EIC.
8 The National Taxpayer Advocate’s Findings from Correspondence Examination Focus Groups, IRS Tax Forums June-September 2005, December 2005 and Taxpayer Advocate Service’s Challenges for Taxpayers Claiming the Earned Income Tax Credit (EITC), From Interviews with Low Income Tax Clinics, September 2005. 9 Attributes of EIC filer include: less likely to speak English, less education, and lower income levels. See “Playing by the Rules, but Losing the Game–America’s Working Poor,” Urban Institute http://www.urban.org/ publications/410404.html (last viewed May 31, 2007). These attributes suggest that EIC taxpayers may be less likely to understand IRS correspondence and less able to afford representation (i.e., power of attorney) with IRS.
Wilson, Beers, Ibbotson, Nestor, Hutchens, Hatch, and Everett94
Research MethodsThe population studied in this analysis was comprised of TY 2002 returns audited for EIC issues. EIC returns were selected for audit through various means, including Dependent Database (DDb) processing, Discriminate In-come Function (DIF), and EIC Recertification procedures.10 Tax Year 2002 was chosen because it includes the effects of significant EIC tax law changes implemented that year. Additionally, using TY2002 allowed sufficient time to review case activities that occurred subsequent to the close of the initial audit. For this study, cases were selected from the Automated Information Management System (AIMS) closed case database by project code. The list of project codes used to determine EIC audit cases was obtained from the EIC Program Office. Some returns in these project codes were determined to have never claimed or received EIC, according to IRS Masterfile data, and were thus removed from our analysis. Some additional returns were re-moved from our study because insufficient data were available for analysis.11
The AIMS population data were supplemented with other individual tax return data to obtain such items as amount of EIC claimed by the taxpayer and allowed by the IRS, as well as income information from the return and such entity items as filing status and return preparation method. Gender data were also obtained from the IRS information received from the Social Security Administration. Lastly, the Compliance Research Initiative Tracking System (CRITS) was utilized to obtain additional data necessary to analyze the outcome of the audits.12 Most notably, the IRS Masterfile transactions for the credit and debit of EIC, and tax were obtained.13 These transaction data were utilized to determine the amount of EIC claimed by the taxpayer, allowed by the IRS during return processing, and ultimately allowed after the initial audit of the return. Masterfile transaction code data were also utilized to verify the presence of representation during the audit.
The population data were then split into two groups, those taxpayers with representation during the audit and those without representation. The determination of whether a taxpayer was represented during audit was made from data obtained from a special extract of the Centralized Authorization File (CAF) for TY 2002. The CAF data also identify the type of representa-tion.14 The CAF data were also cross-referenced with the Masterfile transac-
10 If EIC for any year after 1996 was denied or reduced for any reason other than a mathematical or clerical error, a Form 8862 is required to be filed with the next tax return if claiming EIC with qualifying children. 11 See data limitations in the following section. 12 CRITS data contain current IRTF and Masterfile data elements. 13 The IRS posts debits (i.e., tax assessments) and credits (e.g., EIC credit) to a taxpayer’s account with different codes so that the type of each debit or credit may be clearly identified. Separate codes are also used to denote other account activity, such as the authorization of a representative for a taxpayer. 14 For example, attorney, certified public accountant, enrolled agent, unenrolled agent, etc.
Impact of Taxpayer Representation 95
tion codes indicating the presence or removal of a representative. In a few cases, the CAF and Masterfile data were discrepant, and these cases were removed from the study population.15
The Examination start date and disposition date from the AIMS data were used to split transaction code data from the Masterfile into four time periods—before audit, first audit, second audit, and after audit.16, 17 Trans-action codes with cycles posting before the Examination start date were included in the before audit time period. Transaction codes with cycles posting between the Examination start date and the first audit disposition date were included in the first audit period. The second audit period includes transaction codes posting between the first audit disposition date and the second audit disposition date. Transaction codes after the last audit disposi-tion date were incorporated in the after audit period.
Representation, EIC change, and tax change were defined for each of the time periods.18, 19, 20 This report includes analysis using the before audit and first audit periods. TAS Research may, in the future, analyze the second audit and after audit periods. TAS Research also plans to look at the out-come of appealed EIC audits for represented and unrepresented taxpayers.
Unless otherwise noted, the findings are based on a dataset contain-ing 328,429 taxpayers. Of this number of returns, only 11,411 (3.6 percent) were represented in the original audit. The original study data contained over 360,000 returns with an EIC project code.21 However, as described in the following limitations section, several circumstances necessitated the removal of returns from the study.
LimitationsWhen analyzing the data, TAS Research discovered several anomalies in the data for the population of TY 2002 EIC taxpayers who were audited. Based
15 68 cases were removed for this reason. 16 The Examination start date and disposition dates were converted to cycle posting dates using Document 6209, Integrated Data Retrieval System (IDRS) and Automated Data Processing (ADP) Book. The Examination start date was in an YYYYMM format. To convert to a posting cycle, we assumed the audit started on the first day of the month. In addition, four cycles were added to both the start and disposition dates to account for the time delay between AIMS and IRTF postings. TAS Research based this decision on analysis of the data and consultation with knowledgeable Examination/AIMS personnel. 17 There were 545 taxpayers with two audit indicators, indicating the return was reviewed twice by the IRS. 18 Representation is noted on a tax module by transaction codes 960, 961, and 962. 19 EIC change was determined from transaction codes 764, 765, and 768. 20 Transaction codes 290, 291, 294, 295, 298, 299, 300, 301, 304, 305, 308, and 309 were used to compute tax change. 21 Data extracted as of June 2006.
Wilson, Beers, Ibbotson, Nestor, Hutchens, Hatch, and Everett96
on this analysis, returns with the following characteristics were eliminated from the population:
1. Duplicate AIMS taxpayer records;
2. Taxpayers who did not claim EIC on their tax returns or did not check the box on their tax returns to have the IRS compute EIC for them;
3. Taxpayers with a nonexamined (survey, accepted as filed) dis-posal code;
4. Taxpayers with undelivered audit notices were removed since they never participated in the audit process;22
5. Taxpayers whose filing status was Married Filing Separate (MFS). This group was eliminated due to incomplete information on changes to filing status (i.e., MFS to Head of Household);
6. Taxpayers with missing tax return data on the CRITS or Compli-ance Data Warehouse (CDW);
7. Taxpayers who filed a Form 1040X were removed due to insuf-ficient data regarding the claim; and
8. Taxpayers with inconsistent representation information on Mas-terfile (transaction code 960) and CAF data.23
During data analysis, TAS Research also observed instances in the data where the taxpayer did not have qualifying children, but EIC before audit and the change in EIC due to the audit were greater than the maximum amount of EIC allowed for taxpayers without children. To correct for this anomaly, we updated the number of qualifying children based on the EIC Table in Publication 596 for TY 2002.24
22 Undelivered mail was determined from the AIMS technique code field. 23 The CAF data file contains information from Form 2848, Power of Attorney and Declaration of Representative. For purposes of this study, a taxpayer was considered represented if the representative authorization appeared on both the CAF and the IRS Masterfile. 24 There were 22 of these cases.
Impact of Taxpayer Representation 97
Objectives
1. Determine if taxpayers with representation in EIC audits are more likely to be determined eligible for EIC (and to have a higher no-change rate) than taxpayers without representation in EIC audits.25
2. Determine if taxpayers with representation in EIC audits retain a greater proportion (measuring the proportion retained will help guard against the bias of one group claiming more EIC than the other) of the EIC originally claimed than taxpayers without repre-sentation in EIC audits.
3. Determine if the tax recommended (this measure will allow for an analysis of the effect of representation on related issues (i.e., filing status) also examined during EIC audits) for taxpayers with representation in EIC audits is less than the tax recommended for taxpayers without representation in EIC audits.
4. Determine the extent of the effect (measured by a regression analysis of EIC dollars reduced by audit) of representation on the outcome of EIC audits.
5. Compare return and other demographic characteristics of the EIC audit population with representation to those without representa-tion.
Research Findings
Objective 1: Determine if taxpayers with representation in EIC audits are more likely to be determined eligible for EIC (and to have a higher no-change rate) than taxpayers without representation in EIC audits.
Represented taxpayers are twice as likely to be found eligible for EIC and to have no changes made to their EIC.
25 No-changes audits are those in which the IRS does not adjust the returns based on the audit findings.
Wilson, Beers, Ibbotson, Nestor, Hutchens, Hatch, and Everett98
Table 1 depicts the percentage of taxpayers who retained at least some EIC after audit. Clearly, represented taxpayers were much more likely to retain their EIC after audit than unrepresented taxpayers. In fact, taxpayers who used a representative during the audit process are more than twice as likely to be determined EIC-eligible when compared to taxpayers without representation.26
Table 1. EIC Retained / Disallowed During Audit27
Percentage of Taxpayers with: Represented Unrepresented
No change in EIC28 47.3% 22.3%
EIC reduced 4.9% 3.3%
EIC disallowed in full 47.8% 74.4%
100.0% 100.0%
Source: IRTF TY2002 and CAF for TY2002
Figure 1. Impact of Representation on EIC Allowed During Audit
0%
10%
20%
30%
40%
50%
60%
70%
80%
No change inEIC
EIC reduced EIC disallowedin full
RepresentedUnrepresented
Source: IRTF TY2002 and CAF for TY2002
Likewise, Table 1 depicts that the “no change” rate for represented taxpayers is also more than double that for unrepresented taxpayers (47.3
26 The percentage of taxpayers retaining some EIC is 52.2 percent for taxpayers with representation compared with 25.6 percent retaining some EIC for taxpayers without representation. The difference between represented and unrepresented taxpayers is statistically significant at level .0001 (one-sided t-test). 27 The difference between represented and unrepresented taxpayers is statistically significant at level .0001 (one-sided t-test). 28 This “no change” rate includes taxpayers who actually received additional EIC as a result of the audit. This includes 1.0 percent overall of represented taxpayers and 0.3 percent overall of unrepresented taxpayers.
Impact of Taxpayer Representation 99
percent versus 22.3 percent). A comparison of the data in this table indicates that relatively few taxpayers remain eligible for EIC but receive a reduced amount. This circumstance is likely attributable to the fact that EIC eligibil-ity is mostly based on hard and fast rules regarding a child’s relation to and residency with a taxpayer. Accordingly, little middle ground remains for a partial allowance of EIC, underscoring the importance of the IRS reaching a correct audit determination.
The type of representative also has an impact on the change in the EIC received, as shown in Table 2 below. More than half, 52 percent, of taxpay-ers represented by attorneys and CPAs retain the full amount of their EIC claims. Taxpayers represented by generally less sophisticated, unenrolled agents retained EIC for their clients only 44.5 percent of the time. This finding implies that representatives with more training are better able to suc-cessfully represent their clients and suggests that minimum standards should be considered to enable a representative to practice before the IRS. Never-theless, it should be noted that taxpayers using representatives with fewer credentials still achieve considerably more favorable results than taxpayers without representation.
Table 2. EIC Retained/Disallowed During Audit, by Type of Representative
Attorney Enrolled Unenrolled Other or CPA Agent Agent Representative29 Total
Count 3,617 2,300 4,228 1,266 11,411
Percentage of taxpayers with no change in EIC30 52.0% 48.5% 44.5% 40.8% 47.3%
Percentage of taxpayers whose EIC was reduced 4.4% 4.6% 5.6% 4.7% 4.9%
Percentage of taxpayers whose EIC was disallowed in full 43.6% 46.9% 50.0% 54.6% 47.8%
100.0% 100.0% 100.1%* 100.1%* 100.0%
* Numbers add to more than 100.0 percent due to rounding.Source: IRTF TY2002 and CAF for TY2002.
29 The “Other Representative” category includes full-time employees (officers) of the taxpayer’s organization, fam-ily members, and enrolled actuaries. 30 This “no change” rate includes taxpayers who actually received additional EIC as a result of the audit. This includes 1.0 percent overall of represented taxpayers and 0.3 percent overall of unrepresented taxpayers.
Wilson, Beers, Ibbotson, Nestor, Hutchens, Hatch, and Everett100
Figure 2. EIC Retained/Disallowed During Audit, by Type of Representative
0%
10%
20%
30%
40%
50%
60%
No change in EIC EIC reduced EIC disallowed in full
Attorney or CPAEnrolled AgentUnenrolled AgentOther Representative
Source: IRTF TY2002 and CAF for TY2002.
Objective 2: Determine if taxpayers with representation in EIC audits retain a greater proportion of the EIC originally claimed than taxpayers without representation in EIC audits.
Represented taxpayers retain more of their EIC.
The prior section focused on the percentage of taxpayers whose EIC was reduced or remained the same. Another way to analyze the data is to look at the percentage of EIC dollars retained. Table 3 below shows that taxpayers with representation retained, on average, 50.2 percent of their EIC versus 24.0 percent for taxpayers without representation.
Table 3. Portion of EIC Retained During Audit31
Represented Unrepresented
Average percentage of original EIC retained 50.2% 24.0%
Source: IRTF TY2002 and CAF for TY2002
As in the prior section, taxpayers using representatives with more credentials receive more favorable outcomes. Table 4 shows that taxpayers who used an attorney or CPA retained 54.8 percent of their EIC during the
31 When looking at taxpayers whose EIC was not changed, the difference between represented and unrepresented was still more than 2 to 1 (4.9 percent represented to 2.0 percent unrepresented). The difference between repre-sented and unrepresented taxpayers is statistically significant at level .0001 (one-sided t-test).
Impact of Taxpayer Representation 101
audit, over 7 points higher than unenrolled agents and over 10 percentage points higher than for other representatives.
Table 4. Portion of EIC Retained During Audit, by Type of Representative
Attorney or CPA
Enrolled Agent
Unenrolled Agent
Other Representative Total
Count 3,617 2,300 4,228 1,266 11,411
Average percentage of original EIC retained 54.8% 51.1% 47.6% 43.5% 50.2%
Source: IRTF TY2002 and CAF for TY2002
The number of qualifying children is one of the key determinants of the amount of EIC to which a taxpayer is entitled. Table 5 shows that represent-ed taxpayers retain a greater share of their EIC over unrepresented taxpayers regardless of the number of children.
Table 5. Portion of EIC Retained During Audit, by Qualifying Children
Represented Unrepresented
No Qualifying Children 100.8%32 56.7%
One Qualifying Child 47.3% 19.6%
Two Qualifying Children 52.0% 28.1%
Source: IRTF TY2002 and CAF for TY2002.
Another consideration is the impact a given change has on the tax-payer. For example, perhaps the 50.2 percent of EIC retained by represented taxpayers is offset by the absolute amount of the reviewed credit because unrepresented taxpayers have higher claimed amounts. (In other words, disallowing in full an EIC of $100 will likely have less effect on a taxpayer than reducing a $4,000 credit by half).
Table 6 shows the averages for EIC reviewed, changes, and net final amount. The first observation we can make is that represented and unrepre-sented taxpayers have similar before-audit EIC amounts, a difference of only $66. Second, the average EIC disallowed is $669 higher for unrepresented taxpayers. The overall result is that taxpayers with representation retain $735 more than taxpayers without representation, despite having an initial EIC of only $66 more.
32 These taxpayers received more EIC after audit than originally allowed by IRS after return processing.
Wilson, Beers, Ibbotson, Nestor, Hutchens, Hatch, and Everett102
Table 6. EIC Amount Before and After Audit33
Average EIC Amount: Represented Unrepresented Difference (Rep.—Unrep.)
Before audit $2,740 $2,674 $66
Disallowed during audit $1,369 $2,038 -$669
After audit $1,371 $636 $735
Source: IRTF TY2002 and CAF for TY2002
In summary, represented taxpayers retain more of their EIC in both percentage and absolute dollars over taxpayers without representation.
Figure 3. Amount of EIC Before and After Audit
$0
$500
$1,000
$1,500
$2,000
$2,500
$3,000
EIC claimed before Audit EIC disallowed by Audit EIC allowed after Audit
Represented Unrepresented
Source: IRTF TY2002 and CAF for TY2002
Objective 3: Determine if the tax recommended for taxpayers with representation in EIC audits is less than the tax recommended for tax-payers without representation in EIC audits.34
Fewer represented taxpayers owe additional tax.
The prior findings focus on the impact of representation on the EIC. There may be other issues addressed during an audit that can offset adjust-ments to the EIC. In this section, we investigate the impact of representation on the net tax resulting from the audit.
33 The difference between represented and unrepresented taxpayers is statistically significant at level .0001 (one-sided t-test). 34 This objective focuses only on tax change which is separate from changes in refundable credits such as EIC.
Impact of Taxpayer Representation 103
The average amount of additional tax due after audit for both repre-sented and unrepresented taxpayers is similar, as shown in Table 7 below. Nevertheless, there are significant differences in the percentage of taxpayers within these two groups who actually owe additional tax. Over 60 percent of the represented group owe no additional tax, while over 54 percent of unrepresented taxpayers owe additional tax at the conclusion of the audit.
Table 7. Tax Change During Audit35
Percentage of taxpayers: Represented Unrepresented
whose tax increased during audit 38.2% 54.4%
with no change in tax during audit 56.0% 36.5%
whose tax decreased (refund) during audit 5.8% 9.1%
Average Tax Change (increase) during audit $291 $304
Source: IRTF TY2002 and CAF for TY2002
The one positive result for unrepresented taxpayers is that 9.1 percent of them received a reduction in tax due versus 5.8 percent for represented tax-payers. However, this needs to be considered in combination with the greater share of unrepresented taxpayers (54.4 percent) who pay additional tax.
Objective 4: Determine the extent of the effect of representation on the outcome of EIC audits.
Even when attempting to control for self-selection bias, representation was still found to be a significant factor in the audit outcome.
The prior findings show significant differences between represented and unrepresented taxpayers. Nevertheless, the possibility exists that these differences are the result of inherent differences between those taxpayers who seek representation versus those taxpayers who do not.
Our goal was to determine whether or not representation is a factor in EIC loss due to audit. Initially, we planned to develop a linear regression model to estimate EIC loss using representation as a covariate as well as several other factors and thus test our hypothesis. Our data provided us with two hurdles to overcome before we could test our hypothesis. One problem was that the data are not derived from a randomized trial. Taxpayers were not provided the treatment of representation randomly; rather, taxpayers chose to be represented on their own. This could introduce self-selection bias and result in the represented group having different characteristics than 35 The difference between represented and unrepresented taxpayers is statistically significant at level .0001 (one-sided t-test).
Wilson, Beers, Ibbotson, Nestor, Hutchens, Hatch, and Everett104
the unrepresented, thus introducing bias into estimators of our regression. Second, our data were not normally distributed with respect to EIC loss. In particular, we had a large number of taxpayers who incurred no loss, and we felt that we may not meet the assumptions of linear regression. We did not want to delete taxpayers with no loss in EIC after audit since no loss is a result of an audit. Considering both issues, we determined that we needed to account for selection bias, and it would be unlikely that we could success-fully use linear techniques. We chose to use propensity score matching to account for selection bias and use a logistic regression model to estimate the probability of EIC loss or no EIC loss using represented as a covariate and using the matched data.36
After examining whether representation was a factor in EIC loss, we also looked at whether or not representation is a factor in the amount of EIC loss for taxpayers who lose EIC due to audit using a linear regression. Removing taxpayers with no EIC loss helped our data conform to the as-sumptions of linear regression. The linear regression gives us a sense of the magnitude of representation’s effect on EIC loss for those who lose EIC.
Propensity score matching will help even out the differences in char-acteristics between the represented and unrepresented. A brief summary of our methods follows in the body of this report to better explain the results; however, a more complete technical explanation is contained in Appendix 1.
The first step is to estimate the propensity or probability of a taxpayer to be represented using the data we have as covariates in a logistic regres-sion. The next step is to segment the data into deciles of propensity score. Each decile contains taxpayers who are similar with respect to the covari-ates. If our logistic regression is viable, the lower deciles will have a smaller number of represented taxpayers, and the higher deciles will have a larger number of represented taxpayers. In order to even out the number of repre-sented and unrepresented in each decile, we randomly sampled the majority group within each decile to match the number of the minority group. The data remaining after sampling are our matched data that we use to develop regressions to determine if representation is a factor in EIC loss due to audit. Statistical tests are used to examine the extent to which the above matching procedures resulted in samples of represented and unrepresented taxpayers who were more comparable in terms of baseline characteristics.
As stated above, the first step of the propensity score matching is to de-velop propensity scores for representation. The percentage of those taxpay-ers with representation in a dataset is rather small at around 4 percent. Any
36 For specific details regarding the utilization of propensity score matching with these data and for greater detail on the subsequent logistic regression models, see Appendix 1.
Impact of Taxpayer Representation 105
model developed with this data set would grossly underestimate the prob-ability of representation. Therefore, before we developed the logistic regres-sion for estimating the probability of representation, we randomly sampled the unrepresented so that the number of unrepresented roughly equaled the number of represented (50.3 percent versus 49.7 percent, respectively). We eliminated audit cases closed as “no shows.” Since audits for unrepre-sented taxpayers were nearly twice as likely to be closed without taxpayer response and since, by definition, the presence or absence of a representative is irrelevant in these cases, we felt removing these cases resulted in a fairer comparison of the two groups. We also used only cases with a Dependent Database (DDb) score for our sample to better account for potential compli-ance differences between the groups.37 Our logistic regression model for estimating the propensity of representation used paid preparer, Schedule C, age, form type, gender, adjusted gross income (AGI) bands, and EIC criteria as the covariates. A 50-percent sample was used to train the model.38 The overall accuracy of this model was around 64 percent. The results of the propensity score matching can be seen in Table A-1, Appendix 1.
After completing the first logistic regression model to estimate the pro-pensity of representation, we developed a second logistic regression model to estimate the effect of representation on EIC loss. This model utilized rep-resentation, DDb score Married Filing Joint (MFJ) filing status, and specific EIC project codes as covariates. A 50-percent sample was used to train the model. The overall accuracy of the model is 66 percent. We determined that representation is a factor in predicting the loss of EIC, and we estimate that, if a taxpayer is represented, the odds increase by a factor of over two that he or she will not lose EIC during audit. As a comparison, for DDb score divided by 10, we estimate that, for every 10-point increase in DDb score, the odds of some EIC loss increase by a factor of 1.12. See Table A-2, Ap-pendix 1.
As stated above, after we determined whether representation is a fac-tor in EIC loss, we looked at the relationship of representation to the dollar amount EIC lost for taxpayers who lose some EIC due to audit. Eliminat-ing the taxpayers with no EIC loss normalized the distribution of EIC loss enough to warrant an attempt at a linear regression. Represented, DDb score, category of EIC audit issue, gender, AGI, and number of qualifying children were used to estimate EIC lost during audit. Represented is signifi-
37 The Dependent Database (DDb) is a tool that identifies noncompliant Earned Income Tax Credit (EITC) and dependent issues through the use of internal and external data elements and provides the ability to freeze refunds. The database is rule-driven. If a rule condition is met as returns are processed through the DDb rule filtering process, the rule “fires,” and the return is flagged for examination. Current procedures score the majority of all EIC returns; however, for Tax Year 2002, fewer returns were scored (about 60 percent of our study cases). 38 The overall accuracy of the regression is 64 percent with c statistic of .644 (area under the ROC).
Wilson, Beers, Ibbotson, Nestor, Hutchens, Hatch, and Everett106
cant and has a coefficient estimate of $127. Noteworthy, DDb score, AGI, and number of qualifying children were not significant in the model. See Appendix 1 for details of the linear regression.
Objective 5: Compare return and other demographic characteristics of the EIC audit population with representation to those without represen-tation.
Although some notable demographic differences exist between taxpay-ers who use and do not use representation during EIC audits, the posi-tive effect of representation is still evident.
This objective was originally envisioned before the more rigorous approach to addressing self-selection bias was adopted for the preceding objective. The plan was to compare the demographic characteristics of two groups to determine the potential self-selection bias. The most significant differences between the taxpayers represented and unrepresented during audit are shown in Table 10.
Table 10. Most Significantly Different Characteristics Between Represented and Unrepresented (During Audit) EIC Taxpayers
Characteristic Represented Unrepresented
Married Filing Joint FS 18.8% 8.7%
Head of Household FS 70.8% 78.9%
Male filers 57.0% 66.3%
Used paid preparer on return 86.0% 74.4%
Form 1040 69.6% 56.7%
Form 1040A 30.4% 43.2%
Schedule C 50.0% 36.3%
Two qualifying EIC children 60.1% 49.6%
No Show/No Response 19.7% 37.7%
Source: IRTF TY2002 and CAF for TY2002, and SSA Data Master-1file 2006
Three of these factors (gender, paid preparer, and form type) were shown to be significant in the propensity score matching. Additionally, a
Impact of Taxpayer Representation 107
composite of two more of the above variables (number of children and the married filing joint filing status) was also shown to be a significant factor in the propensity scoring. Two of these factors (presence of Schedule C and the MFJ filing status) were shown to be significant in the analysis of the selection bias in the preceding objective. Not unexpectedly, Table 10 also indicates that represented taxpayers are significantly more likely to respond to the audit notice than unrepresented taxpayers.
In general terms, taxpayers with representation are more likely to use the MFJ filing status, use a paid preparer, file Form 1040 with a Schedule C, have a balance due at the time of filing, and have two qualifying children for EIC. Taxpayers without representation during an audit are more likely to be filing as Head of Household (HOH), filing Form 1040A, claiming the maxi-mum amount of EIC, and not responding to IRS notices and/or not showing up for the audit.
To further explore the relationship between the factors in Table 10 and the effect of representation, we created several tables which cross-tabulate these factors with the audit results.
Table 11. Preparer Type: Average EIC Amount Disallowed (Reduced) After Audit39
Represented Unrepresented
Overall Average40 $1,369 $2,038
Self-Prepared Returns $1,387 $2,056
Paid Preparer Returns $1,366 $2,032
Source: IRTF TY2002 and CAF for TY2002
Table 11 shows that paid preparer returns retained a slightly higher amount of the EIC after audit than self-prepared returns; however, the dif-ferential between represented and unrepresented taxpayers remains. Some might argue that represented taxpayers retain more of their EIC because their return was more accurate in the first place because the return was completed by a paid preparer.41 However, the data show that the impact of having a representative is larger than whether a paid preparer was used on the original return.
39 The difference between represented and unrepresented taxpayers is statistically significant at level .0001 (one-sided t-test). 40 Overall, represented taxpayers had 50 percent of their EIC disallowed, compared to 76 percent for unrepresented taxpayers. 41 The EIC under review during an audit is the net amount after math error processing that occurs when the tax return is filed.
Wilson, Beers, Ibbotson, Nestor, Hutchens, Hatch, and Everett108
Table 12. Number of Qualifying Children—Average Amount of EIC Disallowed
Qualifying Children
Average EIC Disallowed
Represented Unrepresented
No Children $26 $92
One Child $1,105 $1,739
Two Children $1,546 $2,353
Source: IRTF TY2002 and CAF for TY2002
Table 12 shows that represented taxpayers fare better across each pos-sible number of claimed eligible EIC children. As expected, more EIC is disallowed for returns claiming two children; however, represented tax-payers claiming two EIC children actually lose less EIC, on average, than unrepresented taxpayers claiming only one child.
Table 13. Gender—Average Amount of EIC Disallowed
Gender
Average EIC Disallowed
Represented Unrepresented
Female $1,279 $1,858
Married, Filing Joint Return $900 $1,100
Male $1,562 $2,229
Source: IRTF TY2002 and CAF for TY2002 and SSA Data Master-1 file 2006.
Males typically lose the largest amount of EIC during audit, while joint filers lose the least. Represented males; however, lose less EIC on the aver-age than unrepresented females.
Table 14. Filing Status—Average Amount of EIC Disallowed
Filing Status
Average EIC Disallowed
Represented Unrepresented
Single $1,520 $2,120
Married, Filing Joint Return $900 $1,100
Head of Household $1,472 $2,129
Qualifying Widower $1,111 $1,396
Source: IRTF TY2002 and CAF for TY2002
Impact of Taxpayer Representation 109
Single and head of household filers have the largest EIC change, while married filing joint taxpayers have the lowest average audit change. Repre-sented taxpayers fared better than their unrepresented counterparts in each filing status.
Table 15. Adjusted Gross Income—Average Amount of EIC Disallowed
Adjusted Gross Income
Average EIC Disallowed
Represented Unrepresented
Less than $5,000 $810 $1,051
$5,000 to $9,999 $1,496 $2,189
$10,000 to $14,999 $1,716 $2,495
$15,000 to $19,999 $1,378 $1,990
$20,000 to $24,999 $935 $1,261
$25,000 to $29,999 $433 $548
$30,000 and Over $167 $209
Source: IRTF TY2002 and CAF for TY2002
Those AGI categories which correspond to the highest EIC entitle-ment are the same categories that generate the highest average EIC Change. Again, represented taxpayers have a lower EIC audit change amount across each AGI range.
Table 16. Schedule C—Average Amount of EIC Disallowed
Schedule C Filed
Average EIC Disallowed
Represented Unrepresented
No Schedule C $1,306 $1,986
Schedule C $1,432 $2,129
Source: IRTF TY2002 and CAF for TY2002
Taxpayers represented in an EIC audit are much more likely to have filed a Schedule C. These represented taxpayers also have a significantly smaller average EIC change.
Wilson, Beers, Ibbotson, Nestor, Hutchens, Hatch, and Everett110
Conclusions and RecommendationsConclusions
Taxpayers with representation are twice as likely to be found eligible for the EIC as taxpayers without representation during the audit process.
Over one-half of all taxpayers with representation emerged from audits with their full EIC intact, whereas less than 1 in 4 taxpayers without representation kept their full EIC.
Taxpayers without representation were more likely to end up ow-ing additional tax than taxpayers with representation (54 percent versus 38 percent).
Taxpayers without representation were less likely to end up with no change in tax after audit than taxpayers with representation (37 percent versus 56 percent).
Even when controlling for self-selection bias, taxpayers without representation are still two times more likely to have their EIC reduced than taxpayers with representation.
Although some significant differences exist between taxpayers with and without representation during EIC audits, these differ-ences do not overcome the positive effect of representation on the audit outcome.
RecommendationsTAS’s initial recommendation is that this study be replicated on a more recent tax year to see if the presence of a taxpayer representative during an EIC audit continues to have a significant positive impact on the outcome.
Appendix 1Propensity score matching is a two stage process.42 In the first stage, the propensity score, which is the likelihood (or propensity) of a case being in the represented group, is estimated for each case through a logistic regres-sion model. The represented and unrepresented groups are each then sam-pled to identify subsamples with similar distributions of this estimated score.
42 See Rosebaum, P. R. and D. B. Rubin, Biometrika 1983:70, pp.41-55.
Impact of Taxpayer Representation 111
As shown by Rosenbaum and Rubin, such matching results in subsamples of the study and control group with similar distributions of observed risk factors. Cochran states that creating five strata removes 90 percent of the bias due to the stratifying variable or covariate, and Rosenbaum and Rubin claim that stratification on propensity score removes even more than this in each covariate used in the propensity model.43 While researchers typi-cally only check to see that the matched subsamples have similar means for all-important risk factors, more sophisticated checks on the comparability of their multivariate distributions can also be done. In the second stage, standard analytic techniques are used to fit a response model to the matched subsamples and, ultimately, to estimate the effect of the representation on the outcome. The propensity score method typically has less precision, due to reduced sample sizes, but this limitation is generally of less concern than the worry over possible bias from a misspecified model. It should also be noted that propensity score matching does not address or resolve problems due to imbalances in unmeasured factors.44
One may consider whether the model used to estimate the propensity score might itself be misspecified, introducing a new set of problems for the analysis. Drake used simulations to compare consequences of misspecifica-tions of the propensity score to those of misspecified response models.45 She concluded that the propensity score ‘‘seems preferable when considering model misspecifications in the response model, particularly so because an incorrect propensity score model has smaller bias’’ and ‘‘generally, the simu-lations seem to indicate that the value of the propensity score lies primarily in guarding against model misspecifications.’’46
In the first stage of our model, we developed a logistic regression using paid preparer, Schedule C, age, Form 1040, gender, AGI bands, and EIC criteria to predict the propensity to be represented. A 50-percent sample was used to train the model. The overall accuracy of the regression is 64 percent with c statistic of .644 (area under the ROC). We split the data into deciles based on the propensity scores. To develop the matched samples, within each decile, a random sample of the larger group (represented or unrepre-
43 See Cochran, W. G., “The Effectiveness of Adjustment by Subclassification in Removing Bias in Observational Studies,” Biometrics, 24, pp. 205-213. 44 Whole paragraph footnoted to M. A. Posner, A. S. Ash, K. M. Freund, M. A. Moskowitz, and M. Swartz, “Com-paring Standard Regression, Propensity Score Matching, and Instrument Variable Matching Methods for Determin-ing the Influence of Mammograms and Stage Diagnosis. 45 See Drake, C. (1993), “Effects of Misspecification of the Propensity Score on Estimation of Treatment Effect”, Biometrics, 49, pp. 1231-1236. 46 Whole paragraph footnoted to M. A. Posner, A. S. Ash, K. M. Freund, M. A. Moskowitz, and M. Swartz, “Com-paring Standard Regression, Propensity Score Matching, and Instrument Variable Matching Methods for Determin-ing the Influence of Mammograms and Stage Diagnosis.”
Wilson, Beers, Ibbotson, Nestor, Hutchens, Hatch, and Everett112
sented) was taken to get the same number in the smaller group. The matched subsamples were then combined to create the matched dataset which we used for the second step. As depicted in the following table, to examine the extent to which the above matching procedures resulted in samples of users and nonusers more comparable in terms of baseline characteristics, statisti-cal tests were used; p-values for chi-squared tests of independence were calculated for categorical risk factors, and p-values for independent sample t-tests for equivalence of population means were calculated for continuous risk factors.
Table A-1
Predicted represented
Prematching Postmatching
Rep Unrep Rep Unrep
Decile 1 229 678 229 229
Decile 2 273 617 273 273
Decile 3 345 563 345 345
Decile 4 356 544 356 356
Decile 5 422 484 422 422
Decile 6 460 443 443 443
Decile 7 523 354 354 354
Decile 8 577 337 337 337
Decile 9 623 296 296 296
Decile 10 677 210 210 210
Total 4,485 4,526 9,011 3,265 3,265 6,530
Average Primary Age 37.2 34.4 p<.001 35.56 35.73 p=.495
For the second stage of our model using the matched data, we devel-oped a logistic regression model using representation, Dependent Database (DDb) score, Married Filing Joint (MFJ) filing status, and specific EIC project codes to predict the propensity of EIC lost or no change or positive change in EIC.47, 48 A 50-percent sample was used to train the model. The overall accuracy of the model is 66 percent with c statistic .609. Table A-2 below shows the coefficients and odds ratio (EXP(B)).
Table A-2: Significant Factors Determining Likelihood of Retaining EIC After AuditFactor Coefficient Odds Ratio
Representation -.745 0.47
DDb Score (divided by 10) 0.12 1.12
Audit Project Code 623 .510 1.67
Married Filing Joint Filing Status -.904 0.41
AGI Between $9,470 and $13,172 -.118 0.82
Audit Project Code 624 -.333 0.72
Constant .010 1.01
Source: IRTF TY2002 and CAF for TY2002 &DDb
47 We limited our regression analysis to cases with a DDb score to better account for compliance differences between represented and unrepresented taxpayers. 48 A score assigned to returns depending on specific taxpayer and return circumstances.
Table A-1—Continued
Wilson, Beers, Ibbotson, Nestor, Hutchens, Hatch, and Everett114
The estimated coefficient (B) of representation is negative with an odds ratio of 0.47. So, it is estimated that, if a taxpayer is represented, the odds increase by a factor of two (1/.47) that he or she will not lose EIC during audit. As a comparison, DDb score divided by 10 has an estimated positive coefficient with an odds ratio of 1.12, so that it is estimated that, for every 10-point increase in DDb score, a taxpayer’s odds of EIC lost is increased by factor of 1.12, which is less than if represented.
The model predicts that a taxpayer without representation has more than twice the odds of a represented taxpayer to have the EIC reduced. This is true controlling for filing status, DDb score, adjusted gross income, and type of audit issue.
After examining the effect of representation on the likelihood of retain-ing all EIC after audit, we then explored a linear regression model to esti-mate the effect of representation on the amount of EIC lost after audit. We developed this model from the same matched sample utilized for our prior logistic regression model. Eliminating the no change EIC cases eliminated the distribution spike at zero in EIC loss. Represented, DDb score, category of EIC audit issue, gender, AGI, and number of qualifying children were used to estimate EIC lost during audit. DDb score, AGI, and number of qualifying children were not significant in the model.
Table A-3 below shows the unstandardized coefficients representing the effect of significant factors in the model.49
Table A-3: Significant Linear Regression Factors Estimating Amount of EIC Lost During Audit
Factor Coefficient
Earned Income Credit (IRS Computation) .660
Representation -126.89
AGI Between $9,470 and $13,172 368.10
AGI Less Than $9,470 301.51
MFJ Fil. Stat; 2 Qual. Ch., AGI> 34K 153.14
Female Gender -96.41
Constant 541.2
Source: IRTF TY2002 and CAF for TY2002 & DDb
49 Significance of factors was determined at the .05 level. The adjusted R-Square was .52.
The Obstacles of Voluntary Compliance from the Taxpayer’s
PerspectiveBeanna J. Whitlock, The National Society of Tax Professionals
T he National Society of Tax Professionals (NSTP) is a nonprofit orga-nization founded in 1985, dedicated to “serving the tax profession-al.” With the goal of organizing the tax professional community,
individuals in the business of tax, and assisting them to achieve a standard of recognition long overdue, the National Society of Tax Professionals reached out to certified public accountants, attorneys, enrolled agents, financial plan-ners, and tax professionals/accountants.
The mission of NSTP is to serve tax professionals and the taxpaying public by promoting the highest standard of competency, ethics, and practice as a National Membership Organization.
In early February 2007, the members of NSTP were asked to be partic-ularly alert when, during the 2007 filing season, they encountered taxpayers who were having difficulty in voluntarily complying with the Tax Code. Of the 5,000 members of NSTP, approximately 100 responded with anecdotes regarding specific taxpayers and their issues. Responses to the survey were received from April 18, 2007, through and including April 30, 2007.
On average, each tax professional member of NSTP prepares 650 tax returns. From the responses of 100 members, the total number of taxpayers included in the sampling would range from 130,000 if all were jointly filing taxpayers to 65,000 if all were single-filing taxpayers. Thus, approximately 100,000 individual taxpayers are estimated to be represented by the 100 preparers who provided feedback following the 2007 filing season.
Names and identifying numbers of taxpayers included in the survey were not made available, and every effort has been expended not to disclose the identities of taxpayers, as well as to ensure confidentiality between the tax professional and the client.
When reviewing case-specific data, it becomes clear that there is no single issue that is deemed to be an obstacle to voluntary compliance but rather an intricate set of roadblocks that take the taxpayer from the freeway of voluntary compliance to a detour which never leads back to the compli-ance highway. Some taxpayers deliberately exit the freeway of compliance, looking for an easier road to travel, while others simply take a side trip but eventually get back to the compliance freeway, having paid the price of pen-alty and interest for their divergence. Many taxpayers struggle desperately
Whitlock116
to find a way back but have neither a good map nor someone to show them the way. In some instances, there appears to be no way to get back to the compliance highway. These taxpayers pose the greatest challenge.
While the data indicate that noncompliance is case-specific, the data reflect that taxpayers incur obstacles to voluntary compliance under the fol-lowing general categories:
Complexity of the tax law;
Procedural difficulty with IRS, including communication;
Burdensome reporting and tax filings;
Unreasonable penalty and interest assessments;
Insufficient encouragement to file and pay timely;
Perceived lack of importance or priority; and
Miscellaneous.
Complexity of the Tax LawTwenty-one percent of preparers responded that their clients named com-plexity of the tax law as the obstacle to voluntary compliance.
Case examples include:
Passive loss rules, particularly involving rental property and the phaseout of deductibility of passive losses based on the income of the taxpayer;
Withholding on household workers, when to withhold, and alter-natives based on earnings;
Investment rules, various capital gain rates based on type of prop-erty sold, and length of time property held for investment;
Retirement plan contributions, various limits, rules, and phaseout amounts;
Threshold limitations, various limits of income eliminating de-ductions and credits; and
Alternative Minimum Tax–AMT also surfaced as a major im-pairment to compliance, named by 21 percent of participating preparers. Cited as an example is the taxpayer who reduced W-2 withholding, taking advantage of the hybrid vehicle credit only to
The Obstacles of Voluntary Compliance 117
be assessed AMT eliminating the credit, resulting in additional tax liability;
Foreign taxpayers with H2B Visas are not aware that they can report business expenses on Form 2106, resulting in additional tax due;
Basis, calculation, and the various methods based on acquisition manner;
Earned Income Tax Credit, coupled with the change in the defini-tion of “child,” makes regulations difficult to understand and examples in publications not applicable to the taxpayer’s set of complex circumstances;
Various due dates for various reporting forms, such as 4/15 for partnership returns, makes late filing of 1040s almost certain;
Payroll tax withholding, using rates for a single taxpayer, often results in insufficient tax withheld when there is a two-income earning family. Often, the taxpayer has no savings to make up the additional tax due, resulting in a collection problem for the taxpayer and IRS; and
Complexity of the debt forgiveness rules, the choice of how to report a child’s investment income, as well as conflicts between Federal tax law and decisions of judges, particularly in the case of a divorce proceeding, are all cited as problematic to compliance by taxpayers.
Procedural Difficulty with IRSSixteen percent of responding preparers served taxpayers who named pro-cedural difficulty with IRS as the top reason for difficulty with voluntary compliance.
Case examples include:
Communications from IRS are not specific to the issue and often provide information that bears no relevance to the problem requir-ing resolve;
Assistance in walk-in sites is grossly inadequate. The lack of Spanish-speaking assistors results in insufficient resolution of issues;
Whitlock118
IRS refuses to take responsibility when errors, including process-ing errors, are theirs. Procedure usually involves the IRS issuing a notice of deficiency rather than contacting the taxpayer about a mismatch with information documents or other similar matters;
The Offer in Compromise (OIC) is no longer a viable means for a taxpayer returning to voluntary compliance. The procedural rule changes coupled with the centralized (Memphis and Brookhaven) working of OICs removes the revenue officer from the location near the taxpayer, producing realistic economic environment ef-fects on the taxpayer; and
A vast number of taxpayers encountering compliance and pay-ment issues experience personal events so extraordinary that they are left unable to cope with circumstances of daily living let alone collection issues with IRS. The circumstances are such that, in the short-term, the problems created will result in long-term physical and economic disability. Some issues mentioned by tax-payers who reported to preparers participating in the survey are:
Alcoholism,
Drug abuse,
Depression,
Divorce,
Gambling,
Loss of a family member,
Lack of understanding, and
Others.
One percent of preparers, as an encouragement to voluntary compliance, cited the IRS Web site, www.irs.gov.
Burdensome Reporting and Tax FilingsEleven percent of preparers indicated that burdensome reporting and tax fil-ing requirements caused obstacles for voluntary compliance for their clients.
Examples include:
The various number of codes on Forms W-2 and 1099 when new forms are needed to clarify the income reported;
The Obstacles of Voluntary Compliance 119
As many major brokerage firms corrected 1099 reporting of divi-dends, qualified dividends, and interest earned multiple times dur-ing the filing season, taxpayers were required to file amended tax returns or delay filing until brokerages were confident their 1099 filings were correct. Additionally, taxpayers remarked that, often, the “corrected” 1099 was formatted much like their monthly bro-kerage statements and the taxpayer was unaware that a return was incorrect until notified by an IRS CP2000 notice;
Taxpayers purchasing hybrid automobiles, entitled to the energy credit, were not provided documentation by the automobile deal-erships. Without proof of purchase, taxpayers who had relied on the energy credit subsequently owed tax. A simplified reporting form would insure that taxpayers received the credit and that IRS had a matching document; and
Many tax professionals remarked on the growing problem of taxpayers who were previously W-2 employees being converted to 1099 employees, remaining in the same job and working for the same employer. The net result is that the taxpayer often does not understand the need to make estimated tax payments, both for Federal income tax, as well as for self-employment tax. Greater education and enforcement against participating employers are required to alleviate this impairment to compliance.
Unreasonable Penalty and Interest AssessmentsEleven percent of participating preparers indicated that taxpayers could pay outstanding tax assessments, but the penalty and interest were prohibitive. Taxpayers cited that payments made over the remaining collection statute would retire the debt but not all of the interest and penalty. IRS, in many instances, was unwilling to accept an installment agreement that would not retire all the outstanding debt, including interest and penalty.
Taxpayers repeatedly cited examples of the tax liability being created, either through capital gains or other unusual income production. Further examples included those of taxpayers whose incomes had been substantially reduced from the year the liability was incurred. In both cases, IRS applica-tion of penalty and interest was not an incentive to pay but a deterrent as it made the liability unrealistic for the taxpayer to resolve.
Responding taxpayers overwhelmingly indicated their willingness to pay the tax liability in full with a reasonable penalty for late payment.
Whitlock120
Insufficient Encouragement To File and Pay TimelyWebster’s New Collegiate Dictionary defines “taxpayer” as one who pays or is liable to pay a tax. In 1950, 53,060,098 taxpayers filed Form 1040. In 2005, 134,462,537 taxpayers filed Form 1040, representing an increase of 81,402,439 or 153 percent. In 1950, 6,865,387 taxpayers filed as sole proprietorships, including farmers. In 2005, 22,712,150 filed as sole pro-prietorships, including farmers, representing an increase of 15,846,763 or 231 percent. Proportionately, in 1950, 13 percent of American taxpayers were self-employed. In 2005, 17 percent of American taxpayers reported being self-employed, while the population of reporting taxpayers increased by 153 percent. Without question, the taxpayer of 1950 is a vastly different taxpayer from that of 2005 or 2007. Eight percent of preparers responding to the survey served taxpayers who indicated that the lack of incentive to file and pay taxes was an obstacle to voluntary compliance. One taxpayer re-marked that, while he owed no Federal income tax, self-employment tax was too prohibitive. He cited that, on $8,000 of net income, while no Federal income tax was due, $1,224 in self-employment tax were assessed. Taxpay-ers responding to the survey question also remarked that there should be an incentive to file and pay timely as other merchants provide.
Among the suggestions:
Provide a $5 e-file incentive;
Provide a $5 direct deposit incentive;
Provide a credit for timely filing and paying;
Provide an IRS EZ file, online, which automatically prepares the taxpayer’s return; and
Provide a reduction in penalty and interest if taxpayers begin pay-ment before IRS contacts them.
Perceived Lack of Importance or PriorityPerhaps among the most troubling of information from the survey is the number of preparers participating, 6 percent, who had clients who felt there was no need to timely file or pay their taxes. There was knowledge of what was required. The willful and deliberate attempt to avoid compliance was not believed to be important, and they would get to it when other more im-portant issues no longer took priority.
The Obstacles of Voluntary Compliance 121
Examples of such lack of compliance include:
Filing of tax returns, including Form 1099s and W-2s which un-doubtedly affect other taxpayers wishing to be compliant.
Paying of tax obligations, estimated tax payments, as well as penalty and interest.
Reporting and payment of taxes by non-US citizens who see no benefit in the filing and payment of tax.
The most troubling comment from a taxpayer interviewed was “that cheating on taxes was not anything bad.” It should be noted that the taxpayer was only correcting prior-year tax return filings in order to meet the demands of his fiancé.
MiscellaneousDemographic results of the survey indicate problems with voluntary compli-ance in primarily Hispanic communities. Stemming from “lack of trust,” Spanish-speaking taxpayers with English as a second language suffer from an insufficient number of Spanish-speaking tax professionals. Additionally, illegal aliens who want to file and pay their taxes are often deterred from filing for fear that filing a tax return will result in being contacted by Immi-gration.
Similarly, taxpayers with “occupations,” listed on page 2 of the 1040, which may be unlawful in their States, are discouraged from filing Federal income tax returns. If there was no “occupation” to complete, these indi-viduals would have greater confidence in timely reporting and paying of their taxes. Estimated Tax Payments are a compliance issue separate from filing and paying tax liability. Three percent of preparers participating in the survey remarked that the obstacle for filing estimated tax payments would be removed if:
1. The first quarter estimate was not set on the same date as the 1040 tax liability for the prior year; and
2. The estimated tax payments were set on evenly calculated quarters.
One taxpayer remarked that the State of California provides a state-ment showing the estimated tax payments made by the taxpayer. A similar statement sent by IRS would promote correct filing of payments.
The obstacles to voluntary compliance from the taxpayer’s perspective are important as Congress, the Internal Revenue Service, and the tax profes-
Whitlock122
sional community struggle to reconcile the Tax Gap. Studies and projects will be funded and analysis performed on the numbers, but no information can be as vital to the resolulion of the Tax Gap as all in the business of tax to know, from the taxpayers’ perspective, what taxpayers find most problematic.
The tax professional community understands all too well that taxpayers have changed their attitudes about filing and paying taxes since 1950. Tax professionals have to work harder to get the same taxpayers to come in and file taxes than they did 50 years ago. Tax professionals have to constantly remind taxpayers about the importance of filing and paying, including estimated tax payments. Most importantly, the tax professional, the trusted advisor of taxpayers, must be ever-vigilant to keep taxpayers from straying into the Tax Gap.
In the world of compliance—if a taxpayer believes it, it is so!The tax professional community is encouraged that the Internal Rev-
enue Service is willing to add to their research about taxpayers the experi-ences of tax professionals who live out their research by assisting taxpayers.
AcknowledgmentsMembers of the National Society of Tax Professionals and the taxpayers who participated in the survey.
Comments on Tax Practitioners—Perspectives
and ImpactJohn Scholz, Florida State University
T he three articles on tax practitioners presented in this volume provide creative examples of how research focusing on practitioners rather than taxpayers can help improve our understanding of tax compli-
ance and of enforcement policies. All three underscore the critical role played by practitioners in the compliance process and hence the importance of including strategies toward practitioners in any well-considered enforce-ment policy. The Bloomquist, Albert, and Edgerton article (henceforth BAE) notes, for example, that practitioners prepared 64 percent all of returns filed in 2005, accounting for 74 percent of reported tax. Tax practitioners are a relatively small professional group with considerable knowledge about reporting and considerable potential influence over the accuracy of reporting for the majority of income tax. An efficient enforcement program needs to consider carefully what can best be achieved by dealing with practitioners as an alternative to dealing directly with the overwhelming number of individu-al taxpayers.
The three articles also emphasize different aspects of the compliance impacts of practitioners, which is important for developing the broad per-spective necessary to understand their role in the compliance process. The Taxpayer Advocate Services article (henceforth TASA) by Wilson et al. studies tax practitioners in order to diagnose potential errors involved in IRS audits. This approach makes use of the expertise of tax practitioners to develop an alternative means of providing a standard of compliance by which to judge the relative accuracy of audits. It relies on the assumption that the presence of practitioners will tend to reduce possible errors made by auditors, at least in the case of audits involving earned income credits. The implication of this research approach is that we can compare the results of represented and unrepresented audits in order to identify issues and audit categories where IRS performance may need to be modified. In their case, they find that the difference for earned income credits is significant and sufficiently large to suggest the need for improved techniques and training for auditors.
BAE makes use of the IRS’s Automated Underreporter (AUR) program to evaluate the performance of tax practitioners. It reflects the assumption that the difference in reporting discrepancies between represented and unrep-resented taxpayers can indicate to what extend different types of practitioners
Scholz124
increase or decrease the compliance level of their clients. The implication here is that techniques can be developed for identifying particular practi-tioners and practitioner types whose clients are consistently found to have higher rates of noncompliance than their appropriate comparison group. To the extent that such identification techniques prove valid, and that effective safeguards can be created to protect misidentified practitioners, these tech-niques can be incorporated into general enforcement programs. Targeting individuals and groups of practitioners who can influence tens, hundreds, or even thousands of tax returns may prove to be a more efficient use of scarce enforcement resources than targeting individual taxpayers.
Finally, the National Society of Tax Professionals study (henceforth NSTPS) by Whitlock uses the rapport between tax professionals and their clients to gather information on compliance problems facing taxpayers. The anecdotal data provided through 100 practitioners was used to analyze the relative frequency of various obstacles to compliance. The implication here is that the practitioner’s wealth of experience about compliance problems can be tapped systematically to identify the most frequent problems facing taxpayers and possibly to help devise more efficient means of mitigating these problems through changes in laws, administrative procedures, or tax forms. Again, the advantage of surveying practitioners rather than taxpayers stems both from the broader perspective enjoyed by these practitioners and by their greater knowledge of the tax system.
Using Practitioners for Audit Diagnostics: The Case of the Earned Income Credits
The imaginative TASA focuses on a taxpayer population that is particularly likely to suffer from a lack of resources to confront auditors if mistakes are made. Taxpayers eligible for earned income credits are generally poor and lacking in skills necessary for complying with documentation and report-ing problems. As TASA notes: “Recent focus groups and interviews with taxpayer representatives have noted various barriers imposed by the cor-respondence audit process. Some of these obstacles include lost paperwork, inconsistent requests for documentation, and poor communication.”
The study very carefully documents that taxpayers represented by tax professionals in audits end up with more favorable outcomes than those who are not represented. Whether one looks at the proportion found to be eli-gible, to emerge with full EIC claims intact, to not owe more tax, or to have no change in taxes due, represented taxpayers do better than unrepresented taxpayers. The impact of representation in reducing the likelihood of a
Comments on Tax Practitioners—Perspectives and Impact 125
negative tax change holds even when the significant differences in the types of taxpayers who use representation are taken into consideration, control-ling for filing status, dependents (the unexplained DDb score in the article), adjusted gross income, and type of audit issue.
The article utilizes a large and well-considered design for gathering data, and an advanced matching approach to control for the selection bias problem—the problem that differences between the taxpayers who do and do not have representation may fully explain the observed differences in audit results. If this explanation is true, then the observed impacts of representa-tion on audit outcomes will disappear once these differences are accounted for. The matching approach used in TASA to control for these differences provides a convincing result.
This excellent analysis provides very solid evidence for the authors’ primary contention, with some but not all details normally reported in aca-demic journals made available in the appendix. The analysis is based only on changes in taxes, which is arguably the most important of the observed differences between the groups. But the reader is left wondering whether the selection bias correction affects the other variables as well. The uncor-rected results are impressive because they included a number of measures to assess the difference between the groups—shouldn’t each variable be assessed for bias in the same manner? More importantly, after introducing the means to correct for selection bias, Tables 11 through 15 appear to be based on the uncorrected data rather than the selection-bias controlled data. So, we unfortunately do not know how much of these differences can truly be attributed to representation, and how much to the documented differ-ences between the groups.
The final recommendation in TASA is that the study should be repli-cated on more recent data. This is far too mild, given the high quality of this research, the limitations on timeliness of data affecting all tax-related research, and our limitations as a society to devote resources to research. The research makes a very clear case that representation causes a major difference in outcomes, a case that could be strengthened by the suggested further applications of the same selection bias analysis. The remaining question is what if anything to do about these findings. Earlier in the report, the authors make the relevant suggestion: “An affirmative answer to this question [of differences in outcomes] would highlight the need to refor-mulate IRS compliance programs that verify the EIC in such a way as to minimize the use of audits and/or modify the way the audits are conducted.” That is a fitting conclusion for the article, and one that IRS research should be encouraged to make as a recommendation!
Scholz126
There is the unaddressed question about interpreting the differences between audits with and without representation. In the EIC case, the prob-lems of compliance for the taxpayers noted in the article, combined with institutional pressures to be tough in auditing these low-income returns (“EIC audits represent approximately 43 percent of all IRS individual tax-payer audits,” as reported in the article), provide a strong basis for conclud-ing that auditors are indeed most likely to be overly aggressive and to err on the side of denying credits that should have been granted. Extending this comparison approach to uncover audit problems in areas beyond EIC might require more serious attention to the possibility that representation actually enhances error by inducing auditors to underassess taxes rather than spend the necessary time to deal with internal and court appeals that are likely when practitioners are present. In the EIC case, however, it is most plau-sible to conclude that there is a major problem of justice here that the IRS and Congress need to address.
Using Record Matching To Detect Problem Practitioners: Finding the Bad Apples
BAE makes use of the impressive amount of data now available in the IRS Compliance Data Warehouse, first to investigate the impact of practitioners on tax compliance, and second to provide a basis for a new technique to identify the bad apples among practitioners associated with noncompliance. The article is in part a response to the GAO study they cite that found a con-siderable range of errors in hypothetical tax returns prepared by a sampling of tax preparers. BAE attempts to use extensive IRS data to provide a better assessment of the math errors and potential misreporting discrepancies found in returns prepared by practitioners, and also to do something about reducing the “discrepancies” by focusing on practitioners associated with the highest levels of these discrepancies.
BAE finds first that returns filed by practitioners involve fewer math errors but have more misreporting discrepancies than those by self-preparers. They also note that the percentage of practitioner returns containing misre-porting discrepancies falls as firm size increases, and they investigate several other indicators that affect the relative number of discrepancies. Given these discrepancies, they move to their main task of developing a method for identifying practitioners associated with higher levels of discrepancies. The main thrust of the paper focuses on devising improved enforcement targeting methods, rather than on understanding the role of practitioners in the compli-ance process, and should be evaluated accordingly.
Comments on Tax Practitioners—Perspectives and Impact 127
The major question in evaluating this paper is about the quality of the primary measure of reporting accuracy. Two indicators of accuracy are used in the first section—the presence or absence of a math error, and the presence of a nonzero dollar discrepancy in the IRS’s Automated Underre-porter (AUR) program. The second measure is also the basis for the second section of the paper. While the math error measure is well-defined and uncontroversial, the AUR measure is trickier to assess. The AUR Program attempts to match taxpayer income and deduction information submitted by third parties to amounts reported on individual income tax returns, and to use mismatches to identify potential audit cases. One report found that 55 percent of originally identified cases (78 percent of the 70 percent actually pursued) resulted in increased tax liability, suggesting that the measure has some ability to identify potential tax discrepancies.1 A 55-percent success rate may be reasonable for a screening device for targeting some form of audit procedure, although it does not provide much confidence as a measure related to accuracy of reporting. In addition, the AUR measure focuses only on one kind of detectable discrepancy, and does not take advantage of other audit-based measures like those based on the Taxpayer Compliance Measurement Program or its recent replacement. It therefore provides a very specialized and limited measure of discrepancies in reporting associ-ated with noncompliance.
Tables 1-5 report these measures of discrepancy to make various com-parisons relating to preparers. For example, Table 1 compares discrepancies between self-preparers and two categories of preparers. Ideally, the authors would like to conclude that the differences were due to the preparers. How-ever, most of these comparisons are subject to the same selection problem as those discussed for TASA—the 2-percent higher discrepancy rate for paid preparers in 2005 might be due to the influence of preparers, but might also be due to differences between taxpayers who do and do not use paid prepar-ers. Table 3 at least controls for some possible variance across taxpayers by focusing on line items, but this still does not provide much assurance that the observed differences could not best be explained in terms of the differ-ence between taxpayers who do and do not use preparers. While these tables may be useful from the perspective of identifying areas with the greatest discrepancy, they tell us little about whether preparers make any difference at all in levels of discrepancy or compliance after controlling for differences in taxpayers who go to preparers. This is a precaution that is not clearly
1 United States Treasury, More Information Is Needed To Determine the Effect of the Automated Underreporter Pro-gram on Improving Voluntary Compliance, August 2003, Audit Reports (Audit # 200340024), Reference Number 2003-40-180 (last viewed October 26, 2007, at http://treasury.gov/tigta/auditreports/2003reports/200340180fr.pdf)
Scholz128
noted in the text. For example, the statement that “paid preparers account for a higher number and a larger percentage of tax returns with a potential AUR discrepancy” is accurate in terms of targeting enforcement at areas with higher discrepancies, but is very misleading if interpreted as meaning that preparers are somehow responsible for these discrepancies. The data as presented in the tables are not capable of supporting the latter argument, and do not without further analysis provide a justification for focusing on individual practitioners.
The main business of the article, however, is in developing a method of utilizing available data already used to detect individual returns in order to detect individual practitioners whose returns consistently have higher rates of discrepancy than would be expected. The problem here involves how to determine appropriate levels of expectation. Ideally, one would compare all tax returns prepared by each preparer with all “similar” tax returns to deter-mine the deviation associated with this preparer. Then, enforcement efforts could target those preparers associated with the highest rates of deviation. The comparison with similar tax returns helps reduce the selection problem by using only similar returns as a basis for evaluation.
But how can one identify the set of similar returns to provide a target-ing mechanism within the constraints of data and computer availability? This is the critical question, and the answer in the article is not completely clear. BAE appears to determine similarity in terms of geography, com-paring the actual discrepancies observed for a preparer with the expected discrepancy for taxpayers drawn randomly from the same Zip Codes in which the preparer’s clients live. Figure 1 suggests that only taxpayers using practitioners were used for the comparison, which would provide a much better comparison group than would a comparison based on all taxpayers. Additional matching on other characteristics like income level, taxpayer status, and particular line items could further improve the potential accuracy of the comparison group.
The true test of the suggested procedure or an improved version featur-ing better matches, however, will depend on how well the system works in targeting practitioners for audits. Just as with other features of the AUR system, it is the success rates of the resultant enforcement actions (compared with an appropriate baseline) that will ultimately determine whether this procedure is useful at all. Do audits of the returns of practitioners receiving high scores with this procedure in fact turn out to produce greater correc-tions of underreporting than average?
This is where the selection effect problem takes on very practical significance. If the selection effect is the only reason that practitioners differ in deviation rates—that is, if one practitioner’s higher deviation rate is only
Comments on Tax Practitioners—Perspectives and Impact 129
due to the characteristics of the individuals who use that practitioner—then, the system of targeting practitioners is unlikely to accomplish anything more than the existing system targeting individual taxpayers can accomplish. In order to offer some added advantage, the practitioner-based system must find those differences attributed to the practitioner and not to the practitioner’s clients. It remains to be determined whether the proposed Zip Code com-parison will be sufficient to provide the “similarity” needed to identify these differences.
The current analysis is limited to the currently-available AUR mea-sure and is, therefore, very limited as a general tool for targeting a wider set of enforcement actions. However, there is no reason that it could not be extended to utilize other information derived from the extensive data avail-able from audits. Such audit data need to be treated carefully because they provide observations on only a limited number of returns. But detection-controlled estimation techniques could be used to control for these problems in order to analyze the audit records of practitioners, to seek the same pattern of audit-measured deviations that are higher than expected. In short, this paper provides one example of the kinds of models that can be used to ana-lyze patterns of compliance associated with individual practitioners rather than individual taxpayers. Since each practitioner is associated with many returns, the data patterns to be explored are richer and the potential impact on compliance is broader in scope.
Using Practitioners To Detect Evolving Compliance Problems
NSTP suggests how tax practitioners can be used as an additional means for detecting compliance problems. The members of NSTP were asked prior to the 2007 filing season to gather and report anecdotal evidence identify-ing why their clients “were having difficulty in voluntarily complying with tax code.” By the end of April 2007, 100 of the 5,000 members of NSTP responded. The article reports the relative frequencies of typical responses, providing a summary of NTSP members’ perspectives on the main obstacles to voluntary compliance.
The study suggests that the responses from 100 members represent summary observations from the approximately 65,000 returns (including joint returns) prepared by those members. The frequency for each type of compliance obstacle is calculated on an assumption that the anecdotal evidence reflects the true proportion of obstacles encountered. Although the actual frequency among taxpayers is likely to differ (in part because practitioners only know the obstacles that are visible to them), the reported
Scholz130
frequencies can at least represent a measure of beliefs among practitioners who reported.
The potential value of such surveys is to provide policymakers and administrators information immediately after the tax filing season about compliance obstacles encountered. NTSP confirms some of the longstand-ing and well-known obstacles:
Procedural difficulty with IRS, including communication;
Burdensome reporting and tax filings;
Unreasonable penalty and interest assessments; and
Insufficient encouragement to file and pay timely.
Perhaps more helpfully, it highlights a somewhat more surprising per-ceived lack of importance or priority among taxpayers who “would get to it [filing return] when other more important issues no longer took priority.”
Surveys of practitioners may become most valuable to the extent that they could be used as early warning detectors of new compliance obstacles that emerge each year, which might then be dealt with before they become worse. But to convince policymakers and administrators about the impor-tance of any new problem, more systematic methods of providing reliable frequency counts would be needed. Are the 100 reporting practitioners typical of NTSP members, or do they represent some particular set of clients more likely to complain about compliance obstacles? To what extent do the reported obstacles truly represent the frequency among represented taxpay-ers? Do the reports reflect strategic concerns of practitioners rather than taxpayers?
Although these questions would be difficult to answer with the current survey, the next survey could be designed to reduce these problems and pro-vide a clearer picture of the relative frequency of newly discovered problems among specific types of taxpayers. The challenge is to devise transparent survey techniques and analytic methods that could pinpoint real problems without triggering an audit response from the IRS, since such responses would discourage practitioners from openly identifying auditable problems. For example, a survey of practitioners representing the EIC clients studied in TASA would have long ago identified the problems raised in that paper about the compliance difficulties—and could have probably done so more effectively than a survey of the taxpayers. By working together, the IRS and NSTP or other organizations of professionals may be able to design mecha-nisms to utilize the extensive experience of practitioners in order to provide timely information about changing compliance problems. Such a survey-based mechanism could potentially provide an alternative means of detecting
Comments on Tax Practitioners—Perspectives and Impact 131
new compliance issues years before they would be uncovered through audit programs.
In sum, the three studies in this section on Tax Practitioners provide excellent examples of research that can help improve tax administration and policy. TASA and NSTP show how the expertise and experience of practi-tioners can be used to improve audits and other aspects of tax administration, while BAE shows how research might develop better means of identifying the individual practitioners in the dysfunctional sector of tax practitioners. In each case, I have suggested some remaining research issues that if solved could strengthen these efforts. The level of sophistication already achieved, as exhibited particularly in the two articles representing IRS research, dem-onstrates the great progress that continues to be made in applying existing research techniques capable of enhancing the relevance and power of tax compliance and enforcement studies.
D4
Disentangling the Tax Gap
Brown JohnsToder
National Research Program—Methods and Plans
Bob Brown and Drew Johns, Internal Revenue Service
I n 2000, the Internal Revenue Service (IRS) established the National Research Program (NRP) office as part of its efforts to develop and monitor strategic measures of taxpayer compliance. NRP now provides
compliance measures for different types of taxes and different groups of taxpayers, with the three major forms of compliance being:
filing compliance—measured as the percentage of required re-turns timely filed;
payment compliance—measured as the percentage of reported tax liability on timely-filed returns timely paid; and
reporting compliance—measured as the accuracy of income, deductions, expenses, and other items reported on timely filed returns.
Each form of noncompliance contributes to the overall tax gap, which estimates the difference between what the IRS estimates is due to the Federal Government and what the Government actually collects. Using NRP data, the IRS estimated the Tax Year 2001 Gross Tax Gap to be $345 billion. It is expected that various enforcement activities and voluntary late payments will bring in $55 billion, leaving the Net Tax Gap at $290 billion. Misre-porting is by far the largest component of the Tax Gap, accounting for nearly 83 percent of the TY 2001 Gross Tax Gap.
This paper focuses on the IRS’s efforts to measure reporting compli-ance, examining the benefits and challenges to using reporting compliance data to support strategic and operational decisionmaking.
BackgroundMeasuring taxpayer compliance for the IRS is a basic measure of the Service’s effectiveness in administering the Tax Code. It is analogous to measuring the net profit for a private sector business.1 Just as a company’s management would have an incomplete picture of the organization’s opera-
1 “IRS’s Comprehensive Approach to Compliance Measurement,” National Tax Journal, Volume LVI, Number 3, September 2003, p. 689.
Brown and Johns136
tions without computing its net profits, the IRS would have a distorted view of its operations without up-to-date measures of taxpayer compliance.
A decade ago, the Internal Revenue Service and outside observers rec-ognized a major hole in understanding its operations because the data driv-ing its compliance measures were increasingly outdated, due to a break of at least 10 years for all but a few measures of compliance.2 One implication of this break was that IRS compliance and tax gap estimates were becoming less reliable because IRS researchers were basing these estimates on increas-ingly dated raw data.
The Evolution of IRS Reporting Compliance Studies3
The IRS established a Taxpayer Compliance Measurement Program (TCMP) in 1964, starting with an examination of individual income tax returns for Tax Year 1963 returns, and, for nearly 3 decades, the TCMP had been one of the IRS’s most important compliance initiatives.4 The most prominent feature of this program was the series of individual income tax compliance surveys, which consisted of thorough audits of representative samples of individual income tax returns approximately every 3 years. However, other groups of taxpayers were also subject to reporting compliance studies during that time.5
Over the years, the IRS conducted periodic TCMP studies on all major individual and business return types. The size of the samples differed, gen-erally reflecting the size of the taxpayer populations covered by the studies. The TCMP studies of individual income tax returns used samples of approxi-mately 50,000-55,000 returns for a given tax year.6 Compliance studies for other groups of taxpayers generally required smaller samples. Each study shared certain basic characteristics. They all utilized randomly selected samples of returns designed to statistically reflect the overall filing popula-tion, and each return was subjected to line-by-line scrutiny, with taxpayers
2 National Commission on Restructuring the IRS, final report, paragraph 83, June 1997.3 We based the first part of this section on a comprehensive review of the Taxpayer Compliance Measurement Program, most of which are described in internal IRS documents. Publicly available documents include “Income Tax Compliance Research,” Internal Revenue Service, Department of the Treasury, 1988; “Taxpayer Compliance Measurement Program Handbook,” Internal Revenue Service, Department of the Treasury, May 1989; “Compli-ance Data,” Government Accounting Office, Report #GGD-96-89, April, 1996; “Status of IRS’s Efforts To Develop Voluntary Compliance Measures,” Government Accounting Office, Report #01-353, June, 2001; “New Compliance Research Effort Is On Track, but Important Work Remains,” Government Accounting Office, Report #02-769, June, 2002; and “A Survey of Random Audit Programs in OECD Countries,” OECD Forum on Tax Administration, November 2002.4 Ibid.5 Ibid.6 Ibid.
National Research Program—Methods and Plans 137
generally required to document the entries on each line item on the returns. The IRS attempted to use its more experienced examiners in conducting TCMP audits. TCMP examinations were also subject to more intensive quality reviews than operational audits (and the returns were corrected for math errors) to ensure that the auditors identified the correct amounts of tax due on the returns.
The purpose of this series of studies was twofold. First, the IRS ex-pected the studies to provide an estimate of overall reporting compliance for various individual groups of taxpayers, as well as for the entire tax system. Second, and perhaps more importantly, the studies sought to develop im-proved ways to select returns for examination.7 By developing data on the characteristics of returns that exhibited a degree of noncompliance, the IRS was able to focus resources on examinations that made sense from an agency viewpoint. Prior to the development of the Discriminant Function Score (based on these compliance studies), IRS experience was that about half of all audits resulted in “no tax change,” which wasted both IRS and taxpayer resources. After these workload selection formulas were developed and widely utilized, IRS examinations based on these formulas showed around one-fifth of the examinations resulting in “no change.”8
Besides developing workload selection formulas, these studies led to several policy changes. The observation that taxpayers more accurately reported items on their returns for which the IRS received reports from third parties relative to items for which third-party reporting was unavailable over time increased the pressure to require information reporting for a variety of items.9 In addition, the observation that numerous taxpayers appeared to be misreporting claims for dependent exemptions led to a requirement that tax-payers report a taxpayer identification number (generally a Social Security number) for each dependent claimed (e.g., child). The result of this policy change was that several million dependents “disappeared” the year after this requirement was put into law.10
However, the IRS discontinued these reporting compliance efforts after the Tax Year 1988 TCMP study.11 The IRS attempted to restart the program but could not develop an approach that met the objections of policymakers in
7 “New Compliance Research Is on Track, but Important Work Remains,” Government Accounting Office, Report #02-769, June 2002, p. 5.8 Ibid.9 Mortgage interest, proceeds from stock sales, and proceeds from the sale of homes are prominent examples of expanded information reporting that resulted from various TCMP studies.10 “Where Have All the Dependents Gone?,” Trend Analyses and Related Statistics—1990 Update, Department of Treasury, Internal Revenue Service, Publication 1500, August 1990.11 “Compliance Data,” Government Accounting Office, Report #GGD-96-89, April 1996, p. 1.
Brown and Johns138
both the Executive and Legislative Branches. One cannot point to a single reason for the demise of TCMP; rather, it appears to have resulted from a confluence of a number of different factors. These factors included concerns about the burden placed on taxpayers, the amount of IRS resources devoted to TCMP, an unclear connection between the costs of TCMP and the resul-tant benefits (to the IRS and to the taxpaying public), and a general negative feeling toward the IRS on the part of Congress and a substantial portion of the American public.12
With each passing year, the IRS’s risk associated with the aging data grew. Not only was the IRS making compliance decisions using data that were, in some cases, more than 20 years old, but the populations of many types of tax returns had also changed dramatically in number and composi-tion since the last concerted effort to measure reporting compliance of those taxpayers.
To address the shortfall in information about taxpayer compliance that is required to run the IRS effectively, then-Commissioner Charles Ros-sotti established the predecessor to the National Research Program in April 2000.13 In establishing the infrastructure for these measures, the IRS identi-fied four primary goals:
gather strategic information about taxpayer compliance behavior that will allow the IRS to better allocate its resources to enforce-ment and other activities;
update workload selection formulas;
collect data that will provide some insight into the causes of re-porting errors (to aid in providing taxpayer service); and
develop those data to update IRS estimates of the tax gap.
The IRS adopted a philosophy that seeks to balance taxpayer burden with the acquisition of high-quality compliance data from NRP reporting compliance studies. To achieve this balance, NRP made several departures from the TCMP methodology. The first departure was a greater reliance on data already available to the IRS, a process called “case-building” in the terminology of NRP.14 A second departure was the classification of NRP returns. In TCMP studies, IRS examiners verified entries on every line item
12 The Senate Finance Committee conducted a series of widely publicized hearings in the mid-1990s that spot-lighted many of these negative feelings toward the IRS.13 “New Compliance Research Effort Is on Track, but Important Work Remains,” Government Accounting Office Report #02-769, June 2002, p. 1.14 In building an NRP case, the IRS assembles information from a variety of internal and third-party data sources. This information allows the IRS to substantiate some or all of the information on a tax return.
National Research Program—Methods and Plans 139
on each return in the sample. In contrast, NRP employs a well-trained group of experts to analyze the sampled returns, and associated case building mate-rials, and then list those items requiring taxpayer verification.
The ability of NRP to maintain the integrity and security of the data it gathers and analyzes is critical to its success. Throughout the NRP process, the IRS maintains taxpayer privacy by collecting only taxpayer data neces-sary for compliance measurement. It is critical not only from the perspec-tive of data integrity, but the NRP must be able to ensure stakeholders that access to and use of these data are only carried out under established IRS guidelines and procedures for securing and using taxpayer data. Processes are in place to ensure accountability and appropriate access and use of data related to NRP.
The initial NRP reporting compliance study used a random sample of approximately 46,000 individual income taxpayers filing returns for Tax Year 2001. Using the case building and classification processes, NRP accepted the reported amounts on nearly 3,000 returns. NRP verified tax return information on an additional 1,800 returns via correspondence. One of the many positives to come out of this initial study was the positive reac-tions that resulted from the IRS’s attention to taxpayer burden. Customer satisfaction survey data indicate that taxpayers participating in NRP audits had satisfaction scores significantly higher than taxpayers going through operational audits.
Despite the successes, the initial reporting compliance study revealed a number of weaknesses, the primary one being the burden such studies imposed on the IRS workforce. Between 1988 and 2003, the IRS work-force declined by approximately 30 percent. As a result, the addition of nearly 50,000 research audits severely taxed the operating divisions’ ability to absorb the additional work. In planning for the second return type, NRP tweaked its methodology more by moving to a multiyear study.
In an effort to accurately assess the tax gap and the reporting compli-ance of flowthrough business entities, the IRS first designed a pilot reporting compliance study of both partnerships filing Form 1065 and corporations that file Form 1120S (more commonly known as S corporations). The re-sults of the pilot study pointed the IRS to a more complete reporting com-pliance study focusing on just S corporations, beginning with entities filing returns for Tax Year 2003. The study of S corporations contributes to IRS’s overall strategic goals and its research compliance measurement efforts, and marks the first time in over 2 decades that the IRS has reviewed the report-ing compliance of flowthrough entities.
The new study will provide information on reporting compliance, data to estimate the tax gap, and aid to policymakers in their decisions regard-
Brown and Johns140
ing tax policy, as well as assist IRS in developing priorities for taxpayer education programs to help reduce noncompliance. The S corporation study involves a sample of approximately 5,000 returns filed for either Tax Years 2003 and 2004. About 25 percent of the sample is Tax Year 2003 returns, while the large majority of returns come from Tax Year 2004. NRP deliv-ered the 2003 returns to the field for examination in October 2005. Ship-ments of 2004 returns for examination started in April 2006.
This study follows the NRP methodology of having experienced IRS revenue agents review the cases and classify specific issues for field examin-ers to pursue during their audits. With no information documents to vali-date entries on S corporation tax returns, the examiners are looking at more issues than they did for the Form 1040 reporting compliance study. Still, the IRS will not likely ask for documentation for every line item on any of the selected S corporation returns.
As of the end of July 2007, the IRS had contacted every taxpayer in the sample, starting the audit process. IRS examiners had completed their audits in more than 4,500 cases. With the vast majority of cases near completion, NRP expects to close its study database in September 2007 to release the initial database for research purposes.
The IRS based its decision to study S corporations on two primary con-siderations. First, the population of S corporation returns had grown rapidly in the past 20 years, and, in Tax Year 2003, S corporation returns accounted for 61.9 percent of all corporate tax return filings. The nearly fivefold increase in the number of S corporations since the last compliance study of 1120S returns in 1984 makes this population an especially important focus for an NRP study. Using the data obtained from this NRP study, the IRS will be able to:
determine various measures of compliance including the Net Mis-reporting Percentage for S corporation Ordinary income,
determine the effectiveness of audit selection techniques, and
provide data to refine the tax gap estimate.
Secondly, the IRS had conducted no compliance measurement audits for S corporations since the Taxpayer Compliance Measurement Program (TCMP) involving Tax Year 1984 returns. The IRS currently conducts few operational audits of S corporations; for returns filed in Calendar Year 2003, the IRS examined 6,402 S corporation returns. This is an audit rate of less than 0.2 percent of the total returns filed for Form 1120S.
To calculate the impact on the tax gap estimates, NRP examiners will not only evaluate the S corporations’ tax returns, but also assess the related
National Research Program—Methods and Plans 141
tax returns of individuals and entities that are shareholders in the selected S corporations to determine whether the actual tax liability is correct. Com-pliance studies of flowthrough entities such as S corporations are complex primarily because they report only income and losses. Those who have ownership share in the profits and losses of the corporation and should pay the appropriate tax liability.
Consequently, for every S corporation, at least two tax returns should be examined to determine whether the correct tax has been paid—the Form 1120S of the business plus the individual returns of shareholders. In ad-dition, the IRS will assess whether the S corporations qualify to file these types of returns.
In looking forward to the upcoming iteration of the individual report-ing compliance study, NRP will take the multiyear sample approach one step further. The study will start in October 2007, using approximately 13,200 randomly-selected Tax Year 2006 returns. The study will use similar sample sizes in subsequent years. Combining audit results from the first 3 years' samples (roughly 39,600 returns) will provide compliance estimates of comparable statistical precision to those from the Tax Year 2001 NRP study with a sample size of more than 46,000 returns. Unlike previous reporting compliance studies, the new NRP approach will not stop after results from the TY 2009 audits are in; rather, NRP will continue to conduct audits of annual samples.
An advantage of using this method, which combines results over roll-ing 3-year periods, is that the IRS could then update compliance estimates and develop more efficient workload plans on an annual basis by adding each new year's compliance results to the 2 prior years of existing data. With previous studies, which started from scratch, tax returns were drawn from a single year, and involved examinations of more than 45,000 taxpay-ers; and, the IRS faced gaps of at least 3 years before updating its compli-ance estimates.
Benefits and Successes of the NRP MethodologyThe IRS used data from the 2001 Form 1040 reporting compliance study, along with updated payment and filing compliance data, to develop a new point estimate of the tax gap. The Service is using the NRP data to drive re-search and other initiatives to narrow the tax gap in the future. IRS research-ers have already examined NRP data to assess compliance characteristics of specific taxpayer segments, such as high-income individuals.
Brown and Johns142
The IRS shares aggregate findings from NRP studies with other Gov-ernment agencies, facilitating a greater understanding of taxpayer incomes. For example, the Service provided tabulations of Schedule C and C-EZ data to the Bureau of Economic Analysis for use in adjusting various national economic indices.
Each unnecessary or ineffective contact with a compliant taxpayer has a direct and negative impact on the public’s perception of the effectiveness and fairness of the Federal tax system. Additionally, compliant taxpayers want to know that the IRS is capable of ensuring that everyone pays his or her fair share. The IRS uses a variety of techniques, such as document matching, correspondence, and audits, to verify that taxpayers accurately report their tax liabilities on their returns. Optimally, the IRS audits those returns most likely to have errors, and, although the Service uses various methods to identify errors, the most efficient method involves workload selection formulas used to select returns for examination.
Prior to the 2001 NRP reporting compliance study, the last such exercise occurred with Tax Year 1988 returns. The advanced age of the workload selection models made it increasingly difficult to identify, for audit purposes, returns with underreported tax liability. With the release of Tax Year 2001 NRP reporting compliance data, the IRS was able to update its workload selection formulas for the first time in about 15 years. New formulas went into service in January 2006, and the IRS made minor updates for implementation in 2007.
The IRS is committed to applying its limited resources where they are of most value in reducing noncompliance while ensuring fairness, observing taxpayer rights, and reducing the need to burden those who do comply. The service will use NRP results to more effectively manage its compliance pro-grams and design prefiling activities that help taxpayers comply with the tax law. Continued updates of quality reporting data is vital to this strategy. The IRS is launching a new NRP reporting compliance study for Form 1040 fil-ers that will use an innovative multiyear rolling sampling methodology. The advantage of using this approach, which combines results over rolling 3-year periods, is that the IRS can make annual updates to compliance estimates and develop more efficient workload plans on an annual basis, after the ini-tial three annual studies. The new approach also uses smaller samples in any given year, reducing the burden of research on both the taxpayer population and IRS examiner resources.
The launching of NRP reporting compliance studies has had a number of indirect benefits to the IRS. These include refinements to examination tools and processes; adoption of new technologies, such as virtual servers
National Research Program—Methods and Plans 143
and Web-based support tools; and advances in the development and delivery of training.
Other important benefits of NRP, to both the IRS and taxpayers, include:
taxpayers benefit from redesigned forms, improved communi-cations, suggested law changes, and enforcement focused on noncompliant taxpayers. The Service will have improved ability to do this because NRP examiners determine likely reasons for observed noncompliance and NRP data will identify line items on tax returns that create the most difficulty for taxpayers trying to comply with tax law. NRP continues to drive IRS efforts to refine identification of the reasons for noncompliance. In Calendar Year 2006, NRP spearheaded a multifunctional initiative within the IRS to review and revise “reason codes” used to describe why taxpayers misreport incomes, deductions, taxes, and credits;
taxpayers experience fewer burdens during an audit because NRP pioneered a comprehensive case-building approach that provides examiners with a wide range of information about the taxpayer’s situation before an audit takes place. This allows the examiner to focus more on questionable items and potentially improve audit productivity;
NRP also pioneered a number of other processes that improve audit productivity. NRP returns were the first to use the IRS’s ap-plication for capturing examination results in a LAN environment, facilitating the sharing of case file information and reducing the time associated with reviewing and closing cases. NRP also au-tomated the classification process and the population of tax return data into the report-generating system, eliminating thousands of hours associated with the creation of audit case files; and
obtaining a measure of overall income tax compliance allows the IRS to measure its “bottom line” and make resource alloca-tion decisions in ways that can improve its overall performance. At the 2004 IRS Research Conference, keynote speaker Senator Charles Grassley, then chairman of the Senate Finance Commit-tee, pointed out the importance of NRP studies to guide Congress in its tax policy.
Brown and Johns144
NRP Individual Underreporting Study Tax Years 2006, 2007, and 2008: Analytical and Methodological ChallengesNRP data provide the basis for a broad range of analyses, including work-load selection formulas, burden and service analysis, detailed compliance measures, and estimating the individual underreporting portion of the overall gross tax gap. The move to smaller annual studies promises ben-efits such as annual updates to these analyses, but challenges lie ahead. This section highlights some of the more significant challenges, including dealing with a smaller sample size in early years and pooling data across multiple years, and presents some early thinking on how we may handle those challenges.
The Tax Year 2001 NRP Individual Underreporting Study consisted of a sizeable sample of approximately 46,000 returns, which provided enough observations for updating workload selection formulas and estimating the amount of income that was not detected by classifiers and examiners. The current multiyear individual underreporting study proposes selecting ap-proximately 39,600 returns in equal thirds over Tax Years 2006, 2007, and 2008. The design of the sample considers the needs of workload selection and the overall requirements of estimating the raw Voluntary Reporting Rate (VRR) and the EITC compliance rate within 2 percentage points at a 95-percent level of confidence.15 The requirements are met based on pool-ing 3 years of data into one larger sample, meaning that updates to these analyses may not be available in the first 2 years or will be based on a lower level of confidence.
Detection-Controlled EstimationEstimating the individual income underreporting tax gap has typically consisted of three components: 1) estimates based on errors detected by examiners during random audits, 2) adjustments for unreported income that examiners were unable to detect and 3) average marginal tax rates applied to the components of income and offsets to income. Prior to estimating the Tax Year 2001 tax gap, estimates of the amount of income not detected during the random audits consisted of multipliers based on a comparison of
15 The VRR is generally defined as the ratio of tax reported on timely filed returns to the amount of tax that should have been reported. The raw VRR is based on raw noncompliance detected during NRP audits and does not take into consideration noncompliance that classifiers and examiners were unable to detect and should not be confused with the overall tax-gap-based VRR. The EITC compliance rate is defined as the ratio of the amount of EITC that should have been claimed to the amount of EITC that was claimed.
National Research Program—Methods and Plans 145
1976 TCMP audit results where examiners did not have use of information reporting (IRP) documents with the income reported on those documents. The results of the comparison showed that, for every $1 detected without the use of IRP documents, another $2.28 went undetected. This resulted in the use of a 3.28 multiplier, with some variations depending on type of income.16 For purposes of estimating the Tax Year 2001 tax gap, IRS wanted to update the methodology for estimating undetected income and contracted with Dr. Brian Erard and Professor Jonathon Feinstein to implement a methodology originally developed by Professor Feinstein known as Detection-Controlled Estimation (DCE).17
DCE is an econometric technique that when applied to tax compliance typically estimates two equations jointly, 1) a noncompliance equation which models the amount of detected and undetected underreported income and 2) a detection equation that models the detection rate. The intuition underlying the DCE methodology is the idea of modeling the differences in the abilities of examiners to detect income. Because examiners play a significant role in the methodology, ideally, there would be a relatively large group of examin-ers who each examined a large number of returns and line items on those returns. If, instead, there are only a small number of examiners who audited multiple returns, then there may be challenges with using the DCE method-ology. In other words, the allocation of returns to examiners and the extent of the audits play an important role in determining the level of detail and reliability of the estimates that DCE can provide.
The decision to spread the sample over multiple years has implications for implementing the DCE methodology. For Tax Year 2006, approximately 13,200 returns will be selected. Following past NRP procedures, these returns will go through classification and essentially be assigned to one of three categories: 1) accepted as filed or with adjustments, 2) correspon-dence exam, or 3) face-to-face exam. The first implementation of the DCE methodology for estimating the Tax Year 2001 tax gap was limited to using the results of the face-to-face exams. Assuming the same scenario holds for future analyses, fewer than the 13,200 selected returns will actually be avail-able to use with DCE. Ideally, these returns will be efficiently assigned to a cadre of examiners who will primarily handle NRP audits, thereby poten-tially increasing the reliability of DCE by concentrating the returns and lines examined. By moving toward annual studies, essentially institutionalizing the NRP individual studies, the likelihood of developing a cadre of examin-
16 Internal Revenue Service (1996), Federal Tax Compliance Research: Individual Income Tax Gap Estimates for 1985, 1988, and 1992, Publication 1415 (Revised 4-96), Washington, DC.17 Feinstein, Jonathan S. (1991), “An Econometric Analysis of Income Tax Evasion and its Detection,” RAND Journal of Economics, Volume 11, Number 1 pp.14 – 35.
Brown and Johns146
ers may be increased. Even with a greater concentration of returns among examiners, there may not be enough observations to employ DCE during the first or second years of the study. However, if the annual studies are extend-ed beyond Tax Year 2008, then annual updates with DCE methodology may be possible by pooling the previous 3 years of NRP results.
Workload SelectionIn addition to estimating the tax gap, NRP data are essential for updating workload selection formulas used to target audits toward taxpayers who have a greater likelihood of owing taxes. By improving the targeting of audits, IRS increases the collection of underreported income taxes and reduces the burden on compliant taxpayers. Updating the workload selection formulas also imposes requirements on the NRP sample methodology. As with DCE estimation, the smaller number of returns selected in the first and second year may delay the updates to workload selection formulas until the third year, by which time pooling the data will provide sufficient observations. Continuing with annual studies past Tax Year 2008 would then allow annual updates to the workload selection formulas by pooling the previous 3 years of NRP results.
Other AnalysesRaw NRP data are also used to identify areas that may be more susceptible to taxpayer errors because of opportunities for noncompliance or because of a relatively higher degree of burden. These analyses typically rely on detailed raw NRP audit results based on errors detected by examiners at the line item level, including lines on supporting schedules. The results are used to develop and support legislative proposals such as increasing information reporting requirements and influence resource allocation, tax administration, and taxpayer service decisions. The design of the multiyear study provides a high degree of confidence in the overall raw VRR based on 3 years of pooled data and a reduced, but still relatively high, degree of confidence based on the smaller annual sample. Although the reliability of the detailed line item raw results is not a direct requirement of the design of the sample, the strati-fication of the sample does take into consideration the additional forms and schedules that taxpayers file with their tax returns, such as Schedule C or Form 2106. In general, measures of raw compliance for specific line items that are not reported on many returns may be less reliable based on annual results and require pooling the data over 3 years. It will be tempting with re-
National Research Program—Methods and Plans 147
sults across many line items to compare annual compliance rates across line items and years, but the validity of any comparison depends on the degree of reliability which is related to the size and design of the pooled sample.
Pooling the Data over Multiple YearsIn order to provide detailed estimates, NRP data will need to be pooled across multiple years. The U.S. Census Bureau takes a similar approach with the American Community Survey (ACS).18 The ACS is a new annual survey of demographic and housing characteristics by the Census Bureau that provides detailed estimates across geographic areas. The ACS provides annual estimates for geographic areas with 65,000 or more people, pools data over 3 years for areas with a minimum of 20,000 people, and pools 5 years of data for the smallest areas. This approach is analogous to the one likely to be used by users of NRP data. Some tax return line items may have sufficient coverage to provide annual updates, but others will require pooling the results.
The Census Bureau pools ACS data by iteratively adjusting the sample weights to meet target population data across various segments of the popu-lation. The population targets for the ACS 3-year estimates are based on averages over the pooled years. NRP data can initially be pooled in a similar manner, but NRP will most likely use the population totals for the final year of the samples that are pooled together as its targets. For example, the samples for Tax Years 2006, 2007, and 2008 can be pooled together with the stratum weights adjusted using the following process within each stratum:
Step 1: Prior to pooling the data, assign each case a weight equal to the inverse of the probability of being selected, where the probability of being selected is the ratio of the number of returns sampled in the case’s stratum to the stratum population. Except for further adjust-ments made by NRP, this is the typical weight that would initially be assigned to each case.
Step 2: Multiply the weight assigned in Step 1 by the ratio of the sum of the weights within the given stratum in Tax Year 2008 to the sum of all weights for that stratum across Tax Years 2006, 2007, and 2008.
We are often interested in a point estimate of underreporting for a specific tax year. Each tax year, the individual income tax brackets, stan-
18 Rivers, Kerri L.; Mark Mather; and Linda A. Jacobsen (2006), “American Community Survey: A Guide for Data Users,” The Population Reference Bureau.
Brown and Johns148
dard deductions, and exemption amounts creep upwards impacting effective average marginal tax rates. Alternatively, Congress may make changes to the actual tax rates. The above method would supply a pooled sample that hits the population targets for Tax Year 2008, but the actual data across tax years may need to be adjusted further to account for such issues as inflation, changes in tax law, economic changes like the distribution of income across various types of income, and other potential factors. In order to account for inflation, dollar amounts are adjusted in the ACS estimates to the most recent year by the Consumer Price Index (CPI). This approach could be used to adjust the NRP pooled data, but it does not really address the larger issue of data compatibility across tax years.
One way of handling the issue of compatibility of the results across tax years is to use the reported and corrected amounts of items like income, filing status, and number of exemptions with a detailed tax calculator that is calibrated to the tax year of analysis. The tax calculator could then be used to calculate the reported and corrected amounts of taxes, credits, deductions, and other variables whose maximum amounts and phaseout levels vary by Tax Year. The pooled data could be aged in a manner such that the reported amounts of items that feed into the calculator for Tax Years 2006 and 2007 are adjusted proportional to the reported amounts from 2008. The follow-ing steps would yield a pooled data set with the population estimates equal to the population targets for Tax Year 2008, the weighted reported amounts equal to the weighted estimates for Tax Year 2008, and the net misreporting percentages for each case and stratum maintained within each third of the pooled sample.
Step 1: Within a given tax year and stratum, calculate the total weighted reported amount for a given line item. If the weights have been previously adjusted so that the sum of the pooled weights equals the Tax Year 2008 population totals, then use the adjusted weights.
Step 2: On a case-by-case basis for Tax Year 2006, multiply the reported amount for Tax Year 2006 by the ratio of the total weighted reported amount calculated in Step 1 for Tax Year 2008 to the total weighted reported amount calculated in Step 1 for Tax Year 2006. Repeat for the Tax Year 2007 cases.
Step 3: On a case-by-case basis for Tax Years 2006 and 2007, multi-ply the amount that should have been reported and the net misreported amount by the same ratio used in Step 2.
National Research Program—Methods and Plans 149
Step 4: Use the tax calculator and the adjusted weights and adjusted income variables to estimate the remaining reported amounts and amounts that should have been reported for items that depend on the target year’s tax laws.
The above discussion emphasizes the potential need for a microlevel pooled dataset that represents one specific tax year, which is the likely re-quirement for updating tax gap estimates. If all we are interested in are mac-rolevel estimates of noncompliance based on the raw data, then the results of each study could be averaged over 3 years. One possible method of averag-ing would be to calculate a weighted mean with the weights inversely pro-portional to the estimated variances.19 This method implicitly assumes that the measures being averaged actually represent the same mean. Although the tax years differ and compliance may evolve over time, this assump-tion may be reasonable enough in order to average the results across years. Another option would be to take the simple weighted mean. A third option would be to pool 3 years’ worth of data without necessarily adjusting the weights or the values if we were not concerned about estimating a specific year and only wanted the average over 3 years. Either way, the data could also be adjusted to control for inflation by using the CPI index. This method of adjusting for inflation was used by researchers in Statistics of Income (SOI) to compare selected income and tax return items across tax years.20
Regardless of the method of pooling the data, caution must be used when comparing results across different time periods. Even comparing results from 1 year to the next will require knowing the statistical reliability of the estimates, given reduced sample sizes for the annual studies. Com-parisons of estimates from pooling 3 years of data will require particular scrutiny because time periods will overlap. For example, if the annual studies are extended to Tax Year 2009, then the 3-year estimates using Tax Years 2006, 2007, and 2008 will overlap with estimates based on pooling Tax Years 2007, 2008, and 2009. Comparing results from the two separate 3-year pools of data would essentially be comparing Tax Year 2009 to Tax Year 2006 because Tax Years 2007 and 2008 wash out. Although direct
19 Cochran, William G. and Sarah Porter Carroll (1953), “A Sampling Investigation of the Efficiency of Weighting Inversely as the Estimated Variance,” Biometrics, Volume 9, Number 4, pp. 447- 459.20 Strudler, Michael and Michael Parisi “Selected Income and Tax Items from Inflation-Indexed Individual Tax Returns, 1990-2001,” Statistics of Income Bulletin,Volume 23, Number 4, pp. 200-212. Available at http://www.irs.gov/pub/irs-soi/01ininfl.pdf.
Brown and Johns150
comparisons may be complicated, if the annual studies are institutionalized and maintained, then the pooled results will be useful for analyzing trends.
NRP S Corporation Study of Tax Years 2003 and 2004: Analytical and Methodological ChallengesNRP is currently in the process of a study of income and tax underreporting on S corporation income tax returns (Forms 1120-S) for Tax Years 2003 and 2004. Approximately 25 percent out of around 5,000 returns were selected during Processing Year 2004 for Tax Year 2003, with the remainder of the returns selected during Processing Year 2005 for Tax Year 2004. Audits of many of these cases are still ongoing. S corporations are unique in that the corporation must file an income tax return, but the majority of its income is exempt from taxation at the corporate level. Instead, the corporation’s income flows down on a proportional basis to its shareholders who are then taxed at their individual rates. For Tax Years 2003 and 2004, in order to elect to be treated as an S corporation, a corporation must have been a domestic entity with no more than 75 shareholders who consist of individu-als, married couples, estates, certain exempt organizations, and certain trusts. The law was changed for tax years after 2004 to allow up to 100 sharehold-ers of an S corporation. In reality, the vast majority of S corporations have far fewer shareholders, with the average number of shareholders between one and two.
The division of the study over 2 tax years presents analytical chal-lenges similar to those created by the new multiyear individual income tax underreporting study that began with Tax Year 2006. Each study is a com-posite of the tax years being sampled. The summary results of the Tax Year 2003 study could be averaged with the summary results of the Tax Year 2004 study with either a simple mean or a weighted mean where the weights are inversely proportional to their respective estimated variances. This method-ology could provide an overall estimate of the net misreported amounts for various line items from Form 1120-S based on errors detected by examiners.
Flowthrough Income and Tax Gap MeasurementThe income from an S corporation flows down to shareholders. Thus, to actually estimate the tax impact of the underreporting of income and overre-porting of deductions by S corporations, we need to know information about the shareholders, including their individual income tax returns. The effec-tive marginal tax rate of the underreported S corporation income will depend not only on the S corporation but ultimately on the various Form 1040 return
National Research Program—Methods and Plans 151
characteristics of the shareholders. Although aggregate macromeasures of noncompliance may be possible by averaging the results of the 2 tax years, a reliable estimate of the tax impact requires pooling the 2 tax years at the microlevel. Pooling the data requires choosing a target tax year, with Tax Year 2004 the logical choice because it is the most recent tax year and the year from which most cases were sampled. The weights could be adjusted following the procedure outlined previously in the section discussing the individual income tax multiyear study to ensure that the sum of the weights from the pooled sample matches the 1120-S population for Tax Year 2004. Dollar amounts could also be adjusted for inflation by using the CPI index or adjusted so that the weighted average income for each item from Tax Year 2003 matches the weighted average income for each item for Tax Year 2004. This method could be applied at the stratum level as described in the individual section or at the aggregate level.
Underreporting of income on Form 1120-S and underreporting of tax on Form 1040 must be linked. NRP is tracking the audits of shareholders which would supply information on the flowthrough adjustments, includ-ing the resulting change in individual income tax. However, if auditors expand the audits of the shareholders beyond the flowthrough income, then the flowthrough adjustments may need to be backed out from the remaining adjustments. We may then need to use a tax calculator calibrated to Tax Year 2004 to estimate the change in tax due to the backed-out flow through ad-justments. In fact, the pooling of Tax Year 2003 returns with Tax Year 2004 returns likely necessitates the use of a tax calculator because of the changing individual income tax brackets, standard deductions, exemption amounts, and deduction thresholds, etc. between Tax Years 2003 and 2004.
One of the objectives of the S corporation study is to incorporate the results with the overall estimate of the gross tax gap. The previous discus-sion only pertains to the underreported income that examiners are actu-ally able to detect, whereas the tax gap includes undetected income. The individual underreporting portion of the latest estimate of the tax gap is for Tax Year 2001 and is partially based on random audits of Tax Year 2001 individual income tax returns. The Tax Year 2001 returns included individu-als who were shareholders of S corporations, and normal audit procedures were followed when determining whether to audit the actual S corporation. Therefore, in some cases, the entity corporation was audited along with the individual shareholders, and any adjustments would be reflected in the NRP raw results. Adding the results of the S corporation study directly to the Tax Year 2001 individual results would not be appropriate because of this over-lap, even if the Tax Year 2001 results were projected forward to 2004.
Brown and Johns152
The Tax Year 2001 tax gap estimate also includes an adjustment to Schedule E income, where S corporation ordinary, royalty, and rental in-comes are reported, for income not detected during the audits. The adjust-ment for undetected income results in additional overlap between the Tax Year 2001 Schedule E tax gap estimate and the results of the S corporation study. The tax gap estimate for Schedule E income consists of two sepa-rate estimates: 1) rental and royalty income reported on page 1 of Schedule E and 2) the aggregate of partnership, S corporation, real estate mortgage investment conduit (REMIC), and farm rental incomes reported on page 2. Therefore, the adjustment for undetected Schedule E income also includes income other than S corporation income. Theoretically, the adjustment for Schedule E undetected income can be apportioned in the following manner: 1) S corporation income that was not detected among S corporations that were audited, 2) S corporation income that was not detected because the S corporation was not audited, 3) S corporation income that was not detected and would not have been detected had the S corporation been audited, and 4) income that was not detected that is unrelated to S corporation income.
S corporation income also flows through to the interest, dividend, and capital gain income lines on Form 1040. Some S corporation deductions like charitable contributions also flow through to Schedule A of the share-holders’ individual income tax returns. As with Schedule E, identifying the different portions of overlap is one of the challenges that lie ahead with incorporating the results of the S corporation study with the overall estimate of the individual underreporting tax gap.
SummaryThe National Research Program represents the commitment the IRS has made to improve the efficiency and fairness of the tax administration pro-cess. With measures of strategic compliance, the IRS will be able to make more informed strategic decisions about workload allocation, resource plan-ning, and taxpayer communication and support. These measures will also provide a benchmark against which the IRS can measure the effectiveness of programs to promote voluntary compliance with the Tax Code.
The NRP has made significant progress in the development and delivery of its strategic measures. The IRS now has Filing Rate measures for Tax Years 1992 through 2001, and the Service is working on develop-ing new filing compliance measures using new data sources for more recent years. Working with the Census Bureau, the IRS has developed Nonfiling
National Research Program—Methods and Plans 153
tax gap estimates for Tax Years 2001 and 2003. The IRS has also developed Voluntary and Cumulative Payment Compliance Rates for Tax Years 1999 through 2005. Mechanisms are in place to deliver these measures on an ongoing basis.
NRP successfully completed the first significant research effort to obtain estimates of reporting compliance from individual income tax returns in nearly 20 years and is close to completing the first reporting compliance study of Subchapter S corporations in nearly 25 years. Building on a new sample design methodology, NRP is embarking on an ongoing annual study of individual income taxpayers that will allow for more frequent updates to workload identification formulas and compliance estimates. The new meth-odology will also lead to greater opportunities for researching individual issues and line items, but it will require care in the merging of data from multiple tax years. Future reporting compliance studies will surely follow, focusing on other types of business returns, which have not been systemati-cally studied in this way since the mid-1980s.
Comments on Disentangling the Tax Gap
Eric Toder, Urban Institute
T his note briefly summarizes my oral comments on three presentations at the IRS Research Conference in June 2007:
Bob Brown and Drew Johns presented a status report on tax gap measurement at the IRS, reviewing the history of the National Research Program (NRP) and future plans for new NRP studies and changes in existing methodologies.1
Jonathan Feinstein and Brian Erard presented a proposal for expanding and modifying the detection control model that was used in the latest published IRS tax gap estimates to quantify the amount of underreported individual income tax that IRS examin-ers fail to detect.
William Trautman and Petro Lisowsky discussed the effects of alternative ways of consolidating business tax returns on book-tax differences, but it was unclear exactly how their findings would be applied directly in measuring the tax gap.
NRP—Methods and Plans, by Bob Brown and Drew Johns
The authors review the history of compliance measurement at the IRS. Between 1963 and 1988, IRS audited a random sample of individual income tax returns and conducted additional random audit studies (employment tax returns, small corporation tax returns) and operational audit studies (large corporate income tax returns) under the Taxpayer Compliance Measure-ment Program (TCMP). The results of TCMP audits were used to derive estimates of the tax gap and to develop audit selection formulas. No TCMP audit studies were performed after 1988.
Former Commissioner Charles Rossotti initiated the National Research Program (NRP) to update measures of taxpayer compliance and audit selec-tion formulas. The first major NRP project was a reporting compliance
1 The paper by Brown and Johns is the only paper in this session that is included in these proceedings.
Toder156
study based on random audits of 46,000 Tax Year 2001 individual income tax returns. The audits were completed at the end of 2004, and IRS released new compliance estimates based on the results in 2006. NRP differed from TCMP by using less intrusive examination techniques, while relying more on external data (Brown and Johns, 2007; see also Toder, 2007).
Brown and Johns summarize NRP accomplishments to date and future plans. NRP has completed the 2001 individual reporting compliance study and is nearing completion of a study of 2003 and 2004 S corporation returns. NRP has also updated measures of payment compliance and filing compli-ance for individual taxpayers. For the future, NRP is planning to conduct annual reporting compliance studies of individual income tax returns, albeit with a smaller number of audits per year, and to use the estimates of income underreporting from the current study of flowthrough entities to adjust esti-mates of the individual income tax reporting gap.
The authors describe a number of benefits of NRP, beyond developing updated and improved measures of the tax gap. These include improved workload selection formulas, development of new case-building techniques that can be applied in operational audits, and better ways of capturing data from audits (the automated report generation system). The latter, as the authors note, could ultimately include better information on reasons for noncompliance, although this has not yet been done. More generally, a big potential, but as yet unrealized benefit, of NRP is to foster an IRS culture that includes integrating research more into daily operations, so that regu-lar assessments of emerging compliance issues and IRS audit effectiveness gradually substitute for occasional one-off studies by researchers divorced from day-to-day operations.
The authors raise several important technical issues that NRP will confront as it substitutes annual random audit studies with smaller samples for less frequent studies with larger samples. The reduction in the number of audits creates challenges for the use of detection control estimates (see be-low), which require statistically valid estimates of the detection ability of in-dividual auditors, because, with a smaller sample, each auditor will examine fewer returns. Developing a corps of auditors who specialize in NRP returns will alleviate this problem for pooled samples because the same auditors will be observable over multiple years of data. Pooling data by itself poses challenges, including taking account of tax law changes, changes in the CPI, and changes in population weights. There will also need to be an assessment of the validity of year-to-year changes in compliance measures using moving 3-year averages. For example, if 3 years of data are sufficient to make infer-ences about components of the tax gap, then separate valid tax gap estimates could be developed for Tax Years 2006-2008 and 2007-2009. But compari-
Comments on Disentangling the Tax Gap 157
son of the two estimates would be less statistically robust because it would really only be a comparison of the smaller annual samples in 2006 and 2009 (2007 and 2008 would be common to both studies).
In my oral comments, I cautioned that reducing noncompliance is not analogous to the business goal of maximizing profit. Business profit is the difference between revenue and cost, while noncompliance is more closely analogous to uncollected revenue. Efforts to recover that revenue are only “profitable” to the extent that marginal revenues exceed marginal costs. Return on investment (including improved voluntary compliance due to enforcement, which is hard to measure) is more analogous to business profit-ability than changes in the tax gap. Moreover, changes in the estimated tax gap could occur for many reasons other than IRS effectiveness, including changes in the estimation method itself, changes in the tax law, and changes in taxpayer attitudes toward Government and the tax system.
Models of Household Tax Underreporting and the NRP Examination Process,
by Jonathan Feinstein and Brian ErardIn earlier tax gap estimates based on TCMP studies, IRS applied a multiple of 3.28 to underreported income from “low visibility” items not subject to information reporting, such as income from businesses, partnerships, and farms reported on Schedules C, E, and F (Internal Revenue Service, 1996). The multiple was based on a comparison of 1976 TCMP audit results with and without the use of information reporting documents. For the tax gap estimate in NRP, IRS replaced the old TCMP multiplier with new multipli-ers derived from a detection control estimation (DCE) method developed by Feinstein (1990). DCE provides an econometric estimate of the amount that would be detected by a hypothetical auditor who combines all the best detec-tion abilities (on an item-by-item basis) of the pool of actual auditors.
The DCE method used in NRP had a major effect on the size of the estimated tax gap. IRS staff indicates that the multipliers used for “low visibility” sources of income range from 3.3 to 4.2. Using for illustration a multiplier of 3.5, Toder (2007) estimates that detection control raised the estimated portion of the tax gap that came from underreporting of small business income and self-employment tax by more than $106 billion, or 31 percent of the total estimated tax gap of $345 billion for Tax Year 2001.
At the Conference, Feinstein and Erard (2007) presented an expanded model for detection control. The expanded DCE model carefully mimics
Toder158
the NRP process of examining individual tax returns to capture the different ways that IRS classifiers and examiners may fail to detect noncompliance.
To briefly recap, NRP first selects a stratified random sample of returns to audit and then classifies each return into one of three buckets: 1) returns that will be accepted as filed, 2) returns that will be audited by correspon-dence on a limited number of issues, and 3) returns on which taxpayers will be subject to face-to-face audits. For the latter bucket (the face-to-face audits), classifiers then select the list of issues on the tax return that NRP auditors must examine. Auditors may choose to examine additional issues on a return that were not selected by classifiers if information revealed dur-ing an audit leads them to suspect that these might be additional sources of underreported tax. Errors can occur in both the classification and examina-tion stages of this process.
The new DCE model estimates a likelihood function with five cases corresponding to three possible choice sets by classifiers and examiners. In choice set 1, an income component is classified and examined. Noncompli-ance is either not detected (case 1) or detected (case 2). In choice set 2, the classifier does not classify the income component, but the auditor examines it anyway. Noncompliance is either not detected (case 3) or detected (case 4). In choice set 3, the income component is neither classified nor exam-ined; in that case, the only possible outcome is nondetection (case 5). For each case, the authors compare probabilities of classification, detection, and noncompliance.
At the Conference, the authors presented results showing the unweight-ed and weighted (to population totals) numbers of returns subject to face-to-face NRP examinations that fall into each of the five cases for a number of selected income items. They then apply the new econometric technique to derive estimated rates of detection and classification of noncompliance among examiners and classifiers. They do not present data, however, on the size of adjustments for nondetected items and do not present estimates of the parameters of the equations in the model. The results demonstrate that the new DCE technique can be applied successfully, but do not show whether the estimated tax gap would increase or decrease by substituting this more sophisticated version of the DCE model.
In summary, the paper develops a creative way of improving the DCE estimates by making them better represent the NRP process, but as yet the findings are preliminary and not fully documented. I hope that the authors will continue to pursue this promising approach to enhancing DCE.
Comments on Disentangling the Tax Gap 159
Book-Tax Consolidation Differences, Rates of Return, and Capital Structure,
by William Trautman and Petro LisowskyThe subject of the Trautman and Lisowsky (2007) presentation (again, not included in this volume) was the effect of consolidation differences in busi-ness tax reporting on reported differences in book income and tax income. The authors suggest that the way consolidation is handled in income tax reporting could create a compliance risk.
Differences between reported book income and tax income could be the legitimate result of different book and tax reporting rules (for example, for depreciation), but also could reflect overstatement of book income (to look better to investors), understatement of taxable income (to lower tax liability), or both. Further, inappropriate differences between book and taxable income could result either from errors in reporting book income or taxable income for consistently defined entities or from the use of different consolidation rules that make the scope of the entity used for reporting book profits differ from the entity used for reporting taxable profits.
The authors focus on the role of consolidation rules in explaining book-tax income differences. They note that financial statements, but not tax returns, include income from foreign subsidiaries that are more than 50-per-cent owned by the parent company, income from domestic subsidiaries that are 50-to-80-percent owned, and the percentage equity ownership in domes-tic subsidiaries that are 20-to-50-percent owned. In contrast, tax returns, but not financial statements, report dividends from unconsolidated subsidiaries (less the dividends received deduction).
The authors present tables that show trends in overall book-tax differ-ences between 1997 and 2004, by Large and Mid-Sized Business (LMSB) industry, global character of the firm, profit or loss, and quintile of the differ-ence between book and tax income. They then show differences in reported items due to consolidation differences alone, using Schedule M-3 data. The authors find that book and tax differences are large and growing and biggest for financial services companies relative to other industries, multination-als compared with domestic only businesses, and profitable compared with unprofitable companies. In addition, they find that consolidation differences result in the reporting of more assets on tax compared with book returns, but higher rates of return on assets on book compared with tax returns.
Toder160
Much of these results may have to do with how debt transactions are netted out in integrated returns, because the assignment of debt across enti-ties affects net worth. In reviewing the tables, it appears that consolidation differences did not appear to affect the absolute value of net reported income very much, so that it is the denominator of the rate of return calculation (the net asset value) that appears to affect the calculation the most.
The main takeaway point from this presentation is that consolidation rules may matter for income measurement and differ significantly between book and tax measures. The rules certainly contribute to differences in ap-parent reported yields on tax returns and financial statements, but the paper does not make clear exactly how the consolidation rule differences might contribute to the actual or estimated size of the tax gap.
References
Brown, Robert and Drew Johns (2007), “NRP-Methods and Plans,” this volume.
Feinstein, Jonathan S. (1990), “Detection Controlled Estimation,” Journal of Law and Economics 33, pp. 233-276.
and Brian Erard (2007), “Models of Household Tax Underreporting and the NRP Examination Process,” paper prepared for IRS Research Conference, June 2007.
Internal Revenue Service (1996), “Federal Tax Compliance Research: Individual Income Tax Gap Estimates for 1985, 1988, and 1992,” Publication 1415, Washington, DC.
Toder, Eric (2007), “What is the Tax Gap?” Tax Notes, October 22.
Trautman, William and Petro Lisowsky (2007), “Book-Tax Consolidation Differences, Rates of Return, and Capital Structure,” paper prepared for IRS Research Conference, June 2007.
D5
Compliance and Administrative Burdens
DeLuca Stilmar Guyton Lee O’HareMcKerchar
Gravelle
Aggregate Estimates of Small Business Taxpayer Compliance
BurdenDonald DeLuca and Scott Stilmar, IBM Global Business Services; John Guyton and Wu-Lang Lee, Internal Revenue Service; and John O’Hare,
Quantria Strategies LLC
I n 2002, IRS Headquarters Office of Research began the development of the Small Business Burden Model (SBBM) to assist IRS in measuring and monitoring the costs borne by small businesses in complying with
the Federal tax system. IRS worked with IBM’s Survey Research Center to conduct a large-scale data collection effort of Small Business (SB) taxpayer compliance costs. Data collection was accomplished in two major sur-veys: IRS Income Tax and IRS Employment Tax. Preliminary results were reported at the 2005 IRS Research Conference, documenting average burden for the small business population.1 This paper presents an estimate of over-all baseline burden estimates for the small business population and describes data imputation approaches for missing survey responses on the Income Tax survey.
The survey produced an overall response rate of 38 percent for the income tax study. Despite this relatively high response rate for a survey of small businesses and no indication of nonresponse bias, a variety of missing data issues still arise. To replace missing data and estimate aggregate burden across the population, a series of survey data imputations were developed. These include both deterministic survey rules and a nearest neighbor statisti-cal match to replace missing variables.
In formulating rules and imputations, a variety of tax domain charac-teristics issues were considered. One of these issues is substitution effects between survey variables, such as the predominance of substitution between taxpayer time and money costs among the small business population.
Many of our key findings meet our prior expectations regarding the pattern of burden for these taxpayers: an overwhelming proportion of the time burden is spent on recordkeeping; most money burden is spent on se-curing the help of paid professionals; preparation method generally follows our hypothesis that businesses paying a professional to prepare their taxes are substituting monetary expenditures for spending time on tax compliance; some industry groups have higher tax compliance burden because of the na-
1 Deluca, Donald; Arnie Greenland; John Guyton; Sean Hennessey; and Audrey Kindlon (2006), “Measuring the Tax Compliance Burden of Small Businesses,” The 2005 IRS Research Bulletin, pp. 75-115. Available at http://www.irs.gov/pub/irs-soi/05deluca.pdf.
DeLuca, Stilmar, Guyton, Lee, and O’Hare164
ture of those businesses (e.g., transaction-oriented retail businesses have the highest time burden, while equipment heavy manufacturing businesses have the highest money burden); both time and money tax compliance burden generally shows a monotonically increasing relationship with business size measured several ways, consistent with an explanation of some initial fixed compliance burden costs coupled with decreasing marginal burden as size increases.
Overview of Burden ResearchThe U.S. Federal tax system has been estimated to impose 3.5 billion hours of compliance burden time plus an additional 140 billion dollars in out-of-pocket and business compliance burden costs.2 These are costs of adminis-tering the tax system above and beyond the revenue collected by the Federal Government.3 By way of comparison, the Federal tax system collected about 2.2 trillion dollars in Fiscal Year 2006.4 Previous studies have exam-ined the burden incurred by individual taxpayers, as well as by large and me-dium size businesses.5 Moody (2002) has attempted to extrapolate from the quite dated Arthur D. Little (ADL) study to estimate the burden of the small business population.6, 7 Evans (2003) reviews the international compliance burden literature.8 The present study presents new preliminary estimates of 1.7-1.8 billion hours and 15-16 billion dollars in small business income tax compliance burden for Calendar Year 2004.9
2 President’s Advisory Panel on Federal Tax Reform—Final Report, November 1, 2005, page 2.3 One might reasonably add the IRS budget of $10.6 billion in FY 2006 to the total compliance burden of the system.4 Internal Revenue Service Data Book, 2006, page 3, Table 1.5 See, for example, Slemrod, J. and V. Venkatesh (2004), “The Income Tax Compliance Cost of Large and Mid-Size Businesses,” Discussion Paper Number 2004-4, Office of Tax Policy Research, University of Michigan. Also see Stavrianos and Greenland (2002), Arena et al. (2002), and Guyton et al. (2003).6 Moody, J. Scott (2002), “The Cost of Complying with the Federal Income Tax,” Special Report, Number 114, Tax Foundation, Washington, DC.7 Arthur D. Little, Inc., “Development of Methodology for Estimating the Taxpayer Paperwork Burden,” Final Report to Department of the Treasury, Internal Revenue Service, Washington, DC, June 1988.8 Evans, Chris, “Studying the Studies: An Overview of Recent Research into Taxation Operating Costs,” The eJournal of Tax Research 1, 1(2003), pp. 64-92.9 This study is described in further detail in DeLuca et al. (2003), Guyton, et al. (2004), and DeLuca et al. (2005).
Aggregate Estimates of Small Business Taxpayer Compliance Burden 165
Small Business Survey Research Design and OutcomesIn order to understand associated taxpayer characteristics and compliance burden, we conducted a large-scale survey of small business taxpayers. Data collection was accomplished in two major surveys: IRS Income Tax and IRS Employment Tax. In conjunction with the qualitative data and analysis, data from both small business surveys served as direct inputs for model estima-tion and production. This paper focuses on the survey research design and outcomes of the income tax survey.
Sample DesignThe population universe for the survey was the IRS definition of a small business: a business with assets totaling no more than $10 million that is organized as a C corporation, S corporation, or partnership. The large-scale survey we administered asked taxpayers about their experiences complying with their Federal income tax obligations, and focused on the burden experi-enced during the prefiling and filing time periods.
The sampling frame was developed using Processing Year 2003 Midwest Automated Compliance System (MACS) data. MACS is an IRS administrative data source containing tax return information. The majority of the records in this file were from Tax Year 2002.
We segmented tax returns into strata based on the following variables:
Primary Form Filed: Forms 1065, 1120, 1120S, 1120A, and several of the 1120 Specials including 1120F, 1120FSC, 1120H, 1120POL, and Other
Asset Class: Negative Assets, Zero Assets, $1–$99,999, $100,000–$249,999, $250,000–$499,999, $500,000–$999,999, $1,000,000–$4,999,999, and $5,000,000–$10,000,000
Tax Preparation Method: Paid Professional or Self-Prepared
Employees: Has Employees or Does Not Have Employees
Industry: Real Estate or Nonreal Estate (as defined by the NA-ICS codes)
DeLuca, Stilmar, Guyton, Lee, and O’Hare166
We used the field for Salaries and Wages as a proxy for having em-ployees. If this value was greater than zero, we concluded that the firm had employees. Using these variables and collapsing cells together, we created 27 individual strata. The next step was to select a sample of 70,000 small business taxpayers based on the 27 strata. Each stratum was assigned a dif-ferent probability of selection. The sample was selected by assigning each taxpayer a random number generated by transforming the taxpayer’s Tax-payer Identification Number (TIN). The final sample frame was reduced to 69,980 after we removed 20 duplicate records.
The last step with the income tax sample frame was to append phone numbers to each small business observation. Approximately 60 percent of the income tax sample frame had phone numbers. Initially, 14,000 small business taxpayers were selected from the income tax sample frame to begin data collection. Of these 14,000, only those with phone numbers were included in the telephone sample; the remaining observations were placed in the mail sample. During the data collection process, additional smaller samples were selected as needed in order to meet the target number of 7,000 completed interviews within a reasonable time frame without unnecessarily deflating the survey’s response rate.
Questionnaire Design The questionnaire design phase of this project was informed by leveraging prior experience developing and administering questionnaires for the W&I and SE populations. From this experience, valuable insights were gained into the effective way to structure the questionnaire, the optimal question-naire length, words and phrases that serve as effective prompts, and the appropriate way to word questions.
In addition, insights gained from qualitative research helped frame the questions. During the qualitative research, we spoke with more than 100 small businesses to understand the activities in which they engage to comply with their tax obligations. These sessions provided valuable information about the components of compliance burden, as well as the ways that tax-payers think about these issues.
One of the biggest challenges in developing the questionnaires for the small business taxpayer population was how to address joint costs. Joint costs refer to the fact that many activities in which businesses engage are done for general business reasons as well as tax purposes. We confronted this challenging issue by instructing taxpayers on the questionnaire to con-sider which activities are part of our definition of Federal tax compliance and which activities are not part of Federal tax compliance and are therefore
Aggregate Estimates of Small Business Taxpayer Compliance Burden 167
out of scope. By carefully instructing taxpayers in this way, we believe that a good measure of Federal income tax compliance costs was obtained that effectively excluded time and money associated with normal business/mana-gerial processes. This view was reinforced in our qualitative research. In the indepth interviews with taxpayers, we discussed taxpayers’ ability to isolate Federal tax compliance costs from costs associated with State or lo-cal tax, or normal business functions and found that, with carefully worded questions, this was possible. One caveat to this general conclusion sur-rounds the reporting of tax-related software costs. The amounts reported in this area appear to closely match the pricing for business tax software with bookkeeping bundled in. Further research and analysis seemed warranted before making a final determination as to the degree to which this burden is purely tax-related. In contrast, taxpayers seemed much more capable of separating tax-related professional fees from more general bookkeeping, business advisory, and legal fees.
After the draft questionnaire was developed, it was vetted through day-long workshops with the IRS and the project’s interagency working group. It was pretested on a small sample of taxpayers to determine the length of the questionnaire and identify areas where questions needed to be dropped or modified. The final income tax questionnaire is divided into 11 sections, each focusing on one of the major compliance activity categories that we devised (e.g., recordkeeping, working with a paid professional, etc.) and takes approximately 20 minutes to complete. Skip patterns are used so that taxpayers avoid spending time on sections not applicable to their situations.
Data CollectionThe income tax survey was conducted using a mixed-mode telephone and mail protocol. We believe this methodology, which was used in our earlier studies, is the most effective way to maximize response rate, given the target goals and timeframe.
Telephone Survey Protocol: The telephone interviews were conduct-ed using the IBM Computer Assisted Telephone Interviewing (CATI) Center. Once a taxpayer was reached over the telephone, he or she was asked several screening questions to ensure that the proper individual within the small business would be interviewed. These questions included the following:
Did the small business meet the IRS’s definition of a small busi-ness (i.e., filed the correct forms and had 10 million dollars or less in assets)?
Did the company pay income or employment taxes during the most recent 12 months?
DeLuca, Stilmar, Guyton, Lee, and O’Hare168
Who was the person most knowledgeable about the businesses’ tax compliance work?
All potential respondents were mailed two letters (in one envelope): one from IBM that informed them of the study, and another from IRS Commissioner Mark Everson describing the importance of the study. Also included in this mail packet was a good faith gesture (and “attention getter”) of a 1-dollar bill. Sometimes, this mail package was sent/received before the respondent was identified over the telephone. Other times, the mail package immediately followed the initial telephone call.
In addition, the CATI center utilized other methods to increase re-sponse rate, including the following:
Making multiple callbacks that were scheduled on different days of the week and at various times of day to increase the likelihood of reaching potential respondents.
Employing refusal conversion techniques to complete interviews with those taxpayers offering initial soft refusals.
Leaving voicemails for the small businesses to contact the CATI Center at their own convenience via a toll-free number.
However, we were unable to reach some taxpayers despite multiple attempts. These observations were transferred to the mail sample. Toward the end of the data collection timeframe, mail questionnaires were sent to all respondents that were unresolved in the telephone sample. We continued to contact these participants via the CATI Center protocol in conjunction with the established mail protocol which is described in the next section. This combined effort was a final attempt to obtain completes from prospective telephone respondents by encouraging them to complete the questionnaire using either survey mode.
Mail Survey Protocol: A mail questionnaire was also developed to contact those without a telephone number. The initial mail sample included only those income or employment taxpayers without a phone number. The mail protocol developed included multiple mailing and reminder postcards. Taxpayers were sent an initial mailing that contained the survey question-naire, a letter from the IRS Commissioner, a letter from IBM, a postage-paid envelope, and a 1-dollar bill as a good faith gesture. One week after the first mailing, sampled taxpayers received a postcard reminding them of the study. Three weeks after receiving the initial package, prospective respondents re-ceived the same package minus the 1-dollar bill, but with a slightly modified IBM letter. Finally, 7 weeks after the initial mailing, taxpayers received a fi-
Aggregate Estimates of Small Business Taxpayer Compliance Burden 169
nal package, identical to the second package with the exception of a slightly modified IBM letter. Taxpayers who completed the survey at any point in this process did not receive the subsequent mailings.
The mixed-mode methodology enhances response rates in three ways. First, it relies initially and primarily on telephone interviews, which typically achieve a higher response rate than do self-administered mail questionnaires. Second, it provides a means to contact taxpayers for whom no phone num-bers are available. Third, it offers an avenue for followup beyond repeated telephone calls. Taxpayers who are called and request a mail version can be accommodated. Taxpayers who cannot be contacted by telephone will be sent a mail questionnaire, resulting in additional responses. In fact, some respondents who refused over the telephone completed a mail questionnaire when it was sent to their addresses unsolicited.
The figure below illustrates the mixed-mode methodology.
P h o n e #U n lis te d
M a ilQ u e s tio n n a ire
F irs t M a ilF o llo w -u p
M a ilF o llo w -u p
P h o n e #L is te d
T e le p h o n eQ u e s tio n n a ire
F irs t C a lle rF o llo w -u p
C a lle rF o llo w -u p
R e c e iv eS a m p le
C re a teD a ta F i le
M a il A d v a n c eL e tte r
L o o k u pP h o n e
N u m b e r
Phone #Unlisted
MailQuestionnaire
First MailFollowup
MailFollowup
CallerFollowup
First CallerFollowup
CompletedInterview
If NoPhoneContact
TelephoneQuestionnaire
Phone #Listed
ReceiveSample
CreateData File
Mail AdvanceLetter
Look up PhoneNumber
Survey NonresponseThe preliminary overall response rate was 38 percent for the income tax survey. After examining the income survey responses and comparing the populations who completed an interview with the populations who did not on critical demographic variables available (i.e., number of employees, preparation method, return form type, asset size), no substantial differences are found between the two groups. Importantly, when we compare respon-dents with nonrespondents on complexity attributes, we find no meaningful difference. The lack of difference between business taxpayers who respond-ed to the survey and those who did not shows that tax complexity is not substantially different between the two groups. This is the most compelling evidence to suggest that survey nonresponse is not likely to be correlated with compliance burden as measured in this study.
DeLuca, Stilmar, Guyton, Lee, and O’Hare170
Table 1. Completed versus Noncompleted Interviews, by Attribute Count (Income Tax)Attribute category Completed Noncompleted Total
Sum of instruction sttributes 970.16 936.35 1,906.51
% of total attribute count 51% 49%
Sum of publication attributes 1,415.51 1,345.11 2,760.62
% of total attribute count 51% 49%
Sum of K1 attributes 500.91 482.81 983.72
% of total attribute count 51% 49%
Total number of observations 6,740 11,192
Item nonresponse is very low for an overwhelming majority of the survey questions. The item nonresponse observed is primarily due to skip-pattern-instructions on the mail questionnaire not being followed properly. Most of the questions that generated relatively high item nonresponse were difficult and somewhat obscure tax-related questions (e.g., the highest being a question about “accrual and hybrid accounting”) and not questions about compliance burden (i.e., time and money).
Since only respondent/nonrespondent differences that can be shown to be biased relative to the dependent variable in this study (i.e., compliance burden) are important to understand and mitigate, we therefore conclude that there is no evidence to suggest nonresponse bias. To help control for response rate differences, the survey responses were weighted, by strata, to account not only for the probability of selection but also for survey nonre-sponse.
Nearest Neighbor Imputation MethodologyEven though item nonresponse is low for the questions covering compliance burden, careful treatment is taken to produce accurate and unbiased popula-tion estimates. Typically, there are two general ways to handle item non-response in surveys. The first is to exclude the response through deletion. This can either be through listwise deletion, the exclusion of all records with any missing information, or pairwise deletion, the exclusion of the missing response for only the one question used in current analysis. The alternative to record exclusion is record imputation, assigning a value or set of values to replace the nonresponse.
Aggregate Estimates of Small Business Taxpayer Compliance Burden 171
We have chosen imputation rather than deletion for several reasons. Removing records through listwise deletion is unsatisfying since burden is measured independently through 10 questions covering the separate tax compliance activities. Nonresponse for one particular activity may not imply that the estimates for another activity are not accurate. Correcting for nonresponse through pairwise deletion assumes that the missing responses are missing completely at random and are exactly similar to those individu-als who do respond. Assuming that the nonrespondents to any particular question closely resemble the question’s respondents could lead to biased estimates. Therefore, an imputation approach that attempts to control for differences between the respondent and nonrespondent populations will minimize the potential for this bias.
In the next section of the paper, we will begin with discussion of nonre-sponse and outline an implemented methodology for imputation.
Responses To ImputePrior to developing imputations for particular survey responses, we first de-termined which responses should be imputed for each question. This catego-rization of the responses designates which responses will be imputed, which will be kept, and which will be used to impute values to other records.
Responses are classified into four categories: Positive Responses, Zero Responses, Implicit Zeros, and Missing Responses. Each of these four categories receives a different treatment. The four categories are defined in general terms below, with suggested treatment.
Positive Responses: This category includes all nonzero and nonmissing responses. Positive Response values will be left as reported without alteration.
Zero Responses: Zero Responses result when taxpayer respon-dents reported a value of zero or checked a box indicating “none.” Zero responses will be left as reported and used in final burden totals.
Implicit Zeros: The survey included skip-pattern logic enforced on the telephone survey to skip taxpayers out of particular ques-tions based on an earlier response. By definition, skip patterns are designed to eliminate the need to ask a taxpayer a question when the answer is strongly expected to be irrelevant and result in an answer that is “not applicable” (NA). These responses will be treated as implicit zero responses rather than missing values.
DeLuca, Stilmar, Guyton, Lee, and O’Hare172
Missing Values: This category includes all Don’t Know (DK) and Refusal (RF) responses and mail survey blanks where a posi-tive response is expected. Further, one of our treatments explores the sensitivity of our results to extremal values by setting values five standard deviations above the mean to missing. All missing responses will be imputed.
In summary, rules determine Implicit Zeros that are not applicable to the taxpayer’s situation. For respondent’s responses that are applicable, Zero and Positive responses are used to impute responses for Missing Val-ues. Now that we have identified the responses eligible for imputation, the next section will discuss the imputation methodology.
Imputation ApproachWe rely on a nearest neighbor algorithm to replace missing values of rel-evant survey variables. Nearest neighbor methods replace a missing value for a particular question with the valid response obtained from a record that closely resembles the respondent who reported the missing value. When a survey respondent reports more than one missing value, then all the valid data from the nearest neighbor are used in the imputation.
Researchers measure “closeness” in different ways when determining the nearest neighbor. In our imputations, described in more detail below, we first partition the survey into mutually-exclusive and exhaustive categories (i.e., cells) and enforce matches only between records in each cell. These cell definitions are chosen so that only records which are similar across impor-tant dimensions are contained in each cell. The variables that are chosen to define a partition are usually called “blocking variables.” Once each record is assigned to a particular cell, its nearest neighbor is defined as the record that has the minimum distance with respect to some metric.
ImplementationWe assign each survey response to one of 32 separate cells based on five criteria: (1) entity type; (2) whether the business has employees; (3) whether the business incurs any income tax liability; (4) primary preparation method; and (5) whether the business claimed a deduction for depreciation. Our pre-liminary analysis of the survey data indicates that these variables are highly correlated with the income tax burden of small businesses.
Aggregate Estimates of Small Business Taxpayer Compliance Burden 173
In order to maintain a minimum cell size of about 50, not every survey respondent was assigned to a unique cell defined by all five criteria, and some cells were collapsed. For example, because more than 85 percent of respondents used a paid professional to complete their taxes, there are relatively few records in the other preparation method categories to support additional assignment. Similarly, because partnerships and S corporations generally do not themselves incur any income tax liability (i.e., they are passthroughs), this category is only relevant for C corporations. Our final partition, along with weighted and unweighted counts, is shown in Table 2.
With the partition in place, a collection of potential donors for each record is identified, and we determine the nearest neighbor for each record according to a normalized, weighted Euclidean distance function:
dij = [Σk ( ( Xik - Xjk ) / σk)2 ] ½
Here, dij is the distance between records i and j within a particular cell, the X’s represent business-related measures from the administrative data, and σ is the standard deviation of each of the X variables within each cell. The X variables selected are:
Total Assets—Total Assets are reported on the front of the main Income Tax Return.
Total Receipts—Calculated as the sum of Gross Receipts, Rental Real Estate Income, Interest Income, Dividend Income, Royalties Income, and Other Income.
Capital Gain Income
Total Income
Depreciation Deduction
Interest Deduction
Number of Employees
Total Tax
Alternative Minimum Tax
Partner Capital Accounts
DeLuca, Stilmar, Guyton, Lee, and O’Hare174Ta
ble
2. N
eare
st N
eigh
bor M
atch
, Par
titio
nsU
nwei
ghte
dW
eigh
ted
Part
ition
Entit
y ty
peEm
ploy
ee
type
Tax
type
Prep
arat
ion
m
etho
dD
epre
ciat
ion
ty
peN
umbe
rPe
rcen
tage
Num
ber
Perc
enta
ge
1C
cor
pora
tion
No
empl
oyee
sN
o ta
x lia
bilit
yP
aid
prof
essi
onal
No
depr
ecia
tion
247
3.6%
233,
416
3.2%
2C
cor
pora
tion
No
empl
oyee
sN
o ta
x lia
bilit
yP
aid
prof
essi
onal
Has
dep
reci
atio
n25
43.
7%26
7,54
63.
7%
3C
cor
pora
tion
No
empl
oyee
sN
o ta
x lia
bilit
yS
elf-p
repa
rer—
no
softw
are
N/A
139
2.1%
48,8
720.
7%
4C
cor
pora
tion
No
empl
oyee
sN
o ta
x lia
bilit
yS
elf-p
repa
rer—
with
sof
twar
eN
/A12
81.
9%45
,827
0.6%
5C
cor
pora
tion
No
empl
oyee
sH
as ta
x lia
bilit
yP
aid
prof
essi
onal
No
depr
ecia
tion
791.
2%83
,249
1.1%
6C
cor
pora
tion
No
empl
oyee
sH
as ta
x lia
bilit
yP
aid
prof
essi
onal
Has
dep
reci
atio
n15
52.
3%14
1,15
51.
9%
7C
cor
pora
tion
No
empl
oyee
sH
as ta
x lia
bilit
yS
elf-p
repa
rer—
no
softw
are
N/A
580.
9%18
,266
0.3%
8C
cor
pora
tion
No
empl
oyee
sH
as ta
x lia
bilit
yS
elf-p
repa
rer—
with
sof
twar
eN
/A60
0.9%
15,3
710.
2%
9C
cor
pora
tion
Has
em
ploy
ees
No
tax
liabi
lity
Pai
d pr
ofes
sion
alN
o de
prec
iatio
n88
1.3%
78,4
721.
1%
10C
cor
pora
tion
Has
em
ploy
ees
No
tax
liabi
lity
Pai
d pr
ofes
sion
alH
as d
epre
ciat
ion
555
8.2%
531,
881
7.3%
11C
cor
pora
tion
Has
em
ploy
ees
No
tax
liabi
lity
Sel
f-pre
pare
r—no
so
ftwar
eN
/A82
1.2%
26,2
070.
4%
12C
cor
pora
tion
Has
em
ploy
ees
No
tax
liabi
lity
Sel
f-pre
pare
r—w
ith s
oftw
are
N/A
117
1.7%
42,3
300.
6%
13C
cor
pora
tion
Has
em
ploy
ees
Has
tax
liabi
lity
Pai
d pr
ofes
sion
alN
o de
prec
iatio
n47
0.7%
46,6
420.
6%
14C
cor
pora
tion
Has
em
ploy
ees
Has
tax
liabi
lity
Pai
d pr
ofes
sion
alH
as d
epre
ciat
ion
324
4.8%
293,
308
4.0%
15C
cor
pora
tion
Has
em
ploy
ees
Has
tax
liabi
lity
Sel
f-pre
pare
r—no
so
ftwar
eN
/A50
0.7%
17,0
500.
2%
16C
cor
pora
tion
Has
em
ploy
ees
Has
tax
liabi
lity
Sel
f-pre
pare
r—w
ith s
oftw
are
N/A
741.
1%19
,697
0.3%
Aggregate Estimates of Small Business Taxpayer Compliance Burden 175
Tabl
e 2.
Nea
rest
Nei
ghbo
r Mat
ch, P
artit
ions
Unw
eigh
ted
Wei
ghte
d
Part
ition
Entit
y ty
peEm
ploy
ee
type
Tax
type
Prep
arat
ion
m
etho
dD
epre
ciat
ion
ty
peN
umbe
rPe
rcen
tage
Num
ber
Perc
enta
ge
17S
cor
pora
tion
No
empl
oyee
sN
o ta
x lia
bilit
yP
aid
prof
essi
onal
No
depr
ecia
tion
352
5.2%
624,
152
8.6%
18S
cor
pora
tion
No
empl
oyee
sN
o ta
x lia
bilit
yP
aid
prof
essi
onal
Has
dep
reci
atio
n29
44.
3%56
6,81
57.
8%
19S
cor
pora
tion
No
empl
oyee
sN
o ta
x lia
bilit
yS
elf-p
repa
rer—
no
softw
are
N/A
197
2.9%
79,1
641.
1%
20S
cor
pora
tion
No
empl
oyee
sN
o ta
x lia
bilit
yS
elf-p
repa
rer—
With
sof
twar
eN
/A28
64.
2%10
4,40
61.
4%
21S
cor
pora
tion
Has
em
ploy
ees
No
tax
liabi
lity
Pai
d pr
ofes
sion
alN
o de
prec
iatio
n16
92.
5%31
8,38
44.
4%
22S
cor
pora
tion
Has
em
ploy
ees
No
tax
liabi
lity
Pai
d pr
ofes
sion
alH
as d
epre
ciat
ion
623
9.2%
1,28
3,91
917
.7%
23S
cor
pora
tion
Has
em
ploy
ees
No
tax
liabi
lity
Sel
f-pre
pare
r—no
so
ftwar
eN
/A12
31.
8%62
,748
0.9%
24S
cor
pora
tion
Has
em
ploy
ees
No
tax
liabi
lity
Sel
f-pre
pare
r—w
ith s
oftw
are
N/A
245
3.6%
102,
196
1.4%
25P
artn
ersh
ipN
o em
ploy
ees
No
tax
liabi
lity
Pai
d pr
ofes
sion
alN
o de
prec
iatio
n73
510
.8%
1,25
6,83
817
.4%
26P
artn
ersh
ipN
o em
ploy
ees
No
tax
liabi
lity
Pai
d pr
ofes
sion
alH
as d
epre
ciat
ion
199
2.9%
253,
050
3.5%
27P
artn
ersh
ipN
o em
ploy
ees
No
tax
liabi
lity
Sel
f-pre
pare
r—no
so
ftwar
eN
/A16
72.
5%14
8,99
02.
1%
28P
artn
ersh
ipN
o em
ploy
ees
No
tax
liabi
lity
Sel
f-pre
pare
r—w
ith s
oftw
are
N/A
220
3.2%
206,
184
2.8%
29P
artn
ersh
ipH
as e
mpl
oyee
sN
o ta
x lia
bilit
yP
aid
prof
essi
onal
No
depr
ecia
tion
118
1.7%
81,5
901.
1%
30P
artn
ersh
ipH
as e
mpl
oyee
sN
o ta
x lia
bilit
yP
aid
prof
essi
onal
Has
dep
reci
atio
n40
25.
9%21
2,63
02.
9%
31P
artn
ersh
ipH
as e
mpl
oyee
sN
o ta
x lia
bilit
yS
elf-p
repa
rer—
no
softw
are
N/A
590.
9%6,
985
0.1%
32P
artn
ersh
ipH
as e
mpl
oyee
sN
o ta
x lia
bilit
yS
elf-p
repa
rer—
with
sof
twar
eN
/A13
42.
0%25
,356
0.4%
Tota
l6,
780
100.
0%7,
242,
697
100.
0%
—C
ontin
ued
DeLuca, Stilmar, Guyton, Lee, and O’Hare176
Once the nearest neighbor for each record is determined, our imputa-tion algorithm proceeds according to a two-step process. First, we identify the missing data for each record in a sequential or variable-by-variable manner. Next, for each variable where an imputation is required, we obtain a valid response from the nearest eligible donor. Here, eligibility means having a nonmissing response for the variable. This approach is equivalent to simul-taneous replacement of missing values (in a nearest-neighbor framework) if eligible donor records are restricted to complete response observations.
Nearest neighbor imputation of missing data is conceptually similar to statistical matching, but there are some notable differences:
1. In a classic statistical matching setup, we combine data from two files. Here, we are matching one file onto itself.
2. A desirable property of a statistical matching is that the resulting, matched data file resembles both input files. In nearest neighbor imputation, we usually want the final file to be different, at least across some dimensions.
3. When missing data are present in both host and donor records, there is no unique nearest neighbor for a single target record.
ResultsIn this section, we provide a preliminary analysis at total burden results and share insights into the total compliance burdens experienced by the small business population. With item nonresponse corrections, we provide aggre-gate estimates for the total Small Business population using sample weights.
The IRS Taxpayer Burden Model Working Group and model review committee are currently investigating and validating the preferred method for handling extreme (outlier) values. Since the choice of methodology for handling the highest reported responses will impact both total and average estimates, we are reporting ranges of results to control for the variability
Aggregate Estimates of Small Business Taxpayer Compliance Burden 177
in the outcome of this process. Once this process is complete, final esti-mates can be provided. Independent of the final averages, there are still key patterns in the data and results of considerable interest to the Service. Therefore, for all tables, ranges in the burden estimates will be reported to account for any potential bias due to response errors for the high reporting cases. The low end of the range reflects treating outlier values as missing and imputing responses. The high end of the range reflects an approach that caps the extreme values at five standard deviations above the mean for the responses.
Who are Small Businesses?The Small Business taxpayer population, which the IRS defines as busi-nesses having assets of $10 million or less, includes a wide range of taxpay-ers with diverse characteristics. While noting characteristics common to the majority of SB taxpayers, we also wanted to faithfully capture and represent the more uncommon and uniquely situated members. Table 3 presented below gives a quick view of the distribution of returns relative to the number of employees, asset size, and entity type, three categorizations we used to examine the population’s compliance burden.
The reporting small businesses are well-represented across the three main entity classifications, Partnerships, S corporations, and C corporations, with approximately 30 percent as partnerships, 44 percent filing as S corporations, and 26 percent as C corporations. While 56 percent of small businesses do not report having employees and 48 percent have assets less than $50,000, 11 percent of the population also has assets over $1 million. Additionally, while C corporations and S corporations tend to have higher number of employees as asset size increases, partnerships have a relatively more stable distribution of employees across the asset sizes.
With a brief understanding of the business characteristics of the report-ing population, we will now focus in the next few sections on the resulting tax compliance burden.
DeLuca, Stilmar, Guyton, Lee, and O’Hare178Ta
ble
3. S
mal
l Bus
ines
s Ta
xpay
ers,
by
Entit
y Ty
pe, A
sset
Siz
e, a
nd N
umbe
r of E
mpl
oyee
s
[T
hous
ands
of t
axpa
yers
]
Type
of t
axpa
yer
Num
ber o
f em
ploy
ees
Size
of a
sset
s
Zero
or
nega
tive
Less
than
$5
0,00
0$5
0,00
0
to <
$10
0,00
0$1
00,0
00
to <
$50
0,00
0$5
00,0
00
to <
$1
mill
ion
$1 m
illio
n an
d ov
erTo
tal
Par
tner
ship
sN
o em
ploy
ees
668
213
102
375
167
340
1,86
5
1 to
540
4826
479
2219
2
6 to
10
519
816
69
61
11 to
15
23
47
34
22
16 to
25
12
17
26
19
26 to
50
(*)
(*)
(*)
52
916
Mor
e th
an 5
01
12
32
716
All
717
286
142
459
191
397
2,19
2
S c
orpo
ratio
nsN
o em
ploy
ees
328
542
140
249
5758
1,37
5
1 to
514
448
317
920
122
141,
044
6 to
10
1053
6712
929
2130
8
11 to
15
527
2370
1118
154
16 to
25
013
531
2418
91
26 to
50
(*)
29
3413
4610
4
Mor
e th
an 5
02
(*)
(*)
813
4310
4
All
491
1,12
042
372
117
021
83,
142
C c
orpo
ratio
nsN
o em
ploy
ees
150
350
8216
462
4685
4
1 to
529
226
7915
919
2553
8
Aggregate Estimates of Small Business Taxpayer Compliance Burden 179
Tabl
e 3.
Sm
all B
usin
ess
Taxp
ayer
s, b
y En
tity
Type
, Ass
et S
ize,
and
Num
ber o
f Em
ploy
ees
[Tho
usan
ds o
f tax
paye
rs]
Type
of t
axpa
yer
Num
ber o
f em
ploy
ees
Size
of a
sset
s
Zero
or
nega
tive
Less
than
$5
0,00
0$5
0,00
0
to <
$10
0,00
0$1
00,0
00
to <
$50
0,00
0$5
00,0
00
to <
$1
mill
ion
$1 m
illio
n an
d ov
erTo
tal
6 to
10
340
2885
2319
199
11 to
15
117
1333
1315
93
16 to
25
29
737
2042
117
26 to
50
(*)
53
2210
3271
Mor
e th
an 5
01
11
57
2239
All
187
648
214
505
154
202
1,90
9
All
smal
l bus
i-ne
sses
No
empl
oyee
s1,
147
1,10
432
578
728
644
34,
093
1 to
521
475
828
440
650
621,
773
6 to
10
1811
210
222
957
5056
7
11 to
15
846
4011
027
3726
9
16 to
25
324
1374
4666
227
26 to
50
(*)
712
6124
8619
1
Mor
e th
an 5
04
23
1623
7312
2
All
1,39
42,
054
780
1,68
451
581
67,
243
Not
e: D
etai
ls m
ay n
ot a
dd to
tota
ls d
ue to
roun
ding
.
(*
) Les
s th
an 1
,000
Tax
paye
rs
—C
ontin
ued
DeLuca, Stilmar, Guyton, Lee, and O’Hare180
Compliance Costs by ActivityIn the survey, we asked businesses to report income tax compliance burden at the activity category level. We collected information about time spent on the following distinct activities: working with a paid professional, tax planning, keeping records, completing forms, submitting forms, making estimated tax payments, and working with the IRS and/or utilizing prefiling and filing services. This allows us to understand which aspects of the tax compliance process impose the largest compliance costs for different groups of small business taxpayers.
Our survey found that the overwhelming majority of time burden is spent in recordkeeping activities. Additionally, total money burden is almost entirely Paid Professional Fees. To compensate for the fact that not all indi-viduals incur each activity, there are two sets of means provided. The first mean provides a population mean that includes values of 0 for individuals who did not participate in a particular activity. The second mean provides the mean burden for only those individuals who incurred burden or were the affected population. For categories with relatively few numbers of taxpayers
Table 4. Burden Summary, by Burden Category, for Taxpayers Reporting Burden
Small business income tax compliance burden
Amount(millions of hours)
Population average (hours)
Affected average (hours)
All time categories Low High Low High Low High
Paid professional 123.7 137.8 17 19 20 23
Recordkeeping time 1,451.8 1,559.6 200 215 238 255
Total money $14,976.5 $16,411.1 $2,068 $2,266 $2,068 $2,266
Note: Details may not add to totals due to rounding.
Aggregate Estimates of Small Business Taxpayer Compliance Burden 181
incurring any burden, the second may provide a more accurate level of bur-den for those who actually undertake that activity. For example, reporting average money burden for software purchases while including individuals who do not purchase software as zero is potentially misleading. For estimat-ing the compliance burden by burden category across the entire taxpaying population, the first average is more appropriate.
Firm StructureAnother demographic factor impacting compliance burden is firm struc-ture/taxpayer entity type. The small businesses in our sample are structured as Partnerships, S corporations, and C corporations. Each of these business structures has unique tax characteristics which influence their tax situa-tions and, presumably, the level of compliance burden. For example, both Partnerships and S corporations are passthrough entities, and all tax liability is passed through to the individual owners. In addition, each of these firm structures has different recordkeeping requirements, files different primary tax forms, deals with different sections of the Tax Code, and produces differ-ent types of information returns.
DeLuca, Stilmar, Guyton, Lee, and O’Hare182Ta
ble
5. B
urde
n Su
mm
ary,
by
Entit
y Ty
pe
Taxp
ayer
s (th
ousa
nds)
Tim
e bu
rden
Mon
ey b
urde
n
Am
ount
(m
illio
ns o
f hou
rs)
Aver
age
(hou
rs)
Am
ount
(m
illio
ns o
f dol
lars
)Av
erag
e (d
olla
rs)
NPe
rcen
tage
Low
Hig
hLo
wH
igh
Low
Hig
hLo
wH
igh
All
busi
ness
es7,
243
100.
0%1,
709.
01,
844.
223
625
5$1
4,97
6.5
$16,
411.
1$2
,068
$2,2
66
Type
of t
axpa
yer
P
artn
ersh
ip2,
192
30.3
%47
6.6
540.
021
724
6$4
,611
.5$5
,209
.3$2
,104
$2,3
77
S
cor
pora
tion
3,14
243
.4%
752.
080
5.2
239
256
$6,4
44.2
$7,0
45.3
$2,0
51$2
,242
C
cor
pora
tion
1,90
926
.4%
480.
349
9.1
252
261
$3,9
20.7
$4,1
56.4
$2,0
54$2
,177
Not
e: D
etai
ls m
ay n
ot a
dd to
tota
ls d
ue to
roun
ding
.
Tabl
e 6.
Bur
den
Sum
mar
y, b
y Pr
epar
atio
n M
etho
d
Taxp
ayer
s (th
ousa
nds)
Tim
e bu
rden
Mon
ey b
urde
n
Am
ount
(m
illio
ns o
f hou
rs)
Aver
age
(hou
rs)
Am
ount
(m
illio
ns o
f dol
lars
)Av
erag
e (d
olla
rs)
NPe
rcen
tage
Low
Hig
hLo
wH
igh
Low
Hig
hLo
wH
igh
All
busi
ness
es7,
243
100.
0%1,
709.
01,
844.
223
625
5$1
4,97
6.5
$16,
411.
1$2
,068
$2,2
66
Type
of t
axpa
yer
Pai
d pr
ofes
sion
al6,
273
86.6
%1,
511.
61,
616.
424
125
8$1
4,31
1.9
$15,
531.
8$2
,281
$2,4
76
Sel
f-pre
pare
r—no
sof
twar
e40
85.
6%65
.966
.916
116
4$2
0.2
$20.
7$4
9$5
1
Sel
f-pre
pare
r—w
ith s
oftw
are
561
7.7%
131.
416
0.9
234
287
$644
.3$8
58.6
$1,1
48$1
,529
Not
e: D
etai
ls m
ay n
ot a
dd to
tota
ls d
ue to
roun
ding
.
Aggregate Estimates of Small Business Taxpayer Compliance Burden 183
Preparation Method Another crucial characteristic which influences the compliance burden level and type is the preparation method chosen. During the survey, we asked taxpayers to tell us how they completed their tax returns: using a paid professional (paid preparers); inhouse using tax software (software prepar-ers); or completing the return inhouse without tax software (self-preparers). Our findings from the small business study, as well as from the individual taxpayer studies, tell us that preparation method is one of the most, if not the most, important variable in explaining the level and composition of total compliance burden. A priori, we expected that small businesses that elect to use a paid professional are substituting monetary expenditures for time spent on tax compliance and will therefore have higher levels of total money bur-den and lower levels of time burden. We also expect that those businesses that complete their taxes inhouse without tax software will have relatively less complex tax situations and will therefore spend smaller amounts of time on tax compliance. In addition, monetary burden outlays of self-preparers might be expected to be relatively minimal, as such businesses incur costs only in form submission (e.g., photocopies, postage, and transportation). We expect that software preparers will have significant expenses associated with tax software. Software can often serve as a proxy variable for a more complex tax situation driving higher time compliance burden.
Table 6 presents our findings by preparation method. Ignoring the impact of firm size and looking at all firms in the sample, taxpayers who use a paid preparer have the highest average money burden. Self-preparers have both the lowest average time and money burden. Paid professional users and software-prepared taxpayers have very similar average time burden fig-ures. Money burden increases some with the presence of software users and more with the use of a paid professional. It is also important to note that 86 percent of small businesses use a paid professional for tax preparation and is, therefore, the population that is driving the aggregate results.
Industry The next demographic characteristic we reviewed is how Industry affects compliance burden. The industry can be a controlling indicator for the types of business and tax compliance activities a business encounters. Construc-tion businesses may not have many transactions on a daily basis but do face particular income accounting requirements for projects that overlap with ac-counting periods. Retail businesses, however, may have many transactions on a daily basis and must handle a much higher volume of receipts as well
DeLuca, Stilmar, Guyton, Lee, and O’Hare184Ta
ble
7. B
urde
n Su
mm
ary,
by
Indu
stry
Taxp
ayer
s (th
ousa
nds)
Tim
e bu
rden
Mon
ey b
urde
n
Am
ount
(m
illio
ns o
f hou
rs)
Aver
age
(hou
rs)
Am
ount
(m
illio
ns o
f dol
lars
)Av
erag
e (d
olla
rs)
NPe
rcen
tage
Low
Hig
hLo
wH
igh
Low
Hig
hLo
wH
igh
All
busi
ness
es7,
243
100.
0%1,
709.
01,
844.
223
625
5$1
4,97
6.5
$16,
411.
1$2
,068
$2,2
66
Indu
stry
Agr
icul
ture
, for
estry
, an
d fis
herie
s31
44.
3%56
.657
.818
018
4$4
67.2
$498
.9$1
,489
$1,5
90
Min
ing
and
utili
ties
53 0
.7%
10.5
11.2
196
210
$80.
3$8
0.5
$1,5
03$1
,506
Con
stru
ctio
n64
4 8
.9%
200.
220
1.0
311
312
$1,4
18.7
$1,6
47.9
$2,2
02$2
,558
Man
ufac
turin
g32
34.
5%98
.110
0.2
304
310
$884
.9$9
08.4
$2,7
40$2
,813
Who
lesa
le tr
ade
334
4.6%
93.1
104.
127
931
2$7
69.6
$883
.1$2
,306
$2,6
47
Ret
ail t
rade
734
10.1
%23
8.5
243.
032
533
1$1
,491
.8$1
,619
.8$2
,033
$2,2
08
Tran
spor
tatio
n an
d w
areh
ousi
ng16
32.
3%37
.946
.123
328
4$3
85.7
$401
.0$2
,371
$2,4
65
Pro
fess
iona
l and
sc
ient
ific
1,35
718
.7%
271.
328
0.2
200
206
$2,9
48.3
$3,0
15.2
$2,1
72$2
,222
Fina
nce,
insu
ranc
e an
d re
al e
stat
e1,
946
26.9
%38
2.1
426.
119
621
9$4
,227
.3$4
,827
.7$2
,172
$2,4
80
Edu
catio
n an
d he
alth
394
5.4%
85.5
86.9
217
220
$839
.2$8
77.5
$2,1
28$2
,225
Arts
and
en
terta
inm
ent
798
11.0
%20
2.4
206.
725
425
9$1
,160
.1$1
,346
.4$1
,453
$1,6
86
Indu
stry
n.e
.c.
182
2.5%
32.8
80.8
180
444
$303
.3$3
04.7
$1,6
66$1
,674
Not
e: D
etai
ls m
ay n
ot a
dd to
tota
ls d
ue to
roun
ding
.
Aggregate Estimates of Small Business Taxpayer Compliance Burden 185
as returns. As industry is an indication of business activities, we now look at what influences the time and money spent on compliance activities.
The largest single industry represented by Finance, Insurance, and Real Estate accounts for almost 27 percent of the small business population and, in general terms, has relatively low time burden and average money. Retail Trade incurs the largest average time burden; Manufacturing, the largest average money burden. Agriculture, Forestry, and Fisheries incurred the smallest average time and second smallest average money burden.
Size of BusinessBusiness size is itself a general term and can be measured through several metrics. Defining the size of a business through one metric can be mislead-ing depending on the particulars of a business. As an example, a real estate partnership with two partners may have millions of dollars of assets but not have daily business and recordkeeping activities. This partnership may be very different from a law partnership with low number of assets but has fifty employees. These two businesses can each be large relative to the metric that is selected. Because of this distinction, the results of this section are displayed across three such metrics.
The number of employees is the first measure of business size used for this analysis. The number of employees is identified by matching Form 941 and Form 943 employment tax returns to the responses. In our population, 56 percent of businesses did not report having an employee. The next single largest category had between one and five employees. Generally, both aver-age time and average money burden increase monotonically with the number of employees. Businesses with more than 50 employees experienced the highest average time and money burden.
DeLuca, Stilmar, Guyton, Lee, and O’Hare186Ta
ble
8. B
urde
n Su
mm
ary,
by
Num
ber o
f Em
ploy
ees
Taxp
ayer
s (th
ousa
nds)
Tim
e bu
rden
Mon
ey b
urde
n
Am
ount
(m
illio
ns o
f hou
rs)
Aver
age
(hou
rs)
Am
ount
(m
illio
ns o
f dol
lars
)Av
erag
e (d
olla
rs)
NPe
rcen
tage
Low
Hig
hLo
wH
igh
Low
Hig
hLo
wH
igh
All
busi
ness
es7,
243
100.
0%1,
709.
01,
844.
223
625
5$1
4,97
6.5
$16,
411.
1$2
,068
$2,2
66
Num
ber o
f em
ploy
ees
No
empl
oyee
s4,
093
56.5
%81
3.4
895.
919
921
9$7
,328
.2$8
,187
.6$1
,790
$2,0
00
1 to
51,
773
24.5
%39
5.2
427.
222
324
1$2
,987
.6$3
,214
.1$1
,685
$1,8
13
6 to
10
567
7.8%
168.
518
3.2
297
323
$1,5
51.9
$1,7
00.2
$2,7
35$2
,997
11 to
15
269
3.7%
86.2
87.0
321
324
$866
.5$9
28.6
$3,2
23$3
,454
16 to
25
227
3.1%
89.0
89.5
392
394
$798
.0$8
66.6
$3,5
14$3
,816
26 to
50
191
2.6%
90.0
90.8
471
475
$795
.0$8
52.9
$4,1
57$4
,460
Mor
e th
an 5
012
21.
7%66
.770
.554
958
0$6
49.3
$661
.1$5
,341
$5,4
38
Not
e: D
etai
ls m
ay n
ot a
dd to
tota
ls d
ue to
roun
ding
.
Aggregate Estimates of Small Business Taxpayer Compliance Burden 187
As a second measure of business size, the population was categorized by size of total receipts. In an attempt to accurately categorize businesses with size of income, total receipts are a calculated field summing several items available from the IRS administrative data. As reported in the previ-ous section, 27 percent of the population reports values on the low end. Approximately 12 percent of taxpayers report zero or fewer. Excluding zero reporting cases, both average time and average money burden gener-ally increase monotonically with total receipts. Businesses with more than $1 million in total receipts experienced the highest average time and money burden.
As a third measure of business size, the population was categorized by size of total assets as reported on the front of the primary income tax return. Due to IRS reporting requirements, partnerships are not required to report assets if total receipts are less than $250,000, total assets are less than $600,000, and the partnership files all K-1’s to all partners on time. In total, 19 percent of small businesses report zero or no assets, a number inflated by the reporting requirement. Average time and average money increase with size of total assets, excluding the zero and negative asset category. Busi-nesses with more than $1 million in assets experienced the highest average time and money burden.
Across all three measure of business size, total time and money burden are highly correlated with the size of a business. Excluding special cases of reported zeros for each of these measures, both time and money generally increase linearly with the size of business. In the next section, we will take a look at how time and money change relative to each other.
DeLuca, Stilmar, Guyton, Lee, and O’Hare188Ta
ble
9. B
urde
n Su
mm
ary,
by
Size
of T
otal
Rec
eipt
s
Taxp
ayer
s (th
ousa
nds)
Tim
e bu
rden
Mon
ey b
urde
n
Am
ount
(m
illio
ns o
f hou
rs)
Aver
age
(hou
rs)
Am
ount
(m
illio
ns o
f dol
lars
)Av
erag
e (d
olla
rs)
NPe
rcen
tage
Low
Hig
hLo
wH
igh
Low
Hig
hLo
wH
igh
All
busi
ness
es7,
243
100.
0%1,
709.
01,
844.
223
625
5$1
4,97
6.5
$16,
411.
1$2
,068
$2,2
66
Tota
l rec
eipt
s
$0 o
r les
s89
512
.4%
159.
1 2
05.5
178
230
$1,8
65.3
$
2,08
1.9
$2,0
84$2
,326
Less
than
$10
,000
815
11.3
%10
9.6
111.
313
513
7$1
,210
.9$1
,213
.2$1
,486
$1,4
89
$10,
000
to $
20,0
0030
34.
2%44
.244
.314
614
6$3
01.9
$345
.1$9
98$1
,140
$20,
000
to $
50,0
0067
79.
3%12
4.7
126.
918
418
8$8
51.0
$1,0
90.6
$1,2
57$1
,611
$50,
000
to $
100,
000
715
9.9%
148.
117
5.4
207
245
$1,1
74.4
$1,3
29.1
$1,6
43$1
,859
$100
,000
to
$500
,000
2,02
928
.0%
485.
750
8.6
239
251
$3,5
68.0
$3,7
42.8
$1,7
58$1
,844
$500
,000
to $
1 m
illio
n70
59.
7%19
4.3
196.
727
627
9$1
,725
.4$1
,866
.6$2
,447
$2,6
47
Ove
r $1
mill
ion
1,10
415
.2%
443.
247
5.7
402
431
$4,2
79.6
$4,7
41.9
$3,8
78$4
,296
Not
e: D
etai
ls m
ay n
ot a
dd to
tota
ls d
ue to
roun
ding
.
Aggregate Estimates of Small Business Taxpayer Compliance Burden 189
Tabl
e 10
. B
urde
n Su
mm
ary,
by
Size
of T
otal
Ass
ets
Taxp
ayer
s (th
ousa
nds)
Tim
e bu
rden
Mon
ey b
urde
n
Am
ount
(m
illio
ns o
f hou
rs)
Aver
age
(hou
rs)
Am
ount
(m
illio
ns o
f dol
lars
)Av
erag
e (d
olla
rs)
NPe
rcen
tage
Low
Hig
hLo
wH
igh
Low
Hig
hLo
wH
igh
All
busi
ness
es7,
243
100.
0%1,
709.
01,
844.
223
625
5$1
4,97
6.5
$16,
411.
1$2
,068
$2,2
66
Tota
l ass
ets
$0 o
r les
s1,
394
19.2
%27
7.4
325.
219
923
3$1
,813
.5$1
,992
.5$1
,301
$1,4
30
Less
than
$10
,000
872
12.0
%14
6.7
177.
116
820
3$1
,155
.4$1
,439
.0$1
,325
$1,6
51
$10,
000
to $
20,0
0039
95.
5%62
.463
.415
615
9$6
76.2
$705
.6$1
,694
$1,7
67
$20,
000
to $
50,0
0078
310
.8%
156.
617
8.9
200
229
$1,3
42.2
$1,4
85.1
$1,7
15$1
,897
$50,
000
to $
100,
000
780
10.8
%16
0.9
165.
020
621
2$1
,552
.0$1
,661
.2$1
,991
$2,1
31
$100
,000
to
$500
,000
1,68
423
.3%
434.
644
1.2
258
262
$3,6
08.2
$3,7
68.5
$2,1
42$2
,237
$500
,000
to $
1 m
illio
n51
57.
1%12
8.4
135.
324
926
3$1
,542
.4$1
,696
.6$2
,996
$3,2
95
Ove
r $1
mill
ion
816
11.3
%34
2.0
358.
141
943
9$3
,286
.6$3
,662
.7$4
,025
$4,4
86
Not
e: D
etai
ls m
ay n
ot a
dd to
tota
ls d
ue to
roun
ding
.
DeLuca, Stilmar, Guyton, Lee, and O’Hare190
Burden Measured as Percentage or Fraction of Size of BusinessThis section looks at money burden (and monetized time burden) as a per-centage or fraction of three size measures in an attempt to measure “effec-tive” burden as a portion of total business receipts received, total assets, or burden per employee. In performing these calculations, we present results using two different monetization rates ($25/hour and $40/hour) to give some sense of the robustness of the underlying relationship between burden and size across different monetization assumptions. Firms must investigate whether or not a particular provision applies to their tax situations or set up general accounting procedures to record appropriate receipts, a portion of which comes as a fixed cost independent of the amount of revenue a firm generates. For this fixed portion of compliance, taxpayers with small size would have a higher burden relative to their sizes. The following three ta-bles compare the burden per unit of size across our three firm-size measures. Table 11. Money Burden and Total Monetized Burden per Employee
Taxpayers (thousands)
Money burden
Time and money burden
(Time monetized @$25/hr)
Time and money burden
(Time monetized @$40/hr)
Per employee Per employee Per employee
N Percentage Low High Low High Low High
All businesses 7,243 100.0% $349 $383 $1,346 $1,458 $1,944 $2,103
$500,000 to $1 million 515 7.1% 0.4% 0.5% 1.3% 1.4% 1.8% 1.9%
Over $1 million 816 11.3% 0.1% 0.1% 0.4% 0.5% 0.6% 0.7%
Note: Details may not add to totals due to rounding.
Aggregate Estimates of Small Business Taxpayer Compliance Burden 193
The results are consistent with the assumption that small businesses face significant fixed compliance costs combined with decreasing marginal costs as the business grows. It is important to note that the imprecise nature of each size measure to accurately capture a taxpayer’s size of business activities may exaggerate the ratio for the smaller-sized categories. For example, a business with low total assets and high total receipts would have a very different ratio of compliance burden per unit of size depending on which classification scheme is used. The general trend, however, holds consistent across all three of our measurements of size. For the smallest businesses (those with less than $10K in total receipts), the compliance costs may rival the magnitude of business total receipts. In contrast, businesses with over $1M in total receipts typically incur compliance costs that are only barely significant (about 0.3 percent) as a contributor to business expenses. When comparing burden to the size of assets, the same assumption holds valid with the smallest businesses (those with less than $10K in total assets) incurring compliance costs that rival the magnitude of businesses assets, and the largest businesses in this population incurring nominal costs of less than 1 percent of total assets.
We also present burden per dollar of gross revenue and burden per employee stratified across to provide some comparability across these size measures.
DeLuca, Stilmar, Guyton, Lee, and O’Hare194
Table 14. Money Burden and Total Monetized Burden as a Percent of Total Receipts, by Asset Size
Taxpayers (thousands)
Money burden
Time and money burden
(Time monetized @$25/hr)
Time and money burden
(Time monetized @$40/hr)
Percentage of receipts
Percentage of receipts
Percentage of receipts
N Percentage Low High Low High Low High
All businesses 7,243 100.0% 0.2% 0.3% 0.9% 1.0% 1.3% 1.5%
Total assets
$0 or less 1,394 19.2% 1.2% 1.4% 6.0% 7.0% 8.9% 10.3%
Less than $10,000 872 12.0% 1.2% 1.4% 4.8% 5.9% 7.0% 8.5%
$500,000 to $1 million 515 7.1% $290 $320 $895 $957 $1,258 $1,339
Over $1 million 816 11.3% $237 $264 $852 $908 $1,221 $1,295
Note: Details may not add to totals due to rounding.
DeLuca, Stilmar, Guyton, Lee, and O’Hare196
Time and Money CorrelationPreviously, we discussed two key facts about the relationship between time and money. First, there is an inherent tradeoff between time and money. We hypothesize that one major reason taxpayers outsource tax compliance ac-tivities to paid professionals is to minimize their own time spent, suggesting a substitution relationship between time and money. Additionally, the results from the previous section indicate that time and money both linearly in-crease with the size of a business, implying strong correlation between time and money through similar relationships with respect to the size of a busi-ness. The next table investigates potential tradeoffs between expenditures of time and money by showing how total money burden changes relative to the amount of total time burden. Vice versa, total time burden is also shown across varying amounts of total money burden.
The results show average time burden increases monotonically with size of total money burden (once over a minimal expenditure level), and, similarly, average money burden increases monotonically with size of total time burden. Since time and money burden are highly correlated, correctly identifying the inherent substitution effect of money and time will be a fu-ture challenge to tease out econometrically.
Summary and Considerations for Future ResearchWe have discussed small business taxpayer income tax compliance costs and their distribution across a variety of taxpayer characteristics. Many of our key findings meet our prior expectations regarding the pattern of burden for these taxpayers:
1. An overwhelming proportion of the time burden is spent on re-cordkeeping.
2. Most money burden is spent on securing the help of paid profes-sionals.
3. Preparation method generally follows our hypothesis that busi-nesses paying a professional to prepare their taxes are substituting monetary expenditures for spending time on tax compliance.
4. Some industry groups have higher tax compliance burden because of the nature of those businesses (e.g., transaction-oriented retail businesses have the highest time burden, while equipment heavy manufacturing businesses have the highest money burden).
Aggregate Estimates of Small Business Taxpayer Compliance Burden 197
Table 16. Time and Money Burden, by Size of Total Money and Total Time
Time burden
Taxpayers (thousands)
Amount (millions of hours)
Average (hours)
N Percentage Low High Low High
All businesses 7,243 100.0% 1,709.0 1,844.2 236 255
Size of total money
Less than $100 1,278 17.6% 285.5 295.0 223 231
$100 to $200 410 5.7% 61.9 59.4 151 145
$200 to $300 380 5.2% 61.2 70.1 160 186
$300 to $400 373 5.1% 62.5 72.9 167 197
$400 to $500 455 6.3% 89.7 90.2 197 199
$500 to $1,000 1,340 18.5% 268.6 269.6 200 202
$1,000 to $2,000 1,181 16.3% 275.6 299.0 232 255
$2,000 to $3,000 586 8.1% 145.4 146.7 247 251
$3,000 to $4,000 314 4.3% 87.6 96.1 280 306
$4,000 to $5,000 223 3.1% 73.9 73.4 331 332
$5,000 to $10,000 423 5.8% 177.5 194.6 417 465
Over $10,000 283 3.9% 119.6 177.4 465 578
Money burden
Taxpayers (thousands)
Amount (millions of dollars)
Average (dollars)
N Percentage Low High Low High
All businesses 7,243 100.0% $14,976.5 $16,411.1 $2,068 $2,266
Size of total time
Under 10 hours 801 11.1% $514.5 $533.6 $641 $667
10 to 20 hours 416 5.7% $597.2 $579.6 $1,433 $1,398
20 to 50 hours 953 13.2% $1,268.9 $1,281.5 $1,322 $1,357
50 to 75 hours 1,056 14.6% $1,778.5 $1,830.8 $1,676 $1,742
75 to 100 hours 458 6.3% $1,244.8 $1,267.9 $2,702 $2,788
100 to 200 hours 1,465 20.2% $3,438.2 $3,670.3 $2,340 $2,514
200 to 500 hours 1,213 16.7% $3,540.9 $3,964.8 $2,929 $3,261
500 to 1,000 hours 475 6.6% $1,297.1 $1,528.2 $2,765 $3,181
Over 1,000 hours 408 5.6% $1,296.4 $1,754.4 $3,288 $4,154
Note: Details may not add to totals due to rounding.
DeLuca, Stilmar, Guyton, Lee, and O’Hare198
5. Both time and money tax compliance burden show a monotoni-cally increasing relationship with business size measured several ways, consistent with an explanation of some initial fi xed compli-ance burden costs coupled with decreasing marginal burden as size increases.
We would like to conclude with a suggestion on how to interpret the data presented in this paper. It is common in the public fi nance literature to consider compliance burden as a percentage of revenue collected for a population. We suggest that such a measure may be misleading for the small business population in that most of the taxable activity is passed through to the owners\partners\members, typically individual taxpayers. We thus suggest that it may be more informative to add small business taxpayer burden to individual taxpayer burden and then divide this sum by the sum of individual and small business taxes.
Future research will involve similar missing data imputation for small business employment tax burden and development of econometric models aiding prediction of small business compliance burden changes to be ex-pected from changes to the tax system. This research program is discussed in further detail in Guyton et al. (2004) and is expected to complement the individual taxpayer burden simulation modeling discussed in Guyton et al. (2003), Lerman and Lee (2004), and Holtzblatt (2004).
AcknowledgmentsThe authors would like to thank Mark Mazur, Janice Hedemann, Michael Sebastiani, and Karen Masken of IRS; Allen Lerman and Susan Nelson of the Treasury Offi ce of Tax Analysis; Joe Cordes of George Washington University; and the project staff of IBM Global Business Services, especially Arnold Greenland, Audrey Kindlon, Patrick Langetieg, and Erica Layne Morrison for assistance in the Small Business Burden Model project design, planning, and implementation, along with analysis and review of various data inputs to this paper. The authors are indebted to our discussant at the 2007 IRS Research Conference, Jane Gravelle of Congressional Research Services, as well as to Eric Toder of the Urban Institute for helpful com-ments and suggestions on the conference draft of the paper. The authors would also like to thank the former directors of the IRS Offi ce of Taxpayer Burden Reduction, Michael Chesman and Beth Tucker, along with Mary Phillips, formerly of the IRS National Headquarters Offi ce of Research, for leadership, encouragement, and support in this research effort.
Aggregate Estimates of Small Business Taxpayer Compliance Burden 199
References
Arena, Peter; John F. O’Hare; and Michael P. Stavrianos, “Measuring Tax-payer Compliance Burden: A Microsimulation Approach,” Proceed-ings: Ninety-Fifth Annual Conference, Orlando, FL, 2002, National Tax Association, 2003, Washington, DC, pp. 333-341.
DeLuca, Donald; Arnold Greenland; Audrey Kindlon; and Michael Stavri-anos, “Challenges in Developing a Small Business Taxpayer Burden Model,” paper presented at the 2003 IRS Research Conference, Wash-ington, DC, June 2003.
Deluca, Donald; Arnie Greenland; John Guyton; Sean Hennessy; and Au-drey Kindlon, “Measuring the Tax Compliance Burden of Small Busi-nesses,” Proceedings of the 2005 IRS Research Conference, Internal Revenue Service, Publication 1500 (Revised 1-2006) Washington, DC, pp. 75-95.
Evans, Chris, “Studying the Studies: An Overview of Recent Research into Taxation Operating Costs,” The eJournal of Tax Research 1, 1 (2003), pp. 64-92.
Guyton, John L.; John F. O’Hare; Michael Stavrianos; and Eric Toder, “Estimating the Compliance Cost of the U.S. Individual Income Tax,” National Tax Journal 56 (September 2003), pp. 673-688.
Guyton, John L.; Audrey Kindlon; and Jian Zhou, “Recent Research on Small Business Compliance Burden,” Proceedings: Ninety-Seventh Annual Conference, 2004, Minneapolis, National Tax Association, Washington, DC.
Holtzblatt, Janet, “Measuring Compliance Burdens: Issues Raised by the Individual Taxpayer Burden,” Proceedings: Ninety-Seventh Annual Conference, 2004, Minneapolis, National Tax Association, Washing-ton, DC.
Internal Revenue Service, Data Book, 2006, Publication 55B, Washington, DC, March 2007.
Kindlon, Audrey, “The Tax Compliance Burden of Small Businesses: A Profile of 50 Companies,” paper presented at the 2004 IRS Research Conference, Washington, DC, June 2004.
DeLuca, Stilmar, Guyton, Lee, and O’Hare200
Lerman, Allen H., and Peter S. Lee, “Evaluating the Ability of the Individ-ual Taxpayer Burden Model to Measure Components of Taxpayer Bur-den: The Alternative Minimum Tax as a Case Study,” paper presented at the 2004 IRS Research Conference, Washington, DC, June 2004.
Arthur D. Little, Inc., “Development of Methodology for Estimating the Taxpayer Paperwork Burden,” Final Report to Department of the Trea-sury, Internal Revenue Service, Washington, DC, June 1988.
Moody, J. Scott, “The Cost of Complying with the Federal Income Tax,” Special Report, July 2002, Number 114, Tax Foundation, Washington, DC.
Pashev, Konstantine, “Tax Compliance of Small Business in Transition Economies: Lessons from Bulgaria,” International Studies Program Working Paper Series, Andrew Young School of Policy Studies, Georgia State University, 2005.
President’s Advisory Panel on Federal Tax Reform, Final Report, November 1, 2005, Washington, DC.
Slemrod, Joel, “Small Business and the Tax System,” in H. Aaron and J. Slemrod (editors), The Crisis in Tax Administration, Brookings Institu-tion Press, 2004, pp. 69-101.
Slemrod, Joel, and Marsha Blumenthal, “Recent Tax Compliance Cost Re-search in the United States,” in Tax Compliance Costs, Measurement and Policy, Fiscal Publications, C. Sanford (editor), Bath, UK, 1995, pp. 142-172.
Slemrod, Joel, and Varsha Venkatesh, “The Income Tax Compliance Cost of Large and Mid-Size Businesses,” Discussion Paper Number 2004-4, Office of Tax Policy Research, University of Michigan, April 2004.
Stavrianos, Michael, and Arnold Greenland, “Design and Development of the Wage and Investment Compliance Burden Model,” paper presented at the 2002 IRS Research Conference, Washington, DC, June 2002.
White, Alan G., and Ernst R. Berndt, “Measuring Prices of Prepackaged Software,” in Software, Growth, and the Future of the U.S. Economy, Report of a Symposium, Dale W. Jorgenson and Charles W. Wessner (editors), The National Academies Press, Washington, DC, 2006, pp. 83-89.
Tax Complexity and its Impact on Tax Compliance and Tax Administration in AustraliaMargaret McKerchar, University of New South Wales
T he Australian federal tax system is widely regarded as one of the most complex tax systems in the world and has enjoyed this reputa-tion since at least the 1970s. That is, in spite of the considerable at-
tention given to tax complexity in Australia by policymakers, administrators, businesses, lobby groups, voters, and other interested parties over a number of decades, the tax system remains at least as complex as ever.
The ramifications of the complexities of the Australian tax system are profound and impact on every aspect of our way of life, including the way we do business, work, invest, retire, plan for the future, grow the economy, educate our children, and care for others. Tax policy is a subject close to the hearts of voters, and elections have been won and lost on the basis of proposed reforms. While taxes affect the whole of society in some form or other, it is the taxpayers, the tax practitioners (or tax agents), and the tax ad-ministrators who are most directly affected by the complexities of taxation. In a self-assessment tax system, such as operates in Australia at the federal level, these three parties by necessity have a close and dynamic working relationship. They may not always be working together, but they are work-ing side by side, observing what they can of each other, and adjusting and readjusting their behaviors and strategies according to their assessment of the risks they face. It is reasonable to expect that tax complexity will have some impact on these risk assessments. The tax administration will be seek-ing to maximize voluntary compliance, the tax practitioner will be advising the taxpayer on paying the least amount of tax as required under the law, and the taxpayer will ultimately be making the compliance-related decisions. It follows that understanding how taxpayers make these decisions and the roles played by tax practitioners is of critical importance to the tax administration. The purpose of this paper is to provide an overview of recent compliance research in Australia on the impact of tax complexity on taxpayers and tax practitioners, and, in turn, to consider the consequences for the Australian Taxation Office (ATO) and the way in which it is responding. While the focus of the paper is on the Australian federal tax system, it is expected that the content and findings will have relevance to other jurisdictions.
McKerchar202
The paper is presented in four parts. It begins with an overview of the Australian tax system and its reforms and provides the context for the bal-ance of the paper. The second part reviews recent compliance research un-dertaken in Australia, particularly on the impact of complexity, and includes an analysis of the findings of the various studies and their varied method-ological designs. The third part discusses the impact of complexity on tax administration and includes an overview of the strategies and practices that have been adopted by the ATO and how taxpayers and tax practitioners have responded to these. The concluding part of the paper draws together the preceding analysis, considers strategies that could be considered in seeking to address complexity, and identifies areas where further research is needed.
Overview of the Australian Tax SystemReform of Australia’s federal tax system has been an important item on the political agenda since the Commonwealth of Australia was first formed in 1901. At the time of federation and under the Australian Constitution, the states (or former colonies) had a concurrent general taxation power with the Federal Parliament (i.e. Commonwealth, (Cth)), with the latter having the exclusive power to levy customs and excise duties. The states continued to raise income taxes (which they had been doing since 1880), with the Fed-eral Parliament first introducing an income tax in 1915 under the auspices of funding the war effort in WW1. The Income Tax Assessment Act (Cth) 1915, modeled on state legislation that existed at the time, was 65 pages in length and consisted of 22 sections. Another Act followed in 1922, and this was superseded by the Income Tax Assessment Act (Cth) 1936 which was some 250 pages in length. From 1915 until 1942, Australians paid income tax separately to both the state and federal governments. In 1942, the Federal Parliament passed a Uniform Tax Scheme, whereby the federal government raised a higher level of income tax and passed on grants to the states (and territories) on the condition that they did not levy income tax themselves (Coleman and McKerchar, 2004). Basically, the same situation exists today. Although the states have the power under the Australian Con-stitution to levy income tax, they have not exercised this power since 1942. Instead, the states and territories rely on other forms of local taxation such as payroll tax, land tax, and stamp duties to supplement the funds (including the revenue raised under the Goods and Services Tax (GST) first introduced in 2000) received from the federal government.
Nationally, the ATO operates as a unified, semiautonomous body, ad-ministering a range of Commonwealth legislation and collecting revenue on
Tax Complexity and its Impact on Tax Compliance 203
behalf of the federal government (OECD, 2006). Almost everyone in receipt of income has to lodge an annual tax return (around 11 million individuals currently lodge income tax returns). The states and territories each have their own revenue authorities, and these are independent of each other and of the ATO. Federal-state fiscal relations have long been strained, and there has been much criticism (generally by the more populated states) of the so-called vertical imbalance and of the lack of horizontal equity in the way in which the GST collections are redistributed by the federal government (for example, see Warren, 2006).
Another feature of the Australian political landscape that needs to be appreciated is that parliaments at both state and federal levels have two chambers. This feature has had enormous influence (and at times been a constraint) on government policy and ensuing legislation, particularly at the federal level and when the government of the day has not held the balance of power in the upper chamber. Much complexity in the Australian federal tax system can be directly attributed to the political compromises that are made from time to time to get legislation passed. In contrast, New Zealand has one national unicameral parliament, and this has been a major factor in its much more successful track record in achieving tax reform (McKerchar, Meyer, and Karlinsky, 2006).
Given the politics of taxation in Australia, it is perhaps understandable that, since the 1930s onwards, there has been a series of reviews, inquiries, and Royal Commissions into the federal tax system. The first full-scale review of tax policy was the Asprey Committee which commenced in 1972. The Asprey Committee was formed in response to widespread and lively criticism of the tax system at that time and, possibly of more concern, the view that public attitudes to paying taxes were regarded as becoming less positive over time (though this was thought to be due in part to the rapid rate of inflation and increases in overall government spending that had occurred). The Asprey Committee (1975) made many far reaching recommendations, including greater reliance on indirect taxes, but they were largely ignored by the federal government at that time. Other major milestones in terms of reviews that have shaped tax policy in Australia included the government’s Draft White Paper in 1985, the Liberal party’s (while in opposition) 1993 “Fightback” tax reform platform of which a GST was the major feature (and was rejected at that time), the simplification of tax legislation (Tax Law Improvement Project) in 1993, the Review of Business Taxation (the Ralph Review) in 1998, and the Review of Self Assessment (ROSA) in 2004.
More recently, and as a result of a recommendation by the Ralph Re-view, a Board of Taxation was established in 2000 to advise the government on the formulation and development of tax policy and has undertaken a num-
McKerchar204
ber of reviews and published reports on a range of issues. Its work program currently includes a scoping study on small business compliance costs and a review of the application of consistent self-assessment principles, www.taxboard.gov.au. Further, an Office of the Inspector General of Taxation was established in 2003 as an independent statutory office to review systematic tax administration issues and to report to government, in the interests of taxpayers, on recommendations that would improve the fairness, efficiency, and integrity of the tax system. At the time of establishing the Office of the Inspector General of Taxation (which also was based on a recommendation by the Ralph Review), some 60 potential review topics were identified based on taxpayers’ concerns. The main categories of concerns included the risk and uncertainty associated with self-assessment; the ATO’s law enforcement responsibilities and governance arrangements; and the range of complaints about the way in which the ATO relates to, and communicates with, tax-payers and their tax advisers. Its work program is published and currently includes a review into the administration of GST audits; a review of the potential revenue bias in Private Binding Rulings involving large complex matters; and a review into the ATO’s ability to identify and deal with major, complex issues within reasonable timeframes, www.igt.gov.au.
These watchdog roles of the Inspector General and, to a lesser extent, the Board of Taxation are in addition to those fulfilled by the Ombudsman (to whom individual taxpayers can take their complaints about the ATO) and the Auditor General, whose role is to undertake performance audits examin-ing the economy, efficiency, and administrative effectiveness of the ATO’s administration of the tax system. In contrast to the Board of Taxation and the Inspector General who both report to the Federal Treasurer, the Ombuds-man and the Auditor General report to Federal Parliament. Both the Board of Taxation and the Inspector General consult widely in the course of their work, regularly inviting taxpayers and tax practitioners to provide input to matters under review. Clearly, the history of reviews and watchdogs as de-scribed herein are evidence of the considerable and sustained interest in tax policy and tax administration by not just politicians and policymakers, but by the broader Australian community.
However, even under all these watchful eyes, it seems that the com-plexity of the Australian tax system has not yet been reduced. The Asprey Committee considered Australia’s tax system of the 1970s to be complex. The Committee noted the number of amending Acts, the size of practitioner textbooks, the number of cases transmitted to Boards of Review, the number of appeals, and the size of the publication of sales tax rulings and felt that these were all indicators of increasing complexity. In the 1970s, the Income Tax Assessment Act was some 750 pages in length. The 1980s heralded a
Tax Complexity and its Impact on Tax Compliance 205
period of rapid tax reform. New federal taxes introduced included capital gain tax, fringe benefit tax, training guarantee levy (this proved to be short-lived), gun buy-back levy (also short-lived), medicare levy, and the super-annuation guarantee levy. A whole range of measures were introduced to improve farmers’ financial self-reliance, offer tax concessions to small busi-nesses, and promote investment in a range of endeavors including drought mitigation measures, the Australian film industry, mining, and research and development. By 1990, the Income Tax Assessment Act was some 4,000 pages in length.
A modified form of self-assessment (whereby the ATO calculated and advised the net tax payable) was introduced for individuals from July 1, 1986, and an imputation system for the taxation of corporate profits from July 1, 1987. Full self-assessment was introduced for companies and super-annuation funds from July 1, 1989. Self-assessment underwent modifica-tion in 1992 to give the ATO legislative power to issue public and private rulings on tax law and thereby relieve some of the burden of self-assessment experienced by taxpayers. By 1993, the 1936 Act had grown into a “mon-ster—a system out of control and getting progressively worse” (Spry, 1993). The government announced in December 1993 that the 1936 Act would be rewritten into more simple language to make it less complex, more under-standable, and therefore easier and less costly to comply with. The rewrite was specifically directed not to address policy issues. The rewritten legisla-tion was progressively enacted as the Income Tax Assessment Act 1997. However, the project was subsequently disbanded only one-third complete. Basically, the rewrite project was overtaken by the need for policy reforms, and, to this end, the Ralph Review was established.
Tax policy reform on a scale not seen before in Australia followed with the introduction on July 1, 2000, of A New Tax System (ANTS). Its features included a GST (and the repeal of the wholesale sales tax), pay-as-you-go withholding and installment systems, Australian Business Numbers (ABNs) (as a single business identifier), and a new penalty regime. From July 1, 2001, an optional Simplified Tax System (STS) was introduced for small business (based on a recommendation of the Ralph Review), with its intention being to address the compliance cost burden facing small busi-ness. However, the takeup rate of STS was initially very low (14 percent for the year ending 2002 in spite of over 95 percent of businesses meeting the eligibility criteria) and it has undergone further reforms effective from July 1, 2005, in a bid (though arguably misdirected) to improve its attractiveness (McKerchar, 2007).
McKerchar206
By 2003, there were in excess of 7,000 pages of federal tax legislation (Dirkis and Bondfield, 2004). The Board of Taxation completed a major project to identify inoperative legislative provisions in 2005, and legisla-tive changes were enacted in 2006 as a result. Even so, in 2007, there are some 8,000 pages in four volumes of tax legislation (with both the 1936 and 1997 Acts being operative), supplemented by over 2,300 pages of legislation in respect of superannuation and another 1,152 pages of GST legislation. While the volume of legislation may be only one aspect of tax complexity, it is certainly one aspect on which real progress is yet to be made.
Other measures of tax complexity are comprehensively discussed elsewhere in the literature (for example, see Cooper, 1993; Krever, 2003). Suffice to highlight here that while volume, language, and structure have attracted considerable attention, more recently attention has turned to functional responsibility and legislative style. Until 2002, the ATO had the function of developing tax law and policy in addition to implementation and administration of the law. This led to considerable criticism of the ATO and its inability to perform both functions in a period of extensive change (ANTS being the case in point). As a result, and on the recommendation of the Board of Taxation, those staff responsible for advising on policy and on legislative drafting were removed from the ATO to the Treasury. In 2004, as an outcome of ROSA, Treasury announced the adoption of a new legisla-tive style of drafting referred to as “coherent principles drafting,” though its meaning still seems to be open to interpretation and its application to date has been limited. It is difficult to envisage that this new drafting style will make any real impact on reducing tax complexity. To be fair to the drafters, it is difficult to make simple law out of complex policy, and it is unclear and often unworkable policy (on which consultation, when it does take place, does so far too late) coupled with ongoing change that is the major cause of tax complexity in the Australian context.
To give taxpayers greater certainty in complying with the requirements of self-assessment, the ATO issues binding rulings which are its interpreta-tion of the legislation. (By way of illustration, in 2006, the ATO issued over 11,000 Private Binding Rulings, 133 Class Rulings, 11 GST Rulings, and 15 Public Rulings.) However, even with simple legislation and a plethora of rulings to give greater certainty, the large majority of Australian taxpayers no longer lodge their own income tax returns. In 1980, 20 percent of personal taxpayers used a tax agent. By 1992, this figure had increased to around 75 percent and has since remained fairly consistent. Personal taxpayers feel that the system has become too complicated, and there have been too many changes for them to be able to confidently complete their own returns (McKerchar, 2003). Over 90 percent of business taxpayers use a tax agent
Tax Complexity and its Impact on Tax Compliance 207
to prepare their returns, and this figure has remained consistent at least since the 1980s.
This need to engage a tax agent to ensure that taxpayers have met their tax compliance has consequences for compliance costs, particularly monetary and time costs, which have been an ongoing political thorn in the side of successive Australian governments. It also has consequences for the level of compliance itself, which is by and large brokered, and this in turn serves to emphasise the important role tax agents play in terms of taxpayer compliance.1
The Inspector General recently described the Australian tax system as one where the balance of uncertainty and risk in the tax system is now weighted against taxpayers. Further, it was argued by the Inspector General that this imbalance, together with the adoption by the ATO of a “one size fits all” approach to the application of penalties and interest for noncompliance, has served to encourage taxpayer perceptions of unfairness and uncertainty in the system of self-assessment (Vos and Mihail, 2006). In spite of numer-ous reviews and watchdogs in place, the criticisms of the 1990s in respect to the growth of complexity in the Australian tax system and its compliance costs still remain. However, questioning the fairness of the system and its uncertainty, as perceived by taxpayers, must be of great concern for policy-makers and the tax administration. In the current environment as described, it is clear that the challenges for the tax administration in managing its risks and maximizing voluntary compliance in a self-assessment system are great and indeed many. This leads to the next section of the paper where a number of compliance research studies in the Australian context of tax complexity are reviewed.
Compliance Research in AustraliaThe pursuit of simplicity has been a recurrent theme in many of the major reviews of the Australian tax system. The Asprey Committee considered the desirable features of a tax system to be efficiency, fairness, and simplic-ity, with fairness being the most universally desirable, followed by simplic-ity. However, it was recognized that policymakers had to repeatedly choose between these features and that there was considerable conflict. The Ralph Review described complexity as having three aspects: technical, structural, and compliance. Technical complexity arose where ascertaining the mean-ing of the legislation was less than straightforward. Structural complexity referred to the poor structuring of provisions and to the unintended or in-
1 Note that tax agents in Australia must satisfy a range of requirements, including education and experience, before being registered. For further information, see www.tabd.gov.au.
McKerchar208
consistent interaction of different provisions. Compliance complexity arose where there was an excessive burden of recordkeeping, tax form completion, or other compliance activity placed on the taxpayer.
It makes sense that, in order to be able to reduce complexity, the causes of complexity need to be identified and addressed. The Ralph Review identified a range of factors that interacted to produce tax law complexity in-cluding black letter law, grafting of legal meaning, tax reform, differentiated taxation of entities, policy framework, the progressivity of the personal tax system, and the desire to address equity concerns. Complex law has conse-quences for judicial interpretation, and this in turn has an impact on the costs of compliance and of administration. However, the complexity of the law is only one dimension of the systemic problem. For example, other dimen-sions that need to be considered include the choice of tax system, the nature of its base and the level of integration, and the way in which the system is implemented and then administered. But is reducing complexity the same as simplification? The concepts are both somewhat subjective and have tended to be used both loosely and interchangeably. To a large extent, this probably explains why improvements are difficult to identify and taxpayers’ percep-tions as to their compliance burden have remained largely unchanged. There is also the consideration that taxpayers are far from being a homogenous group.
Australia’s dilemma regarding tax complexity is not unique. Blumen-thal (2001) stated that the United States had stood at the crossroads for a decade in its initiative to rescue complexity, with virtually no one thinking that the Federal income tax was simple. Instead, simplicity had been com-promised in the pursuit of equity and economic efficiency. However, there was a growing suspicion that increasing complexity was having a negative impact on compliance.
In the Australian context, given a reasonably comprehensive withhold-ing system, personal taxpayers (i.e., those not engaged in a business, but in receipt of salary, pension, or investment income) have limited opportunities to not declare assessable income without detection. There is undoubtedly more scope for taxpayers to inflate their claims for deductions, or to exploit the ambiguity created by complex laws and instructional materials. How-ever, Australian research into the impact of complexity on the compliance behaviors of personal taxpayers has been unable to support this proposition (McKerchar, 2003). This study, using a mixed method design (large-scale survey with the sample population drawn randomly from the ATO’s taxpayer database, and a case study) and focusing on taxpayers who were self-lodg-ers, found that complexity gave rise to unintentional noncompliance and
Tax Complexity and its Impact on Tax Compliance 209
intentional overcompliance: both of which appeared to favor the tax author-ity in terms of revenue collections. Clearly, this is unfair.
Other findings of importance derived from this study included that the effect of complexity was directly related to compliance costs and that this in turn had an effect on personal taxpayers’ commitment to compliance (which was found to be high). That is, increasing complexity could make it more difficult for the ATO to take advantage of the high tax morale that was found to exist in Australia. Respondents expressed reluctance in seeking assistance from the ATO, due mainly to a lack of confidence in the ability of ATO staff and unease about being conspicuous. Respondents indicated that they relied heavily on tax agents because they wanted an accurate return of income (i.e., they wanted to be compliant) and that they regarded the system as too complex for them to ever understand (or just not worth their while spending the time to do so).
The burden of (or opportunity provided by) tax complexity in Australia falls primarily on tax agents who are at the coalface in advising their cli-ents. Research conducted into the causes of complexity for tax agents, their relative importance, and impact on tax agents’ practices was conducted late in 2004 with funding from CPA Australia (McKerchar, 2005). This mul-tiparadigm research used an electronic survey and a case study protocol. Of the 24,000 agents registered in 2004, over 80 percent were in receipt of the ATO’s electronic newsletter, and this means was used to promote the survey. The response rate was low, with some 220 respondents taking part in the survey. Followup contact indicated that many agents simply did not read the ATO’s electronic newsletter (which is consistent with the findings of the research discussed below). The case study protocol was based on indepth in-terviews with volunteers—tax agents who were members of CPA Australia.
Briefly, the research found that agents were overwhelmed by the vol-ume of tax material of which they needed to keep abreast, not just legisla-tion, but rulings, determinations and practice statements issued by the ATO. To a lesser extent, the rate of change was an issue as was the complexity of the law. Agents’ job satisfaction was suffering as was their confidence in their technical ability. They were coping in a variety of ways, including un-dertaking additional technical research without always passing on the costs to clients; narrowing the scope of their activities; or relying on the advice of higher-level technical experts (which has implications for compliance costs). Tax agents were frustrated with both government and the ATO. More simple, integrated, and efficient tax systems with less regulatory material and less ad hoc change were what was needed, and agents wanted to have more input into the process.
McKerchar210
Much of the research into complexity and business taxpayers has focused on identifying and measuring compliance costs (for example, see Evans et al., 1997), rather than the study of compliance behavior, and this is understandable given the level of reliance on tax agents as previously explained. However, two recent and as yet unpublished studies will be relevant to this discussion once their findings are released. The first study (McKerchar, Hodgson, and Datt, 2006), commissioned by the Inspector General of Taxation in 2005, examined the perceptions held by taxpayers and their tax agents of revenue bias on the part of the ATO in dealing with Private Binding Rulings (PBRs) on large, complex matters. Telephone interviews (collecting both quantitative and qualitative data) were conducted with a random sample (of 50 percent) of ruling applicants who satisfied the set criteria in respect to annual turnover (>AU$100 million) and who had lodged a PBR application within a given 2-year period. A response rate of over 85 percent was achieved. Specifically, the study was to report on:
the role of the ATO in relation to PBRs that involve uncertainty in the application of the law or underlying policy intent, including the ATO’s interaction with Treasury;
the potential adverse effects of not following a PBR;
the perceived cogency of reasons provided for ATO decisions in relation to PBRs;
the transparency of the PBR process and technical issue resolu-tion;
the adequacy of ATO assurance measures and controls that are aimed at minimizing the potential for revenue bias;
the timeliness in providing PBRs, in particular the effect that the ATO’s Priority Ruling Process (PRP) has had on perceptions;
the basis for any perceived revenue bias in the ATO’s treatment of its particular PBR application; and
the potential measures that will resolve perceptions of bias.
The study was focused on “perceptions,” and, concurrently, the Inspec-tor General conducted a technical review of the PBR applications in terms of their technical accuracy, time taken, and administrative systems. The
Tax Complexity and its Impact on Tax Compliance 211
Inspector General is expected to report to the Treasurer in August 2007, and it is anticipated that the report will be released to the public shortly thereafter (and will be made available at www.igt.gov.au).
The second piece of recent research relates to a study which was com-missioned by the Board of Taxation in 2006 (McKerchar, Hodgson, and Walpole, 2006). The Treasurer had asked the Board to undertake a scoping study of tax compliance costs facing the small business sector and to work closely with small business, particularly microbusiness (i.e., annual turnover <AU$2 million), to identify the major areas where compliance costs might be reduced. The Board was asked to take into account:
the purpose and object of the law;
the relationship between taxpayer compliance costs and govern-ment administration costs;
costs incurred by business for nontax reasons and any additional costs incurred by businesses or their advisors for tax reasons (tax compliance costs);
transitional costs and ongoing tax compliance costs;
taxpayer circumstances and commercial practices;
other legislation; and
any other matters the Board considers that may materially impact on small business tax compliance costs.
The Board of Taxation called for and received submissions from the public. In commissioning the scoping study, the requirement was that a qualitative methodology be used with the output presented in matrix form. A grounded theory strategy was employed, and convenience sampling was used. Indepth interviews and observations were conducted with small business owners and accountants, primarily at their places of work. The researchers’ records of interviews were initially open-coded and then recon-figured using axial or pattern coding to provide more meaningful units of analysis. These units were then presented as conceptually ordered matrices and then as a refined metamatrix based on the design principles of Miles and Huberman (1994). The Board of Taxation is expected to report to the Treasurer in August 2007, and its report is expected to be made available to the public shortly thereafter at www.taxboard.gov.au.
McKerchar212
These examples of tax compliance research in Australia do illustrate that the impact of complexity and its impact on taxpayers and tax adminis-tration is a topic that is currently receiving attention at the highest levels. It is also of interest to note that, in the compliance costs scoping study for the Board of Taxation, the terms of reference were not limited to compliance with tax legislation. More recently, in March 2007, the Assistant Treasurer has asked the Board of Taxation to consult publically on the scope to apply consistent self-assessment principles across all federally administered taxes. This continued attention by government is indicative that the problem of tax complexity, at least from the perspective of taxpayers and tax practitioners, is not easing. It would be appropriate now to turn to tax administration and consider its role and strategies in dealing with the issue.
Impact of Complexity on Tax AdministrationMichael D’Ascenzo, Commissioner of Taxation, has described tax admin-istration in Australia as big business. The ATO has an annual budget of around $2.6 billion and collects around AU$230 billion annually which is about 90 percent of the Australian government’s revenue. The ATO admin-isters dozens of Acts and in 2006 implemented around 100 new legislative measures, including the 30-percent child care tax rebate, superannuation choice, and improvements to self-assessment systems. The ATO employs more than 21,000 staff and has more than 17 million taxpayers (D’Ascenzo, 2007a).
The ATO has long recognized the need to work with taxpayers and tax agents as part of improving voluntary compliance and managing risk. Based on the ATO’s Strategic Statement 2006-2010 (ATO, 2006b), there has been a shift of emphasis from revenue collection, as the key role of the ATO, to op-timizing voluntary compliance by creating the right environment for people to pay tax. An important part of this environment is the reputation of the ATO and the nature of its relationship with the community. To this end, the ATO has put considerable strategic effort into building a transparent relation-ship with taxpayers and tax practitioners.
The creation of this transparent relationship was evident when the Tax-payers’ Charter (similar to a Bill of Rights, which is not provided for in the Australian Constitution) was first introduced in 1997 (and revised in 2003). The Charter sets out the rights of taxpayers to be treated fairly and courte-ously in their dealings with the ATO in an attempt to address the perceived imbalance of power, but it has no legal effect. A Compliance Model has also been developed that gives recognition to the different attitudes that taxpay-
Tax Complexity and its Impact on Tax Compliance 213
ers have towards compliance and the need for the ATO to adopt appropriate and proportionate strategies of support and intervention. In 2002, the ATO began its Listening to the Community Program and currently has over 70 formal consultative forums where it consults with a range of taxpayers and tax practitioners about their needs and expectations in dealing with the tax administration.
In the spirit of transparency and with an underlying philosophy that prevention is better than cure, the forward publication of the ATO’s Compli-ance Programs first began in 2003-04 with the aim of making it as simple as possible for taxpayers to comply with the law. A Compliance Program sets out in advance the tax risks that the ATO intends to focus its enforce-ment effort on for the coming year based on its risk assessment.2 The ATO believes its approach to risk management is unique in its level of openness and accountability (D’Ascenzo, 2007a).
The key message from the Listening to the Community Program was to make dealing with the ATO easier, cut compliance costs, and provide a more individualized service. It was obvious that that the ATO needed to do better in designing its administrative systems and processes from a user rather than an administrator’s perspective (Farr, 2006). In response, the ATO introduced the Change Program in 2004. In its preliminary stage, the Change Program included the introduction of e-portals for tax agents and business taxpayers for improved self-help service. In the 2006 financial year, there were 11.6 million logins to the tax agent portal supporting 3 million transactions; the business portal had about 1.2 million logins supporting 400,000 transactions. From July 1, 2006, the Tax Practitioner and Lodgment Strategy (TPaLS) business line assumed corporate responsibility (with 312 staff and AU $24 million allocated in 2006-07) (ANAO, 2007) for managing the ATO’s rela-tionship with tax agents—clearly recognizing the important roles they play in taxpayer compliance.
From Listening to the Community, the ATO has more recently shifted its emphasis to the three Cs of Consultation, Collaboration, and Codesign. There is now a complex model of community consultation that includes 11 peak consultative groups and many subgroups, working parties, industry fo-rums, and expert panels that advise, make recommendations to, and engage with the ATO. From the ATO’s perspective, an important aim of the con-sultation is to align its administration and requirements more closely with accepted business and accounting procedures, transactions, and processes, to ensure that practical solutions are adopted that are consistent with the policy
2 Compliance Programs and all other ATO reports and Commissioner’s addresses referred to in this paper are avail-able at www.ato.gov.au.
McKerchar214
intent of the law without increasing compliance costs. From the perspective of taxpayers and tax practitioners, it appears (at least) that they have greater ownership of, and responsibility for, the tax system.
The 2005-2006 ATO Annual Report (ATO, 2006a) presents very posi-tive findings about its relationship with taxpayers and tax agents based on recent surveys commissioned by the ATO. For example, it was reported that over 80 percent of tax agents felt that it was now easier to deal with the ATO, that the information received by the ATO was more tailored to meet their needs, and that they thought the ATO was improving its systems and business processes to make it easier for tax agents to deal with the ATO. Further, 85 percent of businesses felt that the ATO was doing a good job, and almost 75 percent of respondents from the general community were positive about the overall performance of the ATO. It is reported that, overall, there appears to have been a steady increase in positive perceptions about the ATO since 2000.
These conclusions in the 2005-06 ATO Annual Report have been more recently supported by the findings of the Australian National Audit Of-fice (ANAO) (ANAO, 2007) in its followup report on March 14, 2007, on The Australian Taxation Office’s Management of its Relationship with Tax Practitioners. The ANAO reported that the relationship had improved sig-nificantly since the first audit in 2002-03 (at which time, the relationship was described as “strained and tense”).
However, in building transparent relationships, it appears that the ATO still has some way to go in respect to large corporate taxpayers. Both the former and current Tax Commissioners have been vocal in recent years in emphasizing the need for improved standards of corporate governance and the requirement under corporate law for the formalization of tax risk man-agement policies at board level (D’Ascenzo, 2006). This dialogue has been followed up with audit activity—in the 2005-06 Compliance Program, it was revealed that 89 percent of Australia’s top 100 companies and 83 percent of the top 200 were subject to a tax audit in 2004-05. This activity generated a 25-percent increase in revenue from the previous year.
It appears that the preference of boards by and large has been to maintain a civil relationship with the ATO and to keep a more respectable distance with less transparency. An example of this distance is the reaction by the top 100 corporations to the ATO’s Forward Compliance Agreements (FCAs) which the ATO regards as the cornerstone of its vision for a capable and well-regulated tax profession (D’Ascenzo, 2007a). Under a FCA, the taxpayer allows the ATO to undertake a due diligence review of its systems and records and then commits to continuous disclosure to the ATO of the company’s actual and potential tax and governance risks. The advantage
Tax Complexity and its Impact on Tax Compliance 215
to the taxpayer is access to a lesser likelihood of audit, reduced penalties on errors, discounted interest rates on unpaid tax, and streamlined access to advice. However, the concept has not been warmly embraced by the top 100 companies, many preferring to maintain the business as usual approach and apply for Private Binding Rulings on a needs basis. So far, only two FCAs have been reached, and neither was apparently in respect of income tax. As for being a cornerstone, it is difficult to envisage FCAs ever living up to the ATO’s expectations.
The much bigger challenge of the Change Program has been for the ATO to move to an integrated IT environment with enterprisewide processes focused on meeting the needs of taxpayers. The program, estimated to cost AU$720 million, has been described by the Commissioner as ambitious (D’Ascenzo, 2007a). It is to be delivered in stages focused on improving taxpayer and tax practitioner products and services while transforming inter-nal capabilities—people, processes, and technology—and providing a sound platform for the future.
In the first stage, a new Client Relationship Management (CRM) was introduced in 2006, collecting and centralizing all information about a par-ticular taxpayer. In Stage 2, which is currently underway, the existing 180 case management systems are being replaced with a single Case Manage-ment System, and a new Work Management System is also being introduced. Stage 3 involves the delivery of a new Integrated Core Processing (ICP) system to replace 75 existing systems and manage all of the processing work undertaken by the ATO for all types of taxes. Significantly, the taxpayer (and his or her agent) will see exactly the same screen as the ATO when en-gaged in discussion with each other. The final release in Stage 3 is expected to be rolled out in July 2009 (D’Ascenzo, 2007b).
The technological changes to be undertaken are on an enormous scale but are expected to provide richer information about taxpayers’ compliance histories and a better understanding of their likely behaviors. Contingent on the successful implementation of the Change Program, the ATO expect to be able to develop more refined risk models with wider data warehous-ing, analytics and data mining, and matching capabilities with progressively higher degrees of reliability (D’Ascenzo, 2007a). Indeed, given the enforce-ment capacity that these technological innovations will provide, the need for a transparent relationship seems somewhat diminished.
The major (and unanticipated) changes to superannuation announced in the 2006 Federal Budget have delayed the Change Program to some extent as the ATO has had to incorporate the implementation of the related policy and system changes. So, even the best laid plans by tax administrators have to adapt to change and increasing complexity that are beyond their control.
McKerchar216
Clearly, tax complexity is a challenge for the tax administrator. In this section, we have examined how the ATO has responded and where it is posi-tioning itself in the foreseeable future. In summary, its role as administrator and not policymaker or legislative drafter has been reaffirmed. This shift of function and greater focus on its service role (more so than its revenue col-lection role) appear to have given tax agents greater confidence in the ATO. It distances the ATO from sharing the blame for poor or inequitable policy or for inappropriate policy. The ATO has been very strategic in building a transparent relationship with taxpayers and tax agents in listening to the community—almost giving the appearance of changing sides. By consulta-tion, collaboration, and codesign, taxpayers, tax agents, and the tax admin-istrator appear to be united. Tax complexity may not have reduced, but the burden of responsibility for it seems to be inexorably shared. Can this approach work? Again, it is emphasized that much of what is at stake here in terms of maximizing voluntary compliance is the perceptions held by tax-payers and tax agents, not necessarily the reality. Time will tell. Given the investment in technology by the ATO and its enhanced enforcement capabil-ity, it is not being complacent nor relying entirely on trust and transparency.
ConclusionsWhile investment in technology and the capacity of staff and systems is now more than ever a major weapon in the ATO’s armory, the extent to which it is a worthwhile investment remains to be seen. There is a concern that such in-vestment may stop other policy options from being explored, particularly in respect to complexity and compliance. For example, at a recent Symposium on Personal Income Tax Reform held at UNSW in Sydney and sponsored by CPA Australia, the need to have salary and wage earners lodging returns at all was discussed (i.e., a shift to prepopulated returns as adopted by Nordic countries), as was the possibility of not allowing work-related deductions (i.e., the New Zealand approach) or of reintroducing a state-based income tax.3 Work-related deductions are claimed by around 7 million individuals and accounted for AU$11.5 billion in 2004-05, which was over 50 percent of all deductions claimed by individuals (ATO, 2006c). Other possibilities include greater withholding of tax from source, taxing income and capital in the same manner (or applying a de minimus provision in the case of small capital gains that would effectively remove the compliance burden for share investors), and removing the tax structure differentials in the current in-come tax rates. Basically, these academic questions drive at the very heart
3 Symposium papers are available at www.atax.unsw.edu.au.
Tax Complexity and its Impact on Tax Compliance 217
of policy reform, and the one thing we have learned in Australia is that the underlying policy issues cannot be ignored, or at least not indefinitely.
However, with initiatives such as the Change Program, e-lodgments by taxpayers (first launched by the ATO in 1999 as a world first and growing in popularity), and another project currently underway to prefill electronic returns (to a limited extent) for downloading by tax agents and taxpayers, there seems to be acceptance of the fact that transformational policy changes to reduce complexity are unlikely to happen in the foreseeable future. Un-doubtedly, there will be further reviews, consultations, and federal elections.
The ATO has made a real commitment to understanding its taxpayers and working with them. It has put considerable effort into understanding its various types of taxpayers and their tax agents and building relation-ships over time. In the long run, these strategies should be very effective in maintaining the high levels of voluntary compliance that do already exist in Australia, provided that tax complexity (in every sense of the word) is not allowed to go unchecked. Similarly, this may give some measure of confi-dence to administrators in other regimes facing comparable circumstances.
Simple policy is a precondition to having laws that are simple to understand, to implement, and to administer. This is a golden rule of which policymakers and legislators should not lose sight. Consultation throughout the process can be effective, but not if left entirely to the later stages (i.e., implementation) in the process. More consultation at the policy stage in Australia could have saved a great deal of unnecessary subsequent changes when the policy was found to be unworkable or ineffective, such as has been the case with the Simplified Tax system for small businesses. However, consultation can also delay the process and be taken advantage of by self-interested parties (e.g., in May 2007, draft legislation to regulate tax agents was released, some 15 years in the making).
In respect to tax complexity, the Australian experience has been that less volume and less ad hoc changes are highly desired by both agents and taxpayers. While taxpayers and agents appreciate the support of and service provided by the ATO, they still have quite onerous compliance obligations placed on them by the various systems and legislative requirements. There is considerable scope for improvement, and it may be that taxpayers are will-ing to sacrifice some fairness for greater efficiency and/or certainty.
This does lead itself to avenues for further research. The extent to which different types of taxpayers are willing to accept tradeoffs between these ideals may help inform government, policymakers, and the tax ad-ministration. It may be that other ideals need to be considered in the mix, such as global competitiveness and/or economic development. The extent to
McKerchar218
which tax complexity provides an opportunity or causes (groups of) taxpay-ers to overcomply and the various relationships based on distinguishing attributes may also help determine appropriate reform targeted at specific taxpayer types and/or types of complexity. The focus herein has been on tax complexity at the federal level, but it is clear that the regulatory burden is not just a tax issue, nor a federal government issue, and that there is consid-erable scope for better coordination and integration of information needs and systems across the board so that people (and in particular in Australia, small businesses) are productively supported by the systems rather than driven by them. Finally, qualitative and mixed method research approaches do offer researchers access to much richer data and deeper understandings of tax-payer behaviors. The important questions are not what people think, or how many agree or disagree, but why people believe what they do. Understand-ing what drives people’s perceptions is the first step to changing perceptions and ultimately their compliance behaviors.
References
ANAO (2007), “The Australian Taxation Office’s Management of its Relationship with Tax Practitioners: Followup Audit,” Audit Report Number 30 2006-07, March 14, Auditor General, Canberra.
Asprey, K. (Chair) (1975), Taxation Review Committee Full Report, AGPS, Canberra.
ATO (2006a), “Commissioner of Taxation Annual Report 2005-06,” October 26, ATO Canberra, NAT 0995-10.06.
ATO (2006b), “2006-10 Strategic Statement,” ATO, Canberra, NAT 7772-10.06.
ATO (2006c), “2006-07 Compliance Program,” ATO, Canberra, NAT 7769-08.06.
Blumenthal, M. (2001), “Leaping Tall Buildings: Pursuing Greater Compli-ance and Reduced Burden” in Evans, C.; J. Pope; and J. Hasseldine (editors), Tax Compliance Costs: A Festschrift for Cedric Sandford, Prospect, Sydney, pp. 15-33.
Coleman, C. and M. McKerchar (2004), “The Chicken or the Egg? A His-torical Review of the Influence of Tax Administration on the Develop-
Tax Complexity and its Impact on Tax Compliance 219
ment of Income Tax in Australia” in Tiley, J. (editor), Studies in the History of Tax Law, Hart Publishing, Oxford, pp. 285-312.
Cooper, G. (1993), “Themes and Issues in Tax Simplification,” Australian Tax Forum, Volume. 10, Number 4, pp. 417-460.
D’Ascenzo, M. (2006), Top End Tax Risk Management—The Journey Con-tinues, speech delivered to the PricewaterhouseCoopers Boardroom dinner, Brisbane, June 28.
D’Ascenzo, M. (2007a), “Simplifying Tax Administration in a Complex World: The Challenge of Infinite Variety,” paper presented at the 19th Australasian Tax Teachers Association Annual Conference, University of Queensland, January 22-24.
D’Ascenzo, M. (2007b), “Working with the Tax Profession,” paper pre-sented at the 22nd National Convention, Taxation Institute of Australia, Hobart, March 15.
Dirkis, M. and B. Bondfield (2004), “The RBT ANTS Bite: Small Business the First Casualty,” Australian Tax Forum, Volume 19, Number 2, pp. 107-158.
Evans, C.; K. Ritchie; B. Tran-Nam; and M. Walpole (1997), A Report into Taxpayer Costs of Compliance, ATO, Canberra.
Farr, G. (2006), “Benefits Gained From Listening and Responding to Tax Agents,” Taxation in Australia, Volume 40, Number 11, pp. 602-604.
Krever, R. (2003), “Taming Complexity in Australian Income Tax,” The Sydney Law Review, Volume 25, pp. 67-505.
McKerchar, M. (2003), The Impact of Complexity upon Personal Taxpayers: A Study of Australian Personal Taxpayers, Australian Tax Research Foundation, Sydney.
McKerchar, M. (2005), “The Impact of Tax Complexity on Practitioners in Australia,” Australian Tax Forum, Volume 20, Number 4, pp. 529-554.
McKerchar, M.; K. Meyer; and S. Karlinsky (2006), Making Progress in Tax Simplification: A Comparison of the United States, Australia, New Zealand and the United Kingdom in McKerchar, M. and M. Walpole (editors), Further Global Challenges in Tax Administration, Fiscal Publications, Birmingham, UK, pp. 367-383.
McKerchar220
McKerchar, M.; H. Hodgson; and M. Walpole (2006), Scoping Study of Small Business Compliance Costs, Report to the Board of Taxation, Atax UNSW, August 31, commissioned report.
McKerchar, M.; H. Hodgson; and K. Datt (2006), Review into the Percep-tion of Revenue Bias in Private Binding Rulings, Report to the In-spector General of Taxation, Atax UNSW, January 23, commissioned report.
McKerchar, M. (2007), “Is the Simplified Tax System Simple?,” The Tax Specialist, Volume 10, Number 3, pp. 140-146.
Miles, M. and A. Huberman (1994), Qualitative Data Analysis, 2nd edition, Sage, Thousand Oaks.
OECD (2006), “Tax Administration in OECD and Selected Non-OECD Countries: Comparative Information Series (2006),” OECD, Paris, October.
Spry, I. (1993), “Editorial: Developments in Taxation from 1971-1993,” Australian Tax Forum, Volume 22, Number 1, pp. 5-6.
Vos, D. and T. Mihail (2006), “The Importance of Certainty and Fairness in a Self-Assessing Environment” in McKerchar, M. and Walpole, M. (editors), Further Global Challenges in Tax Administration, Fiscal Publications, Birmingham, UK, pp. 69-90.
Warren, N. (2006), Benchmarking Australia’s Intergovernmental Fiscal Arrangements—Final Report, NSW Government, Sydney, available http://www.treasury.nsw.gov.au/pubs/fin-bench-rep.pdf, accessed May 30, 2007.
Comments on Compliance and Administration*
Jane Gravelle, Congressional Research Service
Aggregate Estimates of Small Business Taxpayer Compliance Burden, by Donald DeLuca, Scott Stilmar,
John Guyton, Wu-Lang Lee, and John O’Hare
T he authors of this study are tackling a question that is very difficult but, nevertheless, a very important issue. Unfortunately, there are limited ways of trying to address this question. One approach is
simply counting the lines on the form, or trying to subjectively weight the complexity of each item on the form. This approach has many limitations and is difficult to use to quantify costs. An alternative approach used here is to survey taxpayers and ask them to report their own estimates of costs, in both time and money. There is also a tremendous weakness in this approach. I am inclined to think that respondents tend to exaggerate the costs they face, especially in complying with a system that they may tend to resent. There is also an issue of whether the nonrespondents are really different in some important ways from the respondents.
I do have some technical issues and questions. First, it would have helped to be able to look at the survey document, or at least to reproduce the compliance burden-related questions. Otherwise, one is a bit in the dark.
There are also some specific technical questions. First, how are the subjective weighting factors in the nearest neighbor approach derived? Second, how is the monetization of time determined? And, finally, which businesses have no business receipts? What sorts of businesses are these? And are they appropriately in the sample?
I also have another major reservation about the results. The biggest cost by far is recordkeeping, which still remains subject to two major uncer-tainties. The first is how to value time. But second, and more importantly, is the joint nature of recordkeeping. Ideally, one would like to know how recordkeeping would change in the absence of the tax. How to deal with State and local taxes is an impossible problem—what is marginal? As long as firms have to comply with these taxes, they have to keep essentially the same records as they do for the Federal tax. Do we assume that, without
* The views in these comments do not necessarily reflect the views of the Congressional Research Service.
Gravelle222
Federal taxes, there would be no State and local taxes? Or do we assume that these taxes would remain, in which case the recordkeeping costs for the Federal tax should be negligible?
But even aside from the State and local issue, it seems that the vast majority of records should be kept just to run a good business or obtain credit. In fact, to the extent tax rules force recordkeeping, it may be benefi-cial. There is very little in the paper other than general assurances that this allocation of recordkeeping costs has been done appropriately. For that mat-ter, there is some evidence that it was not appropriately allocated, as with the software purchases that seemed to also include bookkeeping services. For the results to be persuasive, there should be something much more concrete on this issue.
While the authors are to be congratulated on trying another approach to this important issue, the combination of the unreliability of survey responses and the problem of joint recordkeeping makes me skeptical of the results, and I suspect the burden may be overstated.
Tax Complexity and its Impact on Tax Compliance and Tax Administration in Australia,
by Margaret McKercharUnfortunately, but through no fault of the author, the results of some of the planned studies of complexity and compliance are not available, including the studies of the Inspector General and the Board of Taxation. It will be interesting to have a followup paper at some point that includes the results of these studies.
The discussion in this paper is interesting and particularly interesting to the United States, because both Australia and the U.S. face some constraints of divided government that can lead to compromises that produce complex-ity. In addition, the history of the Australian tax system indicates some parallels with the U.S. in the growth in use of the tax code to help particular industries and sectors.
The U.S. has also traditionally separated policymaking and legislative drafting from tax administration, which is suggested to be an important characteristic. My own, admittedly subjective, judgement about this issue is that it might not be that important. U.S. legislators tend to provide more lip service to simplification than action. In fact, I would find it useful to have more involvement by the Internal Revenue Service on which legisla-
Comments on Compliance and Administration 223
tive changes would pay large dividends in terms of tax administration and compliance.
Turning to one of the simplification initiatives discussed, it would be useful to shed more light, if that is possible, on what aspects of the optional simplified tax system for small business might have caused it to not be adopted.
At one point, the paper stresses the growth and number of taxpayers who use paid preparers as a sign of complexity. However, can one be sure about paid preparers as a sign of complexity? In the U.S., many people who continue to have very simple returns use tax preparers. For that mat-ter, consider the example of paying someone to change the oil in one’s car. This task is not a complex one, but it may be seen as worth the price for time saved. Did the shift to paid preparers simply occur because the service became available? Also, in the U.S., tax preparers provide instant refunds to taxpayers, which may be attractive for those who are liquidity-constrained. Does this issue arise in Australia? Taxpayers may also have fear of the tax authorities and fear of making a mistake. Or they may distrust the tax authorities’ advice on forms and feel that preparers will get them a better deal. It would be helpful in future work to explore what issues, other than complexity, might be driving the movement to more paid preparation, before one concludes that it is an important indicator of complexity.
I also do not find it surprising that large firms did not take up the Forward Compliance Agreements. It is understandable that large firms want to keep their affairs private. Are businesses and the tax authorities partners or opponents? It is natural to be opponents, but hard to be partners. Again, my admittedly subjective observation is that, in the U.S., large firms like to talk about complexity, but they really care about the level of taxes paid and are quite willing to deal with a greater degree of complexity if there is some hope of lowering their taxes.
I think that are two fundamental issues that still need to be addressed in considering the relationship between complexity and compliance. First, is it complexity or perception that is the problem? Many tax returns in the United States, at least, are really quite simple to complete. Another issue is how far can one go in achieving greater compliance with the carrot rather than the stick? Do people obey speeding laws because the speed limits are posted frequently or because police are lurking around the corner? Sadly, the evidence from the U.S. suggests that compliance is greatest where with-holding and information reporting occur, dramatically greater. Wage report-ing is supposed to be 99-percent compliant, and it is subject to withholding, while small business, which does not involve third-party reporting, is only 50-percent, and much of that is underreporting or not reporting.
D6
Taxpayer Service—Preferences and Effects
Alm Jones McKeeShackleford
Holland Rasey
Taxpayer Services and Tax Compliance
James Alm, Georgia State University; Michael Jones, Bridgewater State College; and Michael McKee, Appalachian State University
A n important trend in tax administration policies in recent years is the recognition that the traditional “enforcement” paradigm of tax administration, in which taxpayers are viewed and treated as
potential criminals and the emphasis is exclusively on repression of illegal behavior through frequent audits and stiff penalties, is incomplete. A revised “service” paradigm recognizes the role of enforcement, but also emphasizes the role of the tax administration as a facilitator and a provider of services to taxpayer-citizens (Alm and Martinez-Vazquez, 2003). Indeed, many recent tax administration reforms around the world have also embraced this alterna-tive paradigm with some success. However, while such “kinder, friendlier” provisions may improve the image of the tax authority, their actual effects on tax compliance have not, to our knowledge, been quantified. Our research utilizes laboratory experiments as a means of testing the range of possible in-formation programs in terms of their effectiveness in enhancing tax compli-ance, and of comparing the compliance impacts of these “service” programs to the impacts of increased “enforcement” efforts.
In particular, subjects in our experiments earn income, report net income to a tax authority, and face an audit process. To investigate the existence of taxpayer services, we complicate the compliance decision of subjects, and then provide services that allow subjects to compute more eas-ily their tax liabilities. By comparing the compliance responses of subjects to these service programs relative to more traditional enforcement methods (e.g., penalties and audits), we are able to determine the relative effective-ness of the alternative paradigms in generating greater taxpayer compliance. Our results are very preliminary, but they suggest that better services have less impact on compliance than increased enforcement. Future work will explore this important issue in much more detail.
Tax Compliance as a Behavioral PhenomenonThe simplest description of the tax compliance decision derives from the economics of crime approach pioneered by Becker (1968). The taxpayer is viewed here as facing a gamble between choosing the legal activity (e.g., full compliance) and the illegal activity (e.g., evasion). This is the framework
Alm, Jones, and McKee228
explored by Allingham and Sandmo (1972) and subsequently modified by many others. See Andreoni, Erard, and Feinstein (1998), Slemrod and Yit-zhaki (2002), and Alm (2007) for recent surveys of the literature.
To illustrate, suppose that an individual receives a fixed amount of in-come I and must choose how much to declare to the tax authorities. Declared income D is taxed at the rate t. Unreported income is not taxed; however, the individual may be audited with probability p, at which point all unreported income is discovered and a fine f is imposed on each dollar of unpaid taxes. For the interesting case where D < I, the individual’s income IC if caught un-derreporting equals IC=I-tD-ft(I-D), while, if underreporting is not detected, income IN is IN=I–tD. The individual chooses D to maximize the expected utility EU(I) of the evasion gamble, or EU(I) = pU(IC ) + (1-p)U(IN ), where utility U(I) is assumed to be a function only of income. It is straightforward to show from this optimization that increases in the probability of an audit and/or the fine rate will increase compliance; that is, the standard model clearly demonstrates the role of an “enforcement” paradigm in generating greater tax compliance. Indeed, in this approach, the only reason for an indi-vidual to pay his or her taxes is the fear of detection (p) and punishment (f).
This approach has proven quite useful in the analysis of tax evasion. Even so, this approach is also a significant oversimplification of the broad activity we call “tax evasion.” In the naturally occurring world, the setting and the resulting behavior are much more complex, which affects behavior in ways that go far beyond the scope of the basic model, and many relevant aspects of the compliance decision are necessarily omitted in this simple framework. Also, and of particular importance, observed high compli-ance rates in many countries are largely inconsistent with rational behavior assumed by the economics of crime model, given the enforcement efforts pursued by most governments. This observation suggests that the implicit assumptions underlying the application of the economics of crime approach to evasion require further investigation.
For example, it is implicitly assumed that the taxpayer is fully aware of the audit probabilities and the audit productivity when undertaking the evasion gamble. This is not necessarily the case, as the tax authority may not be able to announce audit probabilities and the taxpayers may not be able to learn the true probabilities either from their own experiences or from the experiences of others. Relatedly, the tax authority may not be willing to announce probabilities (or audit procedures), in the hopes that this obfusca-tion may increase compliance. Individuals may also have a tendency to overweight the probability of an audit, and such behavior could support high levels of compliance even with a low objective probability of an audit. Further, it is implicitly assumed in the standard approach that the definition
Taxpayer Services and Tax Compliance 229
of evasion is one-dimensional, or simply unreported income (or the unpaid taxes that result directly from unreported income). In fact, the computa-tion of an individual’s true tax liability is multidimensional. There are many steps involved in the computation, and, in the presence of a tax code that is relentlessly complex, the computation of deductions, credits, taxable incomes, and the like is frequently open to interpretation. Other factors are also clearly relevant here.
The effects on tax compliance of at least some of these other factors have in fact been examined (Andreoni, Erard, and Feinstein, 1998; Slemrod and Yitzhaki, 2002; Alm, 2007). However, to our knowledge, there has been little systematic study of the effect on tax compliance of another important factor, one that relates directly to the “service” paradigm view of tax ad-ministration: a more accessible, service-oriented tax administration. Here, we specifically address the question of whether the tax authority can im-prove compliance behavior by adopting a more helpful interaction with the taxpayer. A related issue is whether this approach is more cost-effective than the traditional approach that emphasizes enforcement.
Given the nature of the tax code in many countries, individual tax reporting is a complex problem. Many of the provisions of the tax code are subject to interpretation. The effects of such increased complexity on tax compliance are not obvious and can work through several channels. See, among others, Alm (1988), Beck and Jung (1989), Scotchmer and Slemrod (1989), Alm, Jackson, and McKee (1992), and Krause (2000).
For example, taxpayers may respond to complexity by overpaying taxes, especially if they exhibit loss aversion. Suppose that complexity in effect assigns “fuzzy” values to the many elements in an individual’s set of reporting decisions (e.g., deductions and tax credits). In the simplest setting, the result of fuzziness is a mean-preserving spread, and the degree of uncer-tainty is captured by the support of the distribution of the values. A risk-averse individual will likely respond to the uncertainty concerning allow-able deductions and/or credits by erring on the side of caution and claiming smaller tax reductions than he or she may take.
Suppose, however, that this same individual is informed each period, after filing taxes, of the true tax liability and that this information repeatedly informs the individual that he or she overpaid. Suppose, further, that it is so costly to revise past tax returns that he or she does not do so. This person may ultimately feel that the fiscal exchange itself is less beneficial and respond by evading more. This is especially likely to arise if the individual feels that others are exploiting the uncertainty to reduce their compliance or believes that the penalties are lower when the required level of net income reporting is uncertain. Further, rulings by the tax administration may be seen
Alm, Jones, and McKee230
by the taxpayer as arbitrary and capricious, and the taxpayer may respond to such perceptions by reducing initial levels of compliance and waiting for an audit to provide the true interpretation. The negative effect on compliance may be exacerbated if the taxpayer responds to the complexity by intention-ally evading through frustration, feeling that the tax authority deserves to be punished for the complexity through increased evasion.
In the face of such complex tax regulations, compliance may well be enhanced when individuals view their interactions with the tax authority in a more positive light. In particular, if the services provided by the tax author-ity are viewed as helpful and the responses to questions are provided in a timely and accurate fashion, then compliance is likely to be higher than if the interaction is viewed as being adversarial. This latter factor is not captured in the conventional economics of crime model of tax compliance. Again, however, it is possible to introduce other scenarios in which greater services may have the opposite effect on compliance. In general, then, an improve-ment in tax administration services has an ambiguous effect on compliance. The next section presents our experimental framework for examining the effects on compliance of improved service versus increased enforcement.
Experimental Design and Pilot TreatmentsOur experimental structure replicates the fundamental elements of the voluntary reporting system of the U.S. individual income tax. Subjects earn income by performing a simple task, and they self-report this income to a tax authority. Only the individual knows his or her true level of income and can choose to report any amount from zero. An audit then occurs, and there is a positive and fixed probability that unreported taxes will be discovered. If the audit detects evasion, both the unpaid taxes and a penalty are collected from the individual.
To complicate this basic setting, and thus to introduce the potential value of tax service information, we introduce some institutional elements; these elements also increase the “parallelism” of our experimental design. First, an individual’s earned income is attributed to both “domestic” and “foreign” sources. Since the particular shares from these sources are not a matter of interest here, we set the share of foreign income at 40 percent of total income for all experiment sessions, a sufficiently high share that participants in the experiment will perceive the tax treatment of the foreign income as salient. In filing their tax forms, participants are allowed to claim a tax credit for foreign taxes paid (on the foreign income). Second, partici-pants are allowed to claim a deduction from total income in determining taxable income. Both the exact level of the credit for foreign taxes paid and
Taxpayer Services and Tax Compliance 231
the level of the allowed deduction may be uncertain to the taxpayer at the time of filing. This uncertainty is implemented via mean-preserving spreads (with a uniform distribution) on the tax credit and on the deduction. Sub-jects are always informed of the means of the allowed deduction and credit and the ranges for each, but, in some sessions, this uncertainty is resolved, as discussed below. Subjects are also informed of the tax, audit, and penalty rates, and subjects know these values with certainty. We fix the tax rate at 35 percent for all sessions. The audit probability and penalty rates comprise the collective enforcement effort. The audit rate is varied as a treatment; we fix the penalty rate at 150 percent for all sessions.
Since our objective is to compare the compliance effects of increasing traditional enforcement efforts versus a more service-oriented tax authority, our experimental treatments are changes in the provision by the tax author-ity of information that reduces the credit and deduction uncertainty versus changes in the level of enforcement effort. We cannot know the value individuals attach to the information, and, so, we cannot analytically con-struct an enforcement effort that would be viewed as equivalent to perfect tax ruling information provided by the tax authority. Accordingly, we adopt a strategy adopted by Alm, Cronshaw, and McKee (1993) to compare the effects of alternative endogenous enforcement regimes with simple in-creases in random audit probabilities. In this study, we compare the effects of increasing enforcement against the compliance levels when we provide perfect tax information at no cost. In subsequent work, we intend to broaden the information provision regime to allow for information cost and for the information to be less than completely accurate.
Our experimental setting is very contextual, and, together with the presence of an income earning task, we believe that it provides for the neces-sary degree of “parallelism” to the naturally occurring world that is crucial to the applicability of experimental results (Smith, 1982; Plott, 1987). The experimental setting need not—and should not—attempt to capture all of the variation in the naturally occurring environment, but it should sufficiently recreate the fundamental elements of the naturally occurring world for the results to be relevant in policy debates. In this regard, our experimental design uses tax language, requires that subjects earn income in each period, and requires that subjects disclose this income in the same manner as in the typical tax form. As in the naturally occurring setting, there is a time limit on the filing of income. A clock at the bottom of the screen reminds subjects of the time remaining, and there is a penalty for failing to file on time set equal in all sessions to 10 percent of taxes owed; also, the individual is auto-matically audited if he or she fails to file on time, so that the subject pays the noncompliance fine as well.
Alm, Jones, and McKee232
The experimental session proceeds in the following fashion. Each subject sits at a computer located in a cubicle and is not allowed to com-municate with other subjects. The instructions are conveyed by a series of computer screens that subjects read at their own pace. Clarification ques-tions are addressed after subjects have completed the instructions and three practice rounds. Subjects are informed that all decisions will be private; the experimenter is unable to observe the decisions, and does not move about the room once the session starts to emphasize the fact that the experimenter is not observing subjects’ compliance decisions. These features reduce both peer and experimenter effects that could affect the decisions of subjects. All actions that subjects take are made on the computer.
In each round of the experiment, subjects earn income based on per-formance in a simple computerized task, in which they are required to move numbers in the correct order from one location on the computer screen to another location. The subject who finishes the task with the quickest time earns the highest income (1000 “lab dollars”); the second and third place fin-ishers earn 800 lab dollars each, the fourth and fifth place finishers earn 600 lab dollars each, and so on. Ties in the earnings task are broken randomly. Subjects are informed of their earnings and those of the others in their group to ensure that they believe the relative nature of the earnings. These earn-ings represent the only information subjects have of other participants.
After earning income, subjects are presented with a computer screen that tells them their individual incomes in that round, as well as the tax pol-icy parameters. These parameters include the audit, penalty, and tax rates. Importantly, subjects are told the amounts of their total incomes that are from foreign sources and the corresponding amounts from domestic sources. They are also told that they may claim both a deduction and a credit for foreign taxes paid. The deduction reduces the taxes that must be paid on reported income; the credit, which is set below the actual foreign taxes paid, also reduces the amount of the taxes that they pay. Subjects are informed that they may enter the amounts they choose for their earned incomes, their deductions, and their foreign tax credits. These choices determine the taxes that they pay on their reported incomes. They are also informed that they may be audited, in which case all underreported taxes will be discovered and a penalty equal to a multiple of unpaid taxes will be imposed.
Subjects choose the amount of money to report to the tax authority for each element of the tax form: income, deduction, and foreign tax credit. For each set of entries in the tax form, the computer automatically reports the resulting tax liability. Subjects are able to experiment with different reports during the time allowed for filing. Thus, they can observe the potential changes in reported take home income for each potential reporting strategy
Taxpayer Services and Tax Compliance 233
they investigate. A timer at the bottom of the tax form counts down the remaining time. Subjects are allowed 100 seconds to file, and the counter begins to flash when there are 15 seconds remaining. Thus, the process in the lab mimics that by which a taxpayer may well conduct different calcula-tions in the time prior to actually filing taxes, whether he or she uses one of the available tax software programs or simply does the tax return by hand.
Audits are determined by the use of a “virtual” bingo cage that appears on each subject’s computer screen. An image of a box with 10 balls (blue and white) appears on the screen following the tax filing. The balls begin to bounce around in the box, and, after a brief interval, a door opens at the top of the box. If a blue ball exits, then the subject is audited; a white ball signifies no audit. The fraction of blue balls determines the audit probability. The audit applies only to the current-period declarations, not to previous (or future) periods. The computer automatically deducts taxes paid and penal-ties (if any are owed) from subjects’ accounts. When an audit occurs, the true values of the uncertain components (deductions and foreign tax credit) are used, and the subject’s declarations are examined. If the subject has underreported tax liability, a fine is imposed. Tax revenues and any penalties are not distributed to subjects.
Subjects are informed that they will keep their aftertax earnings at the end of the experiment, converted from lab dollars to U.S. dollars at the rate of 800 lab dollars to 1 currency dollar, and paid in cash and in private. After income is reported and an audit (if any) is determined, subjects see one final screen that summarizes everything that happened during the round. This process is repeated for a fixed (but unannounced) number of rounds.
Table 1. Experimental Treatments
Information On? Enforcement Effort? No Yes Increase (“Base Case” to “High”) T1 Constant (“Base Case” to “Base Case”) T2
Notes: Enforcement Effort Increase: “Base Case” p=0.2 to “High” p=0.4 Enforcement Effort Constant: “Base Case” p=0.2 to “Base Case” p=0.2 In all sessions, the fine rate is fixed at 150%.
The experimental design is reported in Table 1. The tax authority has two broad policy instruments: the level of enforcement effort and the level of service information that is provided to the taxpayer. As shown in Table 1, at this point, these instruments have been investigated only in limited and basic terms. Thus, the tax authority can adopt a “Base Case” (or constant)
Alm, Jones, and McKee234
or a “High” (or increased) level of enforcement. Since enforcement consists of both the probability of detection and the level of fines, the high level can be implemented as different combinations of higher audit probabilities or higher fines, and, at this, time we vary enforcement by varying only the audit rate, setting the audit probability at values 0.2 (Base Case) and 0.4 (High). Future work will expand the range of audit (and penalty) rates.
As for information, the tax authority can either provide the informa-tion regarding the interpretation of the rules or not (“Information On?”). In all settings, subjects face (initial) uncertainty regarding the allowed deduc-tion and the allowed foreign tax credit, and are told at the beginning of each round the mean values and the spreads of the deduction and the credit. We hold the level of this uncertainty (via a mean-preserving spread) constant throughout all treatments. When information is made available (“Informa-tion On? Yes”), subjects are able to click on a button on the screen, and the true levels of deduction and foreign tax credit are revealed before they file their taxes. This mimics the ability to call a tax agency information help line and obtain accurate information at zero cost. (In subsequent research, we will impose a cost on obtaining this information.) If no information is provided (“Information On? No”), then subjects learn the true values of these uncertain variables only after they have filed their taxes. Overpay-ments are returned if the taxpayer is audited, as is the practice of the IRS in some cases, but not if the taxpayer is not audited. Thus, there is a cost of ignorance to the taxpayer that is greater if not audited, but the audit will also uncover over- and undercompliance.
The fixed parameters used for all sessions are reported in Table 2.
For our pilot study, we have employed a within-subjects design. The treatments are implemented as changes in the tax filing setting. Thus, subjects are in a Base Case setting for the first 10 rounds, and, in round 11, a treatment condition is turned on that is in place for the next 10 rounds, at which point the session ends. In future work, we will vary the order of the treatments.
Taxpayer Services and Tax Compliance 235
The experimental laboratory consists of multiple networked comput-ers, a server, and software designed for this series of experiments. Pilot sessions were conducted on the University of Calgary campus using student subjects recruited via announcements on campus. Potential subjects sign up for the sessions using a Web page and are invited to participate in a specific session by e-mail. Subjects are not permitted to participate in more than one of the sessions used for this paper, only subjects recruited specifically for a session are allowed to participate, and no subject has prior experience in this experimental setting. Methods adhere to all guidelines concerning the ethi-cal treatment of human subjects. Sessions lasted just over 90 minutes, and earnings were in the range of $19.25 to $26.75.
Preliminary ResultsWe have conducted one pilot session for each of the treatments listed in Table 1. The overall compliance effects are reported in Table 3. We report all results as changes in the average level of compliance, calculated as an individual subject’s reported income over his or her true income, averaged over all subjects. Also, since we utilize a within-subjects design and im-pose the policy change in round 11 of each session, it is useful to examine different behavioral responses using some simple graphs. There are several compliance measures that we can evaluate given the choices of reporting strategies that individuals can adopt in this setting. Individuals can evade (and increase take home income) in a variety of ways. They may simply underreport income; they may also cheat by failing to report the true amount of the tax deduction or of the tax credit. Accordingly, in Table 3, we report three measures of evasion: income underreporting, deduction overreporting, and tax liability underreporting.
Table 3. Aggregate Results by Experimental Treatment Information On? Enforcement Effort? No Yes Increase T1
Deduction Compliance: 0.360 Income Reporting: 0.083 Tax Liability Reporting: 0.190
Number Increasing Tax Liability Reporting: 9 of 14 (64%)
Number Increasing Tax Liability Reporting: 8 of 16 (50%)
Alm, Jones, and McKee236
These preliminary results indicate that increasing enforcement effort increases all three types of compliance. Perhaps surprisingly, providing uncertainty-reducing information has no significant impact on compliance.
These results are rather aggregate, and, in Figures 1 to 3, we report the round-by-round averages for the various compliance measures; for each case, the results are denoted by the name of the metric and the treatment. We see that for T2, there is little change in the aggregate behavior when the information is provided beginning in round 11. This is consistent with the result in Table 3 that half of the subjects in T2 increased compliance when the information was provided and half lowered or did not change their compliance. The most compelling result is shown in Figure 3 where the overall level of tax liability reporting is plotted for the 20 decision rounds. The increase in compliance in treatment T1 is most striking here, so that it is clear that the subjects respond to the higher level of enforcement effort. However, at this point, our results must be considered very preliminary. We have a very small sample, we have conducted only a single session in each treatment, and we have investigated a very limited set of experimental parameters.
Discussion and ConclusionsThe deterrent effects of increased enforcement have been well documented. In contrast, the compliance effects of improved tax administrative services are largely unknown. It seems plausible that the tax agency can improve its public perception by providing taxpayer services such as prefiling informa-tion, and that the increased service level would translate into higher compli-ance. However, the actual effects on compliance of such improved service have not been investigated.
The service dimension that we examine here is the provision of uncer-tainty-reducing information prior to the taxpayer’s filing decision. We find that this information provision has a negligible effect on reporting, and as many subjects increased compliance as did not after this information was provided. In contrast, a significant majority of subjects increased compli-ance when the audit rate was increased.
Information is an interesting item in the context of the effect of uncer-tain rules in tax-filing behavior. As Krause (2000) emphasizes, ambiguity in the tax code can be seen as an opportunity to evade or as a risk that can be reduced by overstating one’s tax liability. Thus, information provided by the tax authority can have potentially offsetting effects. For those subjects in our experiment who were claiming the maximum deduction (the top end of the range), the new information may lead them to reduce this claim and to report their true allowed deductions. For those subjects who were hedg-ing by reporting lower levels of deductions, the information will be used to increase their claimed deductions. Thus, the aggregate effect will depend on the number of taxpayers of each type. Investigation of this effect will have to wait until our sample sizes are larger.
Of course, information is only one mechanism by which the tax agency can increase its service provided to taxpayers. We are currently design-ing treatments to investigate the effects of these other mechanisms as well. Thus, even if the aggregate effect of information provision is found to be zero with larger sample sizes and broader parameter spaces, there are many other avenues by which the tax agency may be able to enhance compliance through the adoption of a service paradigm. For example, in the face of un-certainty regarding allowed deductions and credits, the tax agency may wish to apply differential penalties. Thus, underreported income may be punished more harshly than a claimed deduction that the individual is not permitted to claim. In this way, the tax agency may be seen as accommodating “honest mistakes” while punishing deliberate evasion.
Taxpayer Services and Tax Compliance 239
AcknowledgmentsThis research was funded by support from the Internal Revenue Service. We are grateful to Kim Bloomquist and to participants of the 2007 IRS Research Conference for comments and discussions.
References
Allingham, Michael G. and Agnar Sandmo (1972), “Income Tax Evasion: A Theoretical Analysis,” Journal of Public Economics 1 (4), pp. 323-338.
Alm, James (1988), “Uncertain Tax Policies, Individual Behavior, and Wel-fare,” The American Economic Review 78 (1) pp. 237-245.
Alm, James (2007), “Administrative Options to Close the Tax Gap,” Tax Notes, forthcoming.
Alm James; Mark Cronshaw; and Michael McKee (1993), “Tax Compliance with Endogenous Audit Selection Rules,” Kyklos 46 (1) pp. 27-46.
Alm, James; Betty R. Jackson; and Michael McKee (1992), “Institutional Uncertainty and Taxpayer Compliance,” The American Economic Review 82 (4) pp. 1018-1026.
Alm, James and Jorge Martinez-Vazquez (2003), “Institutions, Paradigms, and Tax Evasion in Developing and Transition Countries,” in Public Finance in Developing and Transition Countries, edited by James Alm and Jorge Martinez-Vazquez, Edward Elgar Publishing, Chelten-ham, UK and Northhampton, MA, pp. 147-178.
Andreoni, James, Brian Erard, and Jonathan Feinstein (1998), “Tax Compli-ance,” Journal of Economic Literature 36 (2) pp. 818-860.
Beck, Paul J. and Woon-Oh Jung (1989), “An Economic Model of Taxpayer Compliance Under Uncertainty,” Journal of Accounting and Public Policy 8 (1) pp. 1-27.
Becker, Gary S. (1968), “Crime and Punishment—An Economic Approach,” The Journal of Political Economy 76 (2) pp. 169-217.
Krause, Kate (2000), “Tax Complexity: Problem or Opportunity?” Public Finance Review 28 (4) pp. 395-414.
Alm, Jones, and McKee240
Plott, Charles R. (1987), “Dimensions of Parallelism: Some Policy Applica-tions of Experimental Methods,” in Alvin E. Roth (editor), Labora-tory Experimentation in Economics: Six Points of View, Cambridge University Press, New York, NY.
Scotchmer, Suzanne and Joel Slemrod (1989), “Randomness in Tax En-forcement,” Journal of Public Economics 38 (1) pp. 17-32.
Slemrod, Joel and Shlomo Yitzhaki (2002), “Tax Avoidance, Evasion, and Administration,” in Handbook of Public Economics, edited by Alan J. Auerbach and Martin Feldstein, Elsevier, Amsterdam, London, and New York, pp. 1423-1470
Smith, Vernon (1982), “Microeconomic Systems as an Experimental Sci-ence,” The American Economic Review 72 (5) pp. 923-955.
Taxpayer Service Channel Preferences
Ben Shackleford, Internal Revenue Service
D uring the summer of 2005, Congress directed the IRS to ascertain taxpayer service needs and preferences and develop a 5-year plan to address, as best as possible, all of them. This effort was labeled
the Taxpayer Assistance Blueprint (TAB). One primary objective of the TAB was to investigate taxpayers’ preferences for service acquisition among the various options for contacting the IRS. Generally, the service event was divided into two categories, tax-related issues and ways of preparing and fil-ing a tax return. Tax-related issues are those matters which require attention either before or after filing. To most accurately gauge taxpayer preference, the TAB conducted a study specifically designed to capture taxpayer prefer-ence for IRS-provided service.
Conjoint MethodThe method chosen to determine taxpayer preference was choice-based conjoint analysis. Rather than ask directly which service method taxpay-ers prefer, this method measures the degree of affinity taxpayers hold for different service channels by determining the weight that attributes exert in service channel decisions. The study is comprised of two sets of tradeoff decisions: 1) tax assistance method by service need, and 2) tax preparation and filing methods. Participants were given a set of service attributes such as wait time or likelihood of first contact resolution for each service channel. Attribute values differed by service channel. As taxpayers made choices from successive arrays of service options, the attribute values changed for different service channels. For example, in the instance of wait time, the time required to wait while seeking assistance through the phones might increase from 15 to 30 minutes in successive choice opportunities. Choice responses made among successive arrays of service options revealed what attributes were important.
If the TAB research had simply asked taxpayers, “Which service chan-nel do you prefer?”—the critical (and probably flawed) assumption is that respondents would respond based on experience with each channel. Instead of relying on the memory and experience of respondents, the conjoint meth-od seeks to control understanding of service channel experience by creating a facsimile of channel usage by defining attributes of the service experience. Explaining what service is like through various channels by assigning values
Shackleford242
to common service attributes creates a level playing field for participants to make their service choice decisions. Explaining what a service event would be like by providing attributes with realistic values (e.g., wait time of 30 minutes) compensates for limited understanding of and/or experience with the full range of service options.
The central element of conjoint analysis is the attribute. Breaking down service events into sets of attributes can help reveal what factors of service are most important. By changing attribute values, such as increasing or decreasing wait time, and then analyzing how these changes influenced choices for service, conjoint analysis can provide information about the influence different attributes have on the choices made by service-seeking taxpayers.
For reasons of brevity, this paper will only consider the conclusions and implications of the larger set of service tasks, namely, the choice arrays intended to capture service preference for tax issues not directly related to return preparation. Its goal is to outline some of the benefits and limitations of conjoint research, the challenges of this research method relative to tax re-search, some of the significant findings related to the TAB, and some future directions for continued analysis using these data and this technique.
What Factors Create Taxpayer Channel Preference?Before we delve into preference research conducted for the TAB Phase 2 effort, it is useful to understand the frame of analysis developed by Wage and Investment (W&I) Research.1 The TAB 2 research team identified several factors that influence taxpayers when they choose what channel to use when they contact IRS for service. The type of service sought and the perceived performance of the channel sought will impact preference and behavior. Taxpayer qualities such as attitudes, awareness, access to chan-nels, and previous behavior were also considered to have impact on prefer-ence and behavior. For ease of understanding these factors and their pro-posed relationship, a diagram based on Theory of Planned Behavior (TPB) is supplied (Figure 1).2 Part of what the diagram illustrates is that different factors, such as awareness and type of service sought, influence one another and interact to ultimately impact preference, intention, and behavior. It is helpful to understand these relationships whenever one is trying to predict,
1 The TAB project was a two-phase effort: Phase 1 included preliminary research relative to taxpayer needs, preferences, and behaviors, and Phase 2 built on the themes identified in Phase 1 and included extensive additional research, including taxpayer surveys.2 Ajzen, I. (2006), “The Theory of Planned Behavior,” Organizational Behaviour and Human Decision Processes, 50, pp. 179-211.
Taxpayer Service Channel Preferences 243
explain, or change behavior. It is also useful to understand those elements of planned behavior which are, to the extent possible, controlled by the con-joint method. As Figure 1 illustrates, the conjoint method seeks to establish uniform behavioral beliefs and control beliefs for all participants.
The idea behind testing preference with conjoint analysis techniques is that more clear interactions can be observed if a degree of control is exerted over some of these factors. Figure 1 illustrates how, under the abiding and indeterminate influence of habit, taxpayers move toward behavior. The shaded areas are where a conjoint test seeks to exert control over partici-pants. Control over behavioral beliefs—in this case, the perceptions about the effort and nature of the task and about what service through a particular channel might be like—is established by describing what these activities are like. Uniform control beliefs, the conditions which might inflexibly constrain choice, are established by providing universal awareness of, and selecting for participants, the channels under comparison.
Figure 1. Theory of Planned Behavior for Taxpayer Preference3
Behavioral Beliefs
- Types of ServiceSought- Channel Performance
BehaviorNormativeBeliefs
Attitudes
- Awareness - Channel Availability
ControlBeliefs
Intention
Theory of Planned Behavior –Human behavior is guided by three kinds of considerations:
Behavioral Beliefs – beliefs about the likely consequences of the behavior
Normative Beliefs – beliefs about the normative expectations of others
Control Beliefs – beliefs about the presence of factors that may facilitate or impede
performance of the behavior
PREFERENCE Point of Conjoint
Analysis Data Capture
3 This diagram is based on the Theory of Planned Behavior by Ajzen (1991) and was modified for the current context. This diagram is not a statistical model.
Shackleford244
As Figure 1 also illustrates, the conjoint method cannot exert control over the normative beliefs that set a baseline of interpretation for partici-pants. Likewise, the conjoint method cannot exert any control over the influence of habit. Though the ultimate conjoint analysis findings would suggest that normative beliefs and habit were significant inputs into planned behavior, right now, we can only guess the degree of influence exerted by these factors.
Conjoint Study of Taxpayer Service Channel PreferenceIn this conjoint study, participants considered seven IRS taxpayer service methods maintained by the IRS. These service channels were:
Interactive assistance using a phone and an IRS Customer Service Representative,
Self-service using an automated phone menu,
Conventional correspondence, i.e., mail,
Internet interaction with an assistor, i.e., e-mail or live chat,
Self-service using the Internet,
Interactive, face-to-face service at a Taxpayer Assistance Center (TAC), and
Self-service at a TAC.
Taxpayers were asked to choose between service channels for specified service tasks. These eight service tasks were selected from operational data to provide full coverage of typical service events accomplished through IRS channels. The service tasks were:
Getting a form or publication,
Getting information about a notice received from the IRS,
Tax return preparation guidance,
Asking a tax law question,
Getting refund information,
Getting prior-year return information,
Taxpayer Service Channel Preferences 245
Getting information about tax payments, and
Applying for a taxpayer identification number or employer identi-fication number.
Choices involved comparison between channels where each channel and service task were described as a set of attributes. Specific attributes and relevant ranges of these services were jointly developed by W&I Research and Pacific Consulting Group (PCG). Patterns of taxpayer selections among different conjoined service attributes were analyzed to create a view of how different groups of taxpayers might choose among TACs, toll-free telephone, Internet, and regular mail to accomplish eight common service tasks.
Participants were recruited from a national panel maintained by Knowledge Networks, a market research firm. Participants submitted their responses online or via a television set top box (for those without computer access). Respondents included 2,196 individual taxpayers. To ensure that the sample represented all individual taxpayers, TAC and low-income users were intentionally oversampled to ensure a valid sample for analysis of these subgroups. The sample included 533 individual taxpayers who visited an IRS TAC within the past 2 years and 1,015 low-income filers.4
In the TAB Phase 2 conjoint study, respondents chose their most pre-ferred service options from a series of service events and channels. To place these channel choices into context, the service channel options were defined using attributes of the service experience. The attributes or “performance characteristics” were chosen by looking within customer satisfaction survey open-ended responses. The original list was refined to create a list of four attributes of primary significance to taxpayers and operational relevance to the IRS. The attributes chosen were wait time, service time, hours of availability, and the probability of single contact issue resolution. In this way, choices were made with the understanding of the potential burden and benefit of different channels. Consequently, responses reflect how individu-als compare options and make decisions in real life.
When presented as components of a service channel, attributes were valued, using ranges developed from operational data and taxpayer focus groups. For example, wait time was described as 15 minutes for phones, 1 minute for IRS.gov, 30 minutes for a TAC, and 5 days for written corre-spondence. After participants chose a channel, they were provided the same channels with new values for some attributes from which to make their choices. As the participants moved through successive sets of channels, at-tribute values were varied for successive sets of choices.4 For the purposes of TAB Phase 2, low income was defined broadly to cover the entire EITC-eligible population (< $36,000 annual household income).
Shackleford246
During subsequent iterations, taxpayers selected from the same set of service channels but with varying levels of performance. Successive choices among successive sets of options, each with further changes among performance attributes, reveal the point at which participants change service options because the performance characteristics they value had either dete-riorated too much in the channel they first preferred. Or, alternately, choices revealed where a competing attribute had increased enough in another channel to prompt migration to that option. Breaking down service events into realistic attributes permits comparison between separate elements of the overall experience. For instance, if a participant indicates a preference for seeking service over the phone when the wait time is 5 minutes, will he or she still want to use the phone if the wait time deteriorates to 15 minutes? If the participant is willing to use phones with a 5-minute wait but does not prefer phones with a 15-minute wait, we then know that wait time perfor-mance is important to that person.
For the TAB 2 conjoint study, categories of performance that taxpay-ers weighed when making decisions about service were determined by three focus groups conducted across the country. This exploratory research also helped refine the language used to convey service options to taxpay-ers. Finally, to confirm the understandability of the performance categories developed in the focus groups, and that taxpayers could understand and accomplish the actual test, a trial run was conducted among qualified sub-jects. After incorporating adjustments uncovered during the trial run, the conjoint survey was administered to 2,196 taxpayers between June 23 and July 5, 2006.
When completing the conjoint study questionnaire, participants com-pleted straightforward survey questions, responded to questions designed to explain the performance categories, and then chose among service options with different performance levels. By varying the performance character-istics in different ways among participants, and testing large numbers of subjects, conjoint analysis defines what performance characteristics most influenced choices among service options. When conducted with enough in-dividuals, this method can also determine distinctions among subsets of the taxpaying population. When analyzed, choices among changing attributes paint a picture of what performance factors influenced preference for differ-ent types of people, different service tasks, and different service channels. Analysis of test results establishes how much performance characteristics contribute to the choice behavior.
In the TAB 2 conjoint test, the relative importance of performance characteristics is represented as a portion, or choice share, of 100 possible
Taxpayer Service Channel Preferences 247
points for each service option. Choice share, the portion of choices made at-tributable to a single characteristic, helps define what preferences taxpayers would express in the current service environment, as well as how taxpayers would behave if performance characteristics were changed. By evaluating what choices are made under current levels of performance, conjoint analy-sis allowed the TAB to define how different taxpayers prefer to get service. Because we tested how subjects preferred to seek service for a variety of service tasks, conjoint analysis also shows the degree to which the type of service need influences channel choice.
TAB Phase 2 Conjoint ResultsTable 1 shows the distribution of choice shares for all taxpayers with current, or base case, performance levels. The base case reflects that set of values for attributes that best reflect operational reality. As indicated by the bolded choice shares in the table, regardless of task, taxpayers mainly choose the telephone to initiate contact with the IRS. A notable exception to the prefer-ence for telephone is taxpayers’ strong affinity for using the Internet to get forms and publications.
Analyses of subsets of the taxpaying population show varying levels of affinity for the service options tested. As shown in Table 2, the Millen-nial generation (taxpayers under 29 years of age) shows a strong preference for getting forms and publications, getting help with return preparation, and getting information about payments online. Additionally, where levels of preference are similar, more opportunity exists to move taxpayer choice between service channels. To illustrate this point, choice shares within 10 points of other choice shares are underlined in the table. Similar choice shares suggest the possibility of “migrating” younger taxpayers who would use TACs to respond to notices or to get refund information to the telephone service channel. Similarly, young taxpayers interested in getting a prior year return or making a payment might be easily migrated to the IRS Web site for these service needs.
Generation X taxpayers, those between age 30 and 40, show even greater potential for movement between service channels. As shown in Table 3, taxpayers age 30 to 40 who seek assistance for return preparation guidance, tax law questions, refund information, and prior-year returns are likely candidates for migration.
Shackleford248Ta
ble
1. B
ase
Cas
e C
hoic
e Sh
are
Dis
trib
utio
ns fo
r all
Taxp
ayer
s5
5 Pac
ific
Con
sulti
ng G
roup
, “C
hoic
e Sh
ares
for S
peci
al S
egm
ents
,” S
epte
mbe
r 9, 2
006.
All
Taxp
ayer
sSe
rvic
e C
hann
els
Ser
vice
Tas
kTA
C
Inte
ract
ive
TAC
S
elf-
assi
st
Pho
ne
Inte
ract
ive
Pho
ne
Sel
f-as
sist
Web
In
tera
ctiv
e
Web
S
elf-
assi
stC
orre
spon
denc
e
Get
ting
a fo
rm o
r pub
116
2113
741
1
Get
ting
info
rmat
ion
abou
t a n
otic
e re
ceiv
ed
from
the
IRS
21N
/A55
N/A
22N
/A2
Get
ting
tax
retu
rn p
repa
ratio
n gu
idan
ce17
N/A
3112
931
0
Ans
wer
ing
tax
law
que
stio
ns20
N/A
398
924
0
Get
ting
refu
nd in
form
atio
n15
N/A
3923
1912
2
Get
ting
prio
r-yea
r ret
urn
info
rmat
ion
15N
/A39
1111
213
Get
ting
info
rmat
ion
abou
t pay
men
ts16
N/A
4113
920
1
App
lyin
g fo
r a T
axpa
yer I
D o
r an
Em
ploy
er
ID N
umbe
r15
N/A
43N
/A21
202
Taxpayer Service Channel Preferences 249
Tabl
e 2.
Bas
e C
ase
Cho
ice
Shar
e D
istr
ibut
ions
for T
axpa
yers
of t
he “
Mill
enni
al”
Gen
erat
ion6
6 Pac
ific
Con
sulti
ng G
roup
, “C
hoic
e Sh
ares
for S
peci
al S
egm
ents
,” S
epte
mbe
r 9, 2
006.
Mill
enni
al
(Und
er 2
9 ye
ars
of a
ge)
Serv
ice
Cha
nnel
s
Ser
vice
Tas
kTA
C
Inte
ract
ive
TAC
S
elf-
assi
st
Pho
ne
Inte
ract
ive
Pho
ne
Sel
f-as
sist
Web
In
tera
ctiv
e
Web
S
elf-
assi
stC
orre
spon
denc
eTo
tal C
hoic
e S
hare
s
Get
ting
a fo
rm o
r pub
313
512
858
010
0
Get
ting
info
rmat
ion
abou
t a
notic
e re
ceiv
ed fr
om th
e IR
S28
N/A
33N
/A2
N/A
210
0
Get
ting
tax
retu
rn
prep
arat
ion
guid
ance
8N
/A22
149
470
100
Ans
wer
ing
tax
law
qu
estio
ns15
N/A
3710
929
010
0
Get
ting
refu
nd in
form
atio
n26
N/A
3122
116
410
0
Get
ting
prio
r-yea
r ret
urn
info
rmat
ion
11N
/A32
923
222
100
Get
ting
info
rmat
ion
abou
t pa
ymen
ts14
N/A
2914
637
010
0
App
lyin
g fo
r a T
axpa
yer I
D
or a
n E
mpl
oyer
ID N
umbe
r13
N/A
42N
/A17
290
100
Shackleford250Ta
ble
3. B
ase
Cas
e C
hoic
e Sh
are
Dis
trib
utio
ns fo
r Tax
paye
rs o
f “G
ener
atio
n X”
7
7 Pac
ific
Con
sulti
ng G
roup
, “C
hoic
e Sh
ares
for S
peci
al S
egm
ents
,” S
epte
mbe
r 9, 2
006.
Gen
erat
ion
X (3
0–40
yea
rs o
f age
)Se
rvic
e C
hann
els
Ser
vice
Tas
kTA
C
Inte
ract
ive
TAC
S
elf-
assi
st
Pho
ne
Inte
ract
ive
Pho
ne
Sel
f-as
sist
Web
In
tera
ctiv
e
Web
S
elf-
assi
stC
orre
spon
denc
eTo
tal C
hoic
e S
hare
s
Get
ting
a fo
rm o
r pub
63
1911
853
010
0
Get
ting
info
rmat
ion
abou
t a
notic
e re
ceiv
ed fr
om th
e IR
S10
N/A
60N
/A30
N/A
110
0
Get
ting
tax
retu
rn
prep
arat
ion
guid
ance
11N
/A21
2314
320
100
Ans
wer
ing
tax
law
qu
estio
ns19
N/A
3310
1028
010
0
Get
ting
refu
nd in
form
atio
n11
N/A
2831
1118
210
0
Get
ting
prio
r-yea
r ret
urn
info
rmat
ion
7N
/A30
1713
276
100
Get
ting
info
rmat
ion
abou
t pa
ymen
ts7
N/A
4017
828
010
0
App
lyin
g fo
r a T
axpa
yer I
D
or a
n E
mpl
oyer
ID N
umbe
r9
N/A
45N
/A31
160
100
Taxpayer Service Channel Preferences 251
Baby Boomers, those taxpayers between 41 and 60, indicated declining propensity toward movement to different service channels. Table 4 illus-trates that only for getting tax preparation assistance and getting answers to tax law questions did Baby Boomers indicate enough affinity for an alternate channel to possibly be moved from the telephone.
Table 5 shows that Seniors, taxpayers over age 61, demonstrate even lower likelihood of migrating between service channels, with fairly high levels of affinity for using the telephone to address all service tasks.
Other populations of interest identified by TAB for specific analysis are similarly disinclined to try other channels. In Tables 6 and 7, low-income and disabled taxpayers show high levels of preference for the telephone. It seems likely that hesitance to try new channels may coincide with limited experience with or access to information technology like computers and the Internet. In the instance of low-income taxpayers, the financial burden of computer access may limit use of the Internet. For disabled taxpayers, the functional inconvenience of some adaptive technologies may diminish the speed and convenience of Internet use and thereby make other communica-tion alternatives more attractive.
The Relative Importance of TAB Phase 2 Conjoint AttributesAnother way to interpret responses from a conjoint survey is to define which attribute exerts the greatest influence over taxpayer service choice. With the levels of service at their base case levels for all tasks—the levels which reflect most closely the normal operating environment, for all service tasks tested, the most influential attribute is first contact resolution. As Table 8 shows, the other attributes, e.g., access time, servicing time, and hours of availability, are not nearly as important. For all service tasks, first contact resolution captured just over half of the possible influence exerted in deci-sions. This means that the likelihood of resolving an issue during the first attempt is, by far, the most important characteristic influencing choice of service. The channel possessing the highest level of first contact resolution was most often chosen over other channels, even when the other service at-tributes for that channel involved more taxpayer burden.
Several conclusions can be drawn from the influence of first contact resolution in the service channel decision process. First, taxpayers clearly are willing to sacrifice time and assume scheduling difficulties to get an is-sue resolved. Second, the emphasis on first contact resolution shows that it is the attribute which can be enhanced to increase taxpayer satisfaction and increase the likelihood of migrating taxpayers among service channels.
Shackleford252Ta
ble
4. B
ase
Cas
e C
hoic
e Sh
are
Dis
trib
utio
ns fo
r Tax
paye
rs o
f the
“B
aby
Boo
mer
” G
ener
atio
n8
8 Pac
ific
Con
sulti
ng G
roup
, “C
hoic
e Sh
ares
for S
peci
al S
egm
ents
,” S
epte
mbe
r 9, 2
006.
Bab
y B
oom
ers
(41–
60 y
ears
of a
ge)
Serv
ice
Cha
nnel
s
Ser
vice
Tas
kTA
C
Inte
ract
ive
TAC
S
elf-
assi
st
Pho
ne
Inte
ract
ive
Pho
ne
Sel
f-as
sist
Web
In
tera
ctiv
e
Web
S
elf-
assi
stC
orre
spon
denc
eTo
tal C
hoic
e S
hare
s
Get
ting
a fo
rm o
r pub
164
2514
532
310
0
Get
ting
info
rmat
ion
abou
t a
notic
e re
ceiv
ed fr
om th
e IR
S17
N/A
62N
/A20
N/A
210
0
Get
ting
tax
retu
rn
prep
arat
ion
guid
ance
15N
/A38
810
281
100
Ans
wer
ing
tax
law
qu
estio
ns22
N/A
357
1026
010
0
Get
ting
refu
nd in
form
atio
n12
N/A
3925
815
010
0
Get
ting
prio
r-yea
r ret
urn
info
rmat
ion
13N
/A39
166
261
100
Get
ting
info
rmat
ion
abou
t pa
ymen
ts16
N/A
3914
1414
210
0
App
lyin
g fo
r a T
axpa
yer I
D
or a
n E
mpl
oyer
ID N
umbe
r15
N/A
41N
/A20
212
100
Taxpayer Service Channel Preferences 253
Tabl
e 5.
Bas
e C
ase
Cho
ice
Shar
e D
istr
ibut
ions
for “
Seni
or”
Taxp
ayer
s9
9 Pac
ific
Con
sulti
ng G
roup
, “C
hoic
e Sh
ares
for S
peci
al S
egm
ents
,” S
epte
mbe
r 9, 2
006.
Seni
ors
(61
year
s ol
d an
d ol
der)
Serv
ice
Cha
nnel
s
Ser
vice
Tas
kTA
C
Inte
ract
ive
TAC
S
elf-
assi
st
Pho
ne
Inte
ract
ive
Pho
ne
Sel
f-as
sist
Web
In
tera
ctiv
e
Web
S
elf-
assi
stC
orre
spon
denc
eTo
tal C
hoic
e S
hare
s
Get
ting
a fo
rm o
r pub
165
3412
1023
010
0
Get
ting
info
rmat
ion
abou
t a
notic
e re
ceiv
ed fr
om th
e IR
S33
N/A
59N
/A4
N/A
310
0
Get
ting
tax
retu
rn
prep
arat
ion
guid
ance
35N
/A38
55
151
100
Ans
wer
ing
tax
law
qu
estio
ns23
N/A
595
67
010
0
Get
ting
refu
nd in
form
atio
n16
N/A
619
94
210
0
Get
ting
prio
r-yea
r ret
urn
info
rmat
ion
28N
/A54
37
44
100
Get
ting
info
rmat
ion
abou
t pa
ymen
ts27
N/A
585
54
110
0
App
lyin
g fo
r a T
axpa
yer I
D
or a
n E
mpl
oyer
ID N
umbe
r26
N/A
49N
/A9
96
100
Shackleford254Ta
ble
6. B
ase
Cas
e C
hoic
e Sh
are
Dis
trib
utio
ns fo
r Low
-Inco
me
Taxp
ayer
s10
10 P
acifi
c C
onsu
lting
Gro
up, “
Cho
ice
Shar
es fo
r Spe
cial
Seg
men
ts,”
Sep
tem
ber 9
, 200
6.
Low
Inco
me
(Les
s th
an 3
6K)
Serv
ice
Cha
nnel
s
Ser
vice
Nee
dTA
C
Inte
ract
ive
TAC
S
elf-
assi
st
Pho
ne
Inte
ract
ive
Pho
ne
Sel
f-as
sist
Web
In
tera
ctiv
e
Web
S
elf-
assi
stC
orre
spon
denc
eTo
tal C
hoic
e S
hare
s
Get
ting
a fo
rm o
r pub
188
2615
824
210
0
Get
ting
info
rmat
ion
abou
t a
notic
e re
ceiv
ed fr
om th
e IR
S22
N/A
64N
/A12
N/A
210
0
Get
ting
tax
retu
rn
prep
arat
ion
guid
ance
26N
/A29
1511
191
100
Ans
wer
ing
tax
law
qu
estio
ns20
N/A
418
723
010
0
Get
ting
refu
nd in
form
atio
n19
N/A
3522
912
410
0
Get
ting
prio
r-yea
r ret
urn
info
rmat
ion
17N
/A45
79
192
100
Get
ting
info
rmat
ion
abou
t pa
ymen
ts22
N/A
499
713
110
0
App
lyin
g fo
r a T
axpa
yer I
D
or a
n E
mpl
oyer
ID N
umbe
r26
N/A
39N
/A16
164
100
Taxpayer Service Channel Preferences 255
Tabl
e 7.
Bas
e C
ase
Cho
ice
Shar
e D
istr
ibut
ions
for T
axpa
yers
with
Dis
abili
ties11
11 P
acifi
c C
onsu
lting
Gro
up, “
Cho
ice
Shar
es fo
r Spe
cial
Seg
men
ts,”
Sep
tem
ber 9
, 200
6.
Dis
able
d (S
elf-R
epor
ted)
Serv
ice
Cha
nnel
s
Ser
vice
Nee
dTA
C
Inte
ract
ive
TAC
S
elf-
assi
st
Pho
ne
Inte
ract
ive
Pho
ne
Sel
f-as
sist
Web
In
tera
ctiv
e
Web
S
elf-
assi
stC
orre
spon
denc
eTo
tal C
hoic
e S
hare
s
Get
ting
a fo
rm o
r pub
1616
3013
718
010
0
Get
ting
info
rmat
ion
abou
t a
notic
e re
ceiv
ed fr
om th
e IR
S26
N/A
44N
/A26
N/A
410
0
Get
ting
tax
retu
rn
prep
arat
ion
guid
ance
27N
/A41
68
180
100
Ans
wer
ing
tax
law
qu
estio
ns26
N/A
4315
88
010
0
Get
ting
refu
nd in
form
atio
n25
N/A
4813
114
010
0
Get
ting
prio
r-yea
r ret
urn
info
rmat
ion
13N
/A45
258
82
100
Get
ting
info
rmat
ion
abou
t pa
ymen
ts32
N/A
526
82
010
0
App
lyin
g fo
r a T
axpa
yer I
D
or a
n E
mpl
oyer
ID N
umbe
r21
N/A
38N
/A13
272
100
Shackleford256
Table 8. Index of Importance for Attributes of the Service Event12
Index of importance for service need and attribute
Access time
Servicing time
Hours of availability
Percent first contact resolution
Getting a form or pub 21% 13% 15% 52%
Getting information about a notice received from the IRS 20% 17% 13% 50%
Getting prior-year return information 18% 14% 12% 55%
Getting information about payments 19% 18% 12% 51%
Applying for a Taxpayer ID or an Employer ID Number 20% 15% 14% 51%
Though conjoint analysis can show preference distribution and sug-gest likely candidates for migration efforts, there are some drawbacks. First, conjoint analysis cannot tell us how people actually behave, only what they want. Therefore, it does not tell us what is currently happening in the ser-vice environment in terms of products or service delivery mechanisms. Put another way, people do not always act in the ways that maximize their own preferences. Second, conjoint is only valid for service channels, tasks, and performance levels tested. It cannot tell us how preference distribution will actually change if new products or services are introduced. Third, there are three main reasons why conjoint analysis reveals preferences but not actual behaviors:
Lack of awareness: Some, and in some instances most, of the customers are not aware of all the available alternatives or the existing attribute levels of alternatives they have not used. By educating taxpayers about the choices they are making, conjoint creates an artificial level of service.
Lack of access: Some portion of taxpayers simply do not have access to all the available service.
12 Pacific Consulting Group, “Choice Shares for Special Segments,” September 9, 2006.
Taxpayer Service Channel Preferences 257
Lack of willingness to change: Habit can be a very powerful force, driving many customers to stick with an alternative even after realizing they would prefer a different alternative.
It is useful to note that all three inhibitors of actual behavior—aware-ness, access, and habit—can be influenced by communications and other marketing strategies (e.g., monetary and nonmonetary incentives and disin-centives) in ways that will move actual behaviors in the marketplace closer to the preferences revealed by conjoint analysis.
Hypothetical Cases Using TAB Phase 2 Conjoint StudyChoice share distributions under the base case show preference for service in the current service environment, under current service performance levels. In addition to showing current taxpayer affinity for service channels, con-joint analysis can show how changes in performance levels impact prefer-ence distribution. It is useful to point out that, although changed preference can shift service use between channels, it does not mean that behavior will change. Rather, running conjoint analysis with performance levels changed from the current state will show how much more (or less) taxpayers will want different service channels if performance characteristics change. These operational performance changes will only be reflected in the taxpayer ser-vice behaviors if barriers to behavioral change (i.e., access, awareness, and habit mentioned above) are mitigated.
Despite some limitations, the conjoint method offers a strong predictive capacity. After data are collected, the choice share data for each individual participant can be used to test hypothetical constructs in the service environ-ment. For example, we can use the data to predict the influence of changing the values for first contact resolution on taxpayers’ service channel prefer-ences. By substituting values from within the range of possible choices for first contact resolution and running these new values against the impression of preference behaviors created for each participant, we can figure out how taxpayers with full information would behave.
TAB 2 conjoint data were used to compare two hypothetical scenarios against the base case. All three scenarios consider all but one service task—tax return preparation guidance. Table 9 presents the performance attributes for the service channels included in the scenarios, with the grey cells highlighting the changed attribute values for the hypothetical scenarios. Under the “Hyp. A” scenario, all base case values are maintained except for first contact resolution at TACs. Under the “Hyp. B” scenario, all base case values are maintained except for first contact resolution using the Internet.
Shackleford258
Table 9. Performance Attributes for Comparison of Three Scenarios13
Attributes TAC, Assisted
Toll-Free, Assisted
Toll-Free, Automated
Web site, Assisted
Web site, Self-assist Mail
Access Time 20 5 5 3 15 N/A
Servicing Time 15 5 5 10 5 30
days
Hours of Availability
Business Hours
Business and
Evenings24/7
Business and
Evenings24/7 N/A
Percent First Contact Resolution
95Hyp.
A 65
85 85 85Hyp.
B 95
85Hyp.
B 95
75
Figure 2 shows the changes in choice share distribution resulting from changes in current service performance levels to the hypothetical sets of per-formance levels. Under the Hyp. A example, when the probability of resolu-tion at a TAC declines from 95 percent to 65 percent, taxpayer preference moves to alternate service channels. The second hypothetical scenario, Hyp. B, also suggests likely changes in the service environment. If all of the base case values remain constant, except for an increase in first contact resolution for self-assisted and interactive Web site service, there are substantial shifts in the service channels taxpayers prefer. Note that, for any single change, either reducing resolution at the TACs or increasing resolution through the Web site, all of taxpayer preferences shift.
The choice share distributions presented in Figure 2 only show how people would behave if they were given universal knowledge of service attributes and if they had access to service options that may not currently exist. Though these factors are often considered limitations, in the context of tax administrations, such constraints also offer opportunity. Each change in choice share suggests an opportunity to test, either through operational adjustments, trial programs, or in an experimental setting, methods of better meeting taxpayer service preferences.
13 Pacific Consulting Group, “Taxpayer Assistance Blueprint, Conjoint II Briefing,” September 2006, pp.18, 20, 23.
Taxpayer Service Channel Preferences 259
Figure 2. Choice Share Distributions Under Three Different Attribute Performance Scenarios14
Choice Share Distributions Under Three Different First Contact Resolution (FCR)
Scenarios:
0
5
10
15
20
25
30
35
40
45
50
TAC, Assist Toll-Free,Assist
Toll-Free,Automated
Web Site,Self
Web Site, Assist
Channels for Taxpayer Service
Percentage of Choice Share
Base Case Hyp. A Hyp. B
A Few Conclusions from TAB Phase 2 ConjointFirst, the results of the conjoint work conducted for the TAB support the decision to segment the taxpaying population into generations. The decision to use generations to understand service channels is substantiated by the con-cept of technological momentum. Technological momentum is a theory that relates the influence of widely held cultural experiences and expectations to technological innovation and adoption.15 This concept, maintained by historians and sociologists of technology, suggests that technologies enjoy substantial inertia within cultures, even as they may become functionally outdated. In this instance, the relevant technologies are the communication methods that facilitate taxpayer service.
14 Pacific Consulting Group, “Taxpayer Assistance Blueprint, Conjoint II Briefing,” September 2006, pp.18, 20, 23. 15 Hughes,Thomas (1994), “Technological Momentum,” Does Technology Drive History, Merritt Roe Smith and Leo Marx, editors, MIT Press.
Shackleford260
The TAB Phase 2 conjoint data suggest that older communication tech-nologies remain popular because this technology framed behavior for many years, long before the emergence of competing communication systems. Clearly, the context of experience with communication technology strongly influences choice for service channel use.
Persistent affinity for the telephone, even above other forms of human interaction such as “live chat” mediated through the Internet, suggests that telephones will remain relevant for many users. Context, and the residual importance of context on groups, are the basis for generational theory. Clearly, those generations with substantial experience using telephone tech-nology are more comfortable communicating in this medium. The manner with which affinity for telephone use increases with age suggests that experi-ence with a telephone helps determine preference and that this preference is less likely to be shifted.
Second, the grip of existing technological practice on generations sug-gests that new ways of communication—new service channels—might best be grown into. Rather than attempt to convert the unwilling, the IRS might do well to try and develop new ways of serving taxpayers that focus on younger demographics.
Third, the conjoint results indicate that taxpayers value certainty above convenience. The heavy emphasis on first contact resolution suggests that taxpayers are less interested in fully grasping the complexities of their tax circumstance than in completing their transactions. Whereas shopping for consumer electronics might entail mastery of a vast array of complex techni-cal concepts, taxpayers may be disinterested in similar mastery of their por-tions of the tax code. Quick, low-risk completion of the tax task seems to be the primary objective for most taxpayers.
Finally, creating any change in service channel use by applying the pre-dictive capacities of the conjoint method hinges on effective communication. Conjoint method can predict how taxpayer affinity for service may change relative to changes in the service environment. However, taxpayers must be made aware of the changes to elements of the service experience before they can be expected to change behaviors. In the same way that the conjoint method creates understanding of the service experience before asking tax-payers to choose, real operational changes must be accompanied by informa-tion campaigns before changes in choice behavior can be expected. If the attributes most valued by taxpayers are enhanced, and taxpayer decisions can include knowledge of these changed attributes, then behavior can be expected to match preferences for service developed by the conjoint study.
Lab Research on Customer Preferences and the Relationship Between Service and Compliance
Kathleen Holland and Howard Rasey, Internal Revenue Service
T he relationship between the services IRS provides and compliance, although intuitive, is difficult to quantify. In 1989, Price Water-house conducted a study designed to measure this relationship by
providing groups of participants with different types of service while they completed hypothetical tax situations.1 The groups either had access to no extra service, telephone service, face-to-face service, or both telephone and face-to-face service. Their results indicate that those with assistance avail-able had lower absolute error than those without assistance. This difference in absolute error existed regardless of the type of available service.
The current study was designed to partially replicate and expand on the Price Waterhouse 1989 study. In addition to testing telephone and walk-in assistance, IRS.gov Web assistance was also tested. This addition resulted in a five-condition experimental design: 1) forms and publications only; 2) forms, publications, and IRS.gov; 3) forms, publications, and face-to-face assistance; 4) forms, publications, and telephone assistance; and 5) forms, publications, IRS.gov, face-to-face, and telephone assistance. Another modi-fication to the Price Waterhouse study was the decision to analyze data based on actual service use as well as analyze the data based on service availabil-ity. This second analysis was designed to examine if service availability alone impacts compliance or if the actual provision of service is necessary to have an effect.
In addition to providing further information on the relationship be-tween service and compliance, this study was also designed to provide infor-mation about taxpayer use of different IRS channels. One group was given equal access to all three major types of IRS service. The behaviors of this group were expected to provide information on unqualified use of services by taxpayers. Because participants were able to use service more than once, this group could also provide information about patterns of service usage.
1 Price Waterhouse, Study of the Effect of Taxpayer Assistance on Voluntary Compliance, IRS Management Briefing and Executive Summary, July 1989.
Holland and Rasey262
Research MethodsParticipantsA contractor recruited 195 people to participate in the study. Of the 195 peo-ple scheduled to participate, 176 actually participated in the study. In order to be eligible, participants were required to be at least 18 years of age, have a 10th grade education or above, speak English as their primary language, and have completed their own tax returns without the use of tax preparation soft-ware at least once in the last 5 years. Screening also required that approxi-mately half of the participants not have Internet access at home. Of the 176 participants, 52 percent did not have Internet access at home. Unfortunately, none of the participants was over the age of 65; therefore, our sample does not represent those over the age of 65.
MaterialsFor the current study, it was determined that certain tax situations would be included in the tax scenarios. These included itemizing deductions (com-pleting a Schedule A), claiming Earned Income Tax Credit (EITC), and re-porting taxable Social Security income. These tax topics or situations were chosen so that further analysis could be conducted on these topics. Schedule A was included because Price Waterhouse found significant errors with item-ized deductions. Taxable Social Security was included because it is one of the top ten math error codes every year. Further, the IRS has found that this error is commonly made by both taxpayers and paid preparers. EITC was chosen in an attempt to further understand this special population.
Scenarios were matched to the participant’s own tax situation so that no participant encountered anything completely new during the study. In total, 16 scenarios were created for the study. In order to ensure the completeness of the scenarios and to ensure accuracy for scoring the return, the scenarios were either adapted from Volunteer Income Tax Assistance (VITA) training materials or from scenarios utilized in a Government Accountability Office (GAO) study. The scenarios were also independently completed by Wage and Investment research analysts.
In addition to the tax scenarios, a debrief survey was also designed and given to the participants. The debrief survey asked about the participant’s experience completing the tax scenario and also about any service he or she used while completing the tax scenario. The debrief also asked questions about completing their most recent personal tax returns and their service us-age when preparing their most recent personal tax returns.
Lab Research on Customer Preferences 263
ProceduresA contractor, Development Associates, was hired to recruit participants for the current study. The contractor recruited through advertising on Craigslist.com and in small market local print media. The contractor screened interested individuals for eligibility and asked about their personal tax situations to assign them to the proper tax scenario. Those who had completed a Form1040EZ the previous tax year were asked if they would be comfortable completing a Form1040A. If they said no, they were ex-cluded from the study. Interested, eligible, available participants were then scheduled to attend one of the test sessions at an Atlanta, Georgia Taxpayer Assistance Center (TAC). At the time of recruitment, participants were told participation would take 2 hours. No participant took the full 2 hours, and most were done in less than 1 and a half hours.
Scheduled participants were randomly assigned to one of five service groups with different options for service: 1) forms and publications only; 2) forms, publications, and IRS.gov; 3) forms, publications, and face-to-face assistance; 4) forms, publications, and telephone assistance; and 5) forms, publications, IRS.gov, face-to-face, and telephone assistance.
The study was primarily conducted in a large conference room at an Atlanta TAC. On arrival, participants were given an orientation by the contractor. During orientation, participants were given an ID badge (with participant number and assigned service group) and a packet with instruc-tions and mock tax scenarios. Participants were also read the instructions during the orientation. Orientation took place in a small room outside the TAC. After orientation, participants were taken to the large conference room. All participants were provided with a calculator and pencils. Eligible participants who elected to use service signaled an usher who then took them to the service location. Service was provided at the TAC for face-to-face service, in a small room with a phone for IRS toll-free telephone assistance, and at a bank of three computers in the large conference room for IRS.gov assistance. After completing mock tax scenarios, participants were given a debrief questionnaire. Before leaving the facility, participants were paid an honorarium of $75 for their time.
Research FindingsOf the 176 participants, 7 indicated that they were not able to complete the tax scenarios and were dropped from further analysis. Only 24 percent of the 136 with access to service other than forms and publications actually used service. Of the 32 with access to IRS.gov, 13 percent used it. Of the
Holland and Rasey264
30 with access to face-to-face assistance, 33 percent used it. Of the 35 with access to the telephone, 14 percent used it. Of the 38 who had access to all three forms of service, 13 percent used IRS.gov, 16 percent used face-to-face assistance, and 5 percent used telephone assistance.
On completing the mock tax scenario, participants completed a short questionnaire regarding their experiences with the scenario. One of the questions asked if participants used service and, if not, why not. As shown in Figure 1, of those who indicated they did not use service, 58 percent indi-cated it was because they did not need it.
Figure 1. Reasons Indicated for Not Using Service
Wait too long5%
Other6%
Did not indicate reason12%
Nothing available19%
Did not need help58%
Analysis of accuracy across the different service channels is not statis-tically valid due to the small number of people who used service. Therefore, service usage was collapsed across groups. Accuracy was measured as the absolute value of the error for four lines of the 2005 Form 1040: adjusted gross income (line 37), taxable income (line 43), tax (line 44) and total tax (line 63). The accuracy of participants who received service was then compared with those who did not receive service. Results are presented in Figure 2.
No significant differences at the p=.05 level were found for any of the four line item accuracy measures. The lack of significant differences is con-sistent with the large variability in errors as evidenced by the large standard deviations (standard deviations are presented in parentheses in Figure 2). Although the difference was not statistically significant, those who received service did have a lower average absolute error or higher accuracy on all four line items than those who did not receive service.
Lab Research on Customer Preferences 265
In addition to the average absolute error, error rates were also calculat-ed for the four line items. Error rates are the percentages of participants who incorrectly completed that line. Failure to enter anything on a specific line was coded as an error. No corrections were made to the tax forms; therefore, an error on an earlier line should cause an error on subsequent lines, and the error rate should increase over the Form 1040. As shown in Figure 3, the error rate of all participants for adjustable gross income is 51 percent and increases to 82 percent for taxable income.
Error rates and confidence intervals were computed for all participants, as well as for those who used service and those who did not. The results are presented in Figure 3. Due to the low number of people who used service and the resulting wide confidence intervals, lack of significant differences
Figure 2. Comparison of Accuracy as Measured by the Absolute Value of the Error
Did not use service Used service
Average Absolute Error (Standard Deviation) n
Average Absolute Error (Standard Deviation) n
Adjusted Gross Income
3,917.78(11,707.53) 132
3,388.06(9,355.70) 31
Taxable Income
7,723.43(10,246.41) 124
7,452.84(11,763.28) 31
Tax 1,579.24(2,208.61) 104
1,342.23(1,806.89) 21
Total Tax 4,766.77(11,683.25) 118
2,036.19(2,518.11) 27
Figure 3. Percentage and Confidence Intervals of Errors on Select Lines
Overall (n=169) Did not use service (n=137) Used service (n=32)
Point Estimate
Confidence Interval
Point Estimate
Confidence Interval
Point Estimate
Confidence Interval
Adjusted Gross
Income51% 44%-59% 49% 41%-57% 63% 46%-80%
Taxable Income 82% 76%-88% 83% 77%-89% 78% 64%-92%
Tax 81% 75%-87% 83% 77%-89% 75% 60%-90%
Total Tax 80% 74%-86% 80% 73%-87% 78% 64%-92%
Holland and Rasey266
cannot be meaningfully interpreted. Also due to the small sample size, these numbers cannot be inferred to the population.
After completing the tax scenarios, participants completed a debrief questionnaire. The debrief questionnaire asked participants to rate their confidence in the accuracy of the tax return they had just completed using an eight-point scale. Of the 137 who gave a confidence rating for their accura-cy, 64 percent rated their accuracy at six or above. The relationship between self-reported confidence in accuracy and the four line item measures of accu-racy was analyzed. Three of the line item accuracy measures indicate a sig-nificant negative correlation between self-reported accuracy and the average absolute error for adjusted gross income (r = -.22, p < .01), tax (r = -.27, p < .01), and total tax (r = -.26, p.<01). This negative correlation indicates that, as self-reported confidence increases, the average absolute error decreases. The correlation was not significant between self-reported confidence and the absolute value of the error for taxable income (r = -.13, p. = .10).
The accuracy of the telephone service and face-to-face service was defined as follows. It was considered accurate if the assistor completely an-swered the participant’s question, whether proper procedures were followed or not. For the telephone, it was expected that, with the time information, the name of the assistor, and the assistor’s badge number, W&I Research would be able to identify and score the telephone assistance. Unfortunately, there was some technical difficulty in identifying the correct telephone calls, mostly due to transfers, and assessment of the telephone assistance was not possible.
For face-to-face service, recordings were taken on hand-held digital recorders and scored for accuracy by a member of W&I Research. Scores were then reviewed by a second member of W&I Research. It was deter-mined that 100 percent of participants who received face-to-face service had their tax questions answered accurately and completely. As with telephone service, the accuracy scores do not indicate if proper procedures were fol-lowed or if the service provided was in scope. Accuracy for this study indi-cates that tax law questions were answered accurately and completely.
ConclusionsThis study resulted in several unexpected findings. These include the low incidence of service usage, 24 percent, and the low accuracy rate, about 20 percent. The results of the debrief questionnaire indicate that the low service usage rate was mostly the result of people thinking they did not need assis-tance, and the low service usage rate did not allow for accuracy comparisons between service channels. The accuracy rate is better, but not significantly,
Lab Research on Customer Preferences 267
for those who used service than for those who did not. The lack of signifi-cant differences in accuracy and the low service usage rate together prevent conclusions about the relationship between service and compliance.
The service usage of the different channels by those who had equal access to all three channels indicates the possibility of an interesting pattern, relatively equal opting for IRS.gov and face-to-face assistance and less for telephone assistance. If this pattern were to hold up in a larger sample with a higher service usage rate, it would provide useful operational information. Currently, we do not know and cannot tell if this pattern is representative of the population or is sample-specific.
Due to low service usage and technical difficulties in retrieving infor-mation for telephone calls, the meaningfulness of accuracy rates for assis-tors is questionable. Future research will need to address technical issues encountered with the phone service. It is also important to note that face-to-face assistors are aware of the research project and who is in the research project, whereas telephone assistors are not. Any differences in accuracy rates between telephone and face-to-face assistors may be an artifact of the research project.
The results of this study offer some suggestions for improving future research in this area. One suggestion for increasing the service usage rate is to make a portion of the honorarium based on accuracy. This should increase the participant’s motivation and more closely approximate real-life motivation levels. It is hoped that this incentive structure will discour-age participants who are simply participating for the money and increase the incidence of participants who are more intrinsically motivated, thereby increasing service usage and overall accuracy.
Another suggestion is to improve the quality of recruitment efforts. There is some evidence that a few of the participants in the current study were not recruited properly and failed to meet recruitment requirements. Specifically, some participants were not screened properly and we strongly suspect that others were aware of the recruitment requirements and lied in order to participate. While participants who were known to have been improperly recruited were dropped from the analyses, we do not know how many other participants were improperly recruited or who manipulated the recruitment system to participate when they were not truly qualified. There-fore, recruitment errors may have contributed to the overall low accuracy rate in the current study. For future studies, recruitment screening should be designed to decrease the ability of recruits to determine the reasons for ter-mination. Also, quality assurance screening should be conducted on recruit-ers to ensure that proper recruitment procedures are being followed.
Holland and Rasey268
Another suggestion for future studies is to change the tax prepara-tion requirement. For the current study, participants were required to have completed their own tax returns without the use of a tax professional or tax preparation software at least once in the last 5 years. This qualification was instituted because people process completely new information differently than they process familiar information. This is why participants were given tax scenarios similar to their own tax situations. How people use service when encountering a new tax situation is a topic for future research. Based on the low overall accuracy rate, as well as questions and statements made by participants while receiving service, and informal conversations between some participants and researchers, the once-in-five-year qualification may not have been stringent enough to ensure that people were familiar with completing their tax returns and the 1040 tax form. It is suggested that future research change the requirement to once in the last 3 years to increase familiarity with tax forms.
D7
Appendix
Conference Program List of Attendees
Conference Program 271
2007 IRS Research Conference ProgramJune 13-14, Georgetown University Law School
McDonough Hall, Hart Auditorium
DAY ONE : Wednesday, June 13
8:00-8:45 Registration
8:45-9:00 Welcome Janet McCubbin, Research, Analysis, and Statistics, Internal Revenue Service
9:00-9:30 Keynote Address James B. Mackie III, Director, Revenue Estimating Division, Office of Tax Analysis, U.S. Department of the Treasury
Moderator: Mark Mazur, Director of Research, Analysis, and Statistics, Internal Revenue Service
Panelists: Joel Slemrod, Professor and Director of the Office of Tax Policy Research, University of Michigan; Alan Plumley, Research, Analysis, and Statistics, Internal Revenue Service; and Nina Olson, National Taxpayer Advocate, Internal Revenue Service
10:45-11:05 BREAK
11:05-12:35 Tax Policy and Tax Compliance Moderator:
Peter Adelsheim, Small Business and Self-Employed Division, Internal Revenue Service
Conference Program272
Papers: Tax Simplification and Tax Compliance, Wojciech
Kopczuk, Columbia University Tax Rate Preferences: Understanding the Effects
of Perceived and Actual Current Tax Assessments, Peggy A. Hite, Indiana University; John Hasseldine, University of Nottingham; and Darius J. Fatemi, University of Denver
Charitable Contributions in a Voluntary Compliance Income Tax System: Itemized Deductions versus Matching Subsidies, Alex Turk and Maryamm Muzikir, Small Business and Self-Employed Division, Internal Revenue Service; Marsha Blumenthal, University of St. Thomas; and Laura Kalambokidis, University of Minnesota
Discussant: Michael Desmond, U.S. Department of the Treasury
12:35-2:00 Lunch
2:00-3:30 Tax Practitioners—Perspectives and Impact Moderator:
Caroline Trinkwalder, Small Business and Self-Employed Division, Internal Revenue Service
Papers: Evaluating Preparation Accuracy of Tax
Practitioners: A Bootstrap Approach, Michael F. Albert and Kim M. Bloomquist, Research, Analysis, and Statistics, and Ronald L. Edgerton, Wage and Investment Division, Internal Revenue Service
Impact of Taxpayer Representation on the Outcome of Earned Income Credit Audits, Jeff Wilson, Tom Beers, Amy Ibbotson, Mike Nestor, Mark Hutchens, Carol Hatch, and Mark Everett, Taxpayer Advocate Service, IRS Office of Research and Analysis
The Obstacles of Voluntary Compliance from the Taxpayer’s Perspective, Beanna J. Whitlock, National Society of Tax Professionals
Discussant: John Scholz, Florida State University
Conference Program 273
3:30-3:50 BREAK
3:50-5:20 Disentangling the Tax Gap Moderator: Kim M. Bloomquist, Research, Analysis, and Statistics,
Internal Revenue Service Papers: Models of Household Tax Underreporting and the
NRP Examination Process, Jonathan Feinstein, Yale School of Management, and Brian Erard, B. Erard & Associates
Book-Tax Consolidation Differences, Rates of Return and Capital Structure, William B. Trautman, Large and Mid-Size Business Division, Internal Revenue Service, and Petro Lisowsky, Boston University
NRP—Methods and Plans, Bob Brown and Drew Johns, Research, Analysis, and Statistics, Internal Revenue Service
Discussant: Eric Toder, Urban Institute
DAY TWO : Thursday, June 148:30-10:00 Compliance and Administrative Burdens Moderator:
Donald Evans, Tax Exempt and Government Entities Division, Internal Revenue Service
Papers: Doing Good: The Costs of Obtaining Tax-Exempt
Status in the United States, Marsha Blumenthal, University of St. Thomas, and Laura Kalambokidis, University of Minnesota
Aggregate Estimates of Small Business Taxpayer Compliance Burden, Donald DeLuca and Scott Stilmar, IBM Business Consulting; John Guyton and Wu-Lang Lee, Internal Revenue Service; and John O’Hare, Quantria Strategies, LLC
Tax Complexity and its Impact on Tax Compliance and Tax Administration, Margaret McKerchar, Australian School of Taxation
Discussant: Jane Gravelle, Congressional Research Service
Conference Program274
10:00-10:20 BREAK
10:20-11:50 Taxpayer Service—Preferences and Effects Moderator:
Joel Friedman, Wage and Investment Division, Internal Revenue Service
Papers: I’m from the IRS and I’m Here to Help You:
Taxpayer Services and Tax Compliance, James Alm, Georgia State University; Michael Jones, Bridgewater State College; and Michael McKee, University of Calgary
Taxpayer Preferences for Service and Filing, Ben Shackleford, Wage and Investment Division, Internal Revenue Service
Lab Research on Customer Preferences, Kathleen Holland and Howard Rasey, Wage and Investment Division, Internal Revenue Service
Discussant: Roman Meyerovich, Canada Revenue Agency
11:50-12:00 Closing Remarks Janice Hedemann, Research, Analysis, and Statistics, Internal Revenue Service
Jonathan AdamsEastport Analytics
Peter AdelsheimIRS, Small Business/Self-Employed
Michael AlbertIRS, Research, Analysis, and Statistics
Donald AlexanderAkin, Gump, Strauss, Hauer & Feld, LLP
Malcolm AllenAustralian Taxation Office
James AlmGeorgia State University
Joseph AnankaTreasury IG for Tax Administration
Kay AndersonIRS, Wage & Investment
Krystal ApelquistIRS, Taxpayer Advocate Service
Maureen AptowiczIRS, Small Business/Self-Employed
Marlene AquinoBooz Allen Hamilton, Inc.
Michael AyalaIRS, Wage & Investment
Blaine BarkleyIRS, Small Business/Self-Employed
Paul BastuscheckIRS, Research, Analysis, and Statistics
Helene BayderIRS, Small Business/Self-Employed
Dan BeckerleIRS, Wage & Investment
Tom BeersIRS, Taxpayer Advocate Service
Damon BellDepartment of Revenue, Oregon State
James BellefeuilleIRS, Tax Exempt & Government Entities
Preston BenoitTreasury IG for Tax Administration
Philip BeramU.S. Chamber of Commerce
Christy BergmanIBM Global Business Services
Ted BlackIRS, Research, Analysis, and Statistics
Kim BloomquistIRS, Research, Analysis, and Statistics
Conici BlountUniversity of St. Thomas
Marsha BlumenthalUniversity of St. Thomas
Lawrence BoatengIRS, Wage & Investment
Susan BoehmerIRS, Wage & Investment
List of AttendeesIRS Research Conference
Georgetown University Law CenterJune 13-14, 2007
List of Attendees276
Matthew BramanGovernment of the District of Columbia
Michael BrostekU.S. Government Accountability Office
Bob BrownIRS, Research, Analysis, and Statistics
Melanie BrysonIRS, Small Business/Self-Employed
Edward BrzezinskiIRS, Small Business/Self-Employed
Tania BuffoneCanada Revenue Agency
Earl BurneyTreasury IG for Tax Administration
Jeff ButlerIRS, Research Analysis, and Statistics
Dean CampbellBearingPoint, Inc.
Wanda CanadaIRS, Small Business/Self-Employed
Rafael Cantu-ReyesServicio de Administración Tributaria, Mexico
Robert CarpenterTreasury IG for Tax Administration
Stephen CaseyInland Revenue Department, New Zealand
Meichi ChanIRS, Wage & Investment
Winnie ChangSenate Budget Committee
Duanjie ChenUniversity of Toronto
Michelle ChuIRS, Research, Analysis, and Statistics
Sophia ChungEastport Analytics
Matt ClarkeDeloitte & Touche, LLP
James ClarksonIRS, Large & Mid-Size Business
Janice ColemanIRS, Research, Analysis, and Statistics
David ConnorsIBM Global Business Services
James CookU.S. Government Accountability Office
Candice CromlingIRS, National Public Liaison
Andrew CurryIRS, Tax Exempt & Government Entities
Kevin DalyU.S. Government Accountability Office
Charlie DanielU.S. Government Accountability Office