20
Brennan Hughey University of Wisconsin – Madison for the AMANDA Collaboration Recent Results From the AMANDA Experiment Rencontres du Vietnam August 6-11, 2004
1slide
Brennan HugheyUniversity of Wisconsin – Madison
for the AMANDA Collaboration
Recent Results From the AMANDA Experiment
Rencontres du Vietnam August 6-11, 2004
2slide
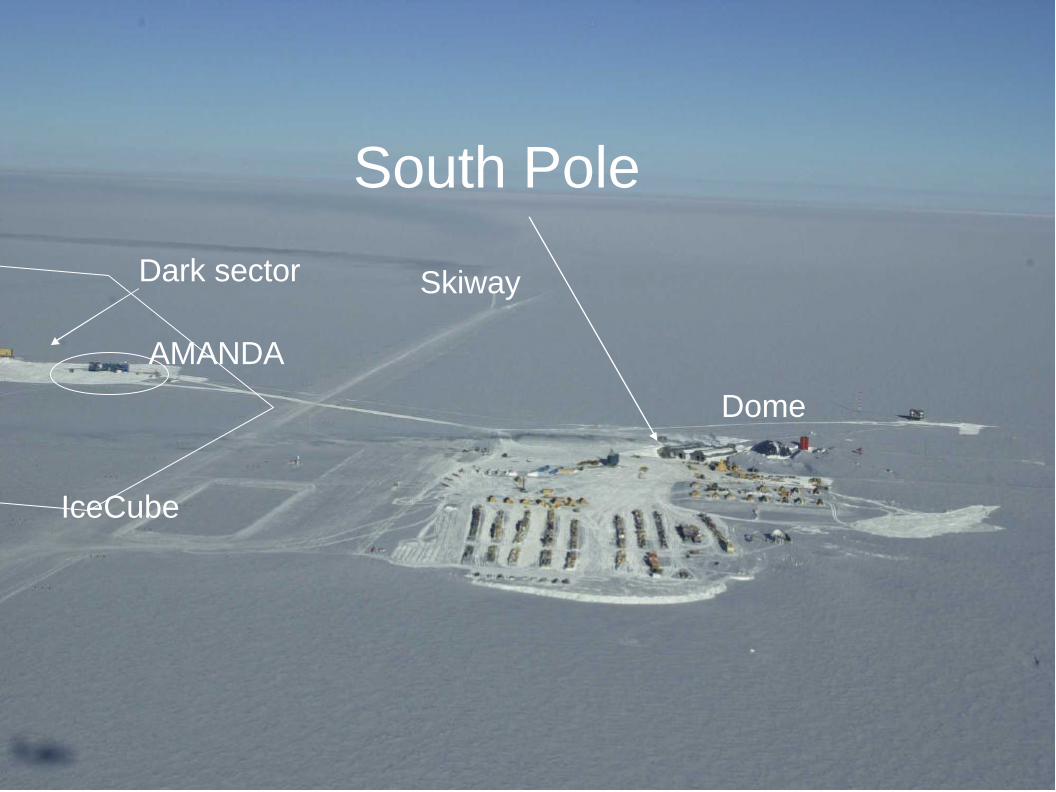
South Pole
Dark sector
AMANDA
IceCube
Dome
Skiway
3slide
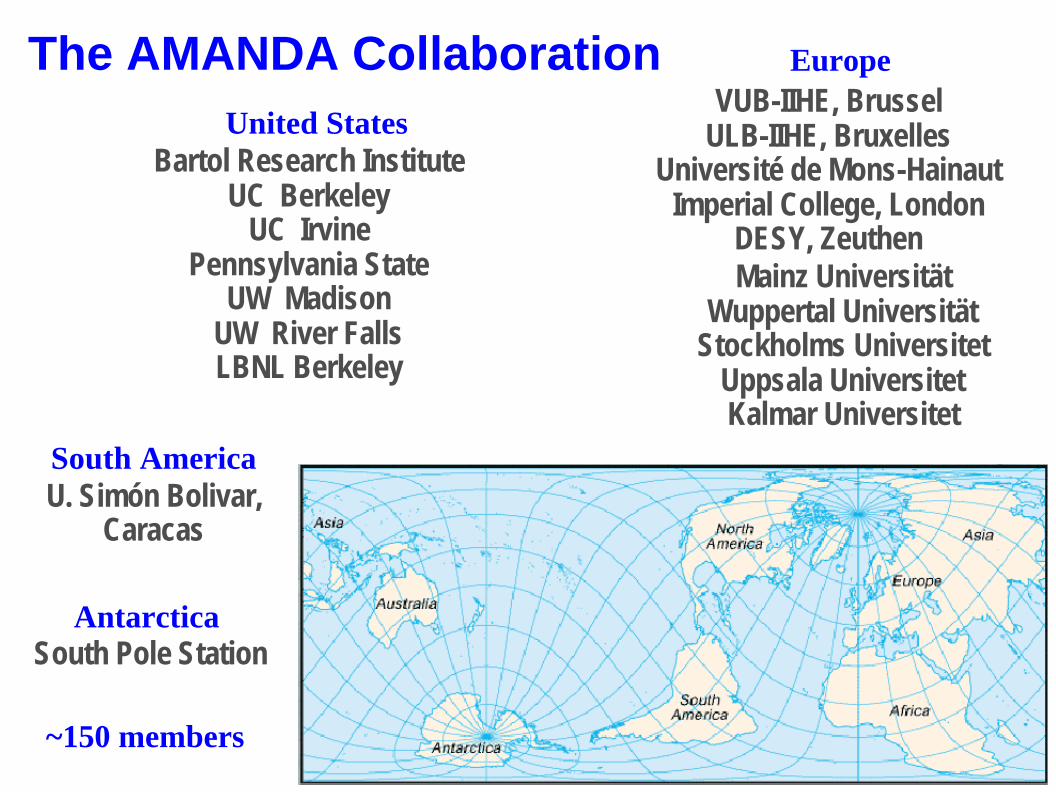
Bartol Research InstituteUC Berkeley
UC IrvinePennsylvania State
UW MadisonUW River FallsLBNL Berkeley
VUB-IIHE, BrusselULB-IIHE, Bruxelles
Université de Mons-HainautImperial College, London
DESY, ZeuthenMainz Universität
Wuppertal UniversitätStockholms Universitet
Uppsala UniversitetKalmar Universitet
U. Simón Bolivar, Caracas
United States
Europe
South America
The AMANDA Collaboration
~150 members
South Pole StationAntarctica
4slide
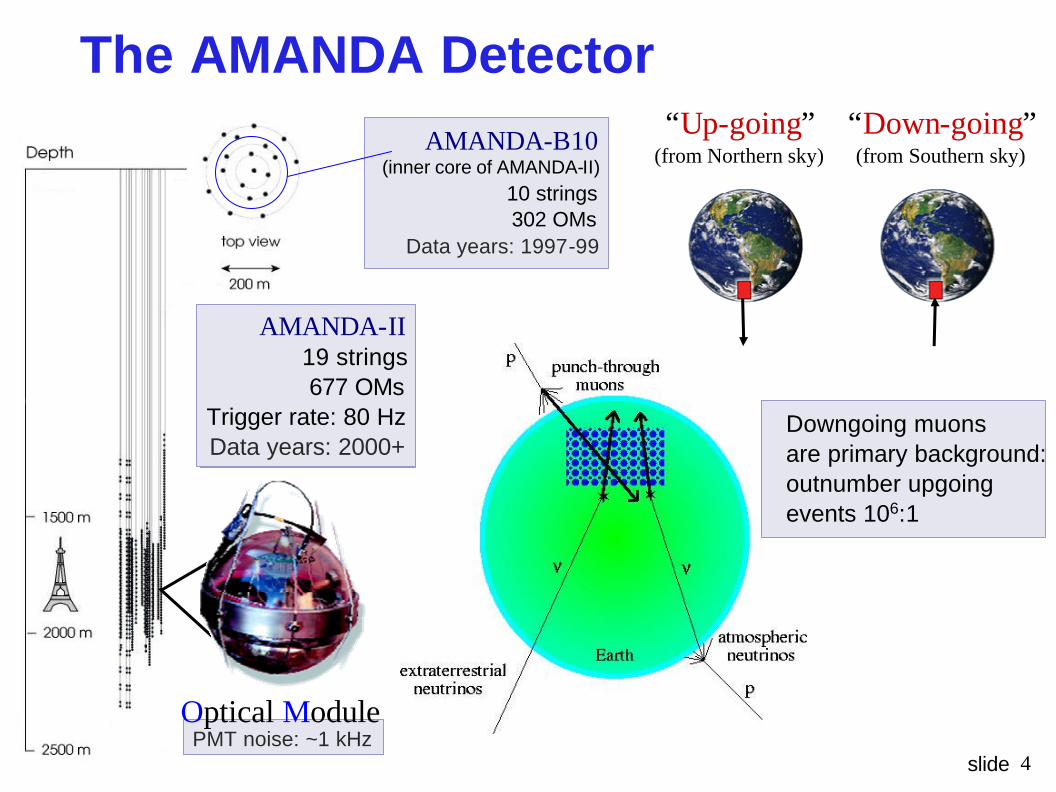
The AMANDA Detector
PMT noise: ~1 kHz
AMANDA-B10(inner core of AMANDA-II)
10 strings302 OMs
Data years: 1997-99
Optical Module
“Up-going”(from Northern sky)
“Down-going”(from Southern sky)
AMANDA-II19 strings677 OMs
Trigger rate: 80 HzData years: 2000+
Downgoing muonsare primary background:outnumber upgoingevents 106:1

5slide
Ice Properties
Absorption
Scattering
bubbles
ice
dust
dust South Pole ice:• Very transparent• Absorption length ~ 100 m at 400 nm• Scattering length ~ 20 m at 400 nm• Measured with in-situ light sources and
with atmospheric muons
Depth [m]
Depth [m]
Wavelength [nm]
Wavelength [nm]
Abs
orpt
ivity
[m
-1]
Eff
ectiv
e sc
atte
ring
coe
ffic
ient
[m-1
]
flat for ice (increases with temp.)
flat for bubbles
ice
bubbles
dust
dust
Absorption
Scattering

6slide
Reconstruction accuracies :
• Muons:– directional error: 2.0º - 2.5º
– σ[log10(E/TeV)] : 0.3 - 0.4– coverage: 2π
• Cascades:– directional error: 30º - 40º
– σ[log10(E/TeV)] : 0.1 - 0.2– coverage: 4π
• Primary cosmic rays (with SPASE-2):
– σ[log10(E/TeV)] : 0.07 - 0.1
muonchannel
cascadechannel
Event Reconstruction

7slide
AMANDA Topics
Primary Cosmic Ray Spectrum• atmospheric muons/neutrinos• Cosmic Ray composition (with SPASE-2 surface array)
Cosmic Ray origins (acceleration sites: AGN, GRBs)• extra-terrestrial flux at > TeV energies
Dark matter/ exotic particles• WIMP annihilation in the Sun/Earth• magnetic monopoles
Supernova monitor of the Milky Way• burst of low energy cascades leads to overall noise increase• AMANDA will join Super Nova Early Warning System (SNEWS) later this year
8slide
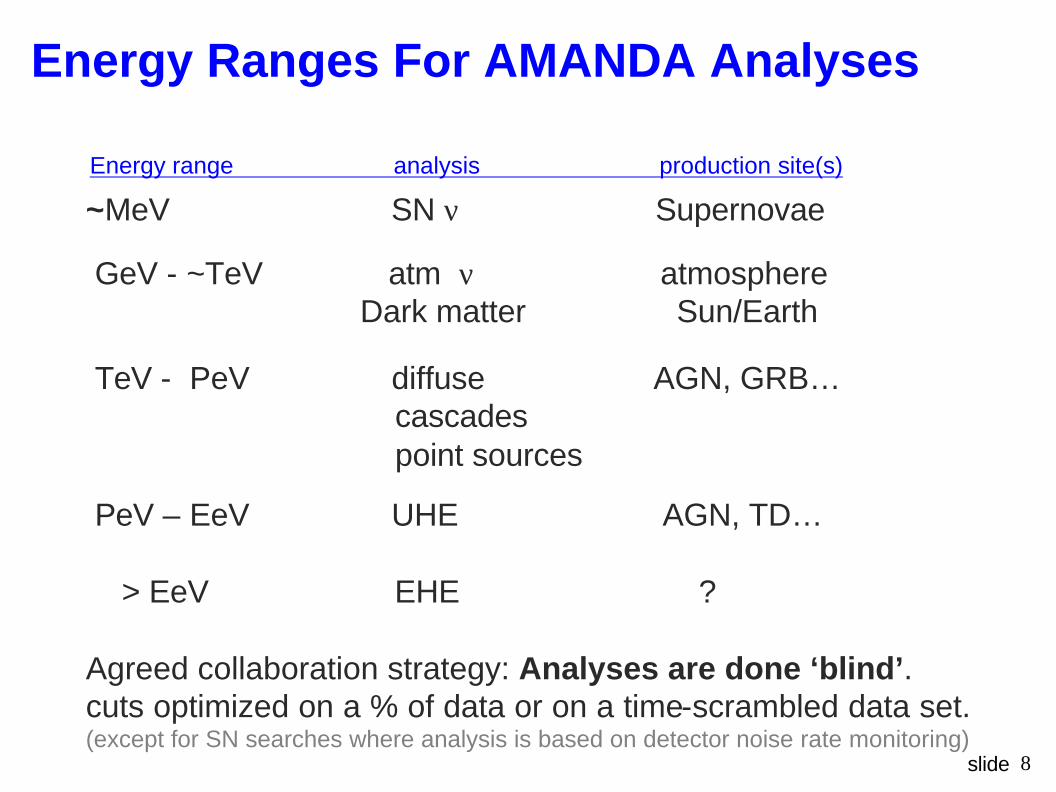
Energy range analysis production site(s)
~MeV SN ν Supernovae
GeV - ~TeV atm ν atmosphereDark matter Sun/Earth
TeV - PeV diffuse AGN, GRB…cascades point sources
PeV – EeV UHE AGN, TD…
> EeV EHE ?
Agreed collaboration strategy: Analyses are done ‘blind’. cuts optimized on a % of data or on a time-scrambled data set.(except for SN searches where analysis is based on detector noise rate monitoring)
Energy Ranges For AMANDA Analyses

9slide
E2Φνµ(E) < 2.87·10–7 GeV cm-2 s-1 sr-1
Atmospheric Neutrinos
Atmospheric spectrum provides testof detector
Matches lower energy Frejus data
Downgoing muon backgroundrejected using a neural network
First spectrum above 1 TeV
Used to set limit on extraterrestrial E-2 diffuse flux in the range 100-300 TeV
Includes 33% systematic uncertainty
1997 resultsPRL 90, 251101 (2003)
PreliminaryAMANDA 2000
10slide
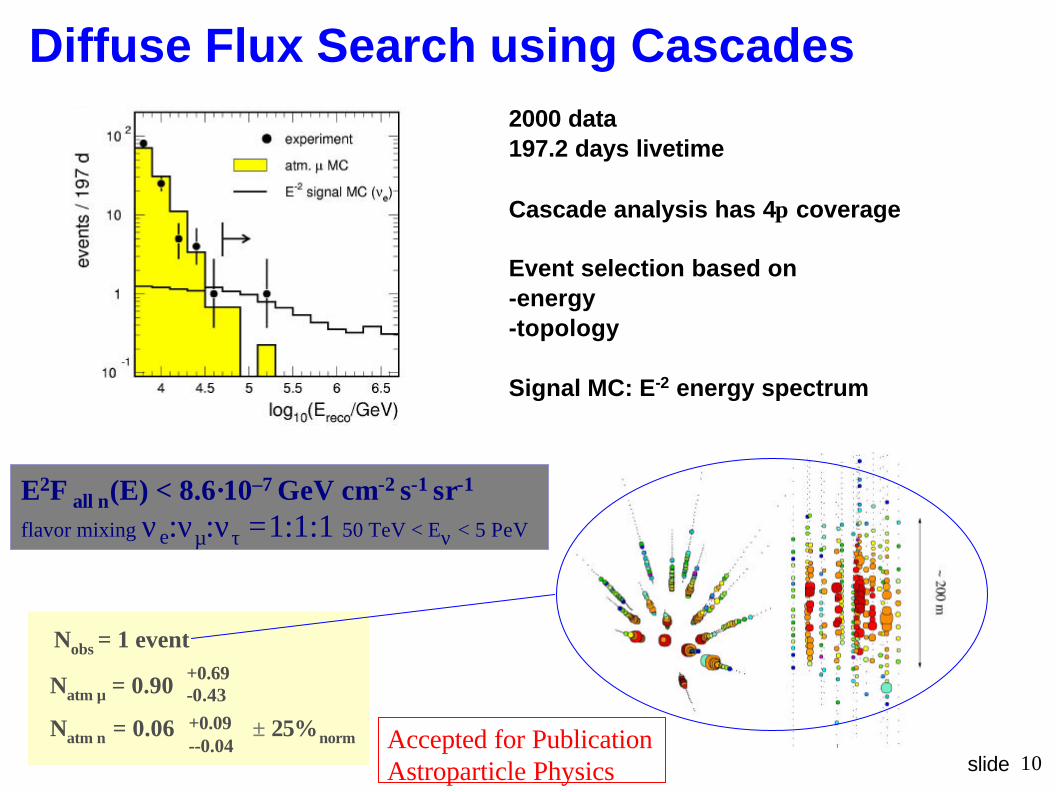
Nobs = 1 event
Natm µ = 0.90
Natm ν = 0.06 ± 25%norm+0.09-0.04
+0.69-0.43
2000 data197.2 days livetime
Cascade analysis has 4π coverage
Event selection based on-energy-topology
Signal MC: E-2 energy spectrum
Diffuse Flux Search using Cascades
Accepted for PublicationAstroparticle Physics
E2Φall ν(E) < 8.6·10–7 GeV cm-2 s-1 sr-1
flavor mixing νe:νµ:ντ =1:1:1 50 TeV < Eν < 5 PeV

11slide
Ultra-High Energy Search (PeV - EeV)
horizontalevents
averageall angles
neutrino effective area vs. energy
Earth opaque above 1016 eVLook at downgoing muons and events near horizon
Characteristics: few 1 p.e. Peakslong muon tracks and bright events
Paper in progress
E2 Φall ν(E) < 9.9⋅10-7 GeV cm-2 s-1
( νe:νµ:ντ = 1:1:1)
Nobs = 5 events
Nbgr = 4.6 ± 36% events
ν energy after cuts (from E-2)
12slide
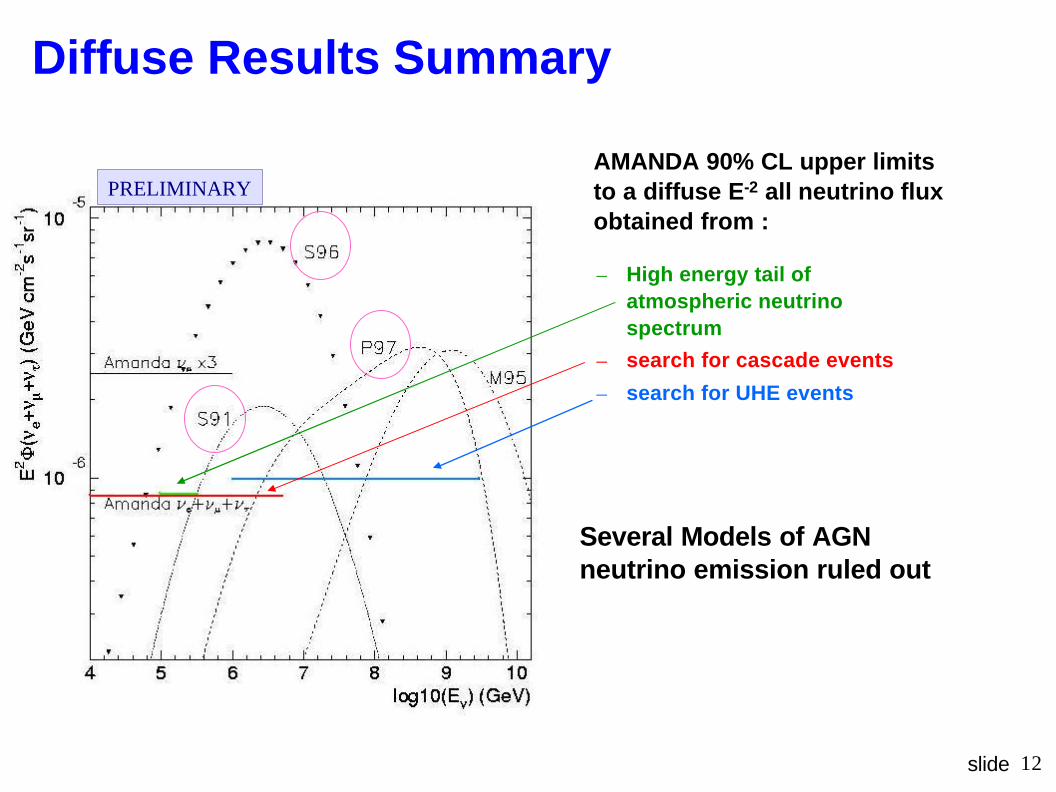
AMANDA 90% CL upper limits to a diffuse E-2 all neutrino flux obtained from :
– High energy tail of atmospheric neutrino spectrum
– search for cascade events
– search for UHE events
PRELIMINARY
Several Models of AGNneutrino emission ruled out
Diffuse Results Summary

13slide
Search for High Energy Point Sources
Search in sky for clustering of events :• Grid search : sky subdivided in 300
bins of ~ 7° x 7°• Shift grid to cover boundaries• Pointing resolution ~ 2.5 °• Optimized in each declination band• Optimized for E-2 and E-3 spectra
3369 events observed 3438 events expected background
PreliminaryAMANDA 2000-2003
Skymap in equatorial coordinates
No Excess observedresults consistent with atmos. background
x 10
-6G
eV-1
cm-2
s-1
sin(δ)

14slide
Neutrino Point Sources: Unbinned Analysis
PreliminaryAMANDA 2000-2003
Data scrambled in right ascension
Significance of local fluctuationscompared to expectationof all being atmosphericneutrinos
Max 3.4 sigma:consistent withbackground fluctuation
15slide
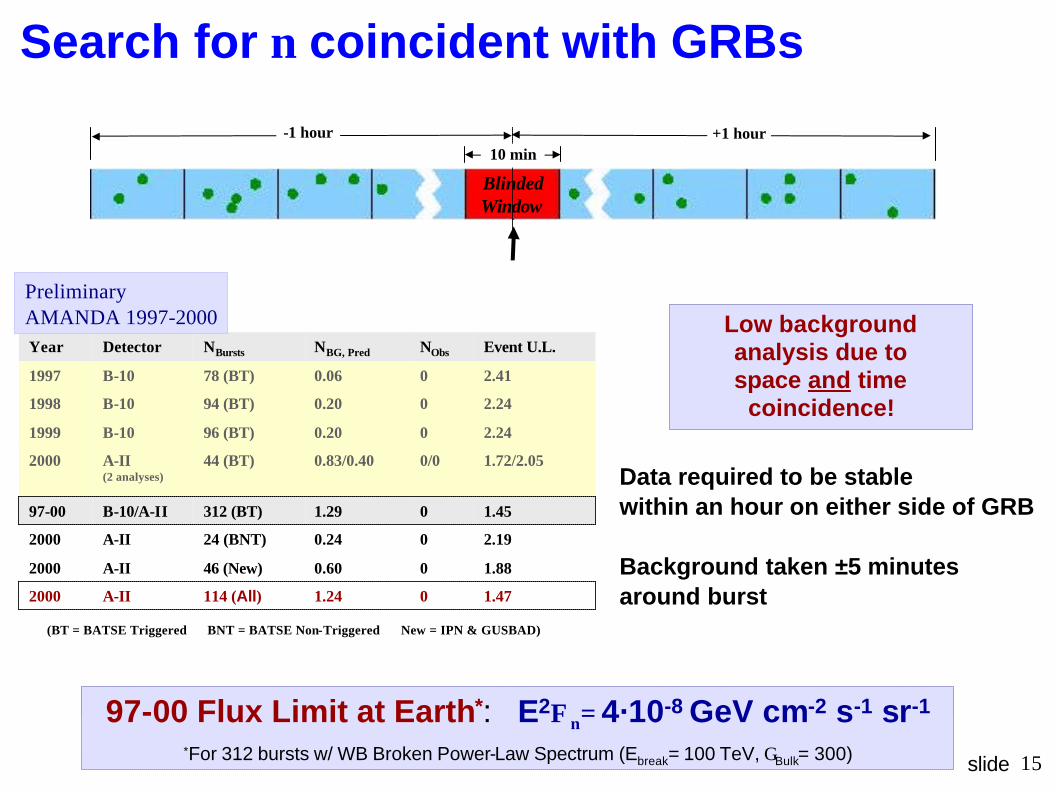
10 min
Blinded Window
-1 hour +1 hour
1.4501.29312 (BT)B-10/A-II97-00
1.8800.6046 (New)A-II2000
1.4701.24114 (All)A-II2000
2000
2000
1999
1998
1997
Year
A-II
A-II(2 analyses)
B-10
B-10
B-10
Detector
2.1900.2424 (BNT)
1.72/2.050/00.83/0.4044 (BT)
2.2400.2096 (BT)
2.2400.2094 (BT)
2.4100.0678 (BT)
Event U.L.NObsNBG, PredNBursts
(BT = BATSE Triggered BNT = BATSE Non-Triggered New = IPN & GUSBAD)
Search for ν coincident with GRBs
Low background analysis due to space and time
coincidence!
Data required to be stable within an hour on either side of GRB
Background taken ±5 minutes around burst
97-00 Flux Limit at Earth*: E2Φν= 4·10-8 GeV cm-2 s-1 sr-1
*For 312 bursts w/ WB Broken Power-Law Spectrum (Ebreak= 100 TeV, GBulk= 300)
PreliminaryAMANDA 1997-2000

16slide
Cascade Channel Rolling GRB Search2-step process:
1.) use Support Vector Machine to reject muon and atmospheric neutrino backgrounds using signal Monte Carlo based on assumption of 300 TeV break energy broken power law energy spectrum
2.) scan through entire data set looking for significant clumping of surviving events (“significant” defined as 99% unlikely to have a random poissonian fluctuation to
this level)
Complements satellite-coincident searches:more difficult background rejection due to lack of space-time constraints,but satellites miss many GRBs, especially since loss of BATSE in early 2000
17slide
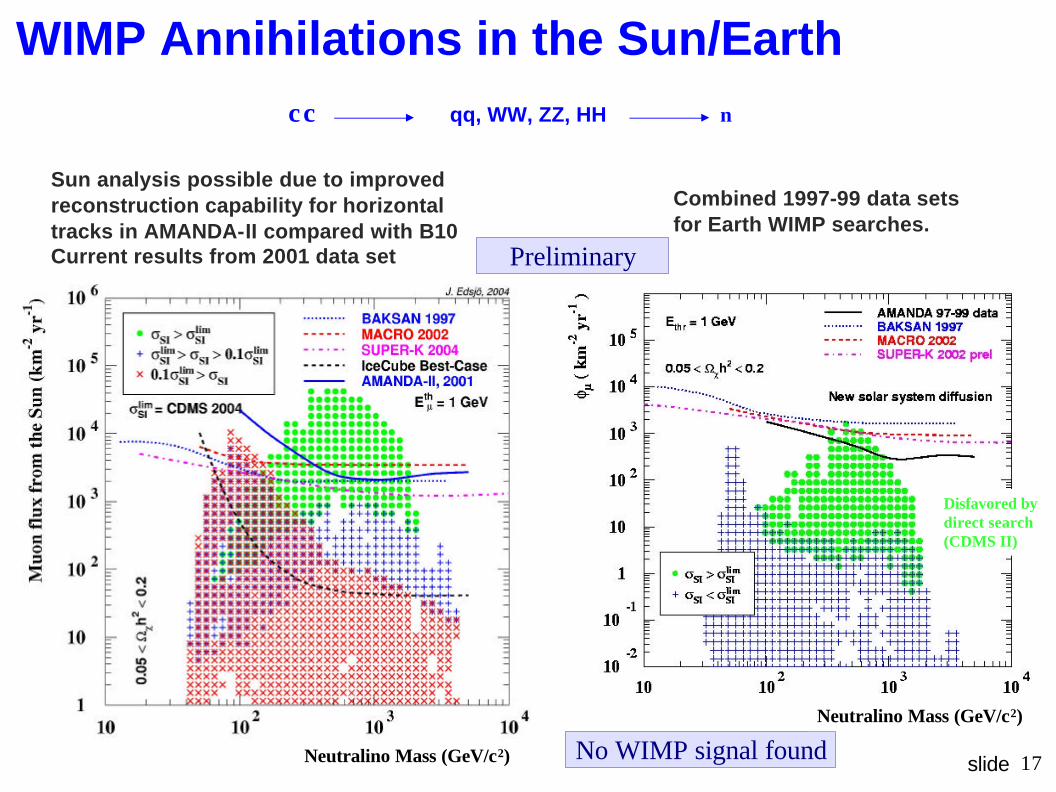
Sun analysis possible due to improvedreconstruction capability for horizontal tracks in AMANDA-II compared with B10Current results from 2001 data set
Combined 1997-99 data sets for Earth WIMP searches.
χχ qq, WW, ZZ, HH ν
2001 data
WIMP Annihilations in the Sun/Earth
Disfavored by direct search(CDMS II)
No WIMP signal found
Preliminary
Neutralino Mass (GeV/c2)
Neutralino Mass (GeV/c2)

18slide
Outlook
No extraterrestrial signals observed yet, but limits are tightening
First Results from AMANDA-II now published 2000 point source analysis in PRL 92 no. 7 (071102)
Multi-year papers and analyses in progress
Detector improvementsDigitized Waveform readout since 2003Understanding of ice properties reduces systematic errors
IceCube on horizon......
19slide
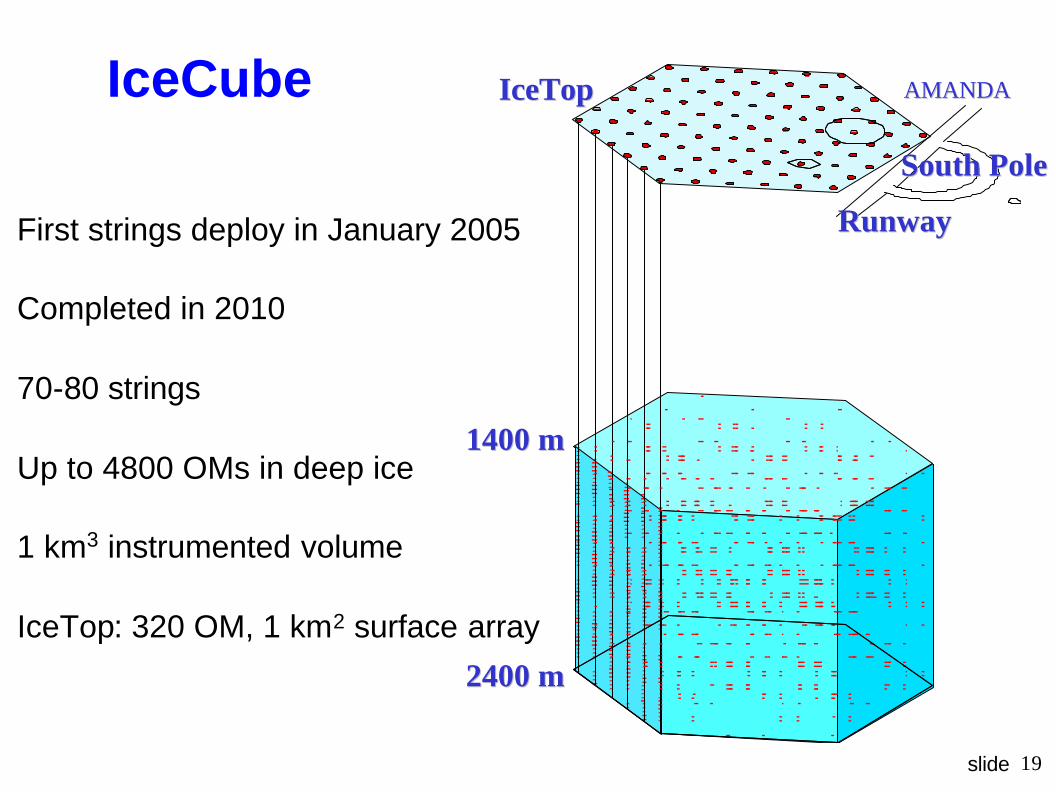
First strings deploy in January 2005
Completed in 2010
70-80 strings
Up to 4800 OMs in deep ice
1 km3 instrumented volume
IceTop: 320 OM, 1 km2 surface array
1400 m1400 m
2400 m2400 m
AMANDAAMANDA
South PoleSouth Pole
IceTopIceTop
RunwayRunway
IceCube

20slide
• Shown on diffuse limits summary plot
• S91 F.W. Stecker et al., Phys. Rev. Lett. 66 (1991)
2697 and Erratum-ibid. 69 (1992) 2738
• S96F.W. Stecker and M.H. Salamon, Space Sci. Rev.
75 (1996) 341
• P97R.J. Protheroe, arXiv: astro-ph/9607165
• M95K. Mannheim, Astropart. Phys. 3 (1995) 295


