SLAC-PUB-4821 DPNU-88-50 February 1989 P/E) RECENT RESULTS ON s = -3 BARYON SPECTROSCOPY FROM THE LASS SPECTROMETER* D. ASTON,~ N. AWAJI,~ a T. BIENZ,~ F. BIRD,~ J. D’AMoRE,~ W. DUNWOODIE,~ R. ENDORF,~ K. FUJII,~* H. HAYASHII,~~ S. IWATA,~~ W.B. JOHNSON,’ R. KAJIKAWA,~ P. KUNZ,~ D.W.G.S. LEITH,~ L. LEVINSON,~ d T. MATSUI,~’ B.T. MEADOWS,~ A. MIYAMOTO,~~ M. NUSSBAUM,~ H. OZAKI,~ C.O. PAK,~~ B.N. RA TCLIFF,~ D. SCHULTZ,~ S. SHAPIRO,~ T. SHIMOMURA,~~ P. K. SINERVO, lf A SUGIYAMA,~ S. SUZUKI,~ G. TARNOPOLSKY,~’ . T. TAUCHI,~* N. TOGE,~ K. UKAI,~ A. WAITE,~~ S. WILLIAMS~ ‘Stanford Linear Accelerator Center, Stanford University, Stanford, CA 94309 2Department of Physics, Nagoya University, Furo-cho, Chikusa-ku, Nagoya, Japan 3 University of Cincinnati, Cincinnati, OH 45,221 41nstitute for Nuclear Study, University of Tokyo, Midori-cho, Tanashi, Tokyo, Japan Invited talk by B.T. MEADOWS Presented at the SLAC 16th Summer Institute on Elementary Particle Physics, Stanford, California, July 17-28, 1988. * Work supported in part by the Department of Energy under contract No. DE-ACOS- 76SF00515; the National Science Foundation under grant Nos. PHY82-09144, PHY85- 13808, and the Japan U.S. Cooperative Research Project on High Energy Physics. Present Addresses : a Fujitsu Limited, Nakahara-ku, Kawasaki 211, Japan. b National Laboratory for High Energy Physics, KEK, Oho-machi, Tsukuba, Ibaraki 305, Japan. c Nara Women’s University, Kitauoya-nishi-machi, Nara-shi, Nara 630, Japan. d Weizmann Institute, Rehovot 76100, Israel. e Nippon BIO-RAD Laboratories, l-2-7 Shiba-Daimon, Minato-ku, Tokyo 105, Japan. f University of Pennsylvania, Philadelphia, Pennsylvania 19104, U.S.A. g Hewlett-Packard Laboratories, 1501 Page Mill Road, Palo Alto, California 94304, U.S.A. h Department of Physics, University of Victoria, Victoria BC, Canada V8W 2Y2
Transcript
SLAC-PUB-4821 DPNU-88-50 February 1989
P/E)
RECENT RESULTS ON s = -3 BARYON SPECTROSCOPY FROM THE LASS SPECTROMETER*
D. ASTON,~ N. AWAJI,~ a T. BIENZ,~ F. BIRD,~ J. D’AMoRE,~
W. DUNWOODIE,~ R. ENDORF,~ K. FUJII,~* H. HAYASHII,~~ S. IWATA,~~
W.B. JOHNSON,’ R. KAJIKAWA,~ P. KUNZ,~ D.W.G.S. LEITH,~ L. LEVINSON,~ d
T. MATSUI,~’ B.T. MEADOWS,~ A. MIYAMOTO,~~ M. NUSSBAUM,~ H. OZAKI,~
C.O. PAK,~~ B.N. RA TCLIFF,~ D. SCHULTZ,~ S. SHAPIRO,~ T. SHIMOMURA,~~
P. K. SINERVO, lf A SUGIYAMA,~ S. SUZUKI,~ G. TARNOPOLSKY,~’ .
T. TAUCHI,~* N. TOGE,~ K. UKAI,~ A. WAITE,~~ S. WILLIAMS~
‘Stanford Linear Accelerator Center, Stanford University, Stanford, CA 94309
2Department of Physics, Nagoya University, Furo-cho, Chikusa-ku, Nagoya, Japan 3 University of Cincinnati, Cincinnati, OH 45,221
41nstitute for Nuclear Study, University of Tokyo, Midori-cho, Tanashi, Tokyo, Japan
Invited talk by B.T. MEADOWS Presented at the SLAC 16th Summer Institute on Elementary Particle Physics,
Stanford, California, July 17-28, 1988.
* Work supported in part by the Department of Energy under contract No. DE-ACOS- 76SF00515; the National Science Foundation under grant Nos. PHY82-09144, PHY85- 13808, and the Japan U.S. Cooperative Research Project on High Energy Physics.
Present Addresses : a Fujitsu Limited, Nakahara-ku, Kawasaki 211, Japan. b National Laboratory for High Energy Physics, KEK, Oho-machi, Tsukuba, Ibaraki 305,
Japan. c Nara Women’s University, Kitauoya-nishi-machi, Nara-shi, Nara 630, Japan. d Weizmann Institute, Rehovot 76100, Israel. e Nippon BIO-RAD Laboratories, l-2-7 Shiba-Daimon, Minato-ku, Tokyo 105, Japan. f University of Pennsylvania, Philadelphia, Pennsylvania 19104, U.S.A. g Hewlett-Packard Laboratories, 1501 Page Mill Road, Palo Alto, California 94304, U.S.A. h Department of Physics, University of Victoria, Victoria BC, Canada V8W 2Y2
ABSTRACT
Data demonstrating the existence of two R*- resonances produced in K-p
interactions at 11 GeV/c in the LASS spectrometer are presented. The first state
is seen in the E*OK- decay channel with mass 2253 f 13 MeV/c2 and width
81 f 38 MeV/c2, and the second in the R-n+a- system with mass 2474 f 12
and width 72 f 33 MeV/c 2. Inclusive cross sections corresponding to these decays
corrected for unseen charge modes are estimated to be respectively 630 f 180 and
290 f 90 nb, respectively.
1. INTRODUCTION
Even though the R- hyperon was discovered more than two decades ago, data
showing the existence of any of its excited states have become available only very
recently!1-31 Such data have required the use of K- or hyperon beams in fixed
target experiments. They also require detectors with the acceptance and resolu-
tion necessary to deal efficiently with the complex topologies that events involving
such particles entail, the capability to perform good particle identification neces-
sary in the recognition of the relevant final states, and the ability to acquire and
process huge data samples. These qualities have been admirably matched by the
Large Aperture Superconducting Solenoid (LASS) spectrometer at SLAC. In this
paper, we present the data which were accumulated in a large exposure of the
LASS spectrometer to a beam of 11 GeV/cK-. These data clearly demonstrate
the existence of R*- resonances in two channels:
K-p -+ E-T+K- + anything
I 9
+ ll?r-
K-p + f12-7r’r- + anything
-+ AK-
(1)
(2)
2. THE EXPERIMENT
The LASS spectrometer is shown in Fig. 1. Full descriptions of the hardware,
triggering and data processing algorithms and other experimental details are given
in Ref. 4. Details associated with extraction of the Z:- and R- samples discussed
here are also given in Ref. 5.
The spectrometer was situated in an RF-separated beam of 11 GeV/c K- with
a K/K ratio of 70/l, tagged by beam Cherenkov counters. Important features of
LASS were its uniform acceptance over almost the full 47r solid angle, excellent
momentum and angular resolution, azimuthal symmetry, and good particle iden-
tification. Momentum measurement was accomplished with the superconducting
solenoid with 22.4 kG field in the beam direction, and with the 30 kG-m dipole
with vertical field. Low momentum particles were well-measured by the solenoid
vertex detector which was instrumented with proportional wire chambers (PWC’s)
having 200 pm spatial resolution. High momentum particles travelling close to
the beam axis were accurately measured in the dipole spectrometer.
Particle identification was accomplished by two threshold Cherenkov counters
(Cl and C2) and a time of flight (TOF) h o d oscope placed behind Cl at a distance
of five meters downstream from the target. The pulse heights measured in the
cylindrical PWC’s surrounding the target provided dE/dx information for low
momentum particles having wide recoil angles. This was useful in distinguishing
r/K/p hypotheses in the l/p2 region.
A very loose trigger required two or more charged particles to emerge from the
hydrogen target. For the channels of interest here this represented a completely
negligible bias.
The raw data sample contained N 113 million triggers, and the resulting use-
ful Ii’- beam flux corresponded to a sensitivity of 4.1 events/nb. After track
reconstruction, a sample of events consistent with the Z- + AT- or R- + AK-
decay topologies, illustrated in Fig. 2, was identified. A pair of oppositely-charged
tracks which met within a few mm in space was required to yield a pr’- effective
mass consistent with the nominal A mass. The A momentum vector was further
3
required to point back within a few mm of a negative track candidate which was .
chosen such that the effective mass formed with the A was compatible with either
of the above decay modes.
Finally, the composite track formed from this negative with the A was, in turn,
required to extrapolate back to within 1 cm of a primary vertex, whose position
was determined by a fit to the incoming beam and the primary charged-track
candidates. A sample of N 1.5 million events satisfying these requirements was
defined.
3. THE E:- K-r+ CHANNEL
A clean sample of Z:- events was readily extracted. Particle identification was
used to reject events inconsistent with a Z- interpretation, and also events with
identified protons at the primary vertex. Kinematic overlap between y and A
often occurred. Such misidentified y’s were removed from the remaining A sample
by eliminating events with A decay helicity cosine greater than 0.98. Finally, only
events with a E:- track length greater than 3 cm were retained. The resulting
AT- effective mass distribution shown in Fig. 3 exhibited a strong E:- signal.
Approximately 82,000 E:- events with a background of approximately 10% in the
mass range 1310 < IMA,- < 1332 MeV/c2 were selected for further study.
These events were then tested for existence of a I(-. Clearly, a negative track
produced in K-p induced E:- reactions was more likely to be a r- than a K-,
since the latter required production of an additional unit of strangeness. Clear
identification of the I<- was therefore necessary, and to this end negative tracks
entering the geometrically efficient regions of Cr or C2 at momenta above 2.9
GeV/c were required to give no light. To reduce background from poorly measured
rr -‘s below threshold, I<- candidates were also required to have momenta at least
two standard deviations above threshold.
Since I<- identification required a negative signature (no light) from the
Cherenkov counters, it was essential to obtain an accurate estimate of the “punch
through” contamination in the I<- sample produced by r-‘s (or em’s) failing to
produce light due to Cherenkov inefficiency. This estimate was derived from the
4
particles which did give Cherenkov light. The momentum distributions for neg-
ative particles from primary vertices of events in the Z- sample were examined,
and are shown in Fig. 4. These distributions were weighted, on a particle-by-
particle basis, by factors depending upon the Cherenkov efficiencies (E), which in
turn depended upon the particle momentum and hit position. The points on the
dotted curve corresponded to particles which produced light in at least one C,
and were weighted by the factor E- ‘. This distribution was taken to represent the
z-- (and e-) sample. The threshold near 2.6 GeV/c was clearly seen, and events
below this were presumed to be due to e-. Also in Fig. 4 (points on the solid
line) was the distribution representing those particles which gave no light in either
C!r or C2. This was corrected for efficiency by taking the difference between the
momentum distribution for all negative particles (whether giving light or not) and
the distribution described above. The sharp fall with increasing momentum near
threshold arose because the efficiency increased in this region. Above threshold,
this could be taken to represent the.K- momentum distribution. The points on
the dashed curve resulted from plotting the momenta of the negative particles
giving light, weighted by the factor 6-l (1 - E). Th’ 1s curve represented, therefore,
the punch-through contamination. Comparing this with the I<- distribution, it
was clear that above the 2.9 GeV/c cut, a rather clean I(- sample was separated.
In this way, a sample of 814 events was extracted, yielding 1,259 ?K-.R+
mass combinations shown in the distribution in Fig. 5. No clear resonant structure
was seen in this S = -3 baryon system. However, the mass distribution for
the E-r+ subsystems (Fig. 6) showed a strong 2*“(1530) signal. Selection of
an enriched E*O(1530) sample (1510 < ME-Xt < 1555 MeV/c2) resulted in the
Z-Ii’-7r+ ma ss histogram of Fig. 7. A clear signal (- 4 standard deviations) at
a mass of approximately 2250 MeV/ c2 was apparent, and could be interpreted to
correspond to the decay of an R*- to Z*0(1530)K-.
An estimate of the behavior of the non-resonant background beneath the Z*O
peak in Fig. 6 was made using the events in the sideband regions defined by
(ME-,+ < 1510 or 1555 < ME-Xt < 1600 MeV/c2). The Yli’-;rr+ mass distri-
bution for these events, normalized to the number of events under the 2*“(1530)
5
-
signal was plotted in Fig. 7 with solid dots. The striking absence of any peak near
2250 MeV/c2 was a clear indication that the observed structure was associated
purely with Z*O(1530).
In order to investigate the possibility that the effect arose from 7r-‘s being
misidentified as a result of Cherenkov inefficiency, a study was made using events
which were selected exactly as above, except that the “I(-” tracks were required to
give light in either Cl or C2. All momentum requirements were as before, and the
tracks were still assigned a I<- mass. The Z*“(153O)“K-” mass distribution that
resulted (Fig. S), contrasted with the true I(- distribution, showing no structure
suggestive of a peak in the 2250 MeV/ c2 region. In addition to demonstrating that
the peak was not due to misidentified pions, this also showed that it was not a
kinematic effect due to the acceptance limitations placed upon the negative track
by the Cherenkov identification requirement. An estimate of the mass distribution
corresponding to punch-through was also obtained from these “K-” events by
plotting them, each weighted by a factor (1 - c)/e (where c was the rr- Cherenkov
efficiency). This distribution, indicated by open dots in Fig. 7, showed that such
punch-through contributed negligibly to the signal.
The significance of the R*- signal was estimated from the background sub-
tracted S*“(1530)11’- spectrum in Fig. 9. This was. obtained from the data of
Fig. 7 by subtraction of the Z*O sideband distribution (black dots) representing
the non-E*’ background from the data in the histogram.
The solid curve of Fig. 9 was the result of a fit to the data using the expression:
dN Cl dM=q
(M,2 - M2)2 + M,‘fr2 + ~2 + c3M 1
with I’=Ia($)(z) ,
where MO and I’0 were the R*- mass and width, respectively; q (qo) was the I<-
momentum in the rest frame of a Z*IC- system of mass M(Mo); and the c; were
fit parameters. The fit, which resulted in a x2 of 8.5 for nine degrees of freedom,
6
. yielded R*- parameter values:
-
MO = 2253 f 13 MeV/c2
r. = 81 f 38 MeV,c2 ’
and a corresponding signal of 41.2 f 10.2 events (- 4.1 standard deviations). The
dotted curve represented the non-resonant background, and appeared to agree well
in magnitude and shape with the corresponding r- punch-through distribution.
4. THE a-lr+r- CHANNEL
The inclusive production cross section of R- was only - 3% of that for Z[61
and the decay length was approximately three times smaller. These facts made
the separation of the R- events in reaction (2) somewhat less straightforward
than the selection of the Z- sample discussed above. All events considered as
n2- candidates were therefore processed through a fitting procedure which was
designed to achieve the improvement in resolution of vertex positions necessary to
distinguish between those relatively rare events with genuine R- topologies and
the more plentiful ones in which the A originated directly from the nearby primary
vertex. In this procedure, measured coordinates for an event were matched to an
R- topological template in which constraints in S-momentum conservation at
each decay vertex and in A mass were built in. The x2 quality of this fit, and
the information it provided on both the R- track length and its uncertainty were
required to match criteria which, when added to a set of requirements similar to
those used to define the Z:- sample, made it possible to identify a clean R- signal
which was seen in the AK- mass plot of Fig. 10. A total of about 600 f12- were in
the peak. In all, approximately 350 R- events, each with at least one f charged
track combination, were seen above N 9% background within f 10 MeV/c2 of the
W mass, and were considered as candidates for reaction (2).
The WT+R-- effective mass distribution, shown in Fig. 11(a), showed evidence
for a strong signal at - 2470 MeV/ c2. In making this plot, all combinations of
f track pairs were included, as long as they were not inconsistent with a pion
identity with respect to the various particle identification devices. An estimate of
7
the background under this peak was obtained from the wrong sign combinations
R-r*7r*. These were plotted in Fig. 11(a) normalized to the sample outside the
peak region by a linear mass factor and indicate that the peak was more than five
standard deviations above this background.
An obvious problem in these events was that, because of strangeness conser-
vation, the existence of the R- implied that the positive track was likely to be
a K+. The strong possibility existed, therefore, that the peak could be due to
production of a Z*- decaying to R-K+r-. To investigate this possibility, the
combinations in Fig. 11(a) were also plotted with a Ii’+ mass assigned to the posi-
tive track. This R-li’+7r- mass distribution, shown in Fig. 11(b), had no evidence
for a peak, indicating that the E*- interpretation was not correct. Other mass
hypotheses such as SZ-e+e-, R-K+K- were also studied, and failed to show any
significant peak structure, further suggesting that the signal was due to f12-7r+7r-
combinations.
In order to establish that the peak at 2470 MeV/c2 corresponded to an S = -3
baryon system, it was essential to associate it with those events in which some
evidence of the identity of the r+ existed. The dotted distribution in Fig. 11(a)
contained events for which Cherenkov identification of 7r+ was possible and showed
clearly that such information was of rather limited use. This contrasted with the
R*-(2250) ‘t t’ ”
sl ua ion in which the Cherenkov counters gave important information
on an event-by-event basis of I(- identification. It was found, however, that for a
significant number of positive particles in reaction (2), information from either the
dE/dx or time-of-flight (TOF) d evices was available, and some K/T separation
was possible. The momentum spectra of these particles was such that though
discrimination between K and 7r interpretations for individual events was possible
in only a few cases, a statistical analysis did provide effective distinction.
Clean samples of K* and r* were selected with which to study the behaviour
of both dE/dx and TOF devices at various momenta. In Fig. 12, the AK- mass
distribution from the tightly constrained reaction
K-p + AK--K+
8
-
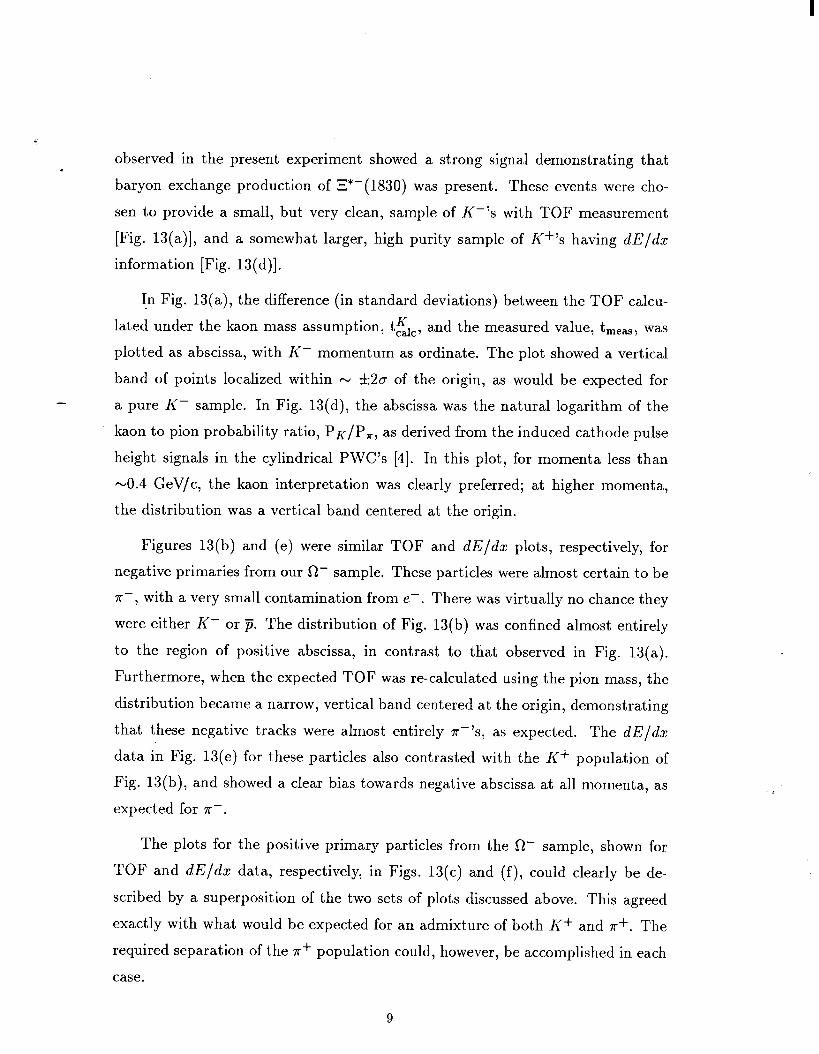
observed in the present experiment showed a strong signal demonstrating that
baryon exchange production of Z*-(1830) was present. These events were cho-
sen to provide a small, but very clean, sample of I<-‘s with TOF measurement
[Fig. 13(a)], and a somewhat larger, high purity sample of K+‘s having dE/dz
information [Fig. 13(d)].
In Fig. 13(a), th e 1 d’ff erence (in standard deviations) between the TOF calcu-
lated under the kaon mass assumption, tFd,, and the measured value, t,,,,, was
plotted as abscissa, with I<- momentum as ordinate. The plot showed a vertical
band of points localized within N f2a of the origin, as would be expected for
a pure I(- sample. In Fig. 13(d), th e a b scissa was the natural logarithm of the
kaon to pion probability ratio, PK/P,, as derived from the induced cathode pulse
height signals in the cylindrical PWC’s [4]. In this plot, for momenta less than
-0.4 GeV/c, the kaon interpretation was clearly preferred; at higher momenta,
the distribution was a vertical band centered at the origin.
Figures 13(b) and (e) were similar TOF and dE/dz plots, respectively, for
negative primaries from our 52- sample. These particles were almost certain to be
r-7 with a very small contamination from e-. There was virtually no chance they
were either I(- or ji. The distribution of Fig. 13(b) was confined almost entirely
to the region of positive abscissa, in contrast to that observed in Fig. 13(a).
Furthermore, when the expected TOF was re-calculated using the pion mass, the
distribution became a narrow, vertical band centered at the origin, demonstrating
that these negative tracks were almost entirely r-‘s, as expected. The dE/dz
data in Fig. 13(e) for th ese particles also contrasted with the K+ population of
Fig. 13(b), and showed a clear bias towards negative abscissa at all momenta, as
expected for r-.
The plots for the positive primary particles from the R- sample, shown for
TOF and dE/dx data, respectively, in Figs. 13(c) and (f), could clearly be de-
scribed by a superposition of the two sets of plots discussed above. This agreed
exactly with what would be expected for an admixture of both I<+ and r+. The
required separation of the K+ population could, however, be accomplished in each
case.
9
-
It was clear from Figs. 13(a) and (b) that the sample having positive abscissa
in Fig. 13(c) should contain almost all of the 7r +‘s together with approximately half
the K+‘s, whereas that with negative abscissa should also contain approximately
half the K+‘s but only a small fraction of the r+‘s. In Fig. 14(a), the R-7r+n-
masses were plotted separately for combinations containing r+‘s from the above
two samples. The solid histogram corresponded to those R-r+r- combinations
for which the positive track was predominantly 7r+, and indicated a signal similar
in position, shape and significance to that of Fig. 11(a). The dashed histogram,
constructed from positive tracks from the left side of Fig. 13(c) showed no evi-
dence of a signal. This showed that the signal was associated with genuine x+r-
pairs. Furthermore, in the difference between the solid and dashed histograms of
Fig. 14(a), the contribution from misidentified K+‘s should cancel, within statis-
tics, thereby yielding a “net TOF-identified r +” distribution. This distribution
also constituted one contribution to the histogram of Fig. 14(b).
A second contribution to Fig. 14(b) was obtained by following a similar pro-
cedure with regard to the dE/dx distributions. It was clear from Figs. 13(d) and
(e) that the positive particles in Fig. 13(f) could be split into a sample which
was predominantly K+ in the region with momenta below 0.4 GeV/c and posi-
tive abscissae, and the remaining sample which was predominantly made up from
7r+. In the latter sample, the K+ contamination would be distributed approxi-
mately symmetrically about the ordinate axis. Subtraction of the distribution of
f12-r+r- mass combinations formed with positive tracks in this sample with pos-
itive abcsissae from the corresponding distribution with negative abscissae could,
therefore be taken to represent the “net 7r +” distribution. This was found to con-
tain a signal with 10 more events in the 2470 MeV,c2 region, and was added into
Fig. 14(b) g’ * g rvm an aggregate signal which contained approximately 60% of that
in Fig. 11(a). Th e remaining 40% of the signal came from combinations in which
the positive track missed both the TOF and dE/dx systems. No combinations
were found in which both TOF and dE/dx identification of the 7r+ was made.
In addition to establishing the identity of the n+, the R*- hypothesis for the
peakin Fig. ll( a a so required that the system had isospin (I = 0). This, in turn, ) 1
10
required that the 7r+r- also be in an 1= 0 state. The effective mass distributions
lMr+x- in Fig. 15 indicated a broad, structureless form concentrated at low mass
values for events in the R-r+r- peak region [Fig. 15(b)] as well as in the low
and high side bands (Figs. 15(a) and 15(c), respectively). In particular, no clear
evidence for p” (I = 1) was seen.
A large Monte Carlo sample of events corresponding to production of an
R-r+r- system in this mass range was generated, with the simulated dipion
system in an s-wave. Recoil mass and transverse momentum distributions of
the fi2-7r+r- systems were produced to simulate the data as closely as possible.
These events were then subjected to the identical analysis to the data, and curves
indicating the dipion mass shapes were drawn, suitably normalised upon the dis-
tributions in Fig. 15. This s-wave behaviour clearly described the data well,
indicating therefore a predominance of I = 0 in the f12-n+7r- peak region, and
providing further evidence of R*- production.
A fit to the R-7r+n- mass distribution in Fig. 11(a), similar to that for the
E*“K- plot, led to a mass of 2474 f 12 MeV/c2 and a width of 72 f 33 MeV/c2
for this 52*-. This is shown in Fig. 16. The acceptance of LASS was computed
using the Monte Carlo event sample discussed above, and the cross section for
inclusive production of R*-(2470) f rom 11 GeV,c K-p interactions with decay to
fl-~+n- corrected for unseen charge modes was determined to be 290 f 90 nb.
A similar computation was made to determine the cross section for production
of the R*-(2250) with decay to E*‘(1530)K-, 1 a so corrected for unseen charge
modes. The result was 630 f 180 nb.
5. DISCUSSION
Evidence for R*- production has been reported in only one other experiment.
Using a charged hyperon beam from the CERN SPS, WA42 observed a significant
signal at 2251 MeV/ c2 and a further, less compelling signal at 2384 MeV/c”, both
in Z-K-r+ systems from 116 GeV/c =:-Be collisions!’ In the same experiment
no clear evidence for structure in the fi2-7r+7r- system was I71 A seen. comparison
of data between the two experiments is given in Table I below.
11
-
Reaction K-p @ 11 GeV/c Z-Be @ 116 GeV/c
State 1:
MO ( MeV/c2) 2253 f 13 2251 f 12
r. ( MeV/c2) 81 f 38 48 f 20
Events in signal 44 fll 78 f 23
Decay modes =*O(153o)K- ~*Oq~-~(-r+
dominant. = 0.7 f 0.2 ~-I(-r+/E*o&y
< 0.2(9O%c.Z.)
State 2:
MO ( MeV/c2) 2474 f 12 not observed
r. ( MeV/c2) 72 f 33 7,
Events in signal 52 f 10 7,
Decay modes observed R-r+r- >0.075 ,7
State 3:
MO ( MeV/c2) not observed 2384 f 12
r. ( MeV/c2) 1, 26 f 23
Events in signal 7, 45 f 10
Decay modes observed 7, ~-I(‘“/~-I(-T+
= 0.5 f 0.3
m making comparisons between the two experiments, we note that in addition T
to considerable differences in acceptance, the very different nature of K-p and
Z-Be production mechanisms forces us to conclude that no conflict exists with
respect to signals observed. In particular, the R*-(2470) observed as a five stan-
dard deviation effect in LASS, but not in WA42, could be explained as a difference
in observable cross section. A similar conclusion might be made for the signal in
Table I. Summary of R*- data.
LASS El35 SPS WA42
12
. E:-K*“(890) seen by WA42 and not LASS.
Evidence for at least one state near 2250 MeV/c2 appears to be very solid.
Both El35 and WA42 observed signals with similar mass and width values, and
in both cases a significant =*“(153O)K- d eta mode was evident. However, it is y
somewhat speculative to equate the states seen, since:
l The two experiments differ somewhat in estimated three body Z-K-7r+
decay rates;
l Neither experiment was able to identify the Jp of states observed since
both were subject to acceptance and statistical limitations imposed by Ii’-
identification criteria;
and finally
l Several states near this mass are expected in the Z*“(1530)K- decay mode.
Predictions for excited R- states exist. Most obviously, the known A and C
baryon spectra have led to the expectation of several such states. For example,
pairing up the six best established A’s with C states having the same spin-parities
and using the Gell-Mann-Okubo equal spacing rule, leads to $12- baryons, at:
- 2000 f 100(MeV/c2) (l/2-)
- 2200 f 50(MeV/c2) (7/2+, l/2-)
N 2400 f 100(MeV/c2) (l/2+, 5/2+, 3/2-) .
A calculation using a Q-Q interquark potential A+Br’-’ with A and B derived
from the meson spectrum has been made by J. M. Richard!’ By including spin-
spin forces, he computed, in addition to the ground state (3/2+) R- at 1672
MeV/c2, the expectation of radially excited R- states at:
2244 (MeV/c2)
2358 ( MeV/c2) P/2+)
(l/2+, 3/2+, 5/2+) .
The most detailed prediction of the R- spectrum, and of the expected decay
rates was made by Chao, Isgur and Karl (CIK).[” This model included elements
13
of QCD and confinement in describing flavor-independent q - q forces in a simple
harmonic oscillator potential. Parameters in the model were determined from
other sectors of the baryon spectrum and decay rates. Orbitally excited states
with masses above 2100 MeV/c2 were predicted at:
2020 ( MeV/c2) (W-7 3/2-)
2225 ( MeV/c2) P/2+)
2265 ( MeV/c2) (3/2+,5/a+) .
However, no radial excitations were calculated.
It is interesting to observe that the two states at 2265 MeV/c2 were predicted
to have predominant decay to Z*O(1530)11’-. Obviously, without measuring Jp,
however, spectroscopic assignment of the signals seen in this system in both the
LASS and WA42 experiments is not possible.
The 0*-(2470) h as a mass above the range computed in Ref. 9. This fact
alone suggests it is a radial excitation. Further evidence supporting such interpre-
tation might be found in the large 0-r + - x decay mode observed, and the lack
of any evidence for a two-body decay, for instance, to Z*OK- or ZI(*O. The
decay branching ratio to R-na appears to be at least 7.5%. The cross section we
observed, corrected for the unseen f12-7r07ro, was 290 nb; while the inclusive cross
section for f12- production at this energy was 3.9f0.6 &I A large decay to dipion
states has been a recognized characteristic of radially excited states in both Ir’*
and quarkonium systems. The suppression of two-body decays relative to such
modes is expected, under certain circumstances, on the basis of the dynamics of WI radially excited quark systems.
The lowest f12- excitations expected have masses below 1900 MeV/c2, and have
yet to be observed. Within the framework of the CIK model, they are expected
to decay mostly to E-K0 or E” Ii’-. For states below 1808 MeV/c2, decay to R-y
would be most likely. None of these modes is easily accessible to either LASS or
to WA42.
14
SUMMARY
Excited R- states at 2250 and 2470 MeV/c2 have been seen in LASS. The
former state may also have been seen in experiment WA42 in an entirely different
production reaction. Some evidence exists that R*-(2470) is a radial excitation.
This state was not seen in WA42. No evidence for R*-(2380) reported by the
WA42 collaboration has been seen in LASS data. The experimental situation is
not yet completely satisfactory. In particular, the lowest R- excitations have not
yet been observed since statistically significant samples of events containing Z??
and s2-y systems (the expected decay modes) have been too difficult to accu-
mulate. Also, more data are still required to corroborate evidence for 0*-(2470)
and R*-(2380), and to make Jp measurements necessary in making spectroscopic
assignments. Nonetheless, almost 30 years after the discovery of the R-, the data
presented here have been able to show clearly that excited R- states do indeed
exist.
REFERENCES 1. D. Aston et al., contributed talk given by B. Ratcliff in session PO9 at
the International Europhysics Conference on High Energy Physics, Bari, Italy, July 1985; see S. Cooper, Rapporteur Talk in the Proceedings of this Conference, p. 947, and SLAC-PUB-3819.
2. S. F. Biagi et al., Zeits. Fur Physik, C31 (1986) 33.
3. D. Aston et al., Phys. Lett. B194 (1987) 579.
4. D. Aston et al., SLAC-REP-298 (1986).
5. J. D’Amore, Ph. D. Thesis, University of Cincinnati (1988), (unpublished).
6. D. Aston et al., Phys. Rev. D32 (1985) 2270.
7. P. Rosselet, Proc. of the Second International Conf. on Hudron Spec- troscopy, KEK, Tsukuba, Japan, April 1987.
8. J. M. Richard, Phys. Lett. 1OOB (1981) 515.
9. N. Isgur and G. Karl, Phys. Rev. D19 (1979) 2653.
10. A. Bradley, J. Phys. G4 (1978) 1517; E. Eichten et al., Phys. Rev. D21 (1980) 203; S. B. G erasimov et al., Z. Phys. C13, (1982) 43.
15
FIGURE CAPTIONS . Fig. 1. The LASS Spectrometer.
Fig. 2. Basic V- event topology. Solid lines indicate tracks required in the primary selection process described in the text.
Fig. 3. Distribution of the AT- effective mass for events selected as Z:- candidates as described in the text.
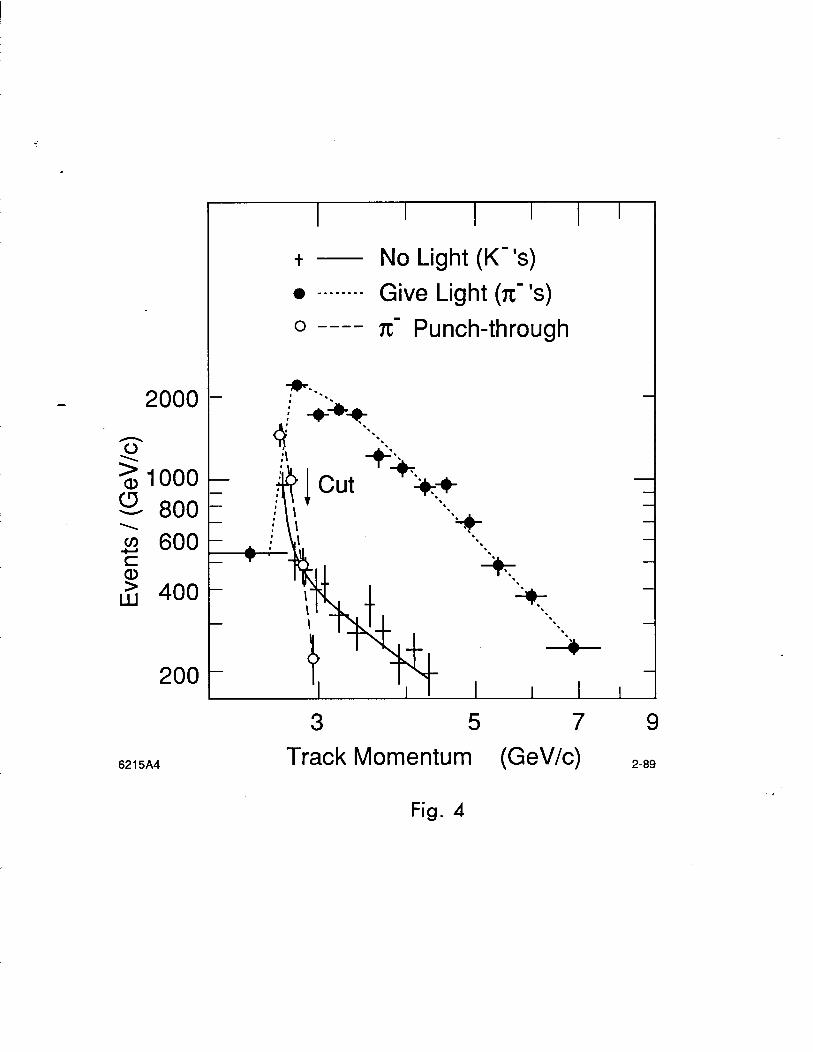
Fig. 4, Momentum distributions for three classes of negative charged particles pro- duced in conjunction with Z’s. The curves are drawn to aid in distin- guishing the three classes. The solid line indicates those tracks which gave no Cherenkov light; the dotted curve connects data points for the tracks which did give light. The latter data are weighted by a factor c-l, where E v is the momentum dependent Cherenkov efficiency. The dashed line shows the same data plotted instead with a weight ~~~(1 - e).
Fig. 5. Distribution of Z-K-r+ effe t c ive masses for all 1,259 combinations. The dashed histogram contains events outside the E*O(1530).
Fig. 6. Distribution of “c-r + effective masses for 814 events with both a E- and a K-. The limits used to define both 2*‘(1530), and the control regions on either side are marked by arrows.
Fig. 7. Distribution of E-K-r+ effe c ive masses for events having both a Ii’- and t’ -- = n+ mass in the range 1510 < A&-*+ < 1555MeV/c2 (outer histogram); or in the control bands defined by &-,+ < 1510 or 1555 < ME-*+ < 1600MeV/c2 (solid dots). Th e o p en circle distribution is for events with -- .z n+ mass in the former range and a negative track giving light in either Cr or C2. In this distribution, each event is weighted by the factor (l-6)/~, in which E is the Cherenkov efficiency.
Fig. 8. Distribution of Z-K-r+ effective masses for events with a E-K+ mass in the range 1510 < M-- E ,+ < 1555 MeV/c2, and a negative track giving light in either Cr or C2 with a I<- mass assignment. This sample contains no events contributing to the outer histogram in Fig. 7, but when each event is weighted by the factor (1 - 6)/c, yields the distribution with open circles in that figure.
Fig. 9. Background subtracted Z*‘( 1530)K- mass distribution.
Fig. 10. The AK- mass distribution for the inclusive R- events; the solid histogram corresponds to those events having at least one pair of oppositely-charged primary vertex tracks consistent with a r+r- interpretation; the dashed curve is for all events. The curve is a fit to the resolution function, deter- mined from a Monte Carlo sample, with a linear background.
Fig. 11. (a) The inclusive R-K+K- mass distribution for those events within f10 MeV/c2 of the nominal R- mass in the solid histogram of Fig. 10; for the
16
X* tracks, any available particle identification information was required to be consistent with the pion mass assignment. The dotted histogram cor- responds to Cherenkov-identified K+‘s. The dashed histogram represents the ~-x*K* distribution weighted as described in the text. (b) The mass distribution obtained from the solid histogram of Fig. 11(a) when the r+ track is given the K+ mass.
Fig. 12. The AK- effective mass from the reaction K-p + AK+K-.
Fig. 13: (a)-(c) Th e momentum dependence of the difference between time-of-flight calculated on the assumption of the kaon mass (t&,) and the measured value: (a) for K-‘s from reaction (2); (b) for negative; (c) for positive primary tracks produced in association with an at-; (d)-(f) the momentum dependence of the natural logarithm of the kaon to pion probability ratio for tracks having dE/d x information from the cylindrical PWC package surrounding the target: (d) for K+‘s from reaction (2); (e) for negative, and (f) for positive primary tracks produced in association with an R-.
Fig. 14. (a) The R-.R+~- mass distribution corresponding to those z+ tracks hav- ing TOF information such that tFd, 2 t,,,; the dashed histogram is for those having tFdc 5 t,,,,; (b) The R-w+a- mass distribution for the “net identified n+ ” sample described in the text.
Fig. 15. Distributions of 7r 7r + - effective mass in three R-r+w- mass ranges: (a) be- low; (b) in; (c) above the peak at - 2470 MeV/c2. The curves are from Monte Carlo data with purely s-wave dipion systems.
Fig. 16. The histogram is the solid histogram of Fig. 11(a); the curve is obtained from a fit using an S-wave Breit-Wigner line-shape plus a polynomial background (dashed curve); the resulting mass and width values are as indicated.