24
Recent SPECT/CT Imaging Studies using ORNL/JLAB instrumentation Bethesda May 20, 2005
| Date post: | 01-Jan-2016 |
| Category: |
Documents |
| Upload: | elvin-carter |
| View: | 215 times |
| Download: | 0 times |
Recent SPECT/CT Imaging Studies using ORNL/JLAB instrumentation
BethesdaMay 20, 2005

Overview
•Systemic AA-Amyloidosis•New contrast agent studies
Motivation
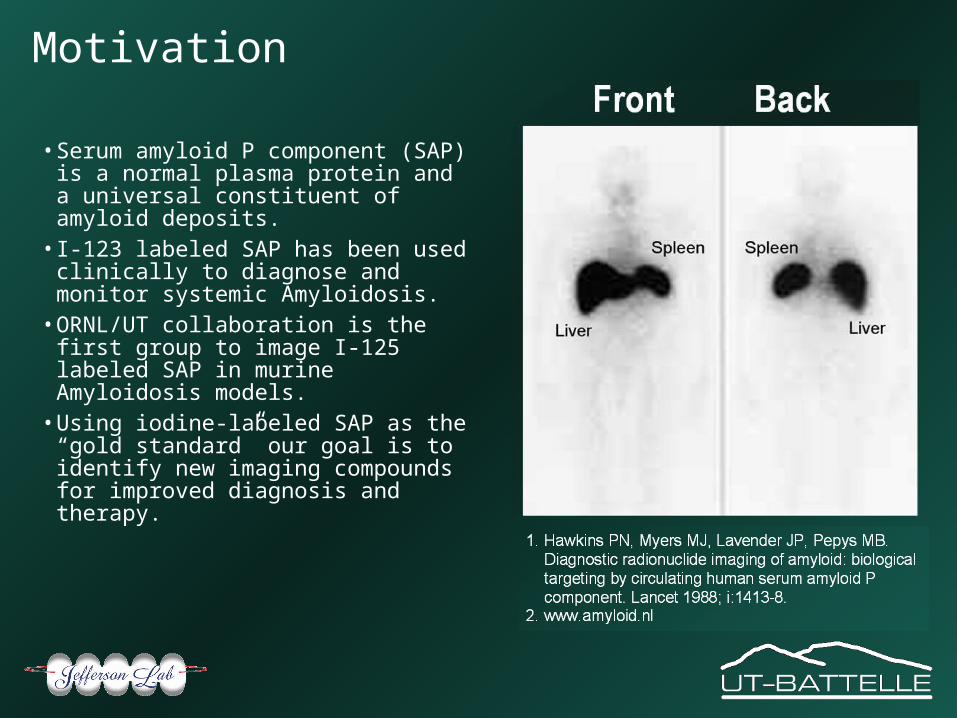
•Serum amyloid P component (SAP) is a normal plasma protein and a universal constituent of amyloid deposits.
•I-123 labeled SAP has been used clinically to diagnose and monitor systemic Amyloidosis.
•ORNL/UT collaboration is the first group to image I-125 labeled SAP in murine Amyloidosis models.
•Using iodine-labeled SAP as the “gold standard” our goal is to identify new imaging compounds for improved diagnosis and therapy.
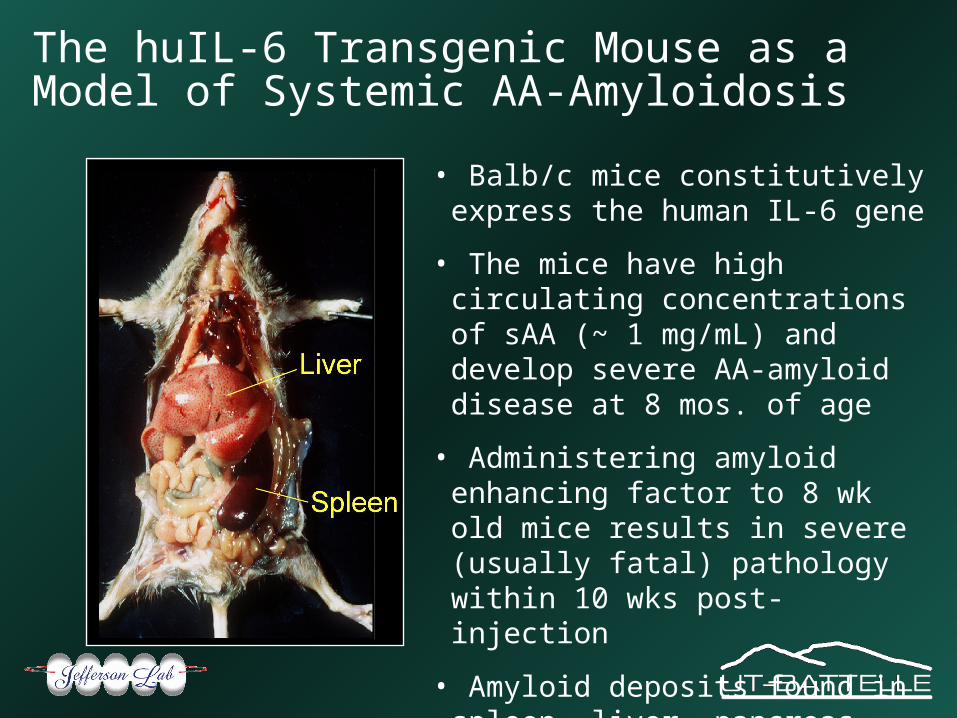
• Balb/c mice constitutively express the human IL-6 gene
• The mice have high circulating concentrations of sAA (~ 1 mg/mL) and develop severe AA-amyloid disease at 8 mos. of age
• Administering amyloid enhancing factor to 8 wk old mice results in severe (usually fatal) pathology within 10 wks post-injection
• Amyloid deposits found in spleen, liver, pancreas, kidney, heart, tongue and vasculature
The huIL-6 Transgenic Mouse as a Model of Systemic AA-Amyloidosis
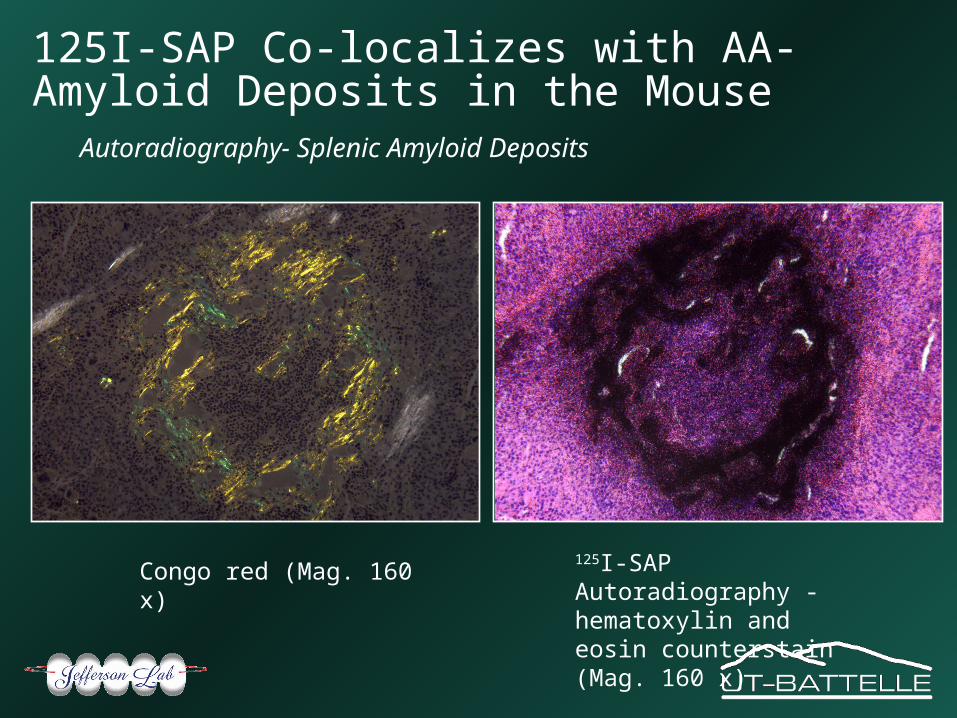
Autoradiography- Splenic Amyloid Deposits
Congo red (Mag. 160 x)125I-SAP Autoradiography - hematoxylin and eosin counterstain (Mag. 160 x)
125I-SAP Co-localizes with AA-Amyloid Deposits in the Mouse
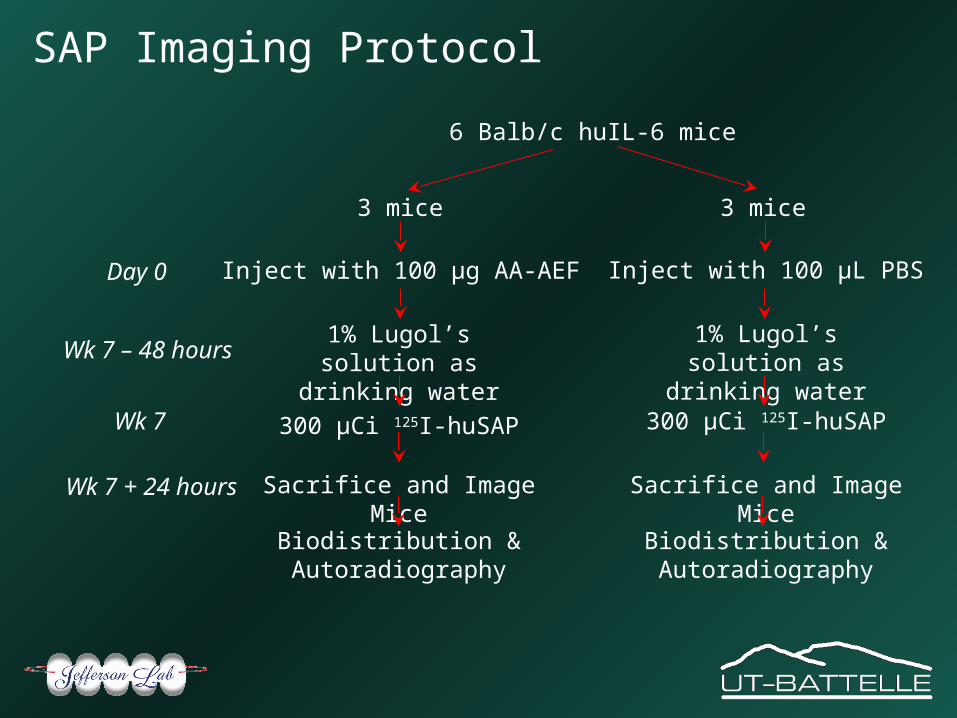
6 Balb/c huIL-6 mice
3 mice 3 mice
Inject with 100 μg AA-AEF Inject with 100 μL PBS
1% Lugol’s solution as drinking water
1% Lugol’s solution as drinking water
300 μCi 125I-huSAP 300 μCi 125I-huSAP
Sacrifice and Image Mice Sacrifice and Image Mice
Biodistribution & Autoradiography
Biodistribution & Autoradiography
Day 0
Wk 7 – 48 hours
Wk 7
Wk 7 + 24 hours
SAP Imaging Protocol
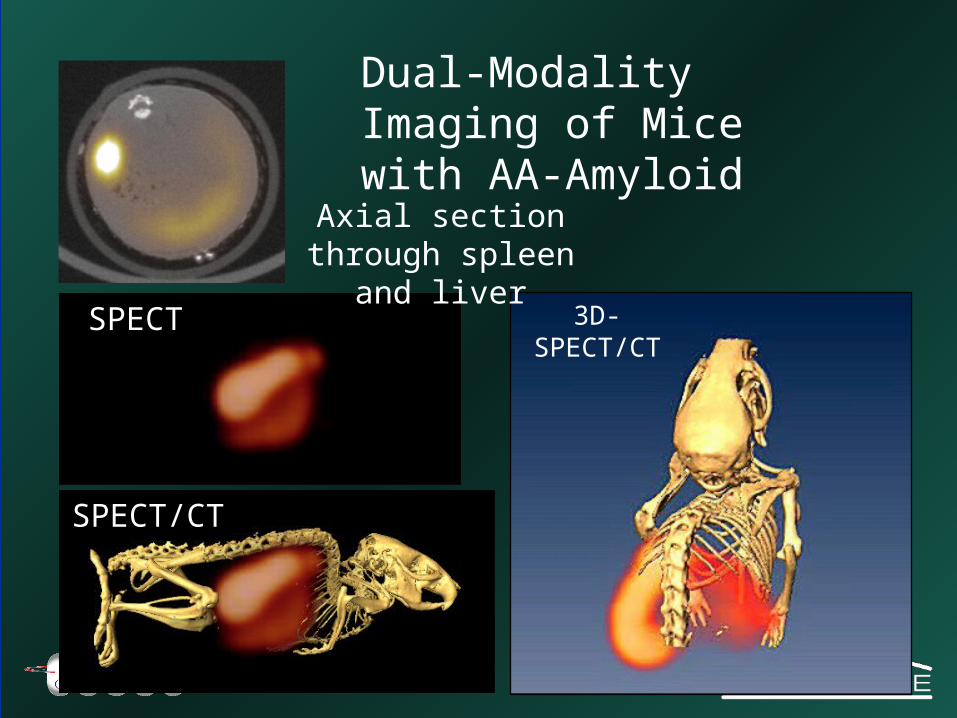
Dual-Modality Imaging of Mice with AA-Amyloid
Axial section through spleen and liver
SPECT
SPECT/CT
3D-SPECT/CT
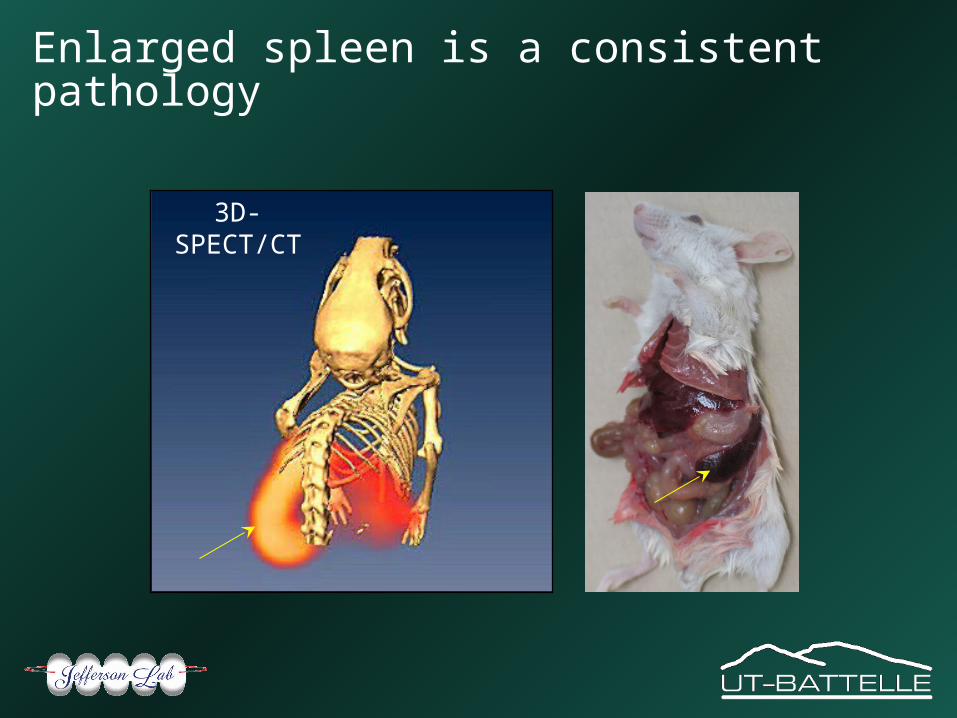
3D-SPECT/CT
Enlarged spleen is a consistent pathology
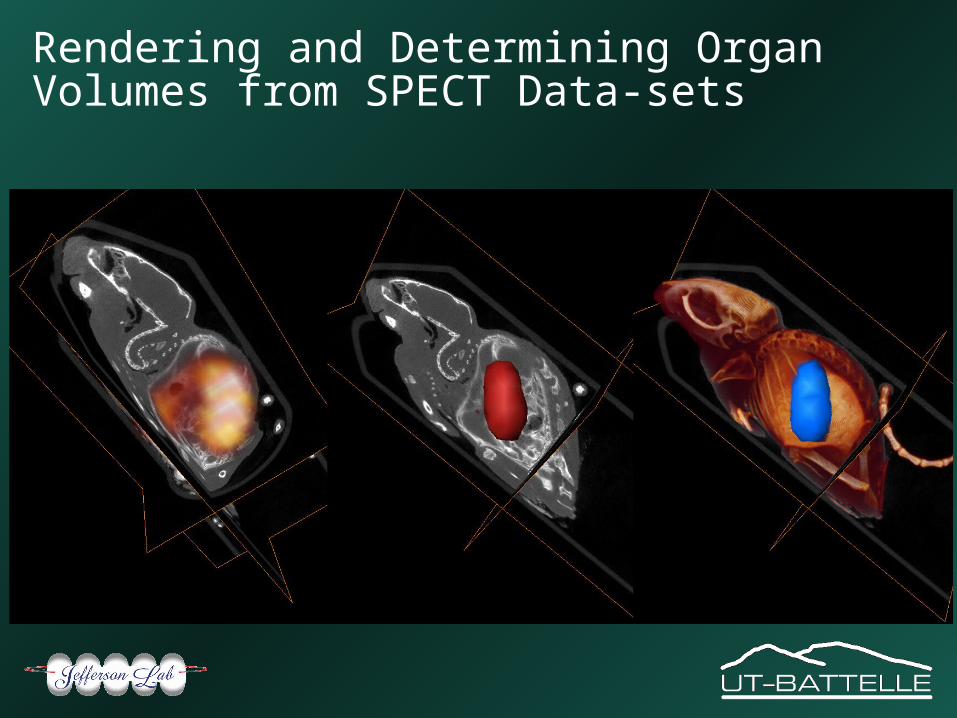
Rendering and Determining Organ Volumes from SPECT Data-sets
0
10
20
30
40
50
60
mouse 1 mouse 2 mouse 3
Liver
Spleen
Pancreas
% C
ount
s pe
r or
gan
0
5
10
15
20
25
mouse 1 mouse 2 mouse 3
Liver
Spleen
Pancreas
% I
njec
ted
Dos
e/gr
am ti
ssue
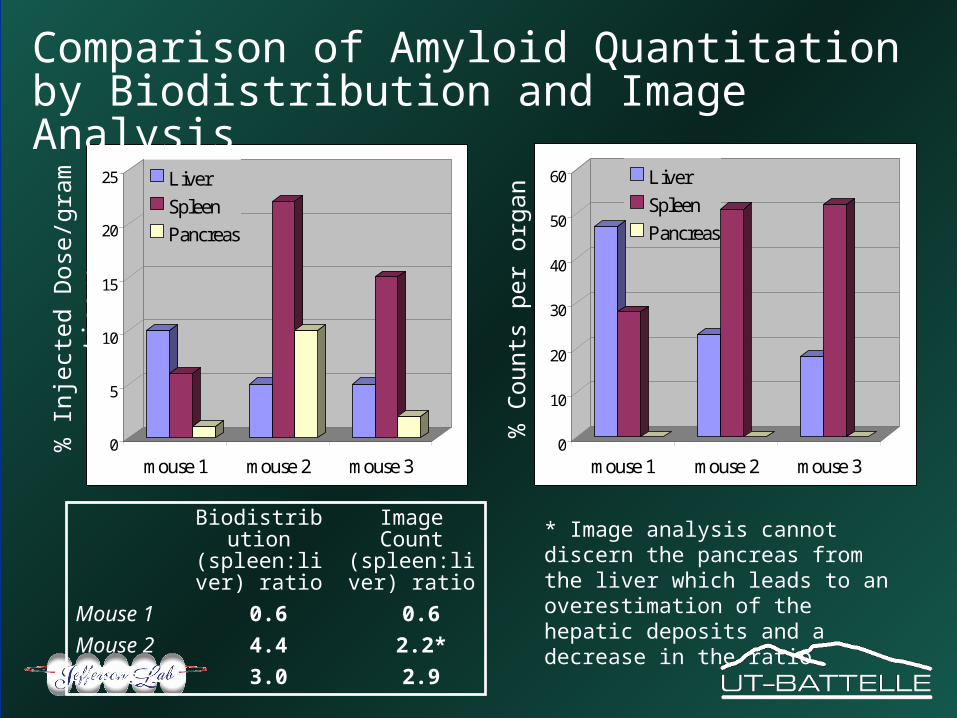
Biodistribution (spleen:liver)
ratio
Image Count (spleen:liver)
ratio
Mouse 1 0.6 0.6
Mouse 2 4.4 2.2*
Mouse 3 3.0 2.9
* Image analysis cannot discern the pancreas from the liver which leads to an overestimation of the hepatic deposits and a decrease in the ratio.
Comparison of Amyloid Quantitation by Biodistribution and Image Analysis
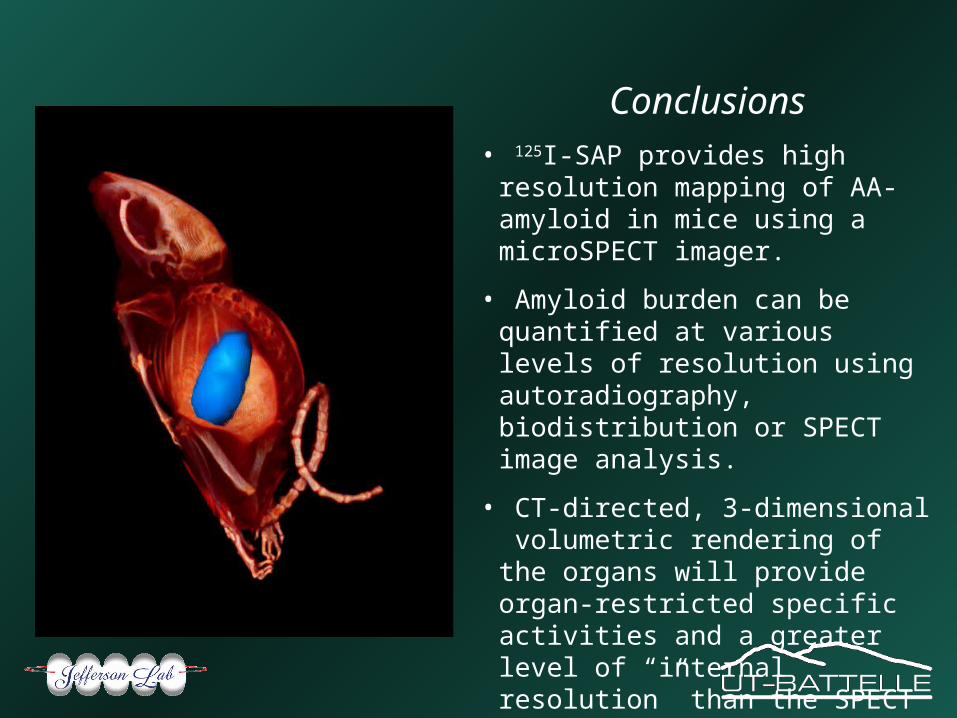
Conclusions• 125I-SAP provides high resolution
mapping of AA-amyloid in mice using a microSPECT imager.
• Amyloid burden can be quantified at various levels of resolution using autoradiography, biodistribution or SPECT image analysis.
• CT-directed, 3-dimensional volumetric rendering of the organs will provide organ-restricted specific activities and a greater level of “internal resolution” than the SPECT images alone.
But,
SAP scintigraphy has been criticized for:
1. Its inability to image cardiac amyloid in AL patients
2. Its overestimation of hepatic involvement due to its catabolism in the liver
So,
A small proteinase inhibitor, aprotinin, has been evaluated, clinically and compared to SAP SPECT imaging in our model.
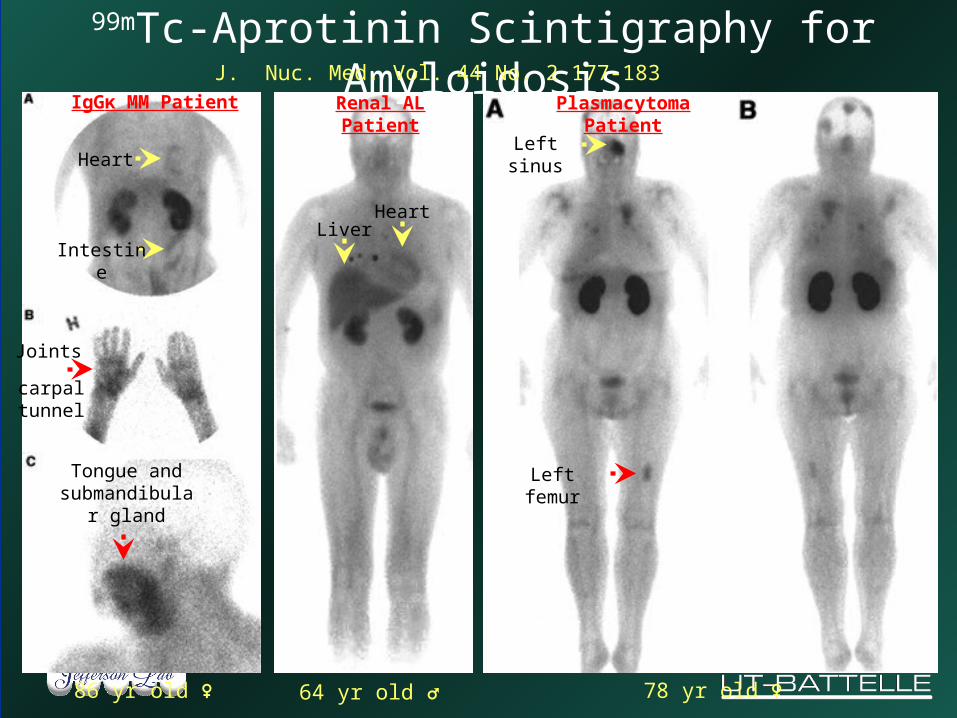
99mTc-Aprotinin Scintigraphy for Amyloidosis
Heart
Intestine
Joints
carpal tunnel
IgGκ MM Patient
Tongue and submandibular
gland
Renal AL Patient Plasmacytoma Patient
HeartLiver
Left sinus
Left femur
64 yr old ♂86 yr old ♀ 78 yr old ♀
J. Nuc. Med. Vol. 44 No. 2 177-183
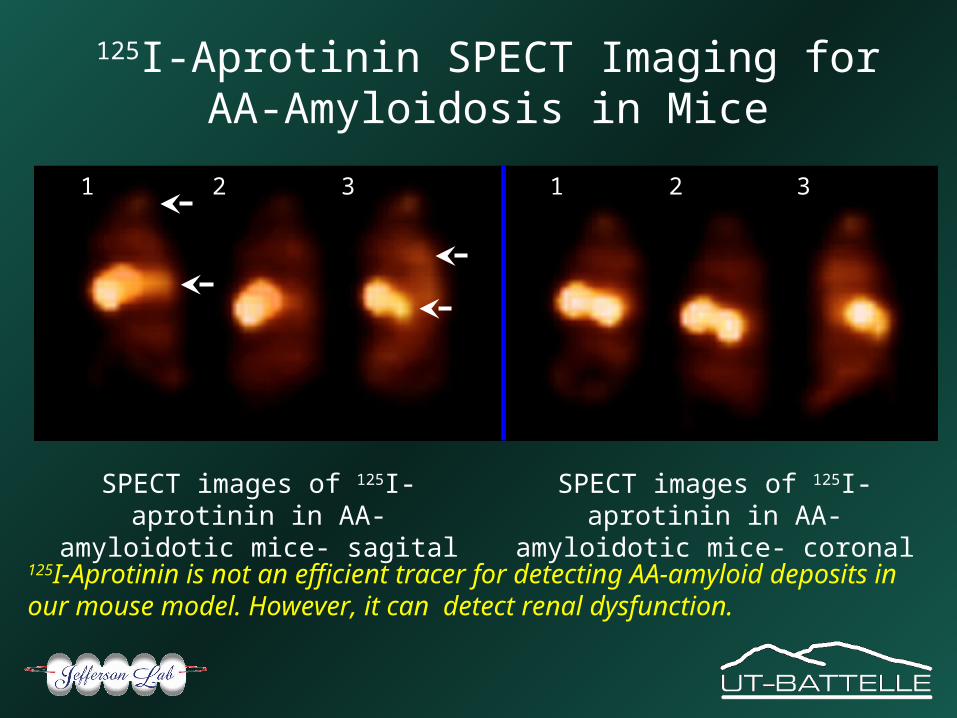
125I-Aprotinin SPECT Imaging for AA-Amyloidosis in Mice
SPECT images of 125I-aprotinin in AA-amyloidotic mice- sagital
SPECT images of 125I-aprotinin in AA-amyloidotic mice- coronal
1 3212 3
125I-Aprotinin is not an efficient tracer for detecting AA-amyloid deposits in our mouse model. However, it can detect renal dysfunction.
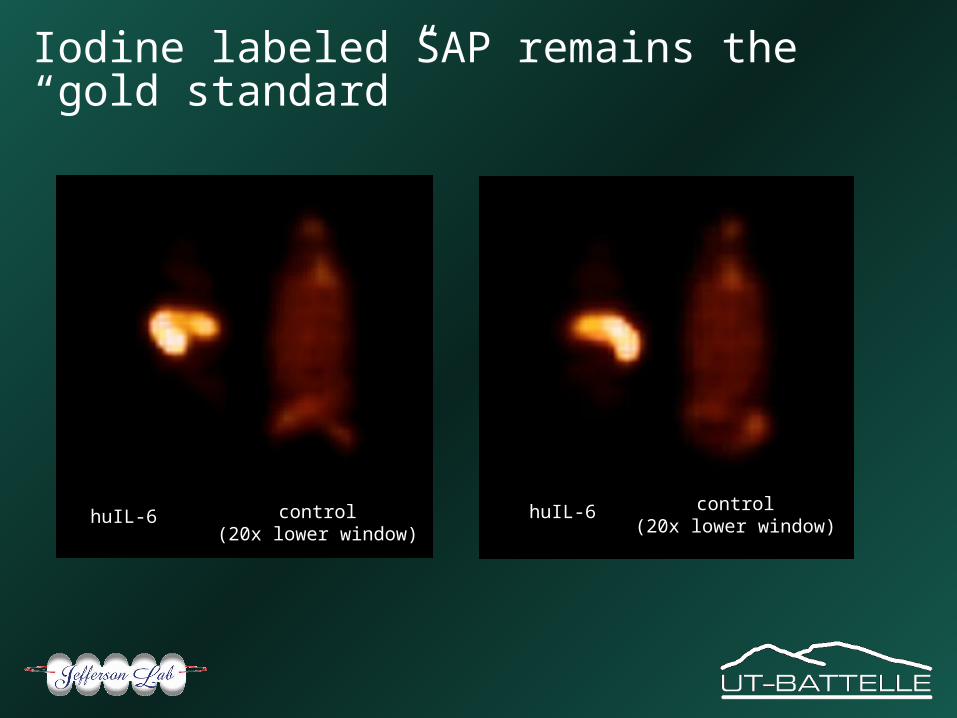
Iodine labeled SAP remains the “gold standard”
huIL-6 huIL-6control(20x lower window)
control(20x lower window)
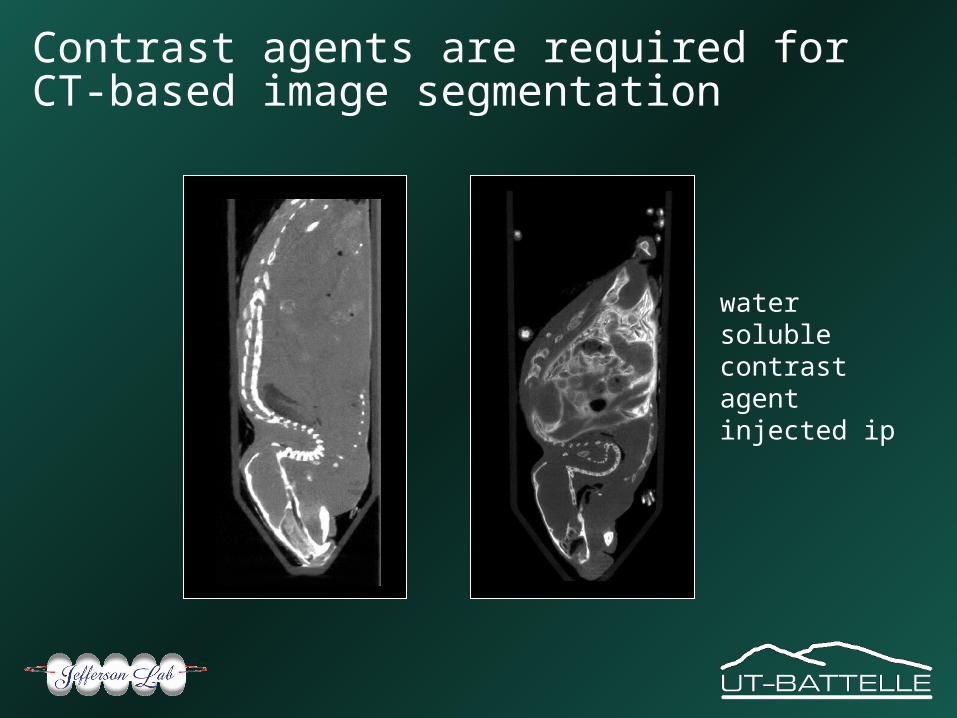
Contrast agents are required for CT-based image segmentation
water soluble contrast agent injected ip
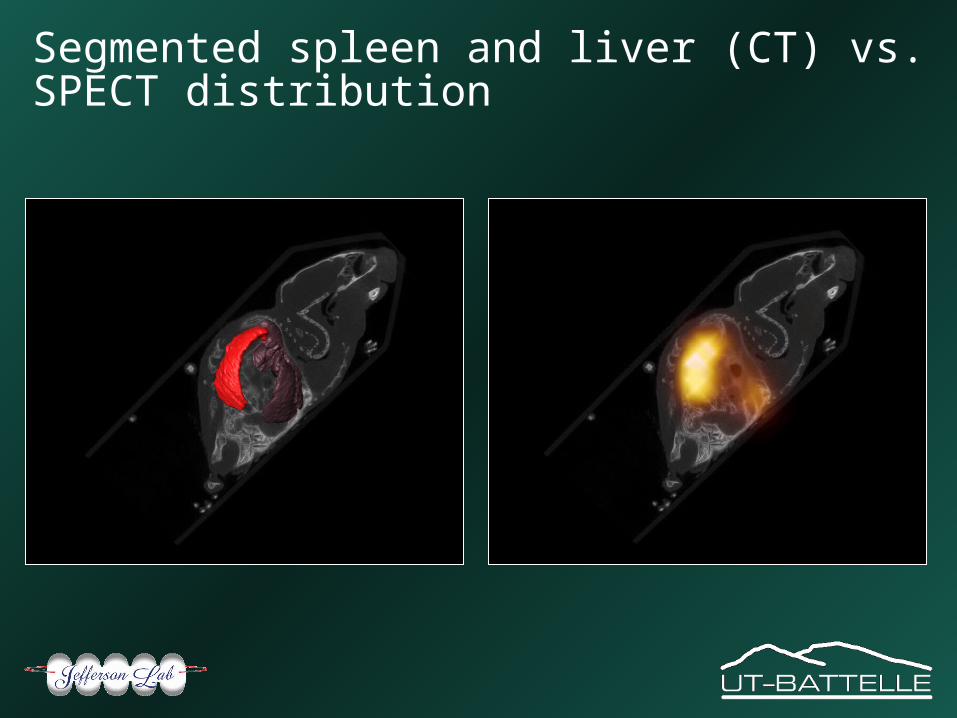
Segmented spleen and liver (CT) vs. SPECT distribution
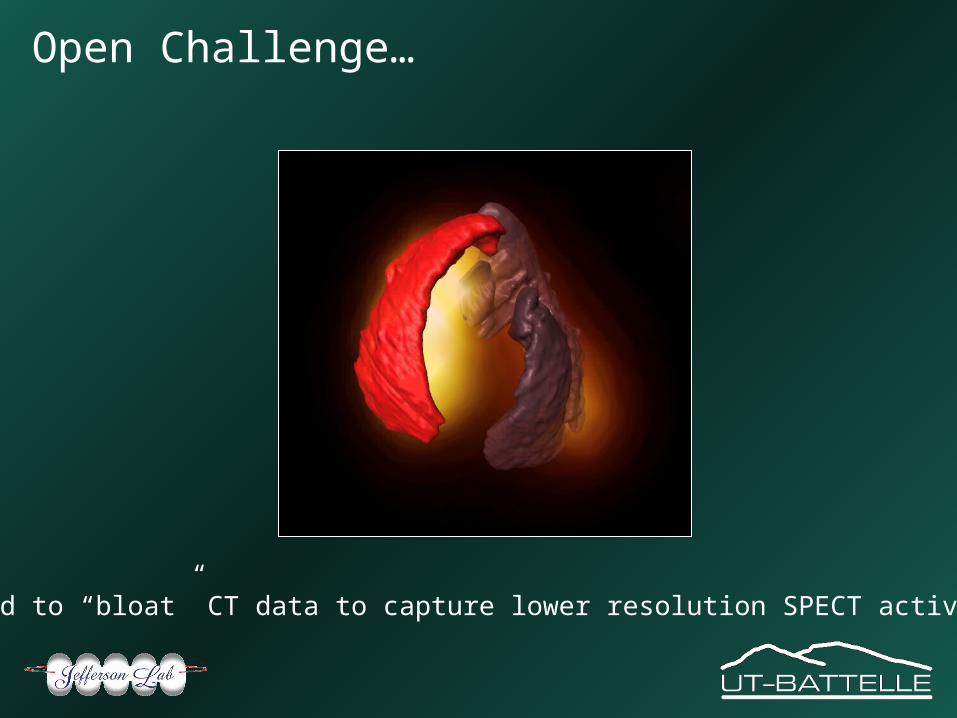
Open Challenge…
Need to “bloat” CT data to capture lower resolution SPECT activity
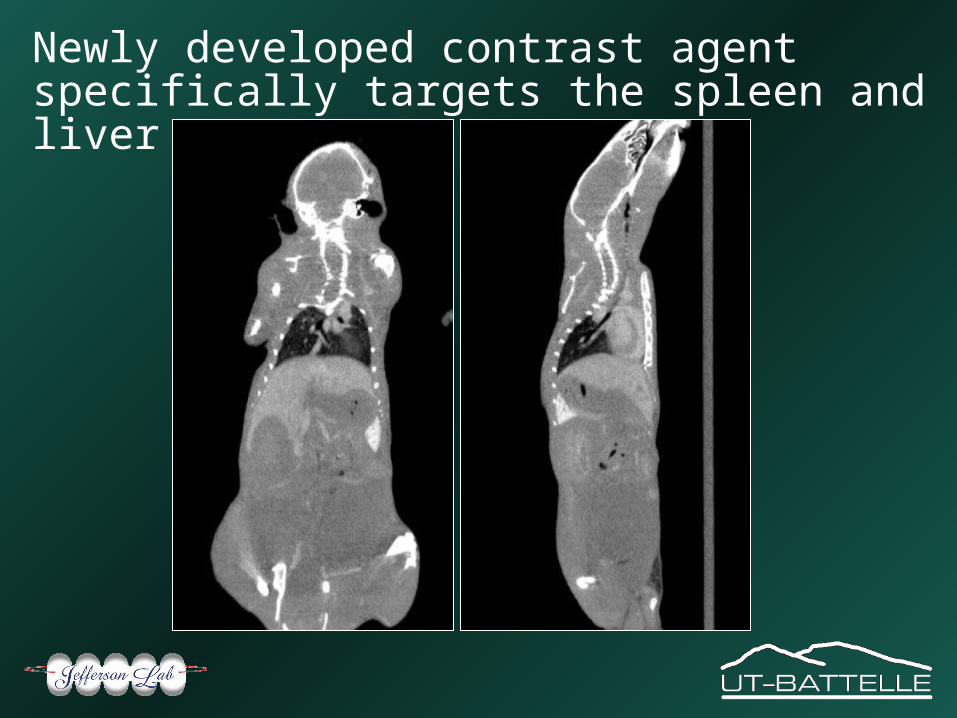
Newly developed contrast agent specifically targets the spleen and liver
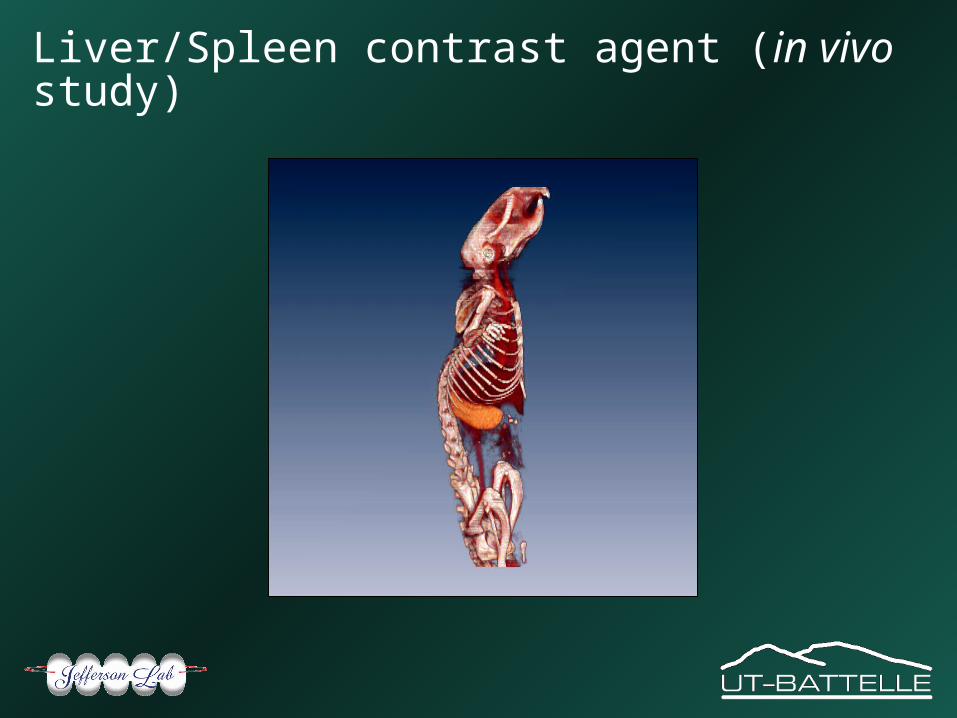
Liver/Spleen contrast agent (in vivo study)
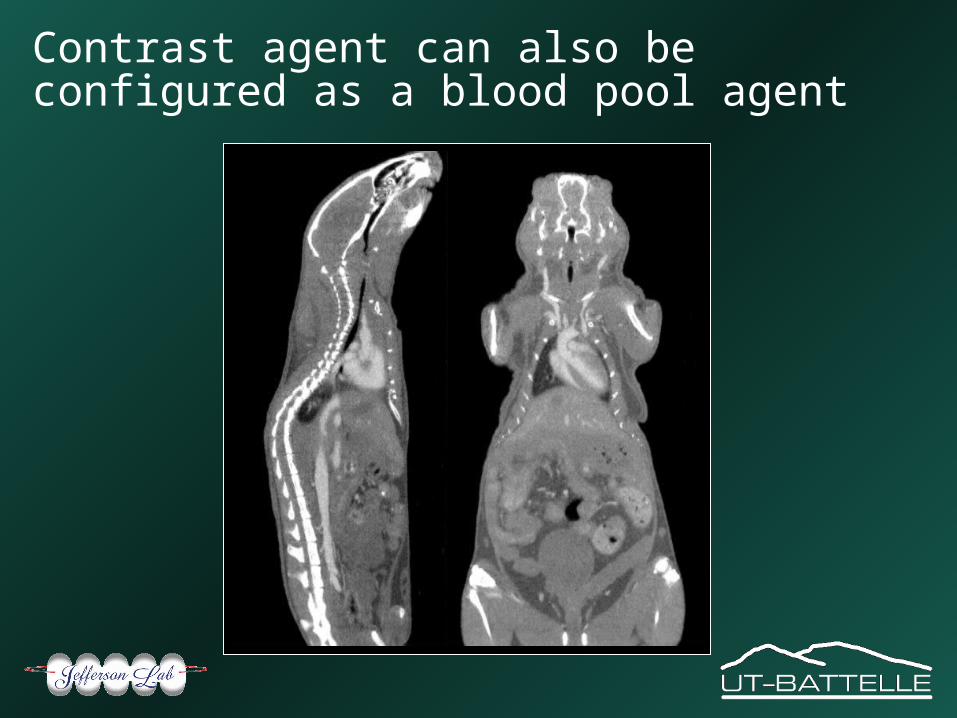
Contrast agent can also be configured as a blood pool agent
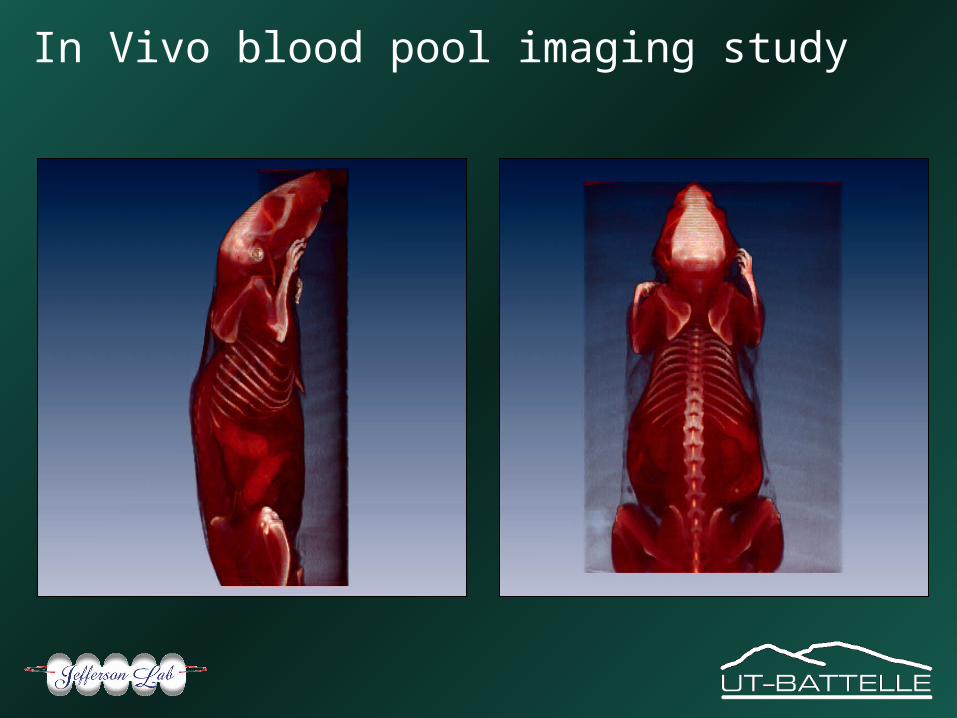
In Vivo blood pool imaging study
Summary
•SPECT and CT instrumentation are in routine use.•Representative SPECT/CT study of AA amyloidosis model presented.
•Recent contrast agent studies presented.


