Technical Memorandum Sacramento Central Groundwater Authority Subject: Recharge Mapping and Field Study Prepared For: Sacramento County Groundwater Authority Prepared by: Jim Blanke (RMC), John Fio (HydroFocus), Mesut Cayar (RMC), and Sevim Onsoy (RMC) Reviewed by: Ali Taghavi Date: December 16, 2015 This Technical Memorandum (TM) describes the work performed for SCGA (Study Area; Figure 1) in developing a recharge map based on the Existing Conditions Baseline scenario using the Sacramento Area Integrated Water Resources Model (SacIWRM), a recharge field study, and particle tracking analysis using outputs from the Existing Conditions Baseline. The effort seeks to improve the conceptual understanding of the South American Subbasin through identification of sources of groundwater recharge as well as the relative magnitude of each source. The comparison of the recharge map, particle tracking analysis, and field study results aids in determining refinement needs for the SacIWRM model in the future to incorporate the new information gained from the field study. This information will also help provide the background necessary to help identify potential impacts from development in the foothills and in the eastern part of the county and to help improve the conjunctive management of surface water and groundwater supplies, which is particularly important along the Cosumnes River basin, where surface water / groundwater interaction is critical for several habitat restoration projects and groundwater dependent ecosystems. The TM presents the methodology and results in the following four sections: • Section 1, Recharge Map Development, presents a quantitative assessment of the sources of recharge to the SCGA area. • Section 2, Recharge Field Study, assesses groundwater recharge sources using well water samples analyzed for stable isotopes and water quality to delineate where recharge is derived from local rainfall and where recharge is primarily derived from surface-water that originated in the Sierra Nevada. • Section 3, Verification of Model, presents the estimates of recharge sources based on the particle tracking analysis and compares to the recharge field study. • Section 4 provides a summary. A Local Groundwater Assistance grant from the California Department of Water Resources (CDWR) partially funded the project. December 2015 1
Transcript
Technical Memorandum Sacramento Central Groundwater Authority
Subject: Recharge Mapping and Field Study
Prepared For: Sacramento County Groundwater Authority
Prepared by: Jim Blanke (RMC), John Fio (HydroFocus), Mesut Cayar (RMC), and Sevim Onsoy (RMC)
Reviewed by: Ali Taghavi
Date: December 16, 2015
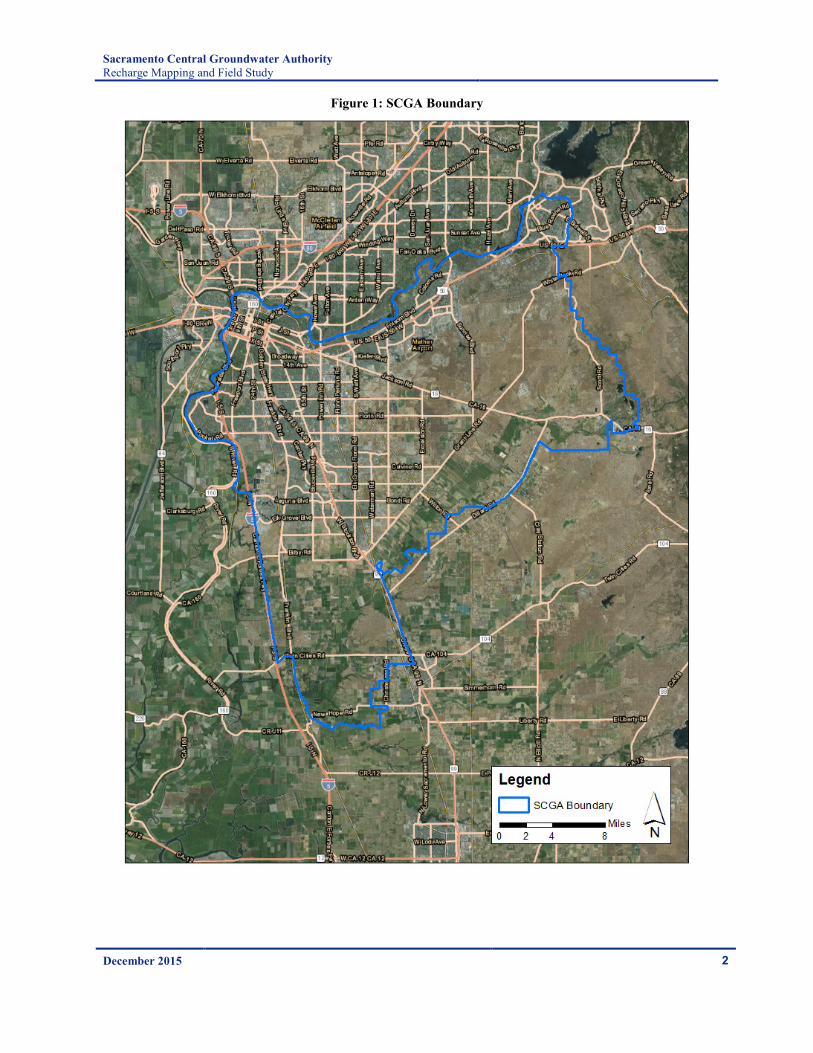
This Technical Memorandum (TM) describes the work performed for SCGA (Study Area; Figure 1) in developing a recharge map based on the Existing Conditions Baseline scenario using the Sacramento Area Integrated Water Resources Model (SacIWRM), a recharge field study, and particle tracking analysis using outputs from the Existing Conditions Baseline. The effort seeks to improve the conceptual understanding of the South American Subbasin through identification of sources of groundwater recharge as well as the relative magnitude of each source. The comparison of the recharge map, particle tracking analysis, and field study results aids in determining refinement needs for the SacIWRM model in the future to incorporate the new information gained from the field study. This information will also help provide the background necessary to help identify potential impacts from development in the foothills and in the eastern part of the county and to help improve the conjunctive management of surface water and groundwater supplies, which is particularly important along the Cosumnes River basin, where surface water / groundwater interaction is critical for several habitat restoration projects and groundwater dependent ecosystems.
The TM presents the methodology and results in the following four sections:
• Section 1, Recharge Map Development, presents a quantitative assessment of the sources of recharge to the SCGA area.
• Section 2, Recharge Field Study, assesses groundwater recharge sources using well water samples analyzed for stable isotopes and water quality to delineate where recharge is derived from local rainfall and where recharge is primarily derived from surface-water that originated in the Sierra Nevada.
• Section 3, Verification of Model, presents the estimates of recharge sources based on the particle tracking analysis and compares to the recharge field study.
• Section 4 provides a summary.
A Local Groundwater Assistance grant from the California Department of Water Resources (CDWR) partially funded the project.
December 2015 1
Sacramento Central Groundwater Authority Recharge Mapping and Field Study
Figure 1: SCGA Boundary
December 2015 2
Sacramento Central Groundwater Authority Recharge Mapping and Field Study
1 Recharge Map Development An understanding of recharge is critical to groundwater management, allowing for preservation and potential augmentation of existing recharge sources. To support this technical need, a recharge map was developed based on land and water use conditions, soil conditions, and hydrology from 1970 through 2004 as simulated by the Existing Conditions Baseline of the SaclWRM.1
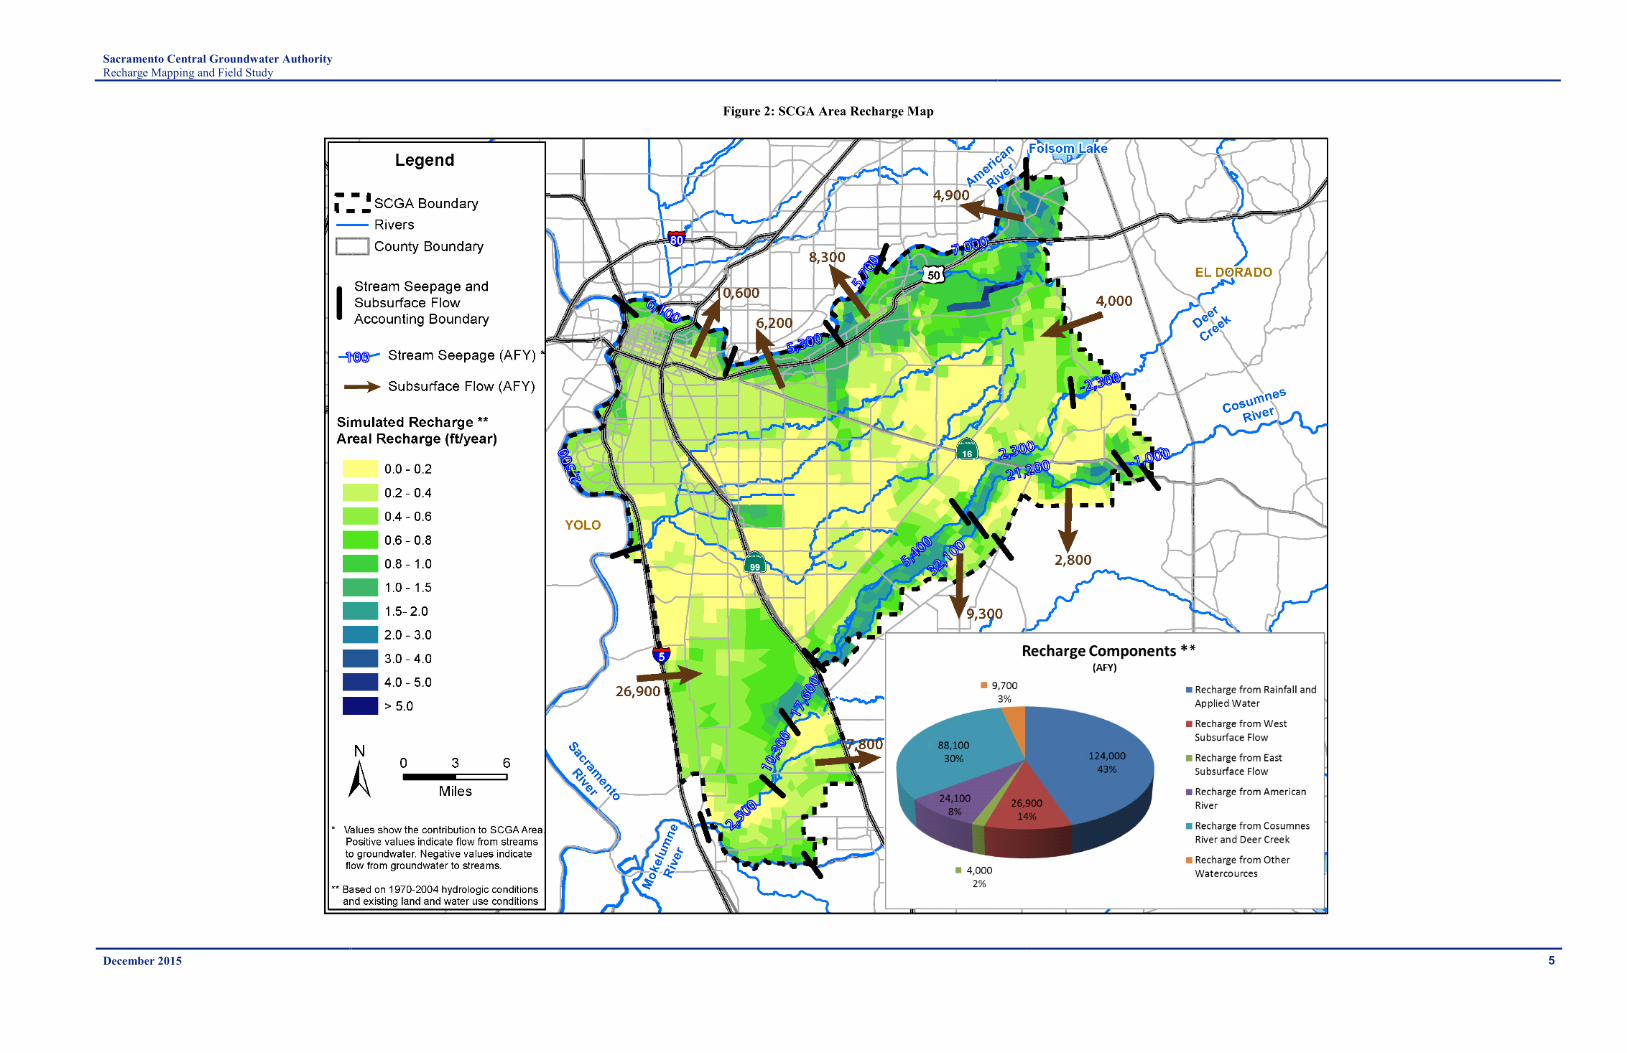
The recharge map, shown in Figure 2, presents areal recharge from applied water and precipitation on a per acre basis across the nearly 3,000 model cells within the SCGA area. These values are color coded to distinguish between areas of high recharge and low recharge. Factors creating high recharge conditions include:
• Sources of water o High volumes of applied water, such as agricultural irrigation and urban outdoor water use,
although only surface-water derived use will produce net recharge. o High precipitation, with precipitation generally slightly higher in the east
• Conditions which allow water to infiltrate into the groundwater system rather than run off o Pervious land surfaces, generally outside of urban areas o Coarse soils, mainly near the rivers and in the Rancho Cordova area o Deep groundwater, generally away from rivers and without extensive groundwater use
Additionally, the map provides estimates of stream recharge (including gaining stream segments represented as negative recharge) and boundary flows into and out of the model. A pie chart is provided to show the contribution of:
• Boundary recharge from each direction
• Stream recharge from o The American River o The Cosumnes River and Deer Creek o Other water courses
• Recharge from precipitation and applied water
The map shows higher areal recharge areas where soils are coarser (e.g., southwest of Folsom) and where there is extensive application of agricultural applied water (e.g., south of Elk Grove and between Grant Line Road and the Cosumnes River). Lower areal recharge rates are shown from Elk Grove to the northwest roughly between Morrison Creek and Grant Line Road, an area of largely suburban, rural residential, or undeveloped land on relatively low permeability soils. Areal recharge is shown together with the other components of recharge in the pie chart on the same figure. The majority of recharge is from rivers and the combination of rainfall and applied water, providing 41% and 43% of the overall recharge, respectively; the remaining 16% is recharge from subsurface flow, largely from the west.
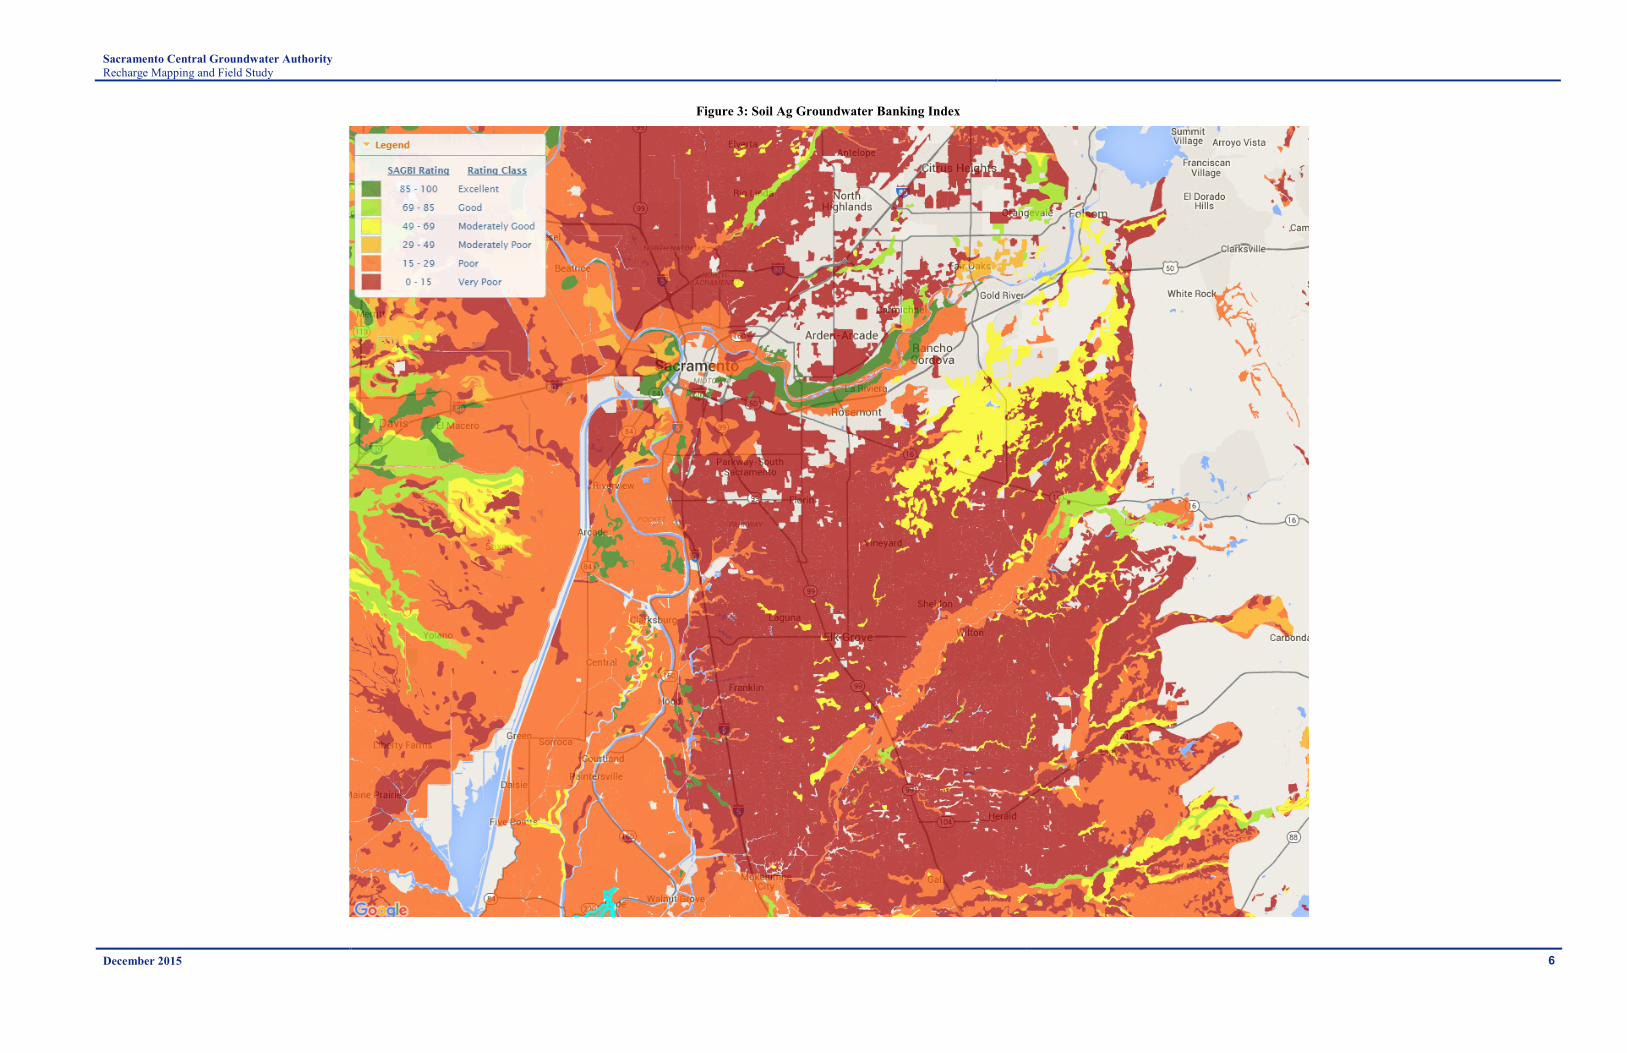
As discussed, the map shown in Figure 2 indicates where recharge is occurring under existing land and water use conditions. This is different from a map of recharge potential, which can be used to identify areas for artificial recharge. One such effort is the Soil Agriculture Groundwater Banking Index (SAGBI), a
1 RMC Water and Environment. (2011). Sacramento Area Integrated Water Resources Model (SacIWRM), Model Development and Baseline Scenarios.
December 2015 3
Sacramento Central Groundwater Authority Recharge Mapping and Field Study
suitability index for groundwater recharge on agricultural land.2 The SAGBI is based on five major factors that are important to successful agricultural groundwater banking: deep percolation, root zone residence time, topography, chemical limitations, and soil surface condition. The SAGBI ratings for the SCGA area are shown in Figure 3. A comparison of Figure 2 with Figure 3 shows that the areal recharge in Figure 2 is highly influenced by applied water in the urban areas along the American River and in the agricultural areas along the Cosumnes River while the SAGBI is highly influence by soil conditions.
2 O'Geen, A. T., Saal, M. B., Dahlke, H. E., Doll, D. A., Elkins, R. B., Fulton, A., Fogg, G. E., Harter, T., Hopmans, J. W., Ingels, C., Niederholzer, F. J., Solis, S. S., Verdegaal, P. S., Walkinshaw, M. (2015). Soil suitability index identifies potential areas for groundwater banking on agricultural lands. California Agriculture, 75-84.
December 2015 4
Sacramento Central Groundwater Authority Recharge Mapping and Field Study
Figure 2: SCGA Area Recharge Map
December 2015 5
Sacramento Central Groundwater Authority Recharge Mapping and Field Study
Figure 3: Soil Ag Groundwater Banking Index
December 2015 6
Sacramento Central Groundwater Authority Recharge Mapping and Field Study
2 Recharge Field Study
2.1 Introduction The stable isotopes of oxygen and hydrogen of water molecules vary in precipitation as a function of temperature, elevation, and latitude. In California, extreme changes in elevation can occur over relatively short distances and have the net effect of isotopic fractionation during evaporation and condensation such that surface water from mountain watersheds has a significantly lower abundance of heavier oxygen and hydrogen isotopes than near the coast. The relative abundance of these isotopes in groundwater samples can therefore be indicative of the origin of its source water (recharge), and their spatial distribution in a groundwater basin can provide evidence on the characteristics of groundwater recharge and flow.
Groundwater recharge sources in the Study Area were assessed using well water samples analyzed for stable isotopes and water quality. The objective of this study was to delineate Study Area subareas where recharge is from low-elevation precipitation (local rainfall) and subareas where recharge is primarily surface-water that originated as relatively higher-elevation precipitation in the Sierra Nevada. This high-elevation precipitation is transported to the Study Area as run-off in the American, Sacramento, and Cosumnes Rivers, and seepage from the rivers is a major source of groundwater recharge, as discussed in Section 1.
2.2 Background The oxygen and hydrogen atoms that combine to form water molecules exist naturally in different forms (isotopes). The stable isotopes of oxygen and hydrogen, oxygen-18 (18O) and deuterium (D), are not radioactive and do not change composition over time. The amount of 18O and D in a water sample is reported using the delta notation (δ), which is the isotopic composition expressed as a ratio relative to the amount in a standard (Vienna Standard Mean Ocean Water [VSMOW]) on a parts per thousand (‰) basis. The reported analysis of stable isotopes in a water sample have negative δ values if it is relatively “light,” having less 18O and D than Mean Ocean Water. Conversely, positive δ values are relatively “heavy” and have more 18O and D than Mean Ocean Water.
2.2.1 Isotopic composition of rainfall and surface waters The δ18O of rainfall and surface water in the Study Area was characterized using results from previous investigations as well as new analytical results from sampling performed as part of this study. In this part of the Central Valley, the δ18O values in rainfall have previously been reported to range from -6.5 to -9 ‰,3 and 1990-1991 rainfall samples collected at sites near the Study Area indicated a volume-weighted average of -7.5 ‰ (more than 70 % of the rainfall samples were collected in the City of Davis, which is located about 10 miles west of the Study Area and at an elevation of about 60 feet above mean sea level).4 In a different study, 73 rainwater samples were collected at a station located in the northeastern most corner of the Study Area (the sampling station was in the City of Folsom, which is located more than 30 miles east of Davis and at an elevation of about 340 feet above mean sea level). The Study Area is largely flat, with higher elevations approaching the eastern boundary; elevations within the Study Area range from near sea
3 Davisson and Criss, 1995: “Stable isotope and groundwater-flow dynamics of agricultural irrigation recharge into irrigation recharge into groundwater resources of the Central Valley, California,” International Symposium on Isotopes in Water Resources Management, Vienna, Austria, March 1995. 4 Criss and Davisson, 1993: “Preliminary report on the stable isotope and characterization of surface and groundwater resources in the southern Sacramento Valley,” Lawrence Livermore National Laboratory, UCRL-ID-115393, 30 p.
December 2015 7
Sacramento Central Groundwater Authority Recharge Mapping and Field Study
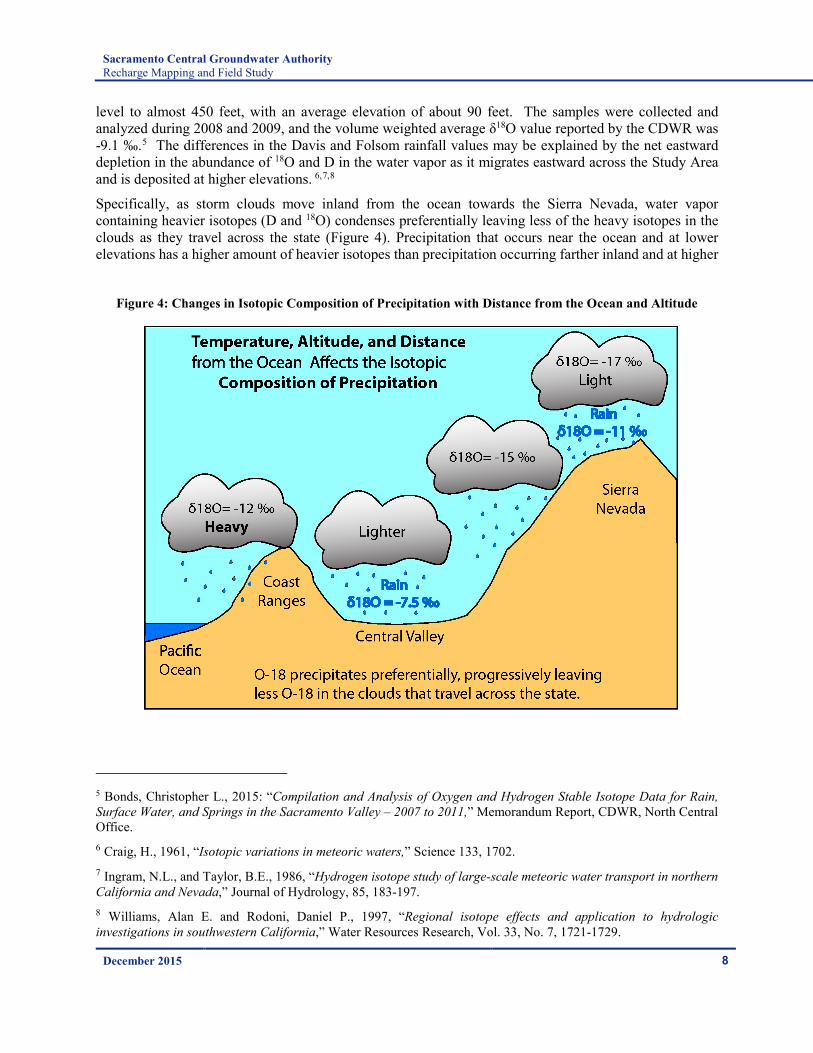
level to almost 450 feet, with an average elevation of about 90 feet. The samples were collected and analyzed during 2008 and 2009, and the volume weighted average δ18O value reported by the CDWR was -9.1 ‰.5 The differences in the Davis and Folsom rainfall values may be explained by the net eastward depletion in the abundance of 18O and D in the water vapor as it migrates eastward across the Study Area and is deposited at higher elevations. 6,7,8
Specifically, as storm clouds move inland from the ocean towards the Sierra Nevada, water vapor containing heavier isotopes (D and 18O) condenses preferentially leaving less of the heavy isotopes in the clouds as they travel across the state (Figure 4). Precipitation that occurs near the ocean and at lower elevations has a higher amount of heavier isotopes than precipitation occurring farther inland and at higher
Figure 4: Changes in Isotopic Composition of Precipitation with Distance from the Ocean and Altitude
5 Bonds, Christopher L., 2015: “Compilation and Analysis of Oxygen and Hydrogen Stable Isotope Data for Rain, Surface Water, and Springs in the Sacramento Valley – 2007 to 2011,” Memorandum Report, CDWR, North Central Office. 6 Craig, H., 1961, “Isotopic variations in meteoric waters,” Science 133, 1702. 7 Ingram, N.L., and Taylor, B.E., 1986, “Hydrogen isotope study of large-scale meteoric water transport in northern California and Nevada,” Journal of Hydrology, 85, 183-197. 8 Williams, Alan E. and Rodoni, Daniel P., 1997, “Regional isotope effects and application to hydrologic investigations in southwestern California,” Water Resources Research, Vol. 33, No. 7, 1721-1729.
December 2015 8
Sacramento Central Groundwater Authority Recharge Mapping and Field Study
elevations.9 In California, several authors have documented the isotopic shift in precipitation owing to cloud movement inland from the coast. Previous studies have sampled Laguna Creek, Cosumnes River, and the American and Sacramento Rivers for the analysis of stable isotopes.10 Laguna Creek is centrally located within the Study Area, and it begins at an elevation of about 250 feet above mean sea level. Laguna Creek flow is primarily agricultural and urban runoff during the dry season, and rainfall runoff during the wet season. In December 2012, one sample collected during a storm event reportedly had a δ18O value of -7.2 ‰,11 which is close to the rainfall value reported for the City Davis (-7.5 ‰), and substantially enriched (less negative) than the rainfall value for the City of Folsom (-9.1 ‰). Most of the Study Area is at a lower elevation than the Folsom rainfall station, and a δ18O value of -7.5 ‰ was utilized to represent local rainfall and storm water run-off in Laguna Creek and other similar water courses.
The Cosumnes River originates on the western slopes of the central Sierra Nevada at an elevation of more than 7,000 feet above mean sea level, which is considerably higher than the headwaters of Laguna Creek. Samples collected from the Cosumnes River during the December 2012 storm event reportedly had a δ18O value of -9.4 ‰,12 which was more negative than measured in Laguna Creek and similar to the higher elevation rainfall samples collected in the City of Folsom (-9.1 ‰). The relatively depleted 18O composition (more negative δ18O value) is consistent with precipitation that occurs further eastward and at higher elevations than the City of Davis. A δ18O value of -9 was utilized to represent the isotopic composition of run-off in the Cosumnes River.
The headwaters of the American and Sacramento rivers are located in the Sierra Nevada and at the highest elevations (8,000 to more than 10,000 feet, respectively). Previous studies collected runoff samples at river sites located in the Study Area, and the reported δ18O values ranged from -9.8 to -12.2 ‰ (median value of -10.7 ‰).13 A δ18O value of -11 ‰ was utilized to represent the isotopic composition of American and Sacramento River flows, which is reasonably close to the median of the sample values that were considered and consistent with the value reported by Davisson and Criss.14
2.2.2 Isotopic composition of groundwater The δ18O composition of Study Area groundwater is expected to reflect the variable δ18O values of the recharge source waters, which can range from local rainfall to run-off in the American and Sacramento Rivers. Previous Sacramento area groundwater isotope studies reported low 18O values (more negative δ18O values) near the rivers as a result of river seepage, and relatively higher values (less negative δ18O values) at locations further away from the rivers.15 The observed spatial distribution showed wells located closest to the river had δ18O values that closely match river water (about -11 ‰), while production wells within a few miles of the river were significantly depleted relative to the river water and were more representative
9 Extensive research documented in peer-reviewed scientific literature demonstrated the effects of altitude temperature and distance inland on isotopic composition. For example, Gat, J.R. and Gonfiantini, R. (1981) edited “Stable Isotope Hydrology, Deuterium and Oxygen-18 in the Water Cycle” which documents the results of decades of research on observed variations of these isotopes in the environment. 10 Water quality and stable isotope data for Laguna Creek, Cosumnes River, and the American and Sacramento rivers reported by other studies is summarized in Appendix A. 11 GEI Consultants, 2014, "Groundwater Recharge Feasibility Investigation Report, Groundwater Recharge Feasibility Pilot Study," Prepared for: Sacramento County Water Agency. February 24, 2014. 12 Ibid. 13http://waterdata.usgs.gov/nwis/ 14 Ibid.[1] 15 Ibid.[3]
Sacramento Central Groundwater Authority Recharge Mapping and Field Study
of local rainfall (approaching about -7 ‰).16 The isotope data collected during this study were utilized to assist in delineating areas recharged primarily by local rainfall and seepage from the American, Sacramento and Cosumnes Rivers.
2.2.3 Water Quality Cation and anion concentrations in well-water samples collected for this study were utilized to assess the spatial distribution of groundwater quality relative to the recharge sources identified by the stable isotope data. These included areas recharged primarily by local rainfall and seepage from surface water features.
The anionic composition of surface waters in the Study Area is reportedly dominated by bicarbonate, and either calcium or magnesium predominates as the major cation.17 Like the surface water, well-water samples are also primarily bicarbonate. However, calcium, magnesium, or sodium can be the dominant cation. Relatively poor quality water (saline formation water) at depths exceeding about 2,000 feet underlie the useable groundwater extracted by existing water-supply wells.18 The saline formation water appears to originate from sea water; is characterized by high TDS concentrations (between 15,000 to 28,000 mg/L); is dominated by high concentrations of sodium and chloride ions; and has δ18O values that range from +0.6 to +5.3 ‰.19
Recharge sources can influence cation and anion concentrations in well-water samples. The relationships can be difficult to discern because possible mixing and physio-chemical reactions between dissolved constituents in different waters and the aquifer materials modify the chemical constituents in groundwater. For example, up-coning of saline formation water can mix with the water in the pumped zone and contribute greater proportions of sodium and chloride ions to the water extracted and discharged by the well. Alternatively, dissolved magnesium and calcium ions in river seepage can exchange with adsorbed sodium ions, resulting in a relative increase in the proportional contribution of sodium to the total chemical composition of the groundwater. These exchange reactions, and the dissolution of carbonate minerals naturally present in the aquifer can occur as the water moves beneath the subsurface and is in contact with aquifer materials for extended periods of time.20
2.3 Methods
2.3.1 Well Sampling Well sampling was conducted during the period September 23 through December 22, 2014. The water samples were collected from 30 existing water supply wells and analyzed for 18O, D, and select cations and anions. An additional 10 wells were sampled and analyzed for 18O and D only. All wells are owned and operated by SCGA members or private well owners: Sacramento County Water Agency (15 wells), City of
16 Ibid.[5] 17 Department of Water Resources, 1974 (reprinted April 1980): “Evaluation of Groundwater Resources: Sacramento County,” Bulletin 118-3. 18 Ibid. 19 Davisson, M.L., R.E. Criss, and K.R. Campbell, 1993, “Preliminary Report on the Isotope Imaging and Characterization of Surface and Ground Water Resources in the southern Sacramento Valley,” Lawrence Livermore National Laboratory, UCRL-ID-115393. 20 See for example, Dylan Boyle, Aaron King, Giorgos Kourakos, Katherine Lockhart, Megan Mayzelle, Graham E. Fogg and Thomas Harter, 2012, “Technical Report 4, Addressing Nitrate in California’s Drinking Water, With a Focus on Tulare Lake Basin and Salinas Valley Groundwater,” Report for the State Water Resources Control Board Report to the Legislature.
December 2015 10
Sacramento Central Groundwater Authority Recharge Mapping and Field Study
Sacramento (6 wells), Golden State Water Company (6 wells), California American Water Company (9 wells), and private well owners (4 wells).
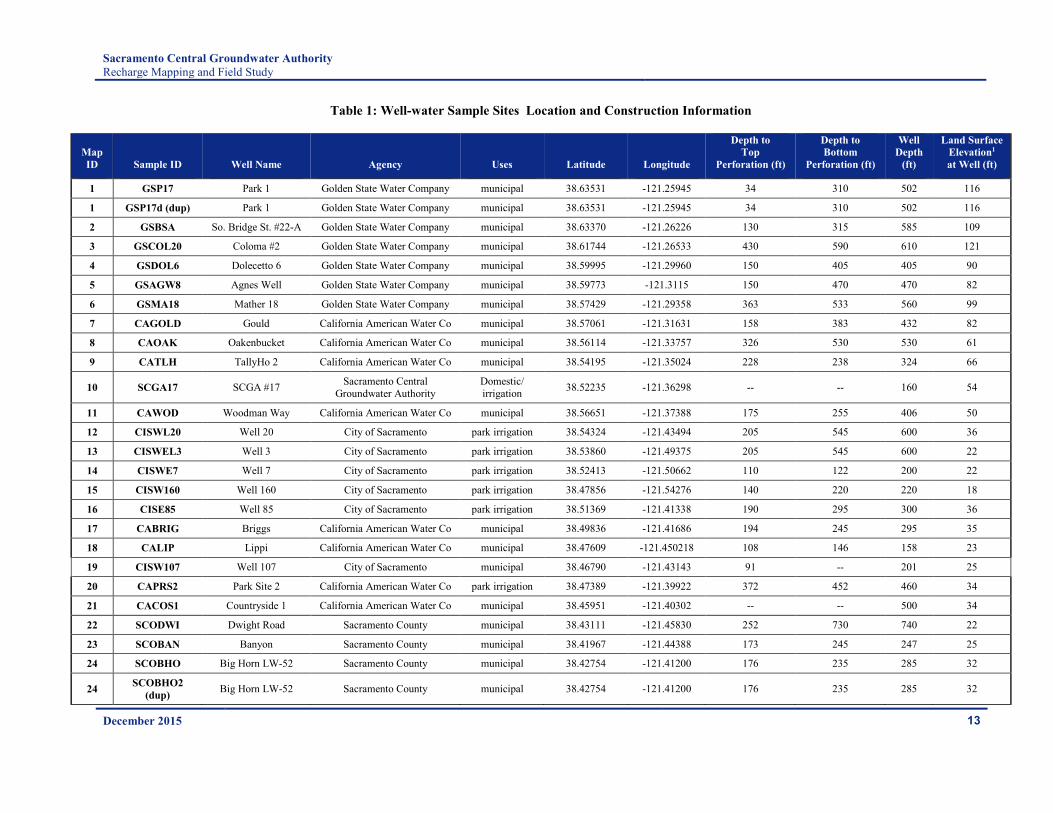
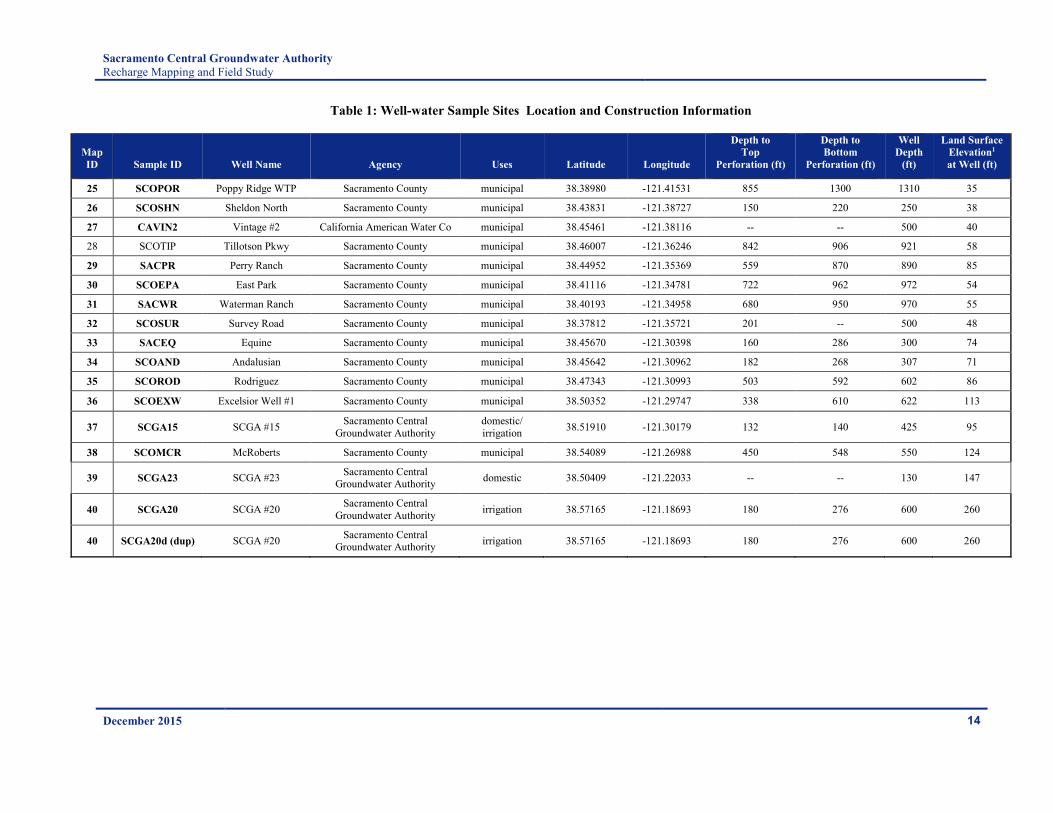
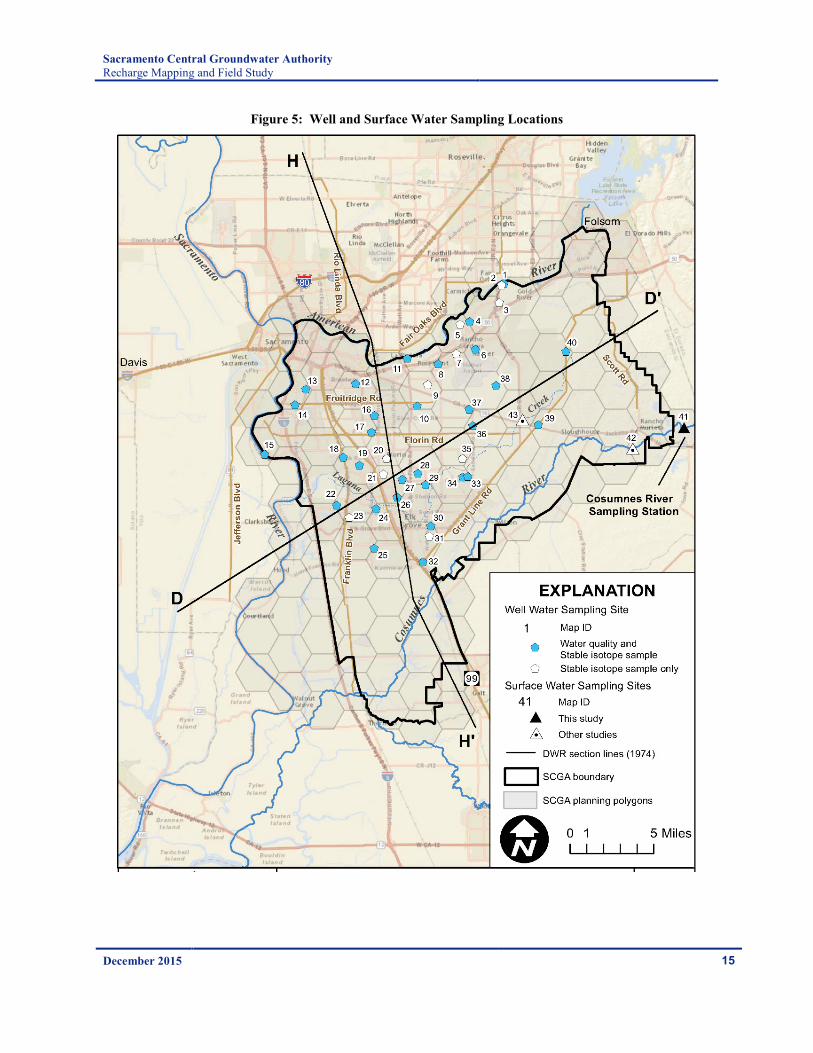
The construction information for the sampled wells is summarized in Table 1, and their locations mapped in Figure 5. Well selection was based on the following criteria.
• Reasonably uniform geographic coverage across the Study Area, using the Groundwater Management Plan’s polygon grid as a general guide.
• Wells aligned along transects, with one transect spanning from the American River to the Cosumnes River, and a second transect perpendicular to the first and aligned approximately equidistant from the two rivers. Selection of the location of the transects was supported by geologic sections of Sacramento County previously published by CDWR.21
• Availability of well construction information. • Accessibility at the time of sampling and accessibility for future sampling due in part to the owner’s
intent to continue maintaining and/or operating the well.
Well access and operation was provided by SCGA member agency staff, and the sampling was conducted by HydroFocus, Inc. personnel. The SCGA member agency staff directed the sampler to each well and provided site specific background information (e.g., well use, depth, and pump operations). The sampler recorded GPS coordinates for the well location. Static depth to water could not be measured at most sites because the well was already operating or had recently been operated.
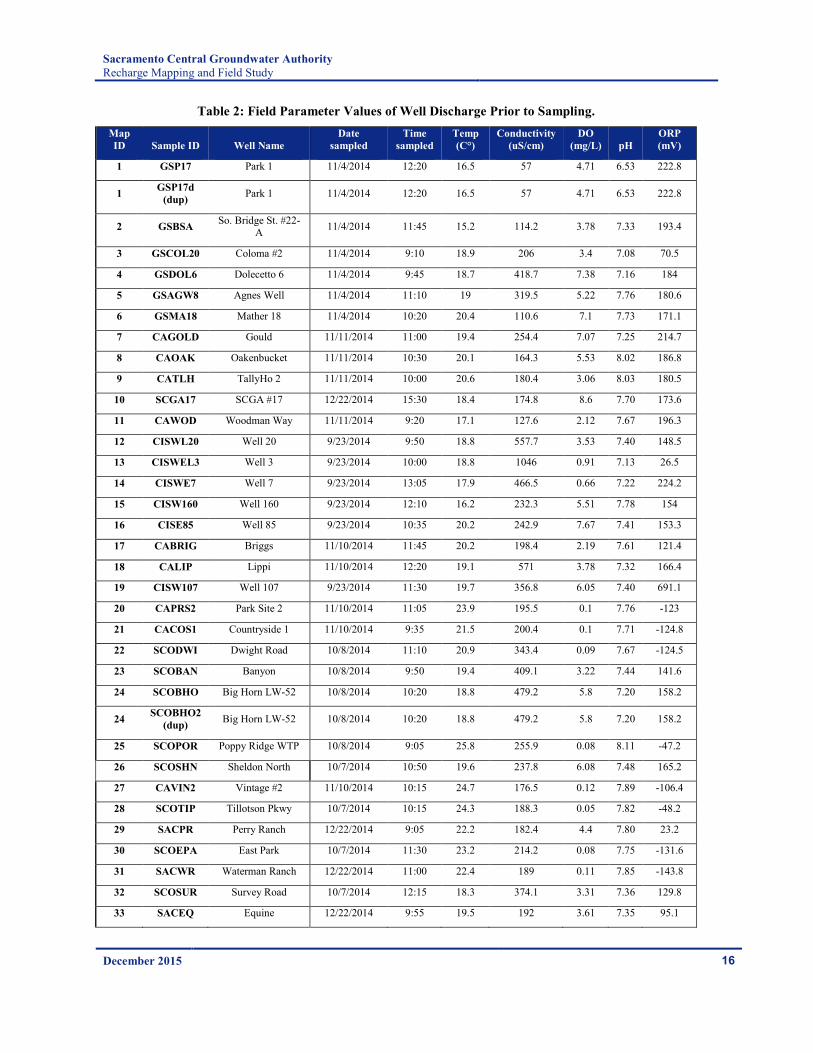
The well-water samples were collected using size-15 silicone tubing connected to a spigot at or near the well head, directing the discharge to a flow-through chamber; a collection bucket was used to measure the discharge from the chamber to determine the flow rate. Field measurements were recorded for temperature, dissolved oxygen (DO), pH, oxidation-reduction potential (ORP), and electrical conductivity. A YSI multi-meter was employed to measure these parameters, and stabilization of the parameter values was used to indicate that the water was representative of formation water.
The YSI multi-meter was calibrated at least twice a day using standards close to the values of the well-water produced (the standards were maintained in water baths at temperatures close to the temperature of the well water). Meter calibration was typically performed first in the morning prior to the start of the sampling effort, and again prior to the afternoon sampling effort. The meter was checked with zero DO solution at the first site of the day, or more frequently if needed; the pH probe was calibrated using buffers bracketing the preliminary sample result; and oxidation-reduction potential (ORP) was calibrated using ZoBell’s solution.22 The calibration results were recorded on field sheets and are included in Appendix B.
As water was pumped from the well and into the flow through chamber, field parameters were measured continuously and recorded approximately every 3 minutes. Sample collection began as soon as possible after parameter stabilization. Stability was defined as ± 0.1 for pH, ± 3 % for conductivity, ± 10 mV for ORP and ± 10 % for DO for at least two consecutive readings. The field parameter results are summarized in Table 2.
Samples analyzed for dissolved constituents (including nitrate) were filtered in the field using 0.45-μm capsule filters certified to meet EPA standards for trace metal analysis. Sample bottles and sampling equipment were rinsed thoroughly three times with the water to be sampled prior to sample collection.
21 Ibid. 22 Nordstrom, D.K. 1977. “Thermochemical redox equilibria of ZoBell’s solution,” Geochimica e Cosmochimica Acta, 41:1835-1841
December 2015 11
Sacramento Central Groundwater Authority Recharge Mapping and Field Study
Samples collected for metals were preserved with nitric acid in the field. Test strips were used to verify that the pH was less than 2 in preserved samples.
All samples collected were immediately placed on ice and transported to the laboratory on the day of collection. Before leaving the field to deliver samples, the ice level was checked to ensure sample temperatures would remain around 6°C, and ice was added if necessary. Chain of Custody form(s) were completed for each sampling day and can be found in Appendix B.
December 2015 12
Sacramento Central Groundwater Authority Recharge Mapping and Field Study
Table 1: Well-water Sample Sites Location and Construction Information
Map ID Sample ID Well Name Agency Uses Latitude Longitude
Depth to Top
Perforation (ft)
Depth to Bottom
Perforation (ft)
Well Depth
(ft)
Land Surface Elevation1 at Well (ft)
1 GSP17 Park 1 Golden State Water Company municipal 38.63531 -121.25945 34 310 502 116
1 GSP17d (dup) Park 1 Golden State Water Company municipal 38.63531 -121.25945 34 310 502 116
2 GSBSA So. Bridge St. #22-A Golden State Water Company municipal 38.63370 -121.26226 130 315 585 109
3 GSCOL20 Coloma #2 Golden State Water Company municipal 38.61744 -121.26533 430 590 610 121
4 GSDOL6 Dolecetto 6 Golden State Water Company municipal 38.59995 -121.29960 150 405 405 90
5 GSAGW8 Agnes Well Golden State Water Company municipal 38.59773 -121.3115 150 470 470 82
6 GSMA18 Mather 18 Golden State Water Company municipal 38.57429 -121.29358 363 533 560 99
7 CAGOLD Gould California American Water Co municipal 38.57061 -121.31631 158 383 432 82
8 CAOAK Oakenbucket California American Water Co municipal 38.56114 -121.33757 326 530 530 61
9 CATLH TallyHo 2 California American Water Co municipal 38.54195 -121.35024 228 238 324 66
10 SCGA17 SCGA #17 Sacramento Central Groundwater Authority
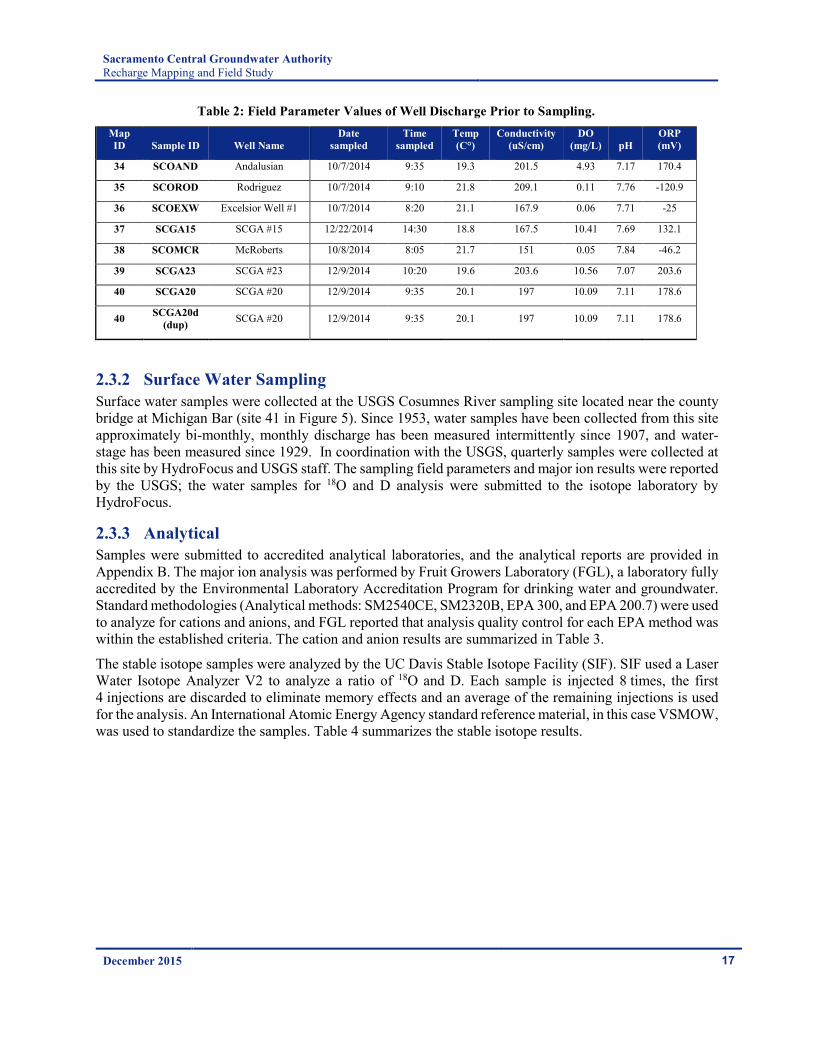
2.3.2 Surface Water Sampling Surface water samples were collected at the USGS Cosumnes River sampling site located near the county bridge at Michigan Bar (site 41 in Figure 5). Since 1953, water samples have been collected from this site approximately bi-monthly, monthly discharge has been measured intermittently since 1907, and water-stage has been measured since 1929. In coordination with the USGS, quarterly samples were collected at this site by HydroFocus and USGS staff. The sampling field parameters and major ion results were reported by the USGS; the water samples for 18O and D analysis were submitted to the isotope laboratory by HydroFocus.
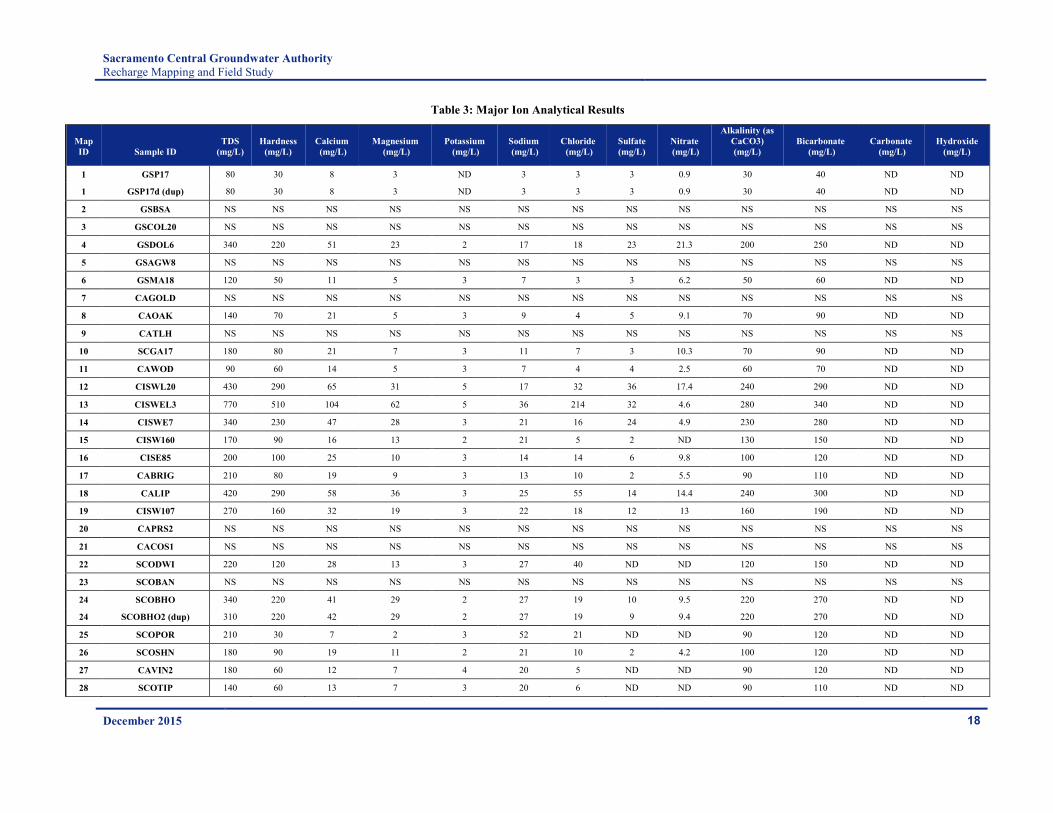
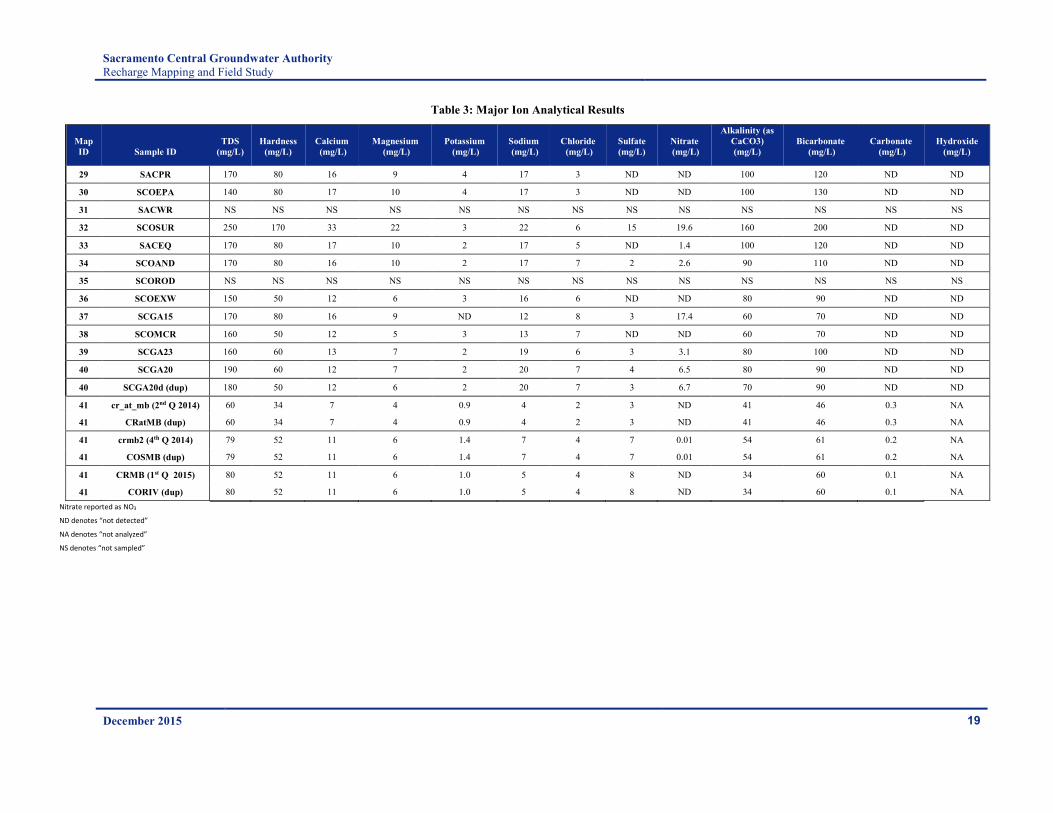
2.3.3 Analytical Samples were submitted to accredited analytical laboratories, and the analytical reports are provided in Appendix B. The major ion analysis was performed by Fruit Growers Laboratory (FGL), a laboratory fully accredited by the Environmental Laboratory Accreditation Program for drinking water and groundwater. Standard methodologies (Analytical methods: SM2540CE, SM2320B, EPA 300, and EPA 200.7) were used to analyze for cations and anions, and FGL reported that analysis quality control for each EPA method was within the established criteria. The cation and anion results are summarized in Table 3.
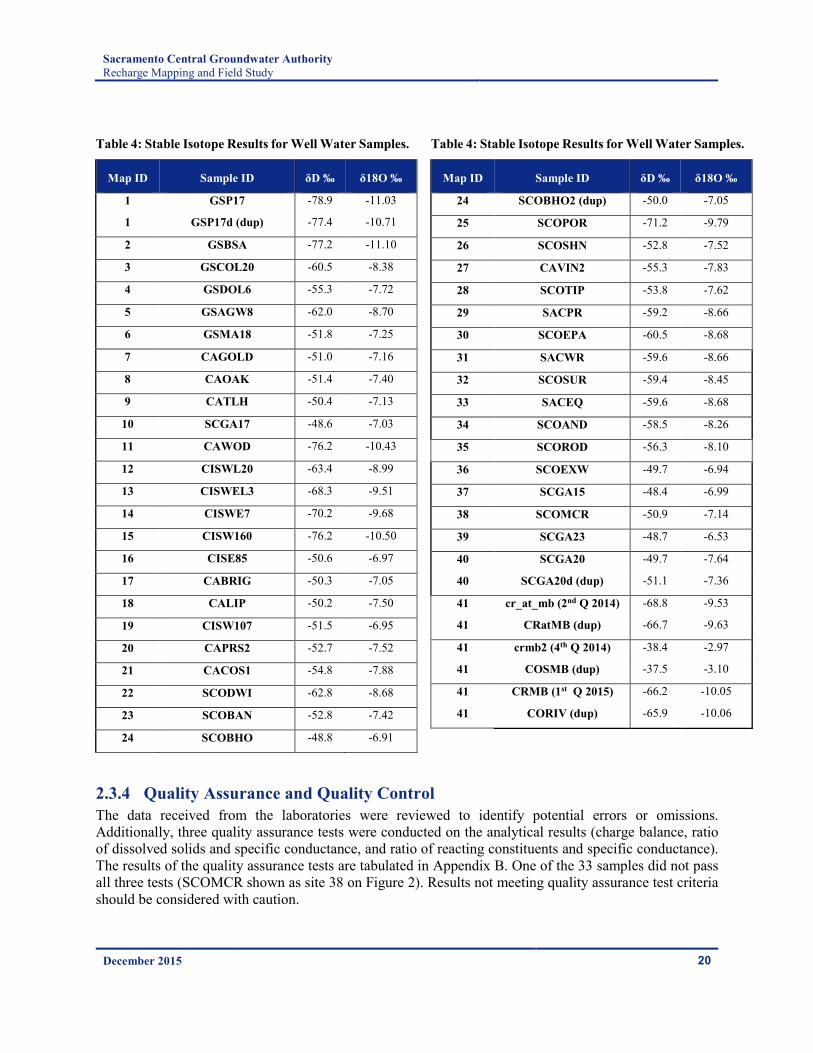
The stable isotope samples were analyzed by the UC Davis Stable Isotope Facility (SIF). SIF used a Laser Water Isotope Analyzer V2 to analyze a ratio of 18O and D. Each sample is injected 8 times, the first 4 injections are discarded to eliminate memory effects and an average of the remaining injections is used for the analysis. An International Atomic Energy Agency standard reference material, in this case VSMOW, was used to standardize the samples. Table 4 summarizes the stable isotope results.
December 2015 17
Sacramento Central Groundwater Authority Recharge Mapping and Field Study
41 CORIV (dup) 80 52 11 6 1.0 5 4 8 ND 34 60 0.1 NA Nitrate reported as NO3
ND denotes “not detected”
NA denotes “not analyzed”
NS denotes “not sampled”
December 2015 19
Sacramento Central Groundwater Authority Recharge Mapping and Field Study
Table 4: Stable Isotope Results for Well Water Samples.
Map ID Sample ID δD ‰ δ18O ‰
1 GSP17 -78.9 -11.03
1 GSP17d (dup) -77.4 -10.71
2 GSBSA -77.2 -11.10
3 GSCOL20 -60.5 -8.38
4 GSDOL6 -55.3 -7.72
5 GSAGW8 -62.0 -8.70
6 GSMA18 -51.8 -7.25
7 CAGOLD -51.0 -7.16
8 CAOAK -51.4 -7.40
9 CATLH -50.4 -7.13
10 SCGA17 -48.6 -7.03
11 CAWOD -76.2 -10.43
12 CISWL20 -63.4 -8.99
13 CISWEL3 -68.3 -9.51
14 CISWE7 -70.2 -9.68
15 CISW160 -76.2 -10.50
16 CISE85 -50.6 -6.97
17 CABRIG -50.3 -7.05
18 CALIP -50.2 -7.50
19 CISW107 -51.5 -6.95
20 CAPRS2 -52.7 -7.52
21 CACOS1 -54.8 -7.88
22 SCODWI -62.8 -8.68
23 SCOBAN -52.8 -7.42
24 SCOBHO -48.8 -6.91
Table 4: Stable Isotope Results for Well Water Samples.
Map ID Sample ID δD ‰ δ18O ‰
24 SCOBHO2 (dup) -50.0 -7.05
25 SCOPOR -71.2 -9.79
26 SCOSHN -52.8 -7.52
27 CAVIN2 -55.3 -7.83
28 SCOTIP -53.8 -7.62
29 SACPR -59.2 -8.66
30 SCOEPA -60.5 -8.68
31 SACWR -59.6 -8.66
32 SCOSUR -59.4 -8.45
33 SACEQ -59.6 -8.68
34 SCOAND -58.5 -8.26
35 SCOROD -56.3 -8.10
36 SCOEXW -49.7 -6.94
37 SCGA15 -48.4 -6.99
38 SCOMCR -50.9 -7.14
39 SCGA23 -48.7 -6.53
40 SCGA20 -49.7 -7.64
40 SCGA20d (dup) -51.1 -7.36
41 cr_at_mb (2nd Q 2014) -68.8 -9.53
41 CRatMB (dup) -66.7 -9.63
41 crmb2 (4th Q 2014) -38.4 -2.97
41 COSMB (dup) -37.5 -3.10
41 CRMB (1st Q 2015) -66.2 -10.05
41 CORIV (dup) -65.9 -10.06
2.3.4 Quality Assurance and Quality Control The data received from the laboratories were reviewed to identify potential errors or omissions. Additionally, three quality assurance tests were conducted on the analytical results (charge balance, ratio of dissolved solids and specific conductance, and ratio of reacting constituents and specific conductance). The results of the quality assurance tests are tabulated in Appendix B. One of the 33 samples did not pass all three tests (SCOMCR shown as site 38 on Figure 2). Results not meeting quality assurance test criteria should be considered with caution.
December 2015 20
Sacramento Central Groundwater Authority Recharge Mapping and Field Study
• Anion-cation charge balance was calculated using concentrations of major anions and cations, and the difference between the two calculated as a percentage. The laboratory aims to have most samples within +/-5 %, and re-analyzes those samples that exceed +/-5 %, but overall uses a +/-10 % analytical acceptance limit. The cation/anion balance differences exceeded 5 % for 10 of the 33 samples (30 %), but did not exceed 10 % for any of the samples.
• The ratio of the calculated sum of dissolved solids (mg/L) to specific conductance was calculated to check analytical reliability. The sum of dissolved solids divided by the specific conductance should fall within the range of 0.55 to 0.81.23 Twenty of the 33 samples (61 %) did not fall within this range.
• The ratio of the sum of reacting cations (meq/L) to 0.01 times specific conductance, as well as the sum of reacting anions (meq/L) to 0.01 times specific conductance, should be with the range of 0.92 to 1.24.24 Of the 33 samples, three (9 %) do not fall within the range for cations, and four (12 %) do not fall within the range for anions.
Six field duplicates (three well samples and three surface water samples) were collected and analyzed for quality assurance purposes. The duplicate sample results agreed, had differences within 10 %, or had differences within the PQL (Practical Quantitation Limit) of the constituents analyzed.
2.4 Results Stable isotope and ion data were utilized to improve understanding of the distribution of water sources that provide groundwater recharge in the Study Area. Groundwater-flow patterns, the stable isotope composition, and water quality characteristics of well-water samples were utilized to delineate areas recharged predominantly by local rainfall from areas recharged by seepage from rivers.
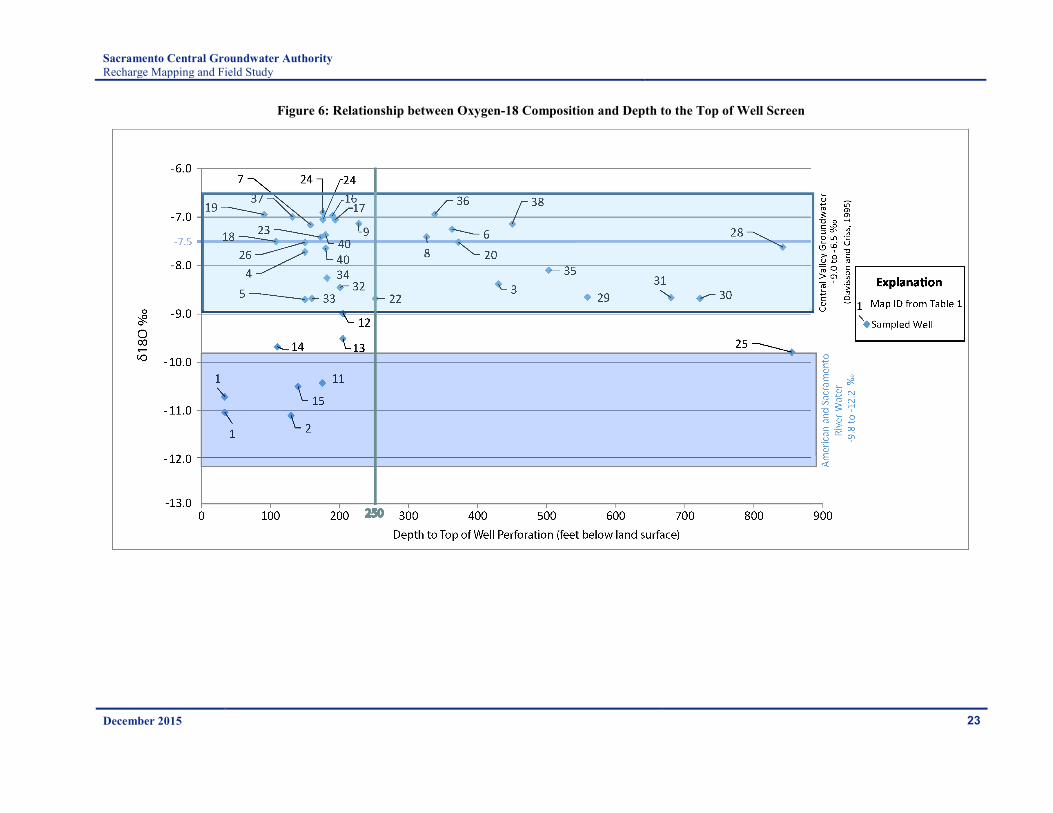
2.4.1 Isotopes The δ18O values of the well-water samples are related to well depth and location. Figure 6 shows the relationship between δ18O values and depth to the top of the well screen (the top of the perforated interval of the well casing). The samples within the range of local rainfall are mostly from shallow wells and have perforated intervals that begin less than 250 feet below land surface. The most depleted samples (most negative δ18O values below -9 ‰) are from similarly shallow wells (less than 250 feet). Well-water samples from deeper wells (wells having perforated intervals that begin at depths greater than 250 feet below land surface) show a general trend where relative to local rainfall the δ18O values decrease (become more negative) with increasing depth to the top of the well screen.
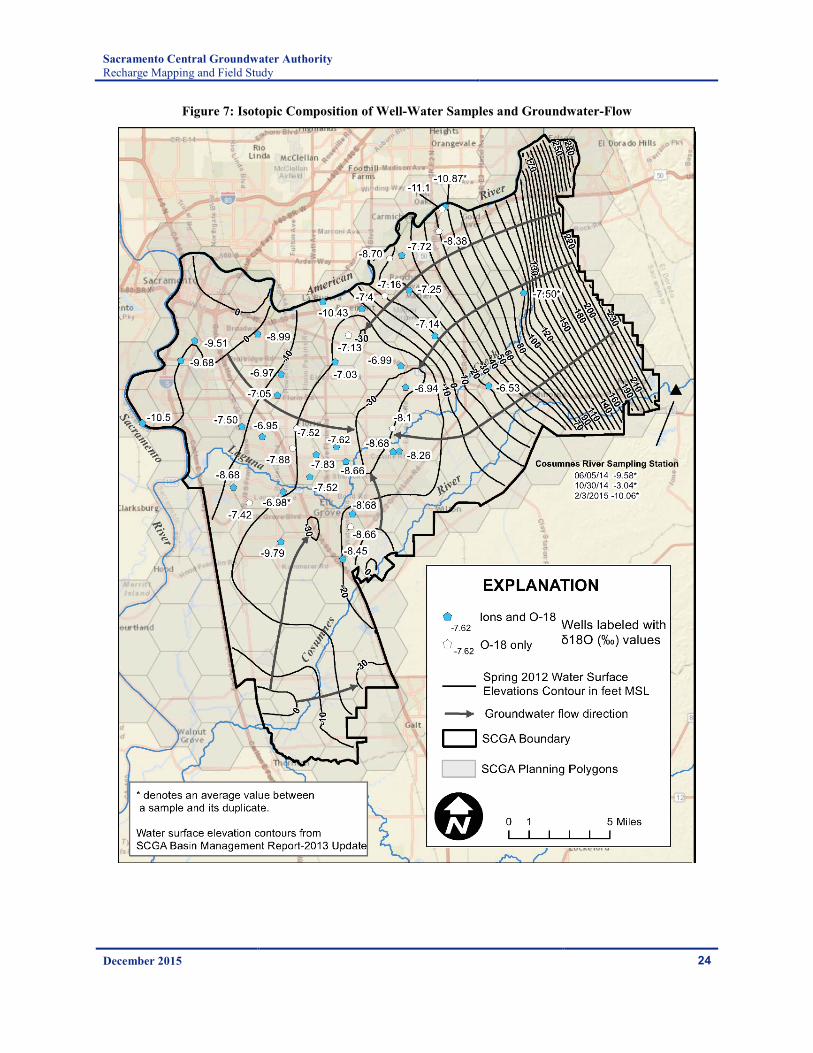
The geographic distribution of well-water sample δ18O values are mapped in Figure 7 with lines of equal groundwater elevations and inferred groundwater flow paths. In general, groundwater movement is from the foothills down-gradient to the southwest, and from the valley floor to the east and northeast towards pumping depressions located in central portions of the Study Area. The most depleted (most negative) well-water samples are from shallow wells in which screens begin within 150 feet of land surface sampled next to the American and Sacramento Rivers, indicating that they are most directly influenced by seepage (δ18O values that range from -10.5 to -11.1 ‰). South of the confluence of the American and Sacramento rivers, seepage from the rivers moves southeast with groundwater and mixes with the relatively enriched (more positive) groundwater recharged by rainfall, producing a general eastward increase in δ18O values (the δ18O
23 Friedman, L.C., and Erdmann, D.E., 1982, “Quality assurance practices for the chemical and biological analyses of water and fluvial sediments,” U.S. Geological Survey Techniques of Water-Resources Investigations, book 5, chap. A6, 181 p. 24 Ibid.
December 2015 21
Sacramento Central Groundwater Authority Recharge Mapping and Field Study
values increase from near -11 ‰ to about -7 to -8 ‰). Well-water samples collected from sites located near Laguna Creek and the Cosumnes River have δ18O values that range from about -8 to almost -9 ‰, and suggests groundwater in these areas are influenced by seepage of run-off from these surface water features.
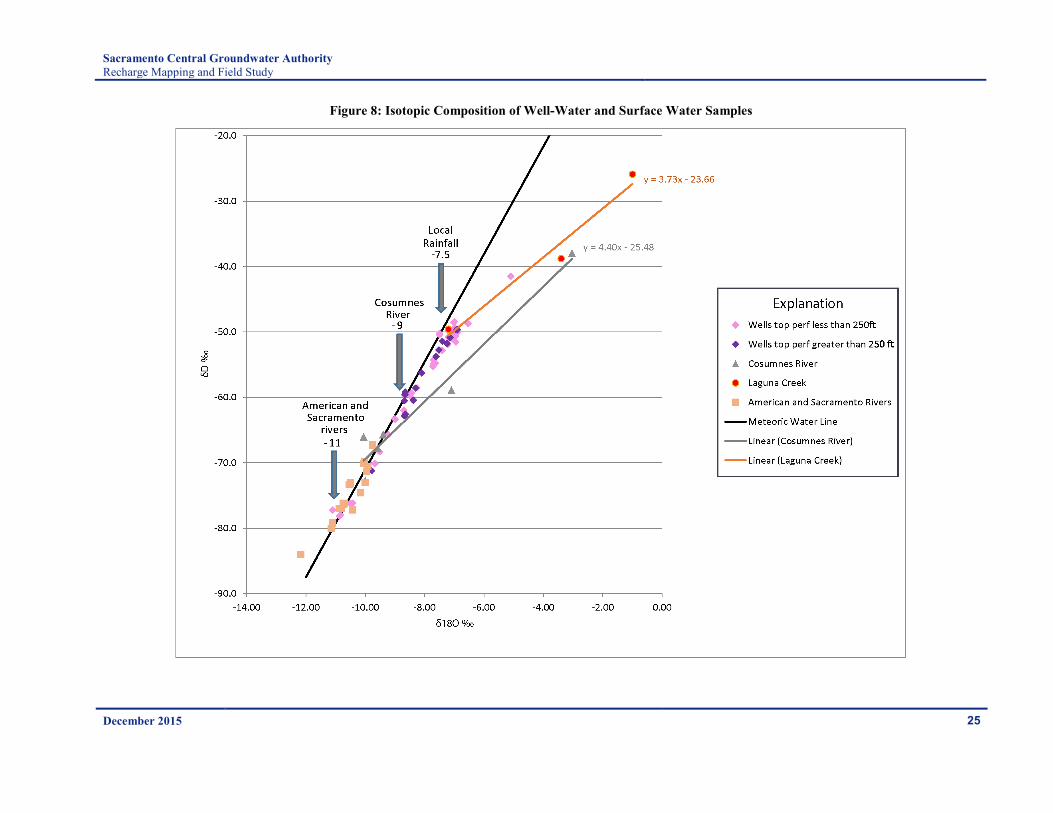
Isotope data is also shown graphically with δ18O plotted on the x (horizontal) axis and δD plotted on the y (vertical) axis (Figure 8). In this type of graph, the data points for precipitation falling at varying distances from the ocean typically plot on a line near the meteoric water line (MWL).25 Data points that plot close to the origin (more negative) represent precipitation farther inland and at higher elevation than the data points that plot farther from the origin and are more positive. In the Study Area, the American River and Sacramento River samples plot closest to the origin because the runoff originates furthest inland and at the highest elevations. The runoff in the Cosumnes River originates farther to the west and at relatively lower elevations, and therefore plots approximately mid-way on the MWL between high-elevation run-off and local rainfall.
In Figure 8, the well-water samples are grouped by depth to the top of the well perforations. Wells perforated 250 feet or less below land surface are generally more influenced by local rainfall and river seepage than the deeper wells (perforated intervals greater than 250 feet below land surface). For example, all but one of the well-water samples that plot within the δ18O range of the American and Sacramento River samples have shallow screens. Water samples from the other shallow and deep wells all had less negative δ18O values than the river samples, and these sample values were within the range of Cosumnes River and local rainfall. Some of the water samples plot farther to the right of the MWL, indicating that they were influenced by partial evaporation. For example, the Laguna Creek and Cosumnes River samples that plot farther to the right of the MWL were dry-season samples and therefore influenced by evaporation.26 The well water samples having δ18O values that range from -7.5 to -6.5 ‰ are probably influenced by rainfall recharge and runoff that has been partially evaporated.
25 Ibid. [4] 26 Ibid. [7]
December 2015 22
Sacramento Central Groundwater Authority Recharge Mapping and Field Study
Figure 6: Relationship between Oxygen-18 Composition and Depth to the Top of Well Screen
December 2015 23
Sacramento Central Groundwater Authority Recharge Mapping and Field Study
Figure 7: Isotopic Composition of Well-Water Samples and Groundwater-Flow
December 2015 24
Sacramento Central Groundwater Authority Recharge Mapping and Field Study
Figure 8: Isotopic Composition of Well-Water and Surface Water Samples
December 2015 25
Sacramento Central Groundwater Authority Recharge Mapping and Field Study
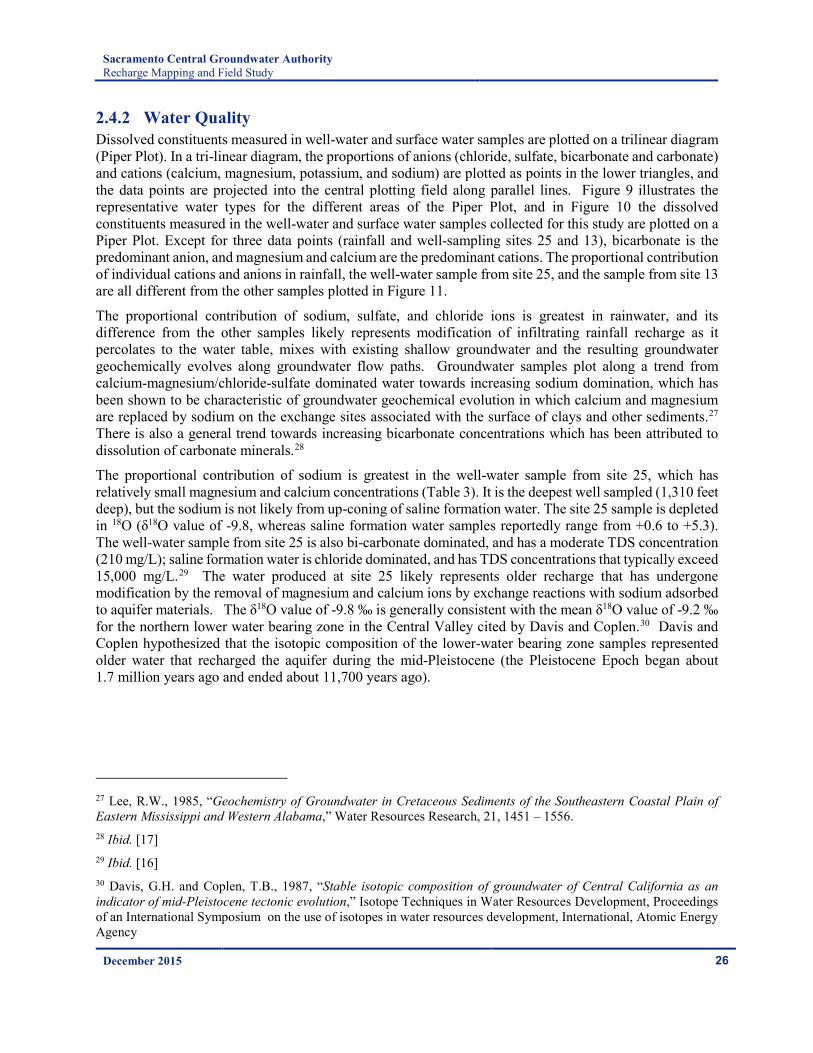
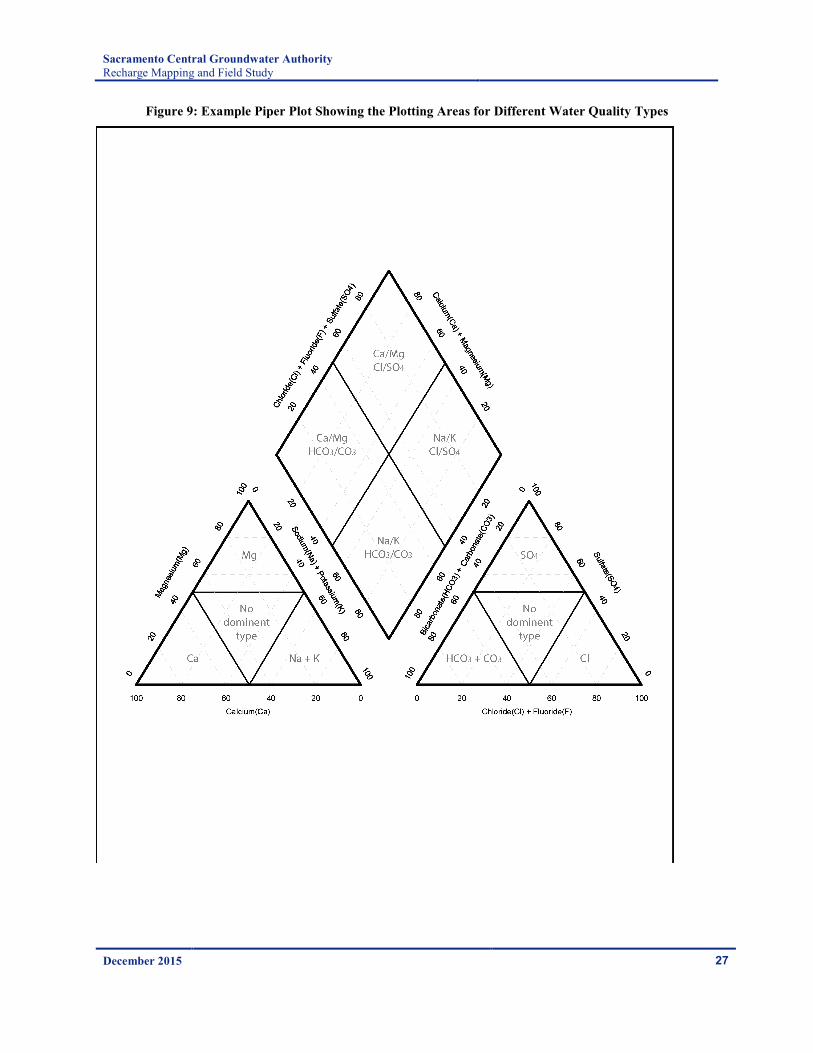
2.4.2 Water Quality Dissolved constituents measured in well-water and surface water samples are plotted on a trilinear diagram (Piper Plot). In a tri-linear diagram, the proportions of anions (chloride, sulfate, bicarbonate and carbonate) and cations (calcium, magnesium, potassium, and sodium) are plotted as points in the lower triangles, and the data points are projected into the central plotting field along parallel lines. Figure 9 illustrates the representative water types for the different areas of the Piper Plot, and in Figure 10 the dissolved constituents measured in the well-water and surface water samples collected for this study are plotted on a Piper Plot. Except for three data points (rainfall and well-sampling sites 25 and 13), bicarbonate is the predominant anion, and magnesium and calcium are the predominant cations. The proportional contribution of individual cations and anions in rainfall, the well-water sample from site 25, and the sample from site 13 are all different from the other samples plotted in Figure 11.
The proportional contribution of sodium, sulfate, and chloride ions is greatest in rainwater, and its difference from the other samples likely represents modification of infiltrating rainfall recharge as it percolates to the water table, mixes with existing shallow groundwater and the resulting groundwater geochemically evolves along groundwater flow paths. Groundwater samples plot along a trend from calcium-magnesium/chloride-sulfate dominated water towards increasing sodium domination, which has been shown to be characteristic of groundwater geochemical evolution in which calcium and magnesium are replaced by sodium on the exchange sites associated with the surface of clays and other sediments.27 There is also a general trend towards increasing bicarbonate concentrations which has been attributed to dissolution of carbonate minerals.28
The proportional contribution of sodium is greatest in the well-water sample from site 25, which has relatively small magnesium and calcium concentrations (Table 3). It is the deepest well sampled (1,310 feet deep), but the sodium is not likely from up-coning of saline formation water. The site 25 sample is depleted in 18O (δ18O value of -9.8, whereas saline formation water samples reportedly range from +0.6 to +5.3). The well-water sample from site 25 is also bi-carbonate dominated, and has a moderate TDS concentration (210 mg/L); saline formation water is chloride dominated, and has TDS concentrations that typically exceed 15,000 mg/L.29 The water produced at site 25 likely represents older recharge that has undergone modification by the removal of magnesium and calcium ions by exchange reactions with sodium adsorbed to aquifer materials. The δ18O value of -9.8 ‰ is generally consistent with the mean δ18O value of -9.2 ‰ for the northern lower water bearing zone in the Central Valley cited by Davis and Coplen.30 Davis and Coplen hypothesized that the isotopic composition of the lower-water bearing zone samples represented older water that recharged the aquifer during the mid-Pleistocene (the Pleistocene Epoch began about 1.7 million years ago and ended about 11,700 years ago).
27 Lee, R.W., 1985, “Geochemistry of Groundwater in Cretaceous Sediments of the Southeastern Coastal Plain of Eastern Mississippi and Western Alabama,” Water Resources Research, 21, 1451 – 1556. 28 Ibid. [17] 29 Ibid. [16] 30 Davis, G.H. and Coplen, T.B., 1987, “Stable isotopic composition of groundwater of Central California as an indicator of mid-Pleistocene tectonic evolution,” Isotope Techniques in Water Resources Development, Proceedings of an International Symposium on the use of isotopes in water resources development, International, Atomic Energy Agency
December 2015 26
Sacramento Central Groundwater Authority Recharge Mapping and Field Study
Figure 9: Example Piper Plot Showing the Plotting Areas for Different Water Quality Types
December 2015 27
Sacramento Central Groundwater Authority Recharge Mapping and Field Study
Figure 10: Piper Diagram of Well-Water Samples, Surface-Water Samples, and Reported Rainfall
December 2015 28
Sacramento Central Groundwater Authority Recharge Mapping and Field Study
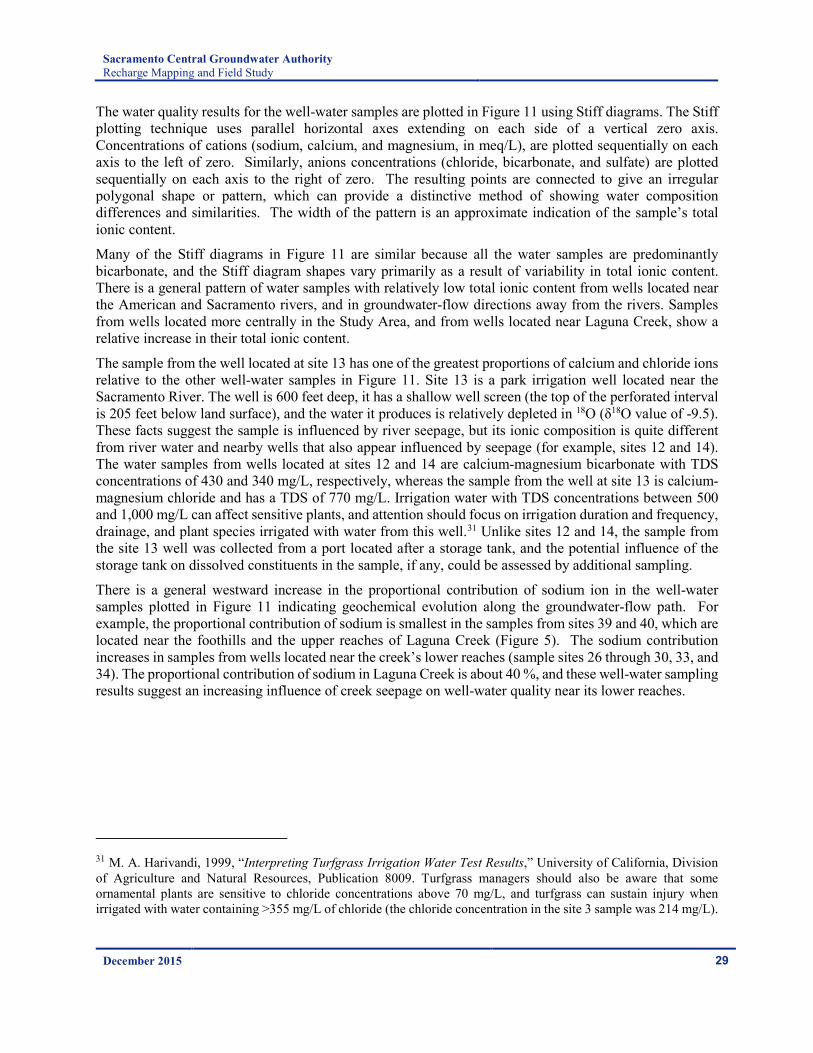
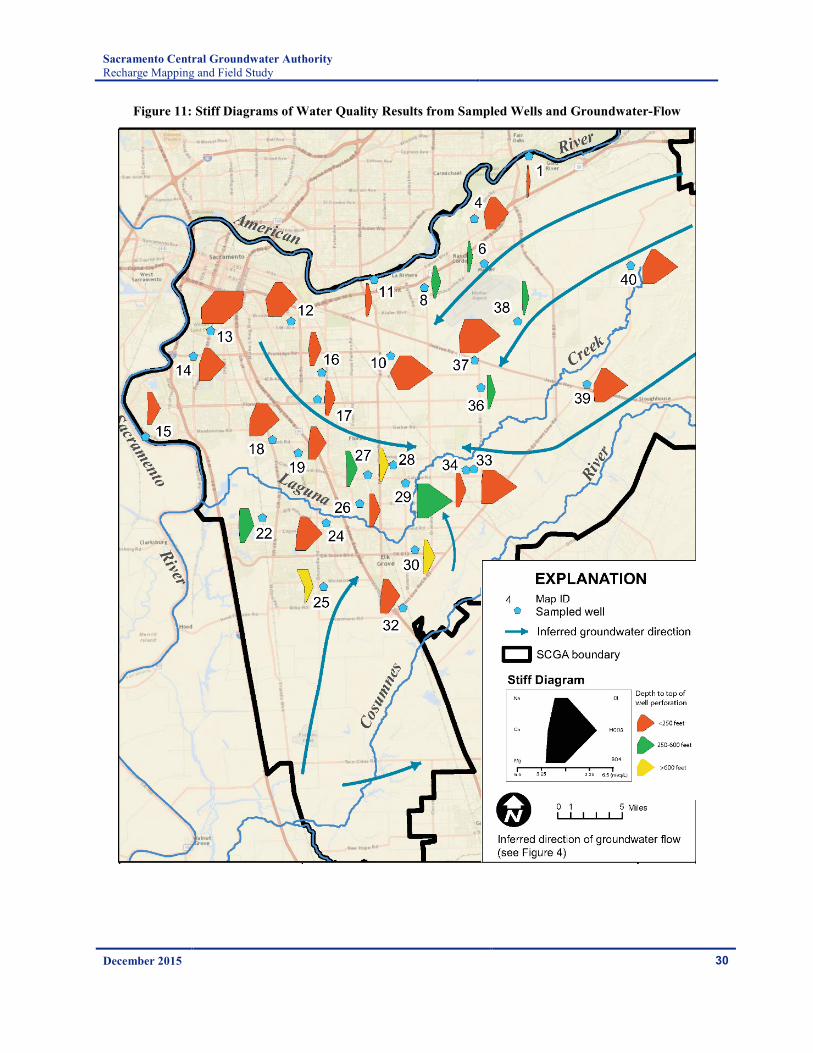
The water quality results for the well-water samples are plotted in Figure 11 using Stiff diagrams. The Stiff plotting technique uses parallel horizontal axes extending on each side of a vertical zero axis. Concentrations of cations (sodium, calcium, and magnesium, in meq/L), are plotted sequentially on each axis to the left of zero. Similarly, anions concentrations (chloride, bicarbonate, and sulfate) are plotted sequentially on each axis to the right of zero. The resulting points are connected to give an irregular polygonal shape or pattern, which can provide a distinctive method of showing water composition differences and similarities. The width of the pattern is an approximate indication of the sample’s total ionic content.
Many of the Stiff diagrams in Figure 11 are similar because all the water samples are predominantly bicarbonate, and the Stiff diagram shapes vary primarily as a result of variability in total ionic content. There is a general pattern of water samples with relatively low total ionic content from wells located near the American and Sacramento rivers, and in groundwater-flow directions away from the rivers. Samples from wells located more centrally in the Study Area, and from wells located near Laguna Creek, show a relative increase in their total ionic content.
The sample from the well located at site 13 has one of the greatest proportions of calcium and chloride ions relative to the other well-water samples in Figure 11. Site 13 is a park irrigation well located near the Sacramento River. The well is 600 feet deep, it has a shallow well screen (the top of the perforated interval is 205 feet below land surface), and the water it produces is relatively depleted in 18O (δ18O value of -9.5). These facts suggest the sample is influenced by river seepage, but its ionic composition is quite different from river water and nearby wells that also appear influenced by seepage (for example, sites 12 and 14). The water samples from wells located at sites 12 and 14 are calcium-magnesium bicarbonate with TDS concentrations of 430 and 340 mg/L, respectively, whereas the sample from the well at site 13 is calcium-magnesium chloride and has a TDS of 770 mg/L. Irrigation water with TDS concentrations between 500 and 1,000 mg/L can affect sensitive plants, and attention should focus on irrigation duration and frequency, drainage, and plant species irrigated with water from this well.31 Unlike sites 12 and 14, the sample from the site 13 well was collected from a port located after a storage tank, and the potential influence of the storage tank on dissolved constituents in the sample, if any, could be assessed by additional sampling.
There is a general westward increase in the proportional contribution of sodium ion in the well-water samples plotted in Figure 11 indicating geochemical evolution along the groundwater-flow path. For example, the proportional contribution of sodium is smallest in the samples from sites 39 and 40, which are located near the foothills and the upper reaches of Laguna Creek (Figure 5). The sodium contribution increases in samples from wells located near the creek’s lower reaches (sample sites 26 through 30, 33, and 34). The proportional contribution of sodium in Laguna Creek is about 40 %, and these well-water sampling results suggest an increasing influence of creek seepage on well-water quality near its lower reaches.
31 M. A. Harivandi, 1999, “Interpreting Turfgrass Irrigation Water Test Results,” University of California, Division of Agriculture and Natural Resources, Publication 8009. Turfgrass managers should also be aware that some ornamental plants are sensitive to chloride concentrations above 70 mg/L, and turfgrass can sustain injury when irrigated with water containing >355 mg/L of chloride (the chloride concentration in the site 3 sample was 214 mg/L).
December 2015 29
Sacramento Central Groundwater Authority Recharge Mapping and Field Study
Figure 11: Stiff Diagrams of Water Quality Results from Sampled Wells and Groundwater-Flow
December 2015 30
Sacramento Central Groundwater Authority Recharge Mapping and Field Study
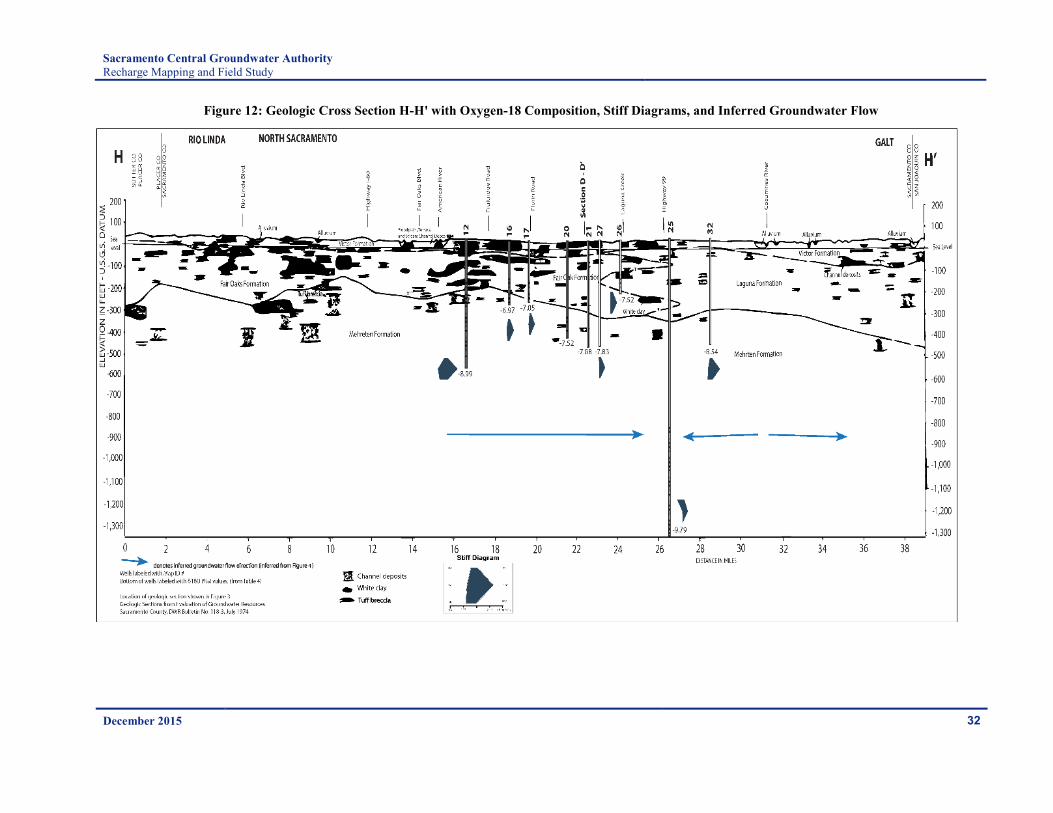
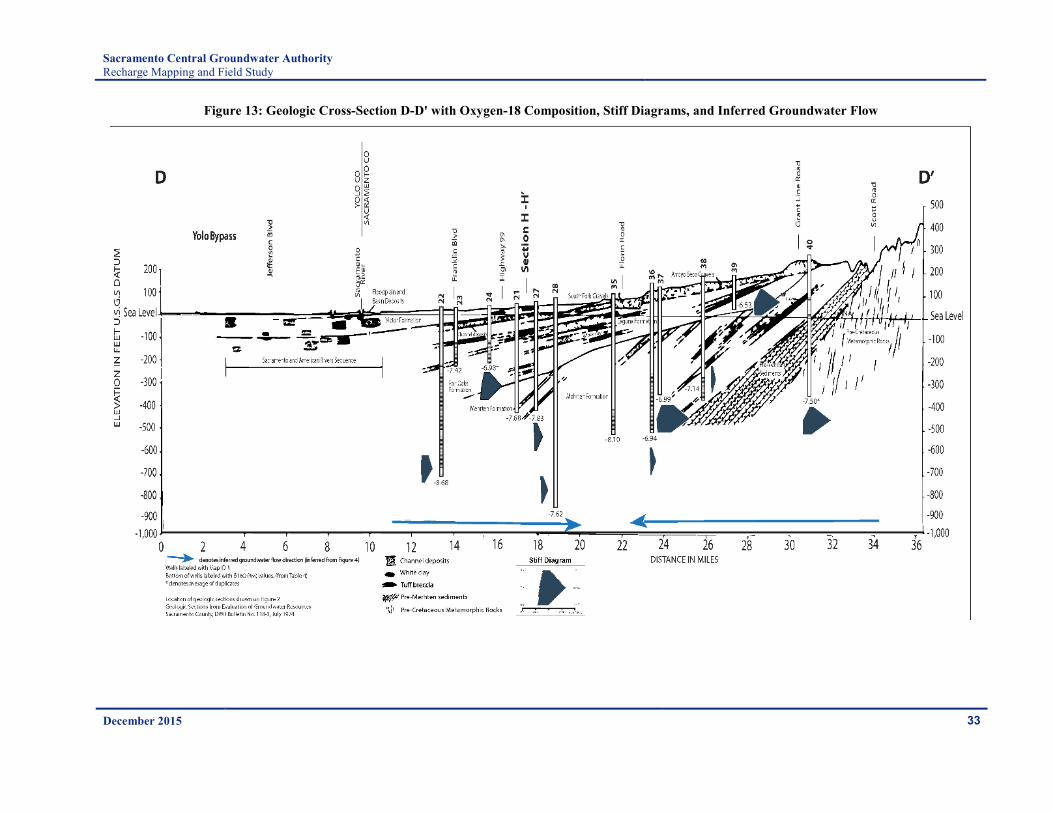
In Figure 12 and Figure 13, the water quality and isotope data for select wells is projected onto two sections. The geologic information was published previously by CDWR,32 and the well locations, well construction information, sampling results, and groundwater-flow directions were added for this study. The H-H’ section (Figure 12) is oriented approximately north to south, and spans the distance between the American and Cosumnes rivers (Figure 5). The D-D’ section (Figure 12) is approximately oriented from southwest to northeast, and is located approximately mid-way between the American and Cosumnes rivers (Figure 5). The δ18O values and Stiff diagrams are posted near the bottom of the wells that were sampled.
In the H-H’ section (Figure 12), groundwater-flow is toward a pumping depression generally located beneath Highway 99. Groundwater-flow is northward (to the left) from beneath the Cosumnes River and towards the pumping depression, and southward (to the right) from beneath the American River and towards the pumping depression. The δ18O values of well-water samples in this section generally become more negative with well depth. In the D-D’ section (Figure 13), the horizontal direction of groundwater-flow is toward the same general pumping depression but in this section it is located beneath Florin Road. Groundwater-flow is westward (to the left) away from the foothills and towards the depression, and eastward (to the right) away from beneath the Sacramento River and towards the depression. The aquifer thickness decreases toward the foothills, and the well screen depths approach the older semi-consolidated and consolidated sediments and rocks. The δ18O values are generally greatest (least negative) in the foothills, and these same wells produce water with the greatest total ionic content.
The cross sections indicate three factors affecting the groundwater quality and isotopic composition of the water samples; the influence of surface water, local rainfall, and relatively deep, older groundwater that probably recharged the aquifer during the Pleistocene Epoch (began approximately 1.7 million years ago and ended approximately 11,700 years ago). In Figure 12, the isotopic composition of samples from deep wells 12, 21, 25, 27 and 32 are depleted (more negative) relative to the shallower samples. The sample from well 25 likely represents an end-member for deep well samples similar to those discussed by Davis and Coplen33 that are most influenced by precipitation recharge during the Pleistocene. Samples from shallower wells are influenced primarily by local rainfall recharge with values varying from -7.52 to -6.97 ‰. Similarly, Figure 13 represents the predominant influence of rainfall for samples from wells generally shallower than 400 feet and having isotope values ranging from -6.53 to -7.50‰. Deeper wells (well 22, 28, and 35) are more depleted (more negative) and likely influenced by Pleistocene precipitation. The isotopic composition of the sample from well 36 is more enriched (less negative) relative to the sample from well 35, most likely because well 36 has a shallower screen.
32 Ibid. [13] 33 Ibid. [24]
December 2015 31
Sacramento Central Groundwater Authority Recharge Mapping and Field Study
Figure 12: Geologic Cross Section H-H' with Oxygen-18 Composition, Stiff Diagrams, and Inferred Groundwater Flow
December 2015 32
Sacramento Central Groundwater Authority Recharge Mapping and Field Study
Figure 13: Geologic Cross-Section D-D' with Oxygen-18 Composition, Stiff Diagrams, and Inferred Groundwater Flow
December 2015 33
Sacramento Central Groundwater Authority Recharge Mapping and Field Study
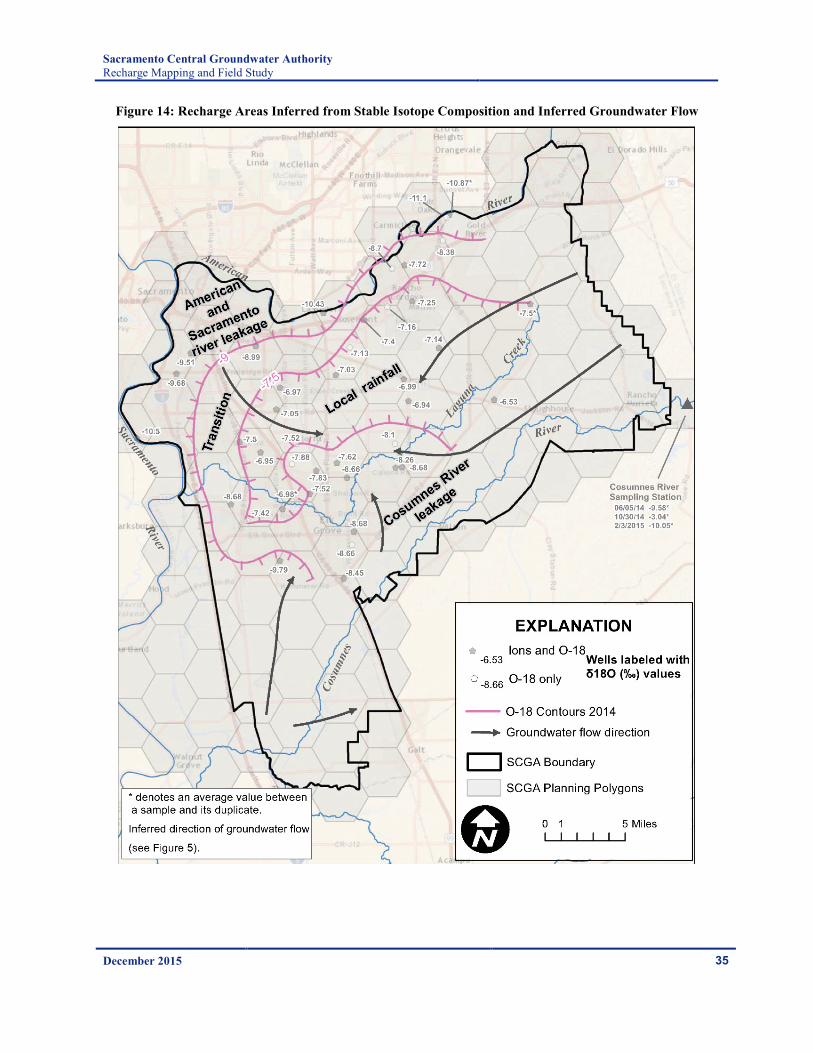
2.5 Implications for Recharge Sources The δ18O values of the well water samples were contoured, and the contour intervals selected to correspond with representative values for local rainfall (assumed δ18O value of -7.5 ‰) and seepage from the Cosumnes River (assumed δ18O value of -9 ‰). The results are mapped in Figure 14, and the contours delineate a large portion of the Study Area as being underlain by groundwater with δ18O values greater than or equal to -7.5 ‰. Groundwater beneath this subarea is isotopically similar to local rainfall, and is therefore likely recharged by infiltration of local rainfall and seepage of storm water run-off in Laguna Creek and other similar water courses. The δ18O values less than -9 ‰ are measured in samples from wells located near the American and Sacramento Rivers, indicating that groundwater in this subarea is influenced by river seepage. Adjacent to the upper half of the American River, the width of this subarea is narrow but it expands adjacent to the lower half of the river and its confluence with the Sacramento River. The number of wells and volume of groundwater extracted along the upper reach is about ten times greater than in the larger portion of the subarea near its confluence with the Sacramento River. Wells therefore capture and extract most of the seepage that occurs along the upper reaches before it can migrate further distances beneath the Study Area. In between these two subareas the δ18O values are less than -7.5 ‰ but greater than -9 ‰. This isotopic signature can be indicative of seepage from the Cosumnes River or identify the transition zone between river seepage and groundwater recharged by local rainfall.
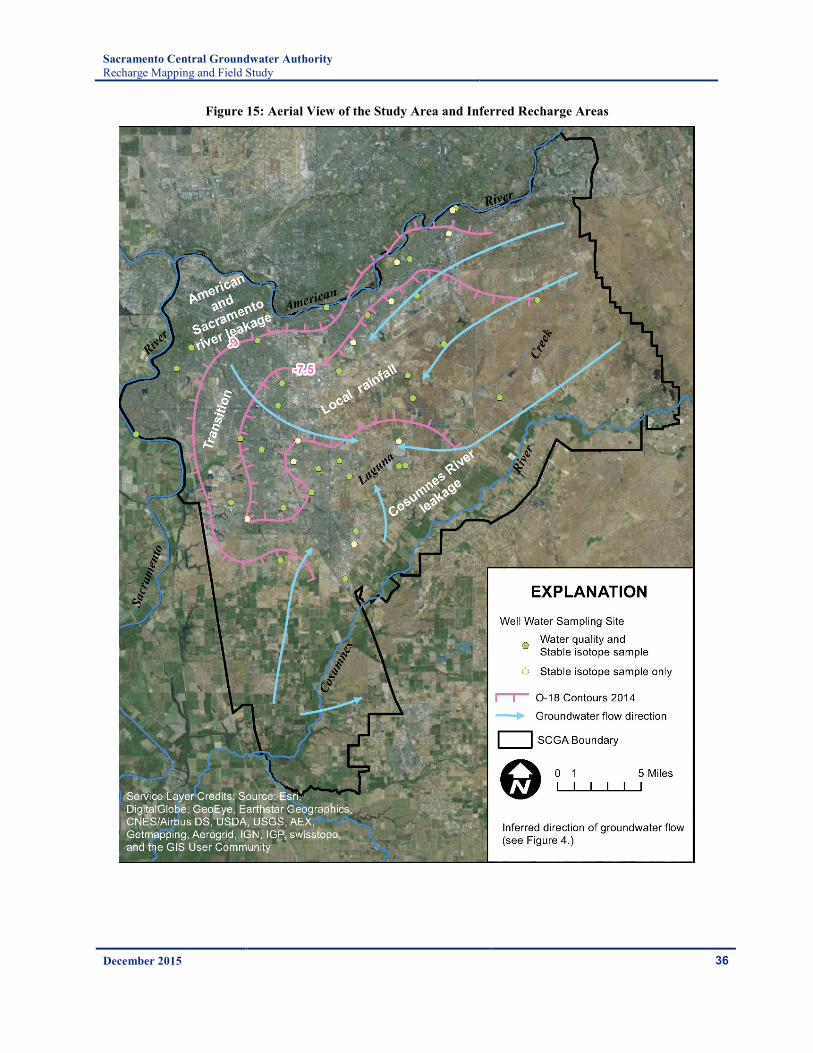
The subareas identified in Figure 14 are generally consistent with land use patterns and the inferred distribution of impervious and pervious surfaces identified in aerial photographs (Figure 15) and with the recharge map presented in Figure 2. In the Study Area, groundwater extraction and use is high in the urban subareas which are mostly located adjacent to the American River. The extraction and use of groundwater in these areas induce seepage from the river. In contrast, most of the Study Area that is recharged primarily by infiltration of local rainfall and run-off are non-urban areas, distant from rivers, and have the greatest portion of pervious soil area. Recharge rates for the local rainfall areas are low in Figure 2 more due to limited applied water than to reduced recharge of precipitation.
December 2015 34
Sacramento Central Groundwater Authority Recharge Mapping and Field Study
Figure 14: Recharge Areas Inferred from Stable Isotope Composition and Inferred Groundwater Flow
December 2015 35
Sacramento Central Groundwater Authority Recharge Mapping and Field Study
Figure 15: Aerial View of the Study Area and Inferred Recharge Areas
December 2015 36
Sacramento Central Groundwater Authority Recharge Mapping and Field Study
3 Verification of Model A particle tracking analysis was performed to evaluate the extent of recharge in the groundwater basin from the river systems. The particle tracking results are discussed in relation to the field study results that characterize the sources of recharge based on the isotopic composition and water quality of rainfall, surface water, and groundwater. The comparison of the particle tracking analysis with the field study results is intended to help determine if there is a need to refine the model in the future to incorporate the new information gained from the field study. This section presents the methodology used for particle tracking and discusses the results based on the variability of recharge sources in the basin.
Methodology The SacIWRM Existing Conditions Baseline and the particle tracking model IGSM_PT were used to perform the particle tracking. The Existing Conditions Baseline simulates the current level of land and water use over a 105-year time period based on the hydrologic conditions of 1970-2004, repeated three times. IGSM_PT uses the output from the Existing Conditions Baseline for the flow field to track the particle paths.
Particle tracking was performed across the Study Area for each of the 40 wells sampled in the field study. Ten particles were released around each well. A backward tracking was applied to evaluate the sources of recharge to each well from the following potential recharge sources: American River, Sacramento River, Cosumnes River, surface recharge, and boundary recharge. Surface recharge represents local precipitation and applied water.
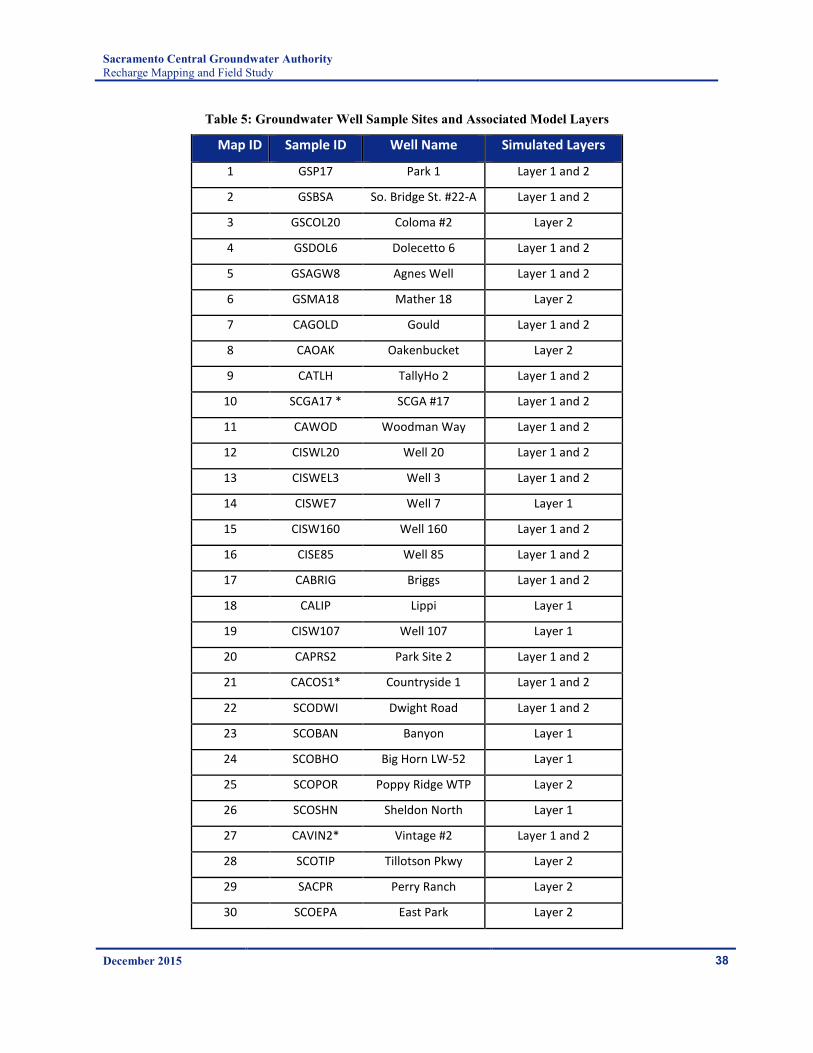
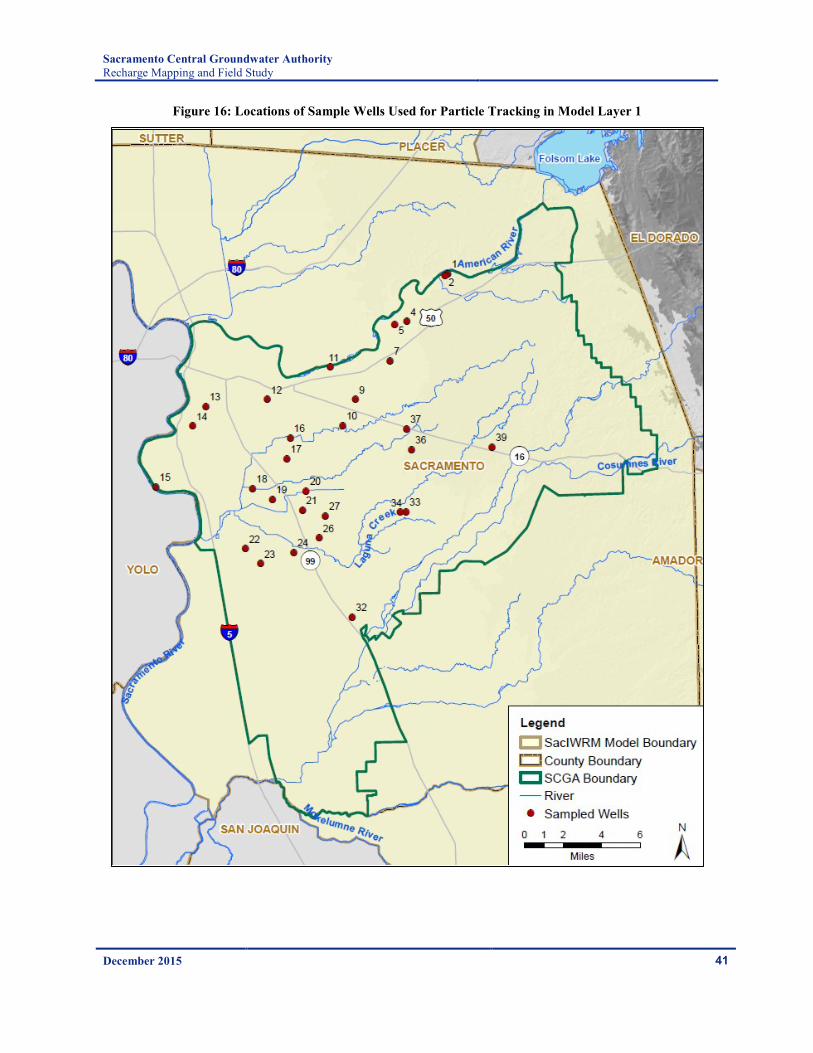
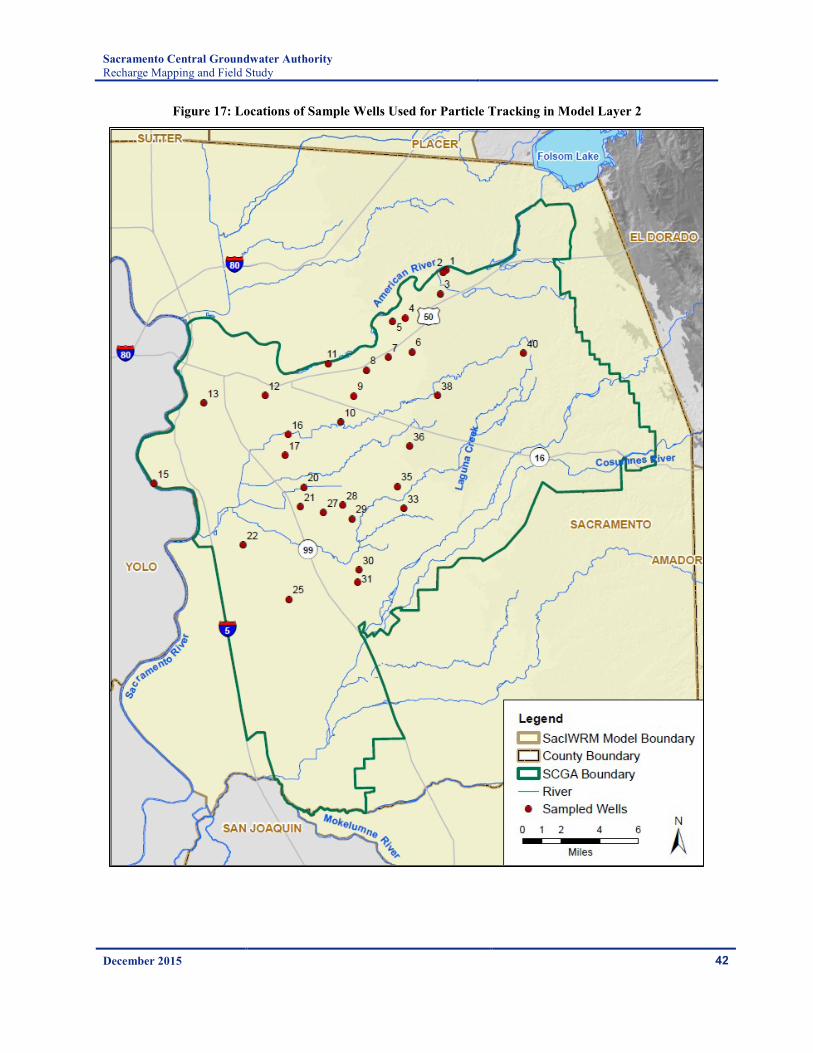
IGSM_PT uses two-dimensional flow paths generated as outputs from the Exiting Conditions Baseline to track each particle path. Before running the Existing Conditions Baseline, sampled model layers were identified to generate the appropriate velocity field. Well construction data (well screens and well depths) for the sampled wells were reviewed in relation to the model layer structure. This resulted in the identification of 10 wells (perforated generally within 270 feet below ground surface) in model layer 1 and 11 wells in model layer 2 (perforated generally greater than 280 feet below ground surface). Nineteen wells were identified with screens across both in model layers 1 and 2. Table 5 lists the sample well sites and the identified model layers for each site. The locations of the sampled wells in model layers 1 and 2 are shown in Figure 16 and Figure 17, respectively.
The Existing Conditions Baseline was simulated to generate velocity fields. IGSM_PT was run twice, one with particles released around the wells in model layer 1 (total of 29 wells) and the other with particles released around the wells in model layer 2 (total of 30 wells). At the end of the IGSM_PT simulations, the number of particles from each source was identified to evaluate the relative contribution of each of the five recharge sources to the well based on the following ranking:
• Major: 5 or more particles identified with a recharge source • Contributing: 3-4 particles identified with a recharge source • Minor/None: 0-2 particles identified with a recharge source
Note that while the reverse particle tracking analysis can provide a general sense of the sources of recharge, the percentages of particles should not be interpreted as the exact percent of source water reaching the well. This is due to temporal variability in recharge sources as well as limitations in flow modeling and particle tracking.
December 2015 37
Sacramento Central Groundwater Authority Recharge Mapping and Field Study
Table 5: Groundwater Well Sample Sites and Associated Model Layers
Map ID Sample ID Well Name Simulated Layers
1 GSP17 Park 1 Layer 1 and 2
2 GSBSA So. Bridge St. #22-A Layer 1 and 2
3 GSCOL20 Coloma #2 Layer 2
4 GSDOL6 Dolecetto 6 Layer 1 and 2
5 GSAGW8 Agnes Well Layer 1 and 2
6 GSMA18 Mather 18 Layer 2
7 CAGOLD Gould Layer 1 and 2
8 CAOAK Oakenbucket Layer 2
9 CATLH TallyHo 2 Layer 1 and 2
10 SCGA17 * SCGA #17 Layer 1 and 2
11 CAWOD Woodman Way Layer 1 and 2
12 CISWL20 Well 20 Layer 1 and 2
13 CISWEL3 Well 3 Layer 1 and 2
14 CISWE7 Well 7 Layer 1
15 CISW160 Well 160 Layer 1 and 2
16 CISE85 Well 85 Layer 1 and 2
17 CABRIG Briggs Layer 1 and 2
18 CALIP Lippi Layer 1
19 CISW107 Well 107 Layer 1
20 CAPRS2 Park Site 2 Layer 1 and 2
21 CACOS1* Countryside 1 Layer 1 and 2
22 SCODWI Dwight Road Layer 1 and 2
23 SCOBAN Banyon Layer 1
24 SCOBHO Big Horn LW-52 Layer 1
25 SCOPOR Poppy Ridge WTP Layer 2
26 SCOSHN Sheldon North Layer 1
27 CAVIN2* Vintage #2 Layer 1 and 2
28 SCOTIP Tillotson Pkwy Layer 2
29 SACPR Perry Ranch Layer 2
30 SCOEPA East Park Layer 2
December 2015 38
Sacramento Central Groundwater Authority Recharge Mapping and Field Study
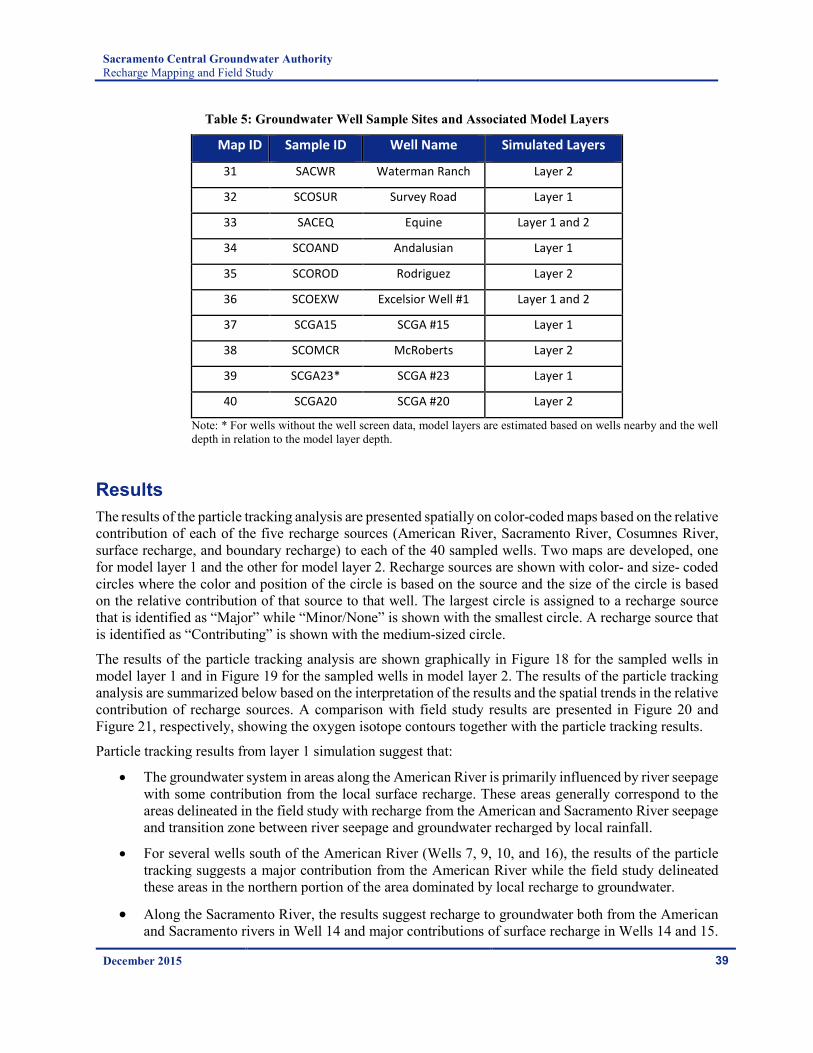
Table 5: Groundwater Well Sample Sites and Associated Model Layers
Map ID Sample ID Well Name Simulated Layers
31 SACWR Waterman Ranch Layer 2
32 SCOSUR Survey Road Layer 1
33 SACEQ Equine Layer 1 and 2
34 SCOAND Andalusian Layer 1
35 SCOROD Rodriguez Layer 2
36 SCOEXW Excelsior Well #1 Layer 1 and 2
37 SCGA15 SCGA #15 Layer 1
38 SCOMCR McRoberts Layer 2
39 SCGA23* SCGA #23 Layer 1
40 SCGA20 SCGA #20 Layer 2
Note: * For wells without the well screen data, model layers are estimated based on wells nearby and the well depth in relation to the model layer depth.
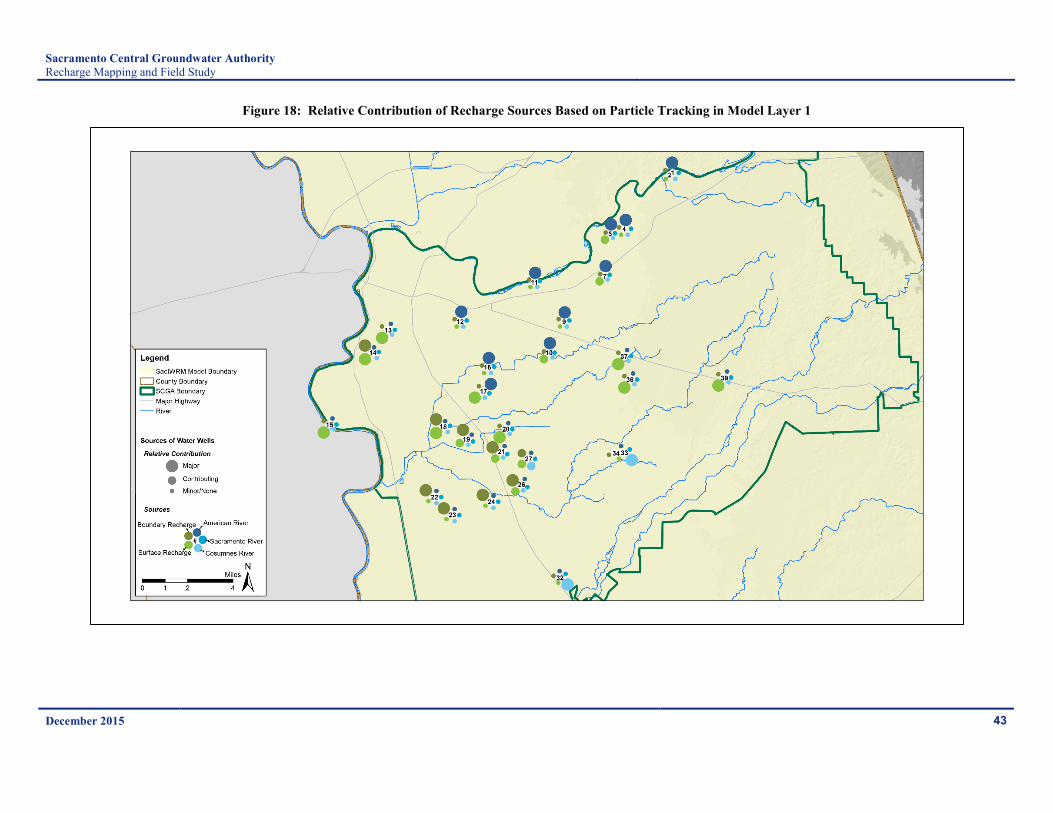
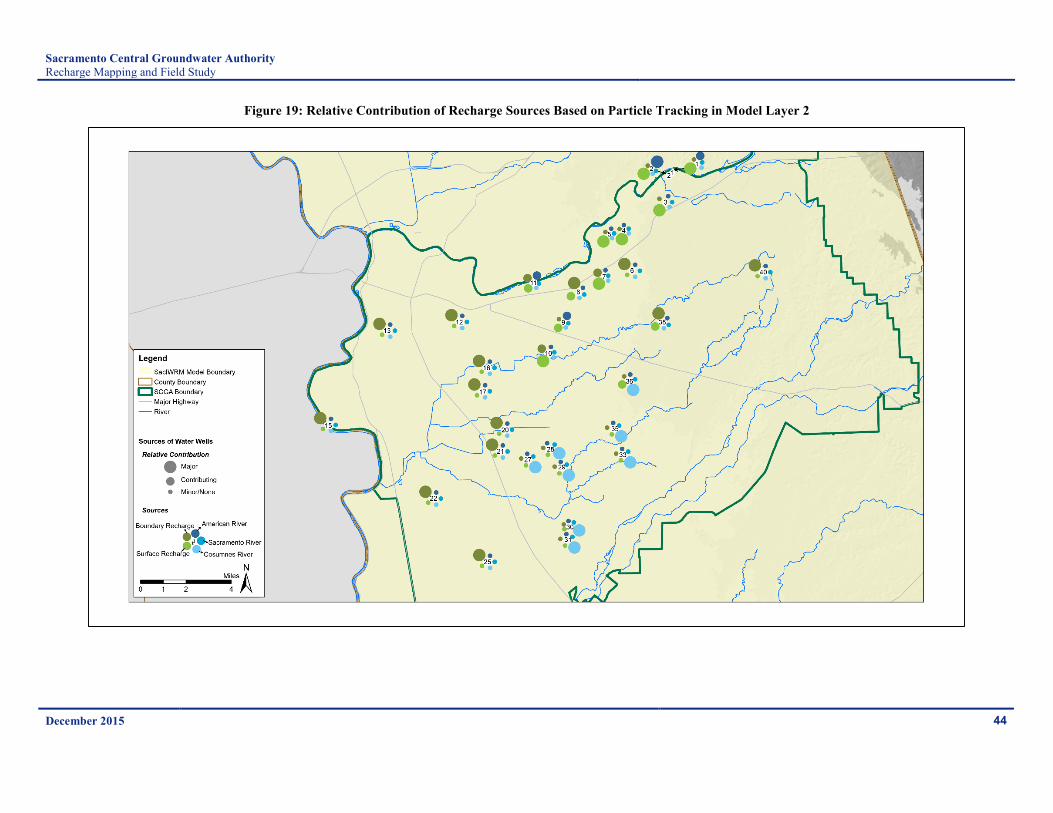
Results The results of the particle tracking analysis are presented spatially on color-coded maps based on the relative contribution of each of the five recharge sources (American River, Sacramento River, Cosumnes River, surface recharge, and boundary recharge) to each of the 40 sampled wells. Two maps are developed, one for model layer 1 and the other for model layer 2. Recharge sources are shown with color- and size- coded circles where the color and position of the circle is based on the source and the size of the circle is based on the relative contribution of that source to that well. The largest circle is assigned to a recharge source that is identified as “Major” while “Minor/None” is shown with the smallest circle. A recharge source that is identified as “Contributing” is shown with the medium-sized circle.
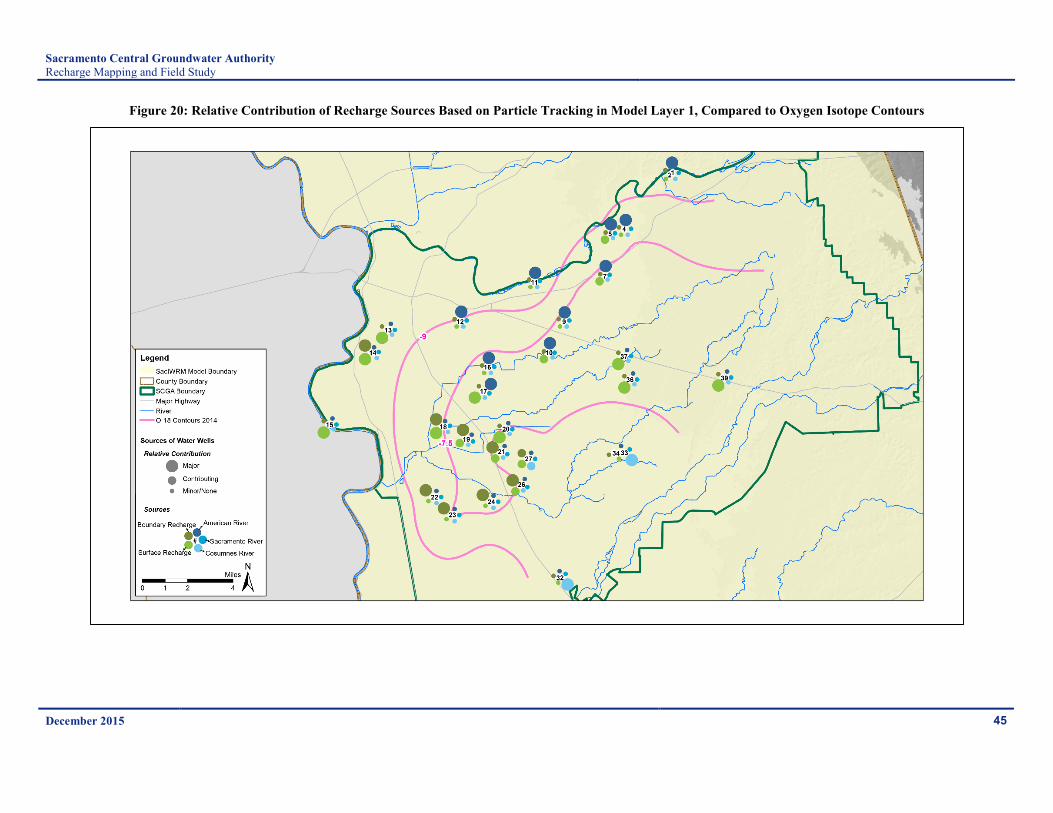
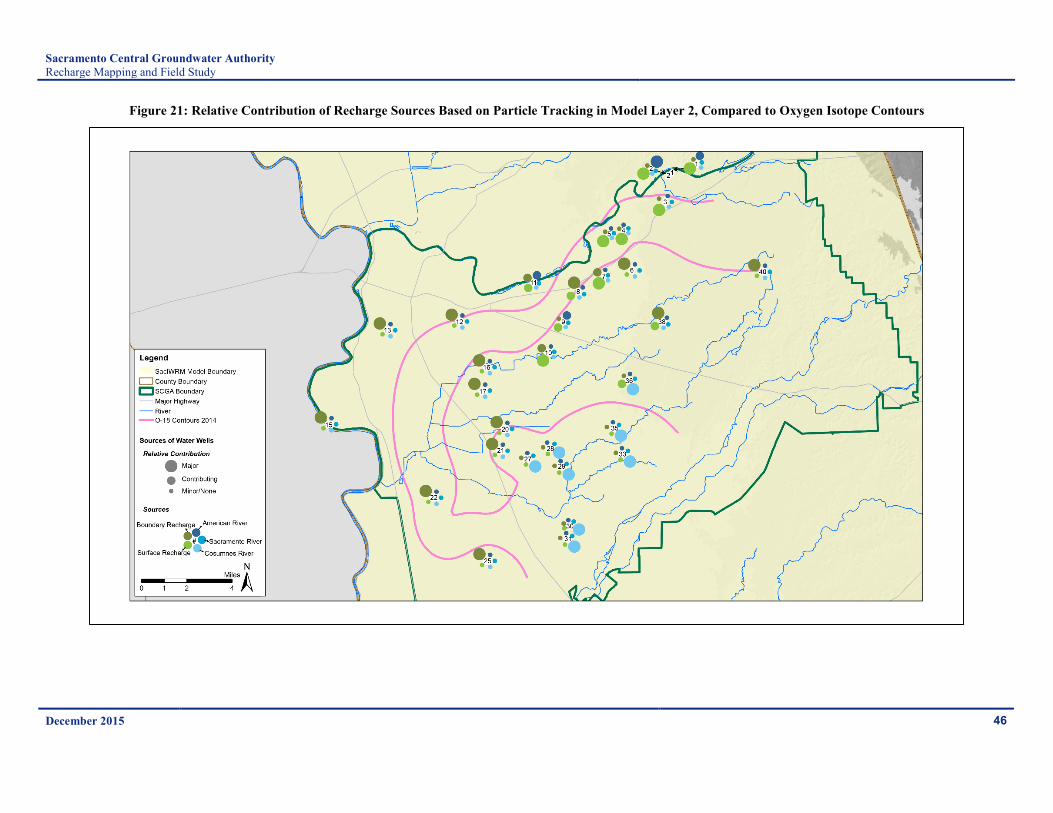
The results of the particle tracking analysis are shown graphically in Figure 18 for the sampled wells in model layer 1 and in Figure 19 for the sampled wells in model layer 2. The results of the particle tracking analysis are summarized below based on the interpretation of the results and the spatial trends in the relative contribution of recharge sources. A comparison with field study results are presented in Figure 20 and Figure 21, respectively, showing the oxygen isotope contours together with the particle tracking results.
Particle tracking results from layer 1 simulation suggest that:
• The groundwater system in areas along the American River is primarily influenced by river seepage with some contribution from the local surface recharge. These areas generally correspond to the areas delineated in the field study with recharge from the American and Sacramento River seepage and transition zone between river seepage and groundwater recharged by local rainfall.
• For several wells south of the American River (Wells 7, 9, 10, and 16), the results of the particle tracking suggests a major contribution from the American River while the field study delineated these areas in the northern portion of the area dominated by local recharge to groundwater.
• Along the Sacramento River, the results suggest recharge to groundwater both from the American and Sacramento rivers in Well 14 and major contributions of surface recharge in Wells 14 and 15.
December 2015 39
Sacramento Central Groundwater Authority Recharge Mapping and Field Study
This outcome is different than the field study that suggests seepage from the American and Sacramento rivers to groundwater in these areas.
• In areas in Elk Grove and southern Sacramento area near and west of Highway 99, results identify boundary flows as the major recharge source to groundwater. Toward the east, in the more central portion of the basin, surface recharge becomes the primary source. This corresponds well with the field study that suggests these areas are likely recharged by infiltration of local rainfall.
• In areas near the Cosumnes River, the results suggest groundwater is primarily recharged by the Cosumnes River seepage. This generally agrees with the field study findings that delineated these areas with the Cosumnes River seepage to groundwater.
Particle tracking results from the model layer 2 simulation generally suggest groundwater across the basin is primarily influenced by boundary recharge, surface recharge, and Cosumnes River recharge. Areas near the upper portion of American River which have a higher contribution from surface recharge and American River flow. Significant recharge is shown from the Cosumnes River in the areas in the vicinity of that river. The bulk of the remaining area shows recharge dominated by boundary recharge. These results are generally consistent with the field sampling program which suggested lower stream influence from deeper wells.
The particle tracking analysis results are generally consistent with the field study results but there may be opportunities for future refinement to the SacIWRM model to incorporate the new information from the field study to improve the characterization of the relative contribution of surface water to the groundwater system.
December 2015 40
Sacramento Central Groundwater Authority Recharge Mapping and Field Study
Figure 16: Locations of Sample Wells Used for Particle Tracking in Model Layer 1
December 2015 41
Sacramento Central Groundwater Authority Recharge Mapping and Field Study
Figure 17: Locations of Sample Wells Used for Particle Tracking in Model Layer 2
December 2015 42
Sacramento Central Groundwater Authority Recharge Mapping and Field Study
Figure 18: Relative Contribution of Recharge Sources Based on Particle Tracking in Model Layer 1
December 2015 43
Sacramento Central Groundwater Authority Recharge Mapping and Field Study
Figure 19: Relative Contribution of Recharge Sources Based on Particle Tracking in Model Layer 2
December 2015 44
Sacramento Central Groundwater Authority Recharge Mapping and Field Study
Figure 20: Relative Contribution of Recharge Sources Based on Particle Tracking in Model Layer 1, Compared to Oxygen Isotope Contours
December 2015 45
Sacramento Central Groundwater Authority Recharge Mapping and Field Study
Figure 21: Relative Contribution of Recharge Sources Based on Particle Tracking in Model Layer 2, Compared to Oxygen Isotope Contours
December 2015 46
Sacramento Central Groundwater Authority Recharge Mapping and Field Study
4 Summary and Recommendations
4.1 Recharge Map Development An understanding of recharge is critical to groundwater management, allowing for preservation and potential augmentation of existing recharge sources. To support this technical need, a recharge map was developed based on land and water use conditions, soil conditions, and hydrology as simulated by the Existing Conditions Baseline of the SaclWRM. The recharge map, shown previously in Figure 2, shows the distribution of areal recharge and a pie chart with all components of recharge. Higher areal recharge occurs in areas where soils are coarser (e.g., southwest of Folsom) and where there is extensive application of agricultural applied water (e.g., south of Elk Grove and between Grant Line Road and the Cosumnes River). Lower areal recharge rates are shown from Elk Grove to the northwest roughly between Morrison Creek and Grant Line Road, an area of largely suburban, rural residential, or undeveloped land on relatively low permeability soils. The majority of recharge is from surface water and the combination of rainfall and applied water, providing 43% and 41% of the overall recharge, respectively; the remaining 16% is recharge from subsurface flow, largely from the west. The representation of recharge sources improves the understanding of important recharge sources (e.g., surface water seepage and percolation of precipitation and applied water) as well as the spatial distribution of areal recharge. This information can be used to support land use decisions and to manage surface and groundwater resources.
4.2 Recharge Field Study The stable isotopes of oxygen (18O) and hydrogen (D) and water quality data from well-water and surface-water samples were utilized to delineate Study Area subareas where recharge is from local rainfall and subareas where recharge is surface-water that originated as relatively higher-elevation precipitation in the Sierra Nevada. The high-elevation precipitation is transported to the Study Area as run-off in the Sacramento, American, and Cosumnes Rivers, and seepage from the rivers is a source of groundwater recharge. The 18O and D values of rainfall and surface water samples were characterized using results from previous investigations as well as new analytical results from sampling performed as part of this study.
The amount of 18O and D in a water sample is reported using the delta notation (δ), which is the isotopic composition expressed as a ratio relative to the amount in a standard (Standard Mean Ocean Water) on a parts per thousand (‰) basis. A δ18O value of -7.5 was utilized to represent rainfall for most of the Study Area. A δ18O value of -9 was utilized to represent the isotopic composition of run-off in the Cosumnes River, and a δ18O value of -11 ‰ was utilized to represent the isotopic composition of American and Sacramento River flows.
Water samples were collected from 30 existing water supply wells and analyzed for 18O, D, and select cations and anions. An additional 10 wells were sampled and analyzed for 18O and D only. The δ18O values from the well-water samples were contoured and results delineated a large portion of the Study Area where the isotopic composition of groundwater was similar to local rainfall. The portion of the Study Area where the δ18O values for groundwater are less than -9 ‰ are located near the American and Sacramento Rivers, indicating that groundwater in this second subarea is influenced primarily by river seepage. These two subareas are generally consistent with land- and water-use patterns inferred from aerial photographs and with the recharge map developed as part of this effort. A third subarea is defined by δ18O values less than -7.5 ‰ but greater than -9 ‰. These portions of the Study Area are likely recharged by seepage from the Cosumnes River, or represent the transition zone between river seepage and groundwater recharged by local rainfall.
The recharge subareas represent generalized interpretations, and their use for water and land use decisions must consider data uncertainty and its resulting limitations on the results. For example, the available rainfall
December 2015 47
Sacramento Central Groundwater Authority Recharge Mapping and Field Study
data indicate its isotopic composition is variable across the Study Area, but the data were insufficient to quantify its geographic distribution. The analysis was therefore limited to using a single value to characterize local rainfall (δ18O value of -7.5 ‰). The ability to delineate recharge sources was also limited by the geographical and depth distribution of wells available for sampling. Specifically, substantial portions of the foothills and southern portions of the Study Area did not have wells available for sampling, and therefore the isotopic composition of groundwater in these areas could not be characterized. The data for this study was obtained for wells with variable depths and long well screens, and the analysis assumed sample results represent a composite of groundwater conditions with depth in the aquifer. However, the isotopic composition and water quality can vary with depth in the aquifer and within the depth interval of the well screen. For example, samples from relatively deeper wells showed an increasing influence of older groundwater that likely represents precipitation recharge from the Pleistocene Epoch. Lastly, though groundwater conditions typically change slowly with time, the recharge subareas represent data collected in 2014. The continuation of current groundwater-flow patterns, or future changes in rainfall, land use, and water use can all alter groundwater conditions and the boundaries of the recharge subareas.
4.3 Verification of Model A particle tracking analysis was performed to evaluate the extent of recharge in the groundwater basin from the river systems and relative contribution of the surface water to the groundwater system. The particle tracking results are discussed in relation to the field study results that characterize the sources of recharge based on the isotopic composition of rainfall, surface water, and groundwater system, and water quality characteristics of groundwater. The comparison of the particle tracking analysis with the field study results is intended to help determine if there is a need to refine the model in the future to incorporate the new information gained from the field study.
The particle tracking analysis results are generally consistent with the field study results but there are opportunities to explore future refinement to the SacIWRM model to incorporate the new information from the field study to improve the characterization of the relative contribution of surface water to the groundwater system.
4.4 Recommendations The results of the work performed included developing a recharge map based on the Existing Conditions Baseline scenario using the Sacramento Area Integrated Water Resources Model (SacIWRM), a recharge field study, and particle tracking analysis using outputs from the Existing Conditions Baseline scenario. The effort improves the conceptual understanding of the Central Basin through identification of sources of groundwater recharge as well as the relative magnitude of each source.
The information presented has a variety of applications related to land use, water use and groundwater management:
• The groundwater recharge map (Figure 2) shows locations with high levels of recharge from precipitation and applied water. This map can be used to support land use planning decisions which could potentially decrease recharge amounts through increases in pervious surfaces or decreases in irrigated agriculture, or increase recharge through increases in applied water. The map should be used with an understanding of the soil, land use, and water use conditions that result in the identified recharge conditions as well as with an understanding of changes in groundwater pumping or surface water diversions that may result from the land use changes. The SacIWRM can be an effective tool to support a more detailed understanding of groundwater and surface water impacts due to changes in land use.
December 2015 48
Sacramento Central Groundwater Authority Recharge Mapping and Field Study
• The groundwater recharge map identifies significant hydrogeologic processes along the northern and southern boundaries, with extensive recharge from the American and Cosumnes Rivers and subsurface outflows from the basin.
• The groundwater recharge map further shows contributions of recharge from the Yolo Subbasin to the west. Traditionally, inter-subbasin groundwater impacts have been identified primarily for the northern and southern boundaries of SCGA, but the map suggests that interactions with the Yolo Subbasin should be studied as well. Studies could include expansion of the monitoring network to include additional wells near Interstate 5 south of the City of Sacramento and could also include expansion of the groundwater model to include all or a portion of the Yolo Subbasin. Alternatively, the newly developed fine-grid version of the California Central Valley Groundwater-Surface Water Simulation Model (C2VSim), developed and maintained by CDWR,34 can be used to assess boundary flows between the Central Valley subbasins, including flows between Sacramento and Yolo County groundwater systems.
• The recharge field study and model verification identified recharge sources for wells throughout the basin, delineating the area of recharge for surface water sources from the area dominated by local precipitation and runoff recharge. The results of sampling and particle tracking were generally in agreement, but opportunities exist to further refine the SacIWRM based on the information learned from sampling. Future model calibration efforts can use particle tracking to better match sampled water sources.
34 Brush, C. F., Dogrul, E. C., & Kadir, T. N. (2013). Development and Calibration of the California Central Valley Groundwater Surface Water Simulation Model (C2VSim), Version 3.02-CG . Sacramento, Calif.: Bay Delta Office, California Department of Water Resources.
December 2015 49
Sacramento Central Groundwater Authority Recharge Mapping and Field Study
Appendix A Water quality data from other studies
December 2015
Sacramento Central Groundwater Authority Recharge Mapping and Field Study
Appendix B Field sheets, chain of custody records, lab reports, and QA/QC tables