SPE Society of Petrolelm Engineers of AIME SPE 12114 Recovery Efficiency of Enhanced Oil Recovery Methods: A Review of Significant Field Tests by E.C. Hammershaimb and V.A. Kuuskraa, Lewin & Assocs. Inc. and George Stosur U.S. DOE " Members SPE-AIME Copyrighl 1983 Sociely of Petroleum Engineers of AIME This paper was presented at the 58thAnnuai Technical Conference and Exhibition held in San Francisco, CA, October 5-8. 1983. The material is subject 10 correction by the author. Permission to copy IS restricted to an abstract of not more than 300 words. Write SPE, 6200 North Central Expressway, Drawer 64706, Dallas, Texas 75206 USA. Telex 730989 SPEDAL. ABSTRACT This paper analyzes past enhanced oil recovery (EOR) projects to determine how well they have performed as a function of reservoir and process variables. In total, over 100 key tests covering the following six major enhanced oil recovery techniques are analyzed: Steam Drive, In-Situ Combustion, Carbon Dioxide Flooding, Polymer Flooding, Surfactant/Polymer Flooding, and Alkaline Flooding. The analysis includes, by technique and geographical area: • The range of oil recovery due to EOR in barrels per acre-foot and as a percentage of oil remaining in-place. • A comparison between predicted performance and actual oil recovery. • An examination of the performance of different EOR processes within each of the six techniques. • An analysis of the relation of reservoir parameters and process variables to oil recovery. INTRODUCTION Currently, the costs of di scoveri ng oi 1 are increasing and at the same time finite limits to conventional oil reserves are being recognized. Together, these two trends provide added incentive for more efficient recovery from already discovered 1982, steam drive accounted for 218,000 barrels per day, or over Un, of the U. S. enhanced oi 1 recovery, as shown in Table 1. Steam soak adds another 80,000 to 100,000 barrels per day to these U.S. totals. The collection of improved recovery techniques called EOR has a long history of research. However, it is only recently that results from a sufficient number of pilot and field tests have been reported so the performance of EOR can be evaluated, e.g., how efficient the various technologies are. To provide a base for an appraisal of EOR technology and its future potential, this study examines the recovery efficiencies of 117 reported EOR field tests covering six major techniques, as foll ows: EOR Techni que Steam Drive In-Situ Combustion Carbon Dioxide Flooding Surfactant Flooding Polymer Flooding Alkaline Flooding Total No. of Projects 26 34 14 20 15 8 m The actual oil recovery efficiencies of these tests are evaluated and compared with how well these projects have performed against originally predicted results. The relationship of key reservoir and process variables to oil recovery is also discussed. OVERVIEW OF THE ANALYTICAL METHODOLOGY fields. The analytic methodology consisted of the following steps: (1) assembling information on the Enhanced oil recovery (EOR) provided nearly pilot and field tests including reservoir 400,000 barrels per day in 1982 in the Western characteristics, and data on primary and secondary Hemisphere, up from 280,000 barrels four years oil recovery; (2) documenting the prior and latest earlier. The major portion of EOR production is in predictions and actual oil recovery due to EOR; (3) the United States, at over 300,000 barrels per day. checking the data for consistency, accuracy and completeness, to the extent possible, using The thermally-based recovery methods, supplemental data, background knowledge and contacts particularly steam injection, dominate enhanced oil with operators; and (4) analyzing the performance of recovery in the U.S. and the rest of the world. In tests with respect to key reservoir properties and EOR process variables, such as volumes of injected Tables at end of paper. material. L-_______ __________________ ... _ .. _
Transcript
SPE Society of Petrolelm Engineers of AIME
SPE 12114
Recovery Efficiency of Enhanced Oil Recovery Methods: A Review of Significant Field Tests
by E.C. Hammershaimb and V.A. Kuuskraa, Lewin & Assocs. Inc. and George Stosur U.S. DOE "
Members SPE-AIME
Copyrighl 1983 Sociely of Petroleum Engineers of AIME
This paper was presented at the 58thAnnuai Technical Conference and Exhibition held in San Francisco, CA, October 5-8. 1983. The material is subject 10 correction by the author. Permission to copy IS restricted to an abstract of not more than 300 words. Write SPE, 6200 North Central Expressway, Drawer 64706, Dallas, Texas 75206 USA. Telex 730989 SPEDAL.
ABSTRACT
This paper analyzes past enhanced oil recovery (EOR) projects to determine how well they have performed as a function of reservoir and process variables. In total, over 100 key tests covering the following six major enhanced oil recovery techniques are analyzed: Steam Drive, In-Situ Combustion, Carbon Dioxide Flooding, Polymer Flooding, Surfactant/Polymer Flooding, and Alkaline Flooding.
The analysis includes, by technique and geographical area:
• The range of oil recovery due to EOR in barrels per acre-foot and as a percentage of oil remaining in-place.
• A comparison between predicted performance and actual oil recovery.
• An examination of the performance of different EOR processes within each of the six techniques.
• An analysis of the relation of reservoir parameters and process variables to oil recovery.
INTRODUCTION
Currently, the costs of d i scoveri ng oi 1 are increasing and at the same time finite limits to conventional oil reserves are being recognized. Together, these two trends provide added incentive for more efficient recovery from already discovered
1982, steam drive accounted for 218,000 barrels per day, or over Un, of the U. S. enhanced oi 1 recovery, as shown in Table 1. Steam soak adds another 80,000 to 100,000 barrels per day to these U.S. totals.
The collection of improved recovery techniques called EOR has a long history of research. However, it is only recently that results from a sufficient number of pilot and field tests have been reported so the performance of EOR can be evaluated, e.g., how efficient the various technologies are.
To provide a base for an appraisal of EOR technology and its future potential, this study examines the recovery efficiencies of 117 reported EOR field tests covering six major techniques, as foll ows:
tests are evaluated and compared with how well these projects have performed against originally predicted results. The relationship of key reservoir and process variables to oil recovery is also discussed.
OVERVIEW OF THE ANALYTICAL METHODOLOGY
fields. The analytic methodology consisted of the following steps: (1) assembling information on the
Enhanced oil recovery (EOR) provided nearly pilot and field tests including reservoir 400,000 barrels per day in 1982 in the Western characteristics, and data on primary and secondary Hemisphere, up from 280,000 barrels four years oil recovery; (2) documenting the prior and latest earlier. The major portion of EOR production is in predictions and actual oil recovery due to EOR; (3) the United States, at over 300,000 barrels per day. checking the data for consistency, accuracy and
completeness, to the extent possible, using The thermally-based recovery methods, supplemental data, background knowledge and contacts
particularly steam injection, dominate enhanced oil with operators; and (4) analyzing the performance of recovery in the U.S. and the rest of the world. In tests with respect to key reservoir properties and
EOR process variables, such as volumes of injected Tables at end of paper. material. L-_______ ..:....-~ __________________ ... _ .. _
STEAM DRIVE
The principal enhanced oil recovery method is steam drive, the bulk of which has been in shallow heavy oil sandstone reservoirs, particularly in ' California. However, several projects have been started in deeper reservoirs, carbonates, light oils (with API gravity 2()O+ and low viscosity) and tar sands (viscosity over 10,000 cpl.
Reservoir data and performance were tabulated for 26 steam drives. Of these, 18 are field scale ranging from 20 acres to the l,827-acre Tia Juana' (M-6) pr.oject. The remaining eight are classified as pilots because they are less than 20 acres in size.
Steam drives are generally implemented in reservoirs with low primary recovery, typically 5% to 20% of the original oil in-place (OOIP), although extensive secondary recovery (steam soak) may have increased oil recovery to 25% to 30%.
Several key projects are not yet complete; thus, the analysis of recovery efficiencies may understate final performance. Even so, several points stand out, as shown on Table 2.
• Well-engineered steam drives in the favorable shallow, heavy oil fields of California are highly efficient with expected recoveries of 70% or more of the remaining oil-in-place ( ROI P) • Ac tua 1 recoveri es (a s of Spri ng 1983) for some of the projects approach 60% of ROIP.
• Steam drives in heavy oils outside of California have been less efficient with a median expected recovery of 30% of ROIP. Recoveries to date range from 6% to 47% of ROIP.
• The application of steam drive to light oil reservoirs is recent, thus only limited data are available. Of the six light oil projects analyzed, oil recovery efficiencies due to steam drive range from essentially none in the thin (17-foot) and low oil volume, El Dorado, Kansas, test to 18% of ROIP in a continuing test at Shiells Canyon, California.
• Use of steam for recovery of tar sands is also recent. The Street Ranch test in Texas was a technically successful pilot that recovered 54% of ROIP. The Cat Canyon, California, test is expected to recover 35% and the Peace River, Canada, project 40% to 70% of ROIP.
Actual oil recovery from steam drive has generally been consistent with and at times has exceeded original predictions, as shown on Table 3.
I "Z-{( '1 scavage heat (Chevron) and the injection of chemicals with steam (Getty).
• In the shallow, heavy oils outside of California, the Slocum, Texas, steam drive recovered 842 B/AF, or 82% of its high expectation of 1,028 B/AF. Two other projects, Smackover in Arkansas and Winkleman Dome in Wyoming (both still underway), have recovered 30% to 60% of their predicted recoveries. Oil recovery from the Tia Juana (M-6) project in Venezuela is expected to be 525 B/AF, of which 20% has been recovered, to date.
Because steam drive in light oils and tar sands is still of an experimental nature, no reliable comparisons can yet be made between expected and actual oil recovery.
Reservoir and analytic models show the importance of oil saturation, oil viscosity, net pay, porosity, and depth on oil recovery. However, analysis of twelve mature California steam drives provides no clear correlation of these reservoir properties with oil recovery efficiency, Table 4. This table shows that, for all practical purposes, the eight projects with higher oil recovery (recoveries of 44% to 74% ROIP) have reservoir properties similar to the four projects with lower oil recovery (recoveries of 20% to 44% ROIP). Thus, process design may be as critical to recovery as favorable reservoir properties.
The economic success of a steam drive project is better measured by the oil-steam ratio than by the recovery. Table 5 shows the recovery, oil-steam ratio and steam injected for seven projects, grouped by recovery efficiency. Two projects, both at Kern River, which is a highly favorable reservoir, show recoveries of 56% to 74% of ROIP. Both of these projects have similar oil-steam ratios of about 0.17 and have injected between 1.2 (not including hot water to scavenge heat) and 1.7 pore volumes of steam. The five lower recovery projects all have actual or expected recovery efficiencies ranging from 30% to 47% of ROIP. The table illustrates that, in general, the oil recovery is a function of the amount of steam injected. However, larger steam volumes often mean lower oil-steam ratios, so even though large amounts of oil may be technically recoverable with a corresponding high recovery efficiency, it may not be economic to do so.
IN-SITU COMBUSTION
In-situ combustion, or fireflooding, is one of the earliest EOR methods, with field tests starting in the late 1950's. These tests showed the theoretical and operational complexity of this process to be considerably higher than originally expected.
• In the shallow, heavy oils of California, predictions of ultimate recovery range from Information and reservoir properties were 500 to 1,000 barrels per acre-foot (B/AF). collected on 34 in-situ combustion projects from Actual recoveries in the two most mature nearly all of the important oil production areas in (continuing) steam drives in Kern River the U.S. and the world. Twenty-four of the projects (Chevron's Ten Pattern and Getty's Green and are field scale (more than 20 acres) and the Whittier projects) are 808 and 760 B/AF, remaining ten are pilots. The majority (26 projects) respectively. Predicted oil recoveries for involve low gravity (less than 250 API) oils at these two projects have increased over their depths shallower than 3,500 feet. Only three original estimates due to water injection to projects have a higher gravity of 29 0 to 400 API.
~ _____ ~ ______ ~ __ ~ ______ ~ ______ -L
t<y / t<l The amount of oil recovered prior to in-situ
combustion reflects the different reservoir types where this EOR technique is used. The first category is heavy and very heavy oil reservoirs, where prior recovery has been less than 15% of ROIP, oil saturations are high at 55% to 75%, and the EOR process is used in a secondary mode. Nineteen of the projects belong to this largest category. The second type of reservoirs are heavy oil reservoirs (gravity usually greater than 200 API) where prior recovery is higher, ranging from 15% to 35% of ROIP. For these reservoirs, the oil saturation at the start of the project ranges from 45% to 60%. The process has also been tested in tar sands and very heavy oils with no previous recovery and high oil saturations of 50% to 75%.
In-situ combustion has the potential for recovering substantial additional oil, with recoveries reaching 50% of ROIP, particularly when water is injected to scavenge heat (wet combustion). The in-situ combustion projects fall into three distinct categories with respect to recovery efficiency, Table 6:
• SUccessful Projects. Nine of the projects have recovered or expect to recover over 30% of ROIP; five of these projects are wet combustion projects and two are dry combustion projects;
• Moderately Successful Projects. Eleven of the projects have recovered from 10 to 30% of ROIP; Eight of these projects are known to be dry and only one is known to be wet.
• Unsuccessful Projects. Eight of the projects have recovered less than 10% of ROIP. These projects were either dry (3 projects) or in tar sands (5 projects).
These results indicate that wet combustion may be technically superior to dry combustion.
Predictions of ultimate recovery and actual performance generally agree for the successful projects, and in several cases the latest prediction of recovery has increased over earlier forecasts, Table 7. In-situ combustion has been most successful and predictable in the three tests in the Bellevue field of Louisiana. Predictions of ultimate recovery are 680 to 737 B/AF, with recovery for these ongoing projects ranging from 303 to 677 B/AF (Spring 1983).
Actual performance versus prediction has been lowest when in-situ combustion has been used in very vi scous oil s and tar sands. In two such projects, at Little Tom and Paris Valley, essentially no oil was recovered against anticipated recoveries ranging from 259 to 700 B/AF.
Evaluation of the in-situ projects (Table 8) shows that, in general, the successful projects have been in relatively shallow reservoirs with moderate viscosity crudes and high oil saturations. The unsuccessful projects were often in reservoirs with viscous oils and low (0-5%) primary/secondary recovery or 1 ight oil reservoirs with hi gh (25+%) primary /secondary recovery.
Moderately successful projects have less air injected per acre-foot of reservoir than the
successful projects, and a lower air-oil ratio, Table 8. This indicates that operating problems in controlling the combustion front may be responsible for the lower oil recovery and that the projects were stopped when the process reached the economic limit. However, within each category there appears to be no correlation between the success of a project and the amount of air injected.
Prior analysis has shown that variability in oil recovery is also attributable to differences in process variables, particularly with respect to the rate and volumes of air injection, the success in maintaining an integral combustion front, and the capacity to successfully control the process.
CARBON DIOXIDE FLOODING
Carbon Dioxide (C02) flooding has been underway for some time in West Texas and West Virginia. In addition, there are several recent C02 floods on the Gulf Coast of Louisiana, in high permeability, dipping reservoirs, although there is insufficient data to analyze their performance.
The use of carbon dioxide (C02) for enhanced oil recovery received a major boost in the early 1970's with the initiation of the 29,OOO-acre Kelly Snyder (SACROC) project in West Texas.
Information has been assembled on the performance and reservoir properties of 14 carbon dioxide projects, seven of which are field scale. These projects are in both sandstone and limestone lithology and generally in 1 ight oil reservoirs ranging in depth from 2,000 to 12,800 feet with low permeability (2 to 34 md) and low porosity (8% to 23%). These two latter properties help restrict the gravity override and fingering that limit the efficiency of this EOR process in reservoirs with low dip.
Carbon dioxide floods are used for both secondary and tertiary oil recovery. The analysis includes five secondary C02 projects, with primary recovery between 13% and 21% of OOIP, and nine tertiary C02 projects with primary-secondary recoveries of 30% to 48% of OOIP.
For purposes of analysis, the C02 field tests have been divided into three groups based on expected oil recovery, as a percent of ROIP, Table 9. This leads to the following findings:
• Hi gh Recovery Projects. More than a thi rd of the C02 projects have (or expect) high oil recovery, generally 40% to 50% of ROIP. These projects represent a variety of reservoir settings and adaptations of the C02 EOR process:
-- At Little Creek, more than two pore volumes of C02 were injected (with recirculation) to evaluate the capacity of C02 to recover oil from a low residual oil setting; recovery was 138 B/AF or 46% of ROIP.
-- At Slaughter Estate, sour gas (72% C02, 28% H2S) was injected in a WAG mode (water alternating with gas), followed by nitrogen as a chase gas; recovery to date
(Spring 1983) is 125 B/AF or 35% of ROIP and is expected to reach 40% of ROIP.
-- At Weeks Island, a gravity stable flood is being tested in a steeply dipping reservoir; oil recovery is estimated to be 150 B/AF or 52% of ROIP.
-- The two tests at Levelland are a secondary mode WAG pilot and a tertiary mode WAG field test; oil recovery is estimated to reach 85 to 100 B/AF.
• ~'oderate Recovery Projects. Four tests show moderate recovery, ranglng from 10 to 30% of ROIP. The large field test at Kelly Snyder (SACROC), is conducted in a secondary mode and expects to recover an incremental 16 B/AF over waterflooding, or 11% of ROIP. (A subsequent pilot at SACROC, in a tertiary mode, however, recovered only 6% of ROIP.) The test of C02 in a heavy oil field at Lick Creek expects to recover 277 B/AF or 21% of ROIP, with 70 B/AF recovered to date. At Twofreds, the East reservoir has responded well to a secondary C02 flood and expects to recover 27% of ROIP, whereas an earlier waterflood met with little success.
• Low Recovery Projects. Four of the C02 projects had recoveries of 10% of ROIP or less. The two West Virginia projects, Granny's Creek and Rock Creek, recovered 10% and 9% ROIP, respectively, due to the very heterogeneous nature of the reservoir. A follow-up C02 test with mobility control chemicals is planned for Rock Creek. The Wasson (Willard) field test was terminated at an early stage.
The predicted versus actual oil recovery from C02 flooding is tabulated on Table 10. (The projects initiated in a secondary mode require a certain amount of judgment to separate out the incremental EOR oil over hYpothetical secondary recovery. )
In Texas and Louisiana, actual oil recovery (except for SACROC) is generally in line with initial predictions, although several of the projects are sti 11 underway. At Rock Creek, West Vi rgi ni a, only 47 B/AF were recovered against initial recovery estimates of 221 B/AF, one-fifth of the originally predicted recovery.
The table also illustrates the long lead time of C02 flooding. Several of the projects were started 5 to 10 years ago, but recovery in many cases has just begun and will continue for many years.
A comparison of reservoir properties, Table 11, indicates that C02 flooding works best under the following conditions:
• In low oil viscosity reservoirs with reservoir pressure in excess of 2,000 psi, with high waterflood sweeps of 75% or more, and small spacing.
• In dipping reservoirs where a gravity stable C02 flood front can be maintained.
In the moderate recovery projects, the viscosity of the crude is higher, the reservoir pressure is lower and the prior waterflood sweeps less efficient. As a consequence, the C02 may have preferentially fingered through the reservoir leading to low oil recovery.
Table 12 shows that the amount of C02 required per barrel of incremental oil recovered ranges widely, from 3 to 27 r-1cf. Lower values are expected at Slaughter Estate (3 Mcf/B), in the steeply dipping Weeks Island test (6 fief/B) and in the large scale Kelly Snyder (SACROC) project (9-10 Mcf/B).
The field tests also indicate an optimum C02 slug size ranging from 20 to 40% hydrocarbon pore volume (HCPV). Additional C02 injected beyond this optimum will continue to recover oil, but at rapidly increasing C02/oil ratios. Al so, to improve the economics, recycled C02 was used for one-half or more of the total injection requirements at Little Creek, Lick Creek, and Crossett.
SURFACTANT FLOODING
The application of surfactant flooding for enhanced oil recovery has evolved from the large volume, low concentration process of the 1960's to the current complex, high concentration surfactant-slug process with mobility control polymer drive. Field tests were started in the late 1960's and early 1970's, particularly in the Illinois Basin. While many of the early applications were at field scale, the projects undertaken by industry without Government support since 1974 have all been pilots, except the Robinson 219-R which is in a field with many prior pilots. Despite the optimism of the early 1970's, surfactant flooding is still in its early stages of development and there is considerable uncertainty associated with its use.
Performance and reservoir data were collected on 20 surfactant flooding projects. Primary and secondary oil recoveries for reservoirs under surfactant flooding have generally been high, 40% to 60% of OOIP. Waterflood sweeps are also high in the 70% to 90% pore volume (PV) range. The majority of the projects have been in high API gravity (300+) reservoirs with low temperature (less than 1200 F) and low salinity. Thus, the bulk of the light oil resource is in reservoirs with temperature and salinity values yet to be tested by field projects. However, several projects have begun to extend the process to more difficult settings and heavier oils. The Sloss project was in a moderately high temperature reservoir (l65-2000F), but the reservoir brines were low in salinity (2,500 ppm). Two recently completed tests, Loudon and Wichita Co. Regular, were in reservoirs with salinities of 104,000 and 160,000 ppm, but low temperatures (800-900 F). Al so, two projects are currently near completion in heavier oils, at Wilmington (API gravity of 180 ; viscosity of 25 cp), and at Chateaurenard (API gravity of 270 ; viscosity of 40 cp) .
Surfactant flooding projects have been divided into four groups, based on performance, Table 13. Five of the 20 projects have had high oil recovery, 35 to 40% of ROIP, with one pilot project, Loudon, reaching 60% of ROIP. Six projects have had moderate II
oil recoveries of 17 to 30% of ROIP and seven
projects have had low recovery, 15% of ROIP or below. Two projects are too early to evaluate.
Three findings emerge from the analysis of expected versus actual performance of surfactant floods, Table 14:
• The initial expectations for surfactant-polymer flooding were high, with anticipated oilrecoveri es of two to three hundred B/AF and more than 40% of ROIP.
• Subsequent research and lack of field response have led many of the operators to scale back their expectations, with latest recovery estimates generally dropping to 15% to 30% of ROIP.
• Actual oil recovery in the large scale demonstration tests in light oils has generally been lower and slower than expected.
The field results show that the surfactant process is not adequately predicted by conventional models nor does it yet match laboratory performance.
Surfactant flooding has performed best in the Illinois Basin with oil recoveries of 30% to 40% of ROIP. In contrast, the tests in Appalachia and the mid-continent have much lower, 5% to 20%, recove~ efficiencies. The high oil recovery projects have been in reservoirs with permeabilities greater than 50 md, residual oil saturations (in the waterflood swept zone) of 25% or more, a temperature of less than 1200F, and salinity of less than 25,000 ppm (except for Loudon). For the projects with lower oil recovery, one or more of these conditions are usually not met, Table 15.
Table 16 examines the efficiency of surfactant flooding in light of the key process variables: the amount and design of the chemical injected. Comparisons of surfactant flooding projects are complicated by the numerous process formulations variations in surfactant slug volumes and concentrations, use of co-surfactant and crude oil as part of the slug and the size and concentration of the polymer mobility buffer. Even so, several general observations can be made:
• Surfactant-to-oil ratios, measured in pounds of lOot active sulfonate, range from 20 to 40 pounds per barrel of incremental oil. The three projects below the 20 pounds per barrel ratio, Robinson 119-R, Chateaurenard, and Bradford (Bingham), likely include some secondary oil in their recovery figures. Four of the five projects appreciable above the 40 pounds per barrel, Borregos, Delaware-Childers, Loudon (1969) and Benton, were small 1 to 2 acre pilots that may not have captured all of the displaced oil.
• Polymer-to-oil ratios generally range from 2 to 3 pounds per recovered barrel. Some projects (e.g., Salem and Wichita Co. Regular) used very small, 30% PV, and low concentration, 400-500 ppm, mobility drives and had ratios of 1 pounds per barrel or less. Projects in the heavier oils (such as Wilmington and Chateaurenard) used much higher volumes and concentrations of polymer
and had ratios at or above 4 pounds per barrel.
A~ index of. performance has been developed to establlsh a ranklng of performance. Arbitrary unit values were assigned to the various chemicals (surfactant = 0.5 units; co-surfactant [alcohol] = 0.2 units; co-surfactant Coif] = 0.1 unit; and polymer = 1.5 units). This ranking of projects, Table!7, shows that, except for the projects that may have ex~erienced specific problems (e.g., severe channe11ng), there is a distinct correlation between the index value and recovery efficiency -- greater chemical usage leads to higher recovery but at continually increasing chemical-to-oil ratios.
POL YMER FLOOD! NG
There \tere approximately 50 projects in the United States using polymer flooding in 1982 and 29 of these projects were started after 1980. The majority of projects were located in Wyoming and the mid-continent (Kansas, Oklahoma, Texas).
Reservoir properties and performance were tabulated for 15 polymer floods, 13 of which were more than 20 acres each; two of the projects North Stanley Stinger and West Yellow Creek, are o~er 1,000 acres each. In general, the polymer projects are in reservoirs with moderate temperatures (900 to 14ooF), good permeabi1ities (up to 2,300 md) and low salinity reservoir waters (less than 60,000 ppm), except West Yellow Creek (133,000 ppm).
Polymer flooding has been tested in heavier as well as lighter oil reservoirs. Eight of the projects have an API gravity ranging from 300 to 400 and a corre spondi ng low oi 1 vi scosi ty of 1 ess than 10 cpo The remaining six projects are in reservoirs with the oil between 180 and 300 API and a moderate viscosity of 10 to 50 cpo
The majority of the projects are in reservoirs where the primary and secondary recovery have generally been modest, at 10 to 40% of OOIP. However, three of the reservoirs, Pembina, North Burbank, and Howard Glassock, had good prior recoveri es of 40% to 60% of OOIP.
The 13 mature polymer floods separate into two distinct categories with respect to oil recove~ efficiency, Table 18:
• Higher Oil Recovery. In the six higher oil recovery projects, oil recoveries have been from 3% to 17% of ROIP; the highest oil recovery project, Taber Manville, recovered 190 B/AF and 16% of ROIP. However, secondary oil reserves are likely included in this and some of the other polymer flooding projects. The large scale polymer flood at West Yellow Creek, on 4,000 acres, expects recoveries of 5% to 10% of ROIP.
• Lower Oil Recovery. For the six lower recovery proJects, oil recoveries have been less than 10 B/AF with recovery efficiencies ranging from essentially zero to 2% of ROIP.
While the additional oil recovery that can be expected from polymer flooding may be moderate to low, it remains attractive due to its relative ease of ooeration and rapid oil resoonse
Oil recovery from polymer flooding has generally been lower than origina1y predicted, Table 19. Two higher oil recovery projects have achieved 50% to 70% of their recovery estimate. The lower oil recovery projects, however, have achieved only 20% or less of their initial recovery target.
Analysis of the data, Table 20, indicates that a polymer flood works best when: (a) the project is implemented in a secondary mode, such as at Skull Creek or Taber Manville, when mobile oil still exists in the reservoir; (b) adequate polymer is injected to achieve a favorable mobility ratio and overcome polymer loss due to degredation; and, (c) the crude has low to moderate viscosity.
Although the data are very sparse, there appears to be little difference in the slug size, design and concentration between the more and less successful projects. The higher oil recovery projects are characterized by a chemical usage of 0.5 to 1 pound of polymer per incremental barrel of oil. The lower oil recovery projects have ratios ranging from 2 pounds of polymer per barrel of incremental oil produced up to 80 pounds of polymer per barrel of oil for the now terminated Storms Pool test.
ALKALINE FLOODS
Interest in alkaline or caustic flooding has increased recently. Eighteen projects were reported operating in early 1982 with an oil production of 600 barrels per day. In addition, numerous new projects are being planned or have started recently.
Reservoir properties were collected on eight alkaline floods. However, four of the tests were conducted about 20 years ago and only limited data is available. In general, alkaline floods have been undertaken in relatively heterogeneous, higher oil saturation (40%+) reservoirs with low to moderate viscosity oils (2 to 40 cpl. Because the recovery mechanisms are thought to involve emulsification and/or wettability alteration, acidic crudes are thought to be preferable. While the acid numbers in the early tests were low, two recent tests,.at . Wilmington and Huntington Beach, have been 1n heav1er oils with higher acid numbers.
Production response to the alkaline process is often difficult to measure since the expected incremental production rates are small and. considerable time is often needed to establ1sh a significant change in the oil production decline curve.
The alkaline flooding project with the highest reported oil recovery efficiency is North Ward Estes, Table 21. While published sources indicate oil recovery of up to 10% of ROIP and 100 B/AF, the erratic nature of oil production, changes in the water injection rate and undefined remaining secondary oil make incremental oil recovery difficult to gauge. The other early projects (Harrisburg, Whittier and Singleton) had reported oil recoveries ranging from 22 to 48 B/AF. The three most recent projects--at Orcutt, Huntington Beach and Wilmington--have experienced low oil recovery of less than 1 B/AF to date (Spring 1983). However, the latter two projects are still early in their lives and expect recoveries of 3 to 7% of ROIP (23 to 50 B/AF) •
/ ~(( '-(
Typically, the chemica1s-injected-to-oi1-recovered ratio ranges from 30 to 50 pounds of alkali per barrel of oil (lb/B), although a low of 3 lb/B is reported for Whittier and a high of 100 1b/B is expected at Wilmington, Table 22.
Three early alkaline projects that had reported oil recoveries of 22 to 48 B/AF were in low acid number crude oil reservoirs with moderate oil viscosities that may have precluded efficient water flooding. These projects used a low volume alkaline slug, below 10% PV, and injected less than 700 pounds alkaline per acre-foot of reservoir. They reported chemical-injection-to-oil-recovery ratios of 3 to 32 pounds per incremental barrel.
The best reported performance has been in the North Ward Estes project, where a high pore volume (15% PV) and high concentration (4.9% wt.) alkaline slug was used. Lowest recovery is reported for the small slug (2% PV) and low alkaline concentration (0.4% wt.) test at Orcutt. The alkaline-to-oil ratios for these two tests were, however, similar, at 40 to 50 pounds per incremental barrel of oil.
The two most recent projects, in heavier oil reservoirs with higher acid number crudes, are using a much larger size alkaline slug, 40-60% PV, and injecting 2,000+ pounds of alkaline per acre-foot of reservoir. However, these projects are still too early in their lives to reliably assess their performance.
CONCLUSIONS
The main conclusions of this study are:
1. Oil Recovery Efficiency. Steam drive has the highest recovery efficiency of the EOR processes, with oil recoveries of 400 to 800 barrels per acre-foot and 30 to 60% of the remaining oil-in-place. At the other extreme, alkaline flooding--when successful--has recoveries of 20 to 40 B/AF and 2% to 5% of ROIP, as shown below:
EOR Techni que Steam Dr1ve
Oil
In Situ Combustion Carbon Dioxide Flooding Surfactant Flooding Po 1 ymer Flood i ng Alkaline Flooding
2. Process Efficiency. - The key process efficiency measure for EOR 1S volume or pounds of material injected versus additional barrels of oil recovered. The table below summarizes this data for the six EOR techniques:
EOR Technique
Steam Drive In Situ Combustion Carbon Dioxide Flooding Surfactant Flooding
Polymer Flooding AHal i ne Flooding
Conventional Measure Of Performance
4-6 B Steam/B oil 15-20 Mcf Ai riB oi 1 10-25 Mcf C02/B oi 1 20-40 lb. Surfactant/B oil 1-2 lb. Po1ymer/B oil
0.5 - 2 lb Polymer/B oil 30 - 60 1b AHa1ine/B oil
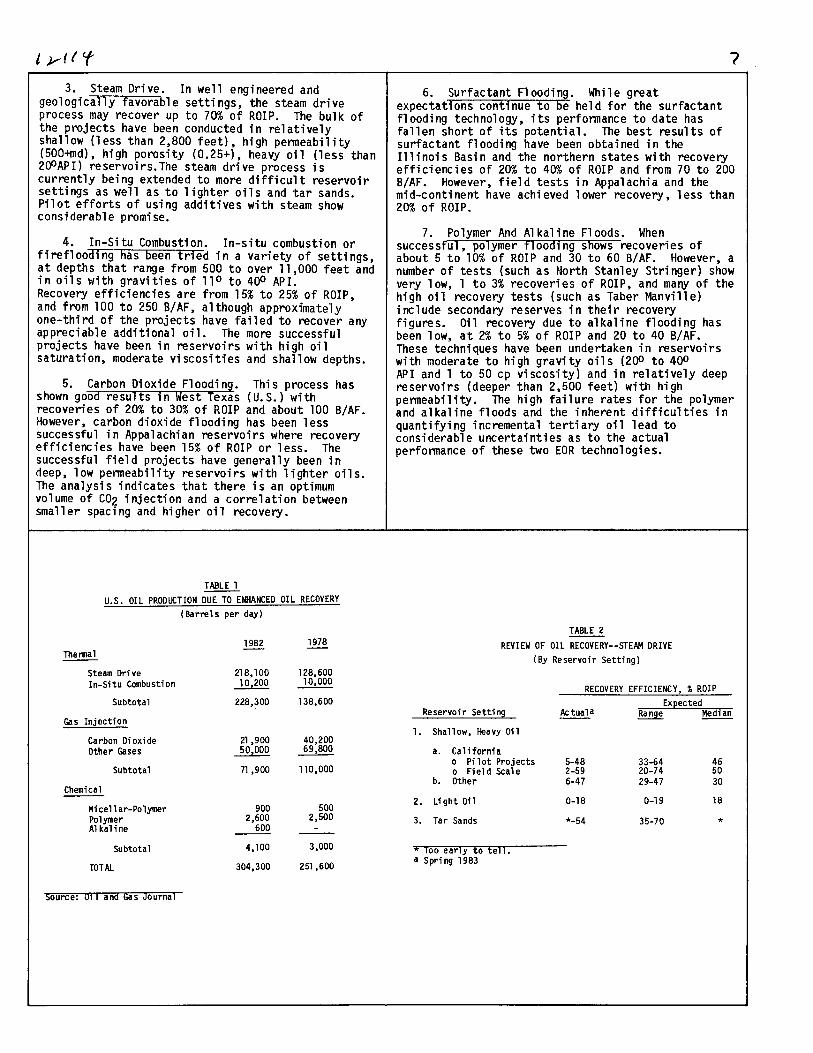
3. Steam Drive. In well engineered and geologically favorable settings, the steam drive process may recover up to 70% of ROIP. The bulk of the projects have been conducted in relatively shallow (less than 2,800 feet), high permeability (500+md), high porosity (0.25+), heavy oil (less than 200API) reservoirs. The steam drive process is currently being extended to more difficult reservoir settings as well as to lighter oils and tar sands. Pilot efforts of using additives with steam show considerable promise.
4. In-Situ Combustion. In-situ combustion or fireflooding has been tried in a variety of settings, at depths that range from 500 to over 11,000 feet and in oils ~/ith gravities of 11 0 to 400 API. Recovery efficiencies are from 15% to 25% of ROIP, and from 100 to 250 B/AF, although approximately one-third of the projects have failed to recover any appreciable additional oil. The more successful projects have been in reservoirs with high oil saturation, moderate viscosities and shallow depths.
5. Carbon Dioxide Flooding. This process has shown good results in West Texas (U.S.) with recoveries of 20% to 30% of ROIP and about 100 B/AF. However, carbon dioxide flooding has been less successful in Appalachian reservoirs where recovery efficiencies have been 15% of ROIP or less. The successful field projects have generally been in deep, low permeability reservoirs with lighter oils. The analysis indicates that there is an optimum volume of C02 injection and a correlation between smaller spacing and higher oil recove~.
u.s. OIL PRODUCTION DUE TO ENHANCED OIL RECOVERY
(Barrels per day)
1982 1978 -The nna 1
Steam Drive 218,100 128,600 In-Si tu Combusti on 10,200 10,000
Subtotal 228,300 138,600
Gas Injection
Carbon Dioxide 21,900 40,200 Other Gases 50,000 69,800
6. Surfactant Flooding. While great expectations continue to be held for the surfactant fl oodi ng technology, its performance to date has fallen short of its potential. The best results of surfactant flooding have been obtained in the Illinois Basin and the northern states with recovery efficiencies of 20% to 40% of ROIP and from 70 to 200 B/AF. However, field tests in Appalachia and the mid-continent have achieved lower recovery, less than 20% of ROIP.
7. Polymer And Alkaline Floods. When successful, polymer flooding shows recoveries of about 5 to 10% of ROIP and 30 to 60 B/AF. However, a number of tests (such as North Stanley Stringer) show very low, 1 to 3% recoveri es of ROI P, and many of the high oil recovery tests (such as Taber Manville) include secondary reserves in their recovery figures. Oil recovery due to alkaline flooding has been low, at 2% to 5% of ROIP and 20 to 40 B/AF. These techniques have been undertaken in reservoirs with moderate to high gravity oils (200 to 400
API and 1 to 50 cp viscosity) and in relatively deep reservoirs (deeper than 2,500 feet) with high permeability. The high failure rates for the polymer and alkaline floods and the inherent difficulties in quantifying incremental tertiary oil lead to considerable uncertainties as to the actual performance of these two EOR technologies.
TABLE 2
REVIEW OF OIL RECOVERY--STEAM DRIVE
(By Reservoir Setting)
RECOVERY EFFICIENCY, ~ ROIP
Reservoir Setting
1. Shallow, Heavy Oil
a. California o Pilot Projects o Field Scale
b. Other
2. Li ght Oil
3. Tar Sands
* Too early to tell. a Spri ng 1983
Actual a
5-48 2-59 6-47
0-18
*-54
33-64 20-74 29-47
0-19
35-70
46 50 30
18
*
TABLE 3
REVIEW OF PREDICTED VERSUS ACTUAL PERFORMANCE-
STEAM DRIVE
Remaining Ultimate Recovery Oil Prealct:lons
Reservoir Setting In-Place Ori ~i na 1 Latest Actual Comments ~ (6 AFJ TB7AFT TB7AFT
1. Shallow, Hea vy Oil a. California
Kern River I 1,370 717 1,020 808+ Heat scaven9ing Mt. Po so 1,380 860 515 401+ Production at 20 MBD Kern River II 1,358 745 754 760+ Steam with chemicals Midway-Sunset II 1,347 865 60+ Shallow steam drive Yorba Linda 1,760 920 740+ Complex reservoir
b. Other Wi nkl eman DOme 1,346 732 410 240+ Test started in 1964 Slocum 1,786 1,028 842 Large PV of stear.1 Smackover 1,236 360 100+ Combination of
steam, air & water Ti a Juana (M-6) 1,818 598 525 110+ Production at 25 MBD Schoonebeek,
Netherlands 1,988 378 6+ Just started
2. Li ght Oil (No predictions)
3. Tar Sand ---Cat Canyon 1,329 446 + Steam soak only Peace River 1,673 670-1,170 + Just started
+ AS of Sprlng 1983, proJect is still continuing.
TABLE 4
COMPARISON OF RESERVOIR PROPERTIES FOR
HIGHER AND LOWER RECOVERY PROJECTS -- STEAM DRIVE
Actual Or Hi gher Oil Predicted Oil Net Recovery Projects Efficiency Saturation Vi scosi ty
* Porosity Depth
('l>ROIP) (cp) t) lftT
Kern River I 74 0.52 2,700 97 0.34 700 Kern River II 56 0.50 4,500 70 0.35 870 Midway Sunset I 65 0.50 1,500 260 0.27 1,300 Midway Sunset II 64 0.58 6,500 150 0.30 400 Midway Sunset III 4sa 0.51 7,000 400 0.28 1,000 Yorba Linda 52 0.76 6,400 300 0.30 650 Inglewood 44a 0.65 1,200 43 0.39 l,OUO Cymric 64 0.57 3,500 63 0.35 1,200
Range of val ues 44-74 0.50-0.76 1,200-7,000 43-400 0.27-0.39 400-1,300
Lower Oil Recovery Projects
Brea 01 inda 21 0.71 3,100 144 0.31 800 S. Bel ri dge 2Qa 0.67 1,600 91 0.35 1,100 Coal i nga 3sa 0.60 3,000 66 0.34 1,300 Mt. Poso 37 0.54 280 55 0.33 1,800
Range of val ues 20-37 0.54-0.71 280-3,100 55-144 0.31 -0.35 800-1,800
a Ac tual recovery
TABLE 5
OIL-STEAM RATIO FOR SELECTED HEAVY OIL STEAM DRIVE PROJECTS
Current Recovery , % of ROIP O/S Ratio EX~i!c'fea ACtual (v/v)
Hi 9her Oi 1 Recovery Projects
Kern River I 74 59a+ 0.17 Kern River II 56+ 0.16
Lower Recovery Efficiency
Slocum 47 0.14 Winkleman Dome 30 18+ 0.20 Chat'Co Redondo 31 0.05 Mt. Poso 37 29+ 0.22 Coal i nga 38 + 0.19
a Includes injection of water to scavenge heat. + Continuing as of Spring 1983
TABLE 6
REVIEW OF OIL RECOVERY FROM IN-SITU COMBUSTION
Successful Projects
Del hi (D) Glen Hummel {WI Bellevue III (WI W. Newport (NR) Bell evue I (W) Shannon (NR) Bell evue II (W) Glori ana (WI Midwa~-sunset II (D) S. Be ri dge (D)
Moderately Successful Projects
Brea Olinda (D) Midway-Sunset I (D) W. Heidelberg (NR) Trix-Li z (D) Fry (D) Sloss (W) lola (NR) W. Casa Blanca (D) Bartlesville Sand (D) Asphalt Ridge II (D)
Unsuccessful Projects
N. Tisdale (D) Talco (D) N. Government (D) Little Tom (D) Paris Valley (W) Asphalt Ridge I Kyrock (NR)
o = Air lnJectl0n only W = Air and water injection NR = Not reported
Recovery Expected To Date Recovery (% ROIP) (% ROI P)
In-P1 ace °mm1 Latest Actual Successful Projects (BJAf) TBlAIT TB7Afl
Glen Hummel 1,543 BOO 551+ Bellevue I II 1,909 675 737 677+ Bellevue I 1,550 691 415+ Bell evue I I 1,640 6BO 303+ Gloriana 1,324 389 449 422+
Moderately Successful Pro3ec't:s
Brea 01 inda 1,155 200 290 270+ W. Heidelberg 775 42 200 140+ Tri x-Liz 1,140 615 105 Asphalt Ridge II 1,563 400 390
Unsuccessful Projects
Talco l,76oe 90 73 Litt1 e Tom 958 259 Pari s Valley 1,568 700 low Asphalt Ridge 1,563 400
+ As of Spring 1983, project is st, 11 continuing. e Estimated
TABLE 9 REVIEW OF OIL RECOVERY--CARBON DIOXIDE FLOODING
Oil Recovery to Date
B/AF % ROIP High Recovery Projects
Little Creek 138 46 35+ 8+ 2+
29+
Slaughter Estate 125+ Weeks Island 24+ Levelland Field (tertiary) 4+ Levelland Pilot (secondary) 55+
Moderate Recovery Projects
Twofreds (East) Li ck Creek Crossett Kelly Snyder - field
43 70+ 53+ 14+
Suspended
8+ 4+
11+ 8+
Low Recovery Projects Wasson! win ara Granny s Creek 34 10 Rock Creek 47 9 Kelly Snyder - pilot 9 6
+ As of Spring 1983, project is still continuing.
Expected Oil Recovery B/AF % ROIP
Comp1 eted 141 40 150 52
99 48 85 45
154 277 120
16
Completed Completed Completed
27 17 25 11
TABLE 8 COMPARISON OF RESERVOIR PROPERTIES AND PROCESS VARIABLES--
IN-SITU COMBUSTION PROJECTS Primary/ Air-
Oil Oil Secondary Oil Air
rHf Vi scosity Saturation Recover~ Ratio Injected (cp) ('.t OUIP (MCl7l!") 1MlICf7lIF")
Successful Projects
Delhi 3,400 3 0.33 0.47 14 7 Glen Hummel 2,300 50 0.56 0.15 5 3 Be 11 evue II I 350 680 0.72 0.09 15 10 W. Newport 1,400 700 0.69 0.10 11 Bellevue I 350 450 0.53 0.14 16 7 Shannon 950 80 0.60 0.02 6 3 Bellevue II 350 700 0.60 0.22 15 5 Gloriana 1,600 100 0.50 0.15 10 4 Midway-Sunset II 1,500 1,600 0.61 0.30 15 8 S. Be1ridge 1,100 1,600 0.68 0.09 6
Moderately Successful Projects
Brea 01 inda 3,500 20 0.54 0.28 8 2 Midway-Sunset I 2,400 110 0.62 0.17 3 W. Heidelberg 11,500 6 0.73 0.06 5 Trix-Li z 3,650 26 0.55 0.14 8 lola 850 750 0.71 0.10 27 4 W. Casa B1 anca 1,000 150 0.45 0.28 16 2 Bartlesville Sand 830 70 0.74 0.05 23 3 Asphalt Ridge II 350 106 0.65 140
Unsuccessful Projects
N. Tisdale 930 175 0.65 0.05 25 N. Government 2,300 10 0.36 0.40 NR Li tt1e Tom 2,700 90 0.59 0.03 High Pari s Vall ey 840 200,000 0.63 Hi gh Asphalt Ridge I 350 106 0.65 Hi gh
NR = Not Reported
TABLE 10 ---REVIEW OF PREDICTED VERSUS ACTUAL PERFORMANCE--C02 FLOODING
50 0.10PV/210ppm No oil recovery 11 NR 14 1 23 --/300ppm No oil recovery 2 0.17PV/280ppm 1,200 2e
25 --/550 ppm NR NR 6 0.35PV/300ppm 150 80
0.04PV/l000 ppm tapered
20 0.20PV/600 ppm 3,000 1.5
TABLE 21 COMPARISON OF PREDICTED VERSUS ACTUAL RECOVERY-
POLYMER WATERFLOODING REVIEW OF OIL RECOVERY--ALKALINE FLOODS
Hi9her Oil Recovery
Skull Creek (Texaco) Taber Manvill e
Lower Oil Recovery
N. Stanley Stringer Coal i nga Storms Pool
Too Early to Tell
Pembina W. Yellow Creek
+ As of Sprlng 1983,
Remaini ng Oil
In-P1 ace (B/AF)
659 1,166
515
U1 timate Recovery Predlcbons
ori~ina1 Latest Actual (B AF) ll!7ArT ll!7ArT
68 32+ 290 190
21 13 6+
Comments
Secondary fl Dod Secondary flood
Project
Harri sburg Whitti er Singleton N. Ward Estes
Orcutt Hunti ngton Beach Wilmington
Actual Ex~ected BJAF % ROlP B/AF !J3.Q!f
22 Comp1 eted 48 Completed 29 Comp1 eted
0-100 0-10 Completed
low Completed + TETT 50 7 + TETT 23 3
744 37 6 (Low)
Marginal Terminated Terminated
+ FIOOO 1n progress, Sprlng 1983 561 65
-220 25 697 53
+ 37 - 70 +
Secondary fl ood Too early to tell
TETT = Too Ear1v To Tell
s£lll contl~ulng.
TABLE 22
PROCESS VARIABLES AND CHEMCIAL/OIL RATIOS--ALKALINE FLOODS
Alkaline Slug Total Chemical Pounds AHa1 i/ Pore Volume Concent. Injected Barrel Oil
Project (%) (wt%) 103 lb 1bm/AF (IIIB)
Harri sburg 9 2.0 280 700 32 Whitti er 8 0.2 1,100 130 3 Si ng1 eton 8 2.0 420 690 24 N. Ward Estes 15 4.9 720 4,000 40 to very hi gh Orcutt 2 0.4 3,200 50 50
Huntington Beach 40 1.0 45,000* 2,600* TETT (5oe) Wilmington 60* 0.4 110,000* 2,000* TETT (looe)