1 RECOGNISING AND RESPONDING TO CLINICAL DETERIORATION: USE OF OBSERVATION CHARTS TO IDENTIFY CLINICAL DETERIORATION MARCH 2009 1. INTRODUCTION There are observable physiological abnormalities prior to adverse events such as cardiac arrest, unanticipated admissions to intensive care and unexpected death (1-5). Abnormalities in vital signs such as blood pressure, respiratory rate, pulse and oxygen saturation are common prior to the occurrence of these serious adverse events. This relationship between changes in physiological measures and subsequent events is the basis for the processes that have been established to recognise and respond to patients who are clinically deteriorating. Observation charts are the primary tool for recording information about vital signs and other physiological measures, and they therefore have a critical role in the identification of patients at risk. Despite their importance as possible predictors of deterioration, vital signs are not always measured, recorded or acted on (6-8). One of the factors that can contribute both to poor recording of vital signs and failure to interpret them correctly is the way in which observation charts are designed and used (9). The Australian Commission on Safety and Quality in Health Care has commenced a new program to improve the recognition of and response to clinical deterioration. One of the initiatives in this program aims to develop an evidence-based general adult observation chart that supports the identification of clinical deterioration and prompts action in response to observed physiological abnormalities. There is an increasing focus on the use of observation charts to assist in the identification of patients who are deteriorating. This can be seen in efforts internationally and within Australia to revise and improve charts, and to incorporate specific features in them (such as early warning scores) to support this identification process (9-11). Some of this work has been conducted or coordinated at jurisdictional level, but much of it is also taking place in isolation in individual hospitals or wards. A national initiative will assist those jurisdictions that have
Transcript
1
RECOGNISING AND RESPONDING TO CLINICAL DETERIORATION: USE OF OBSERVATION CHARTS TO IDENTIFY CLINICAL DETERIORATION MARCH 2009
1. INTRODUCTION There are observable physiological abnormalities prior to adverse events such as cardiac arrest, unanticipated admissions to intensive care and unexpected death (1-5). Abnormalities in vital signs such as blood pressure, respiratory rate, pulse and oxygen saturation are common prior to the occurrence of these serious adverse events. This relationship between changes in physiological measures and subsequent events is the basis for the processes that have been established to recognise and respond to patients who are clinically deteriorating.
Observation charts are the primary tool for recording information about vital signs and other physiological measures, and they therefore have a critical role in the identification of patients at risk. Despite their importance as possible predictors of deterioration, vital signs are not always measured, recorded or acted on (6-8). One of the factors that can contribute both to poor recording of vital signs and failure to interpret them correctly is the way in which observation charts are designed and used (9).
The Australian Commission on Safety and Quality in Health Care has commenced a new program to improve the recognition of and response to clinical deterioration. One of the initiatives in this program aims to develop an evidence-based general adult observation chart that supports the identification of clinical deterioration and prompts action in response to observed physiological abnormalities.
There is an increasing focus on the use of observation charts to assist in the identification of patients who are deteriorating. This can be seen in efforts internationally and within Australia to revise and improve charts, and to incorporate specific features in them (such as early warning scores) to support this identification process (9-11). Some of this work has been conducted or coordinated at jurisdictional level, but much of it is also taking place in isolation in individual hospitals or wards. A national initiative will assist those jurisdictions that have
2
not yet begun work in this area, support and inform current programs, and facilitate sharing of existing information, resources and tools.
For an observation chart to be effective in improving the identification of patients who are deteriorating it is important that the chart:
• includes physiological measures that predict or are associated with critical illness or serious adverse events
• includes features, systems or algorithms that are effective in identifying patients who are deteriorating and prompt action in response to identified deterioration
• displays information in a way that facilitates early and easy identification of deterioration.
While evidence about some of these issues exists, it can be patchy and findings are not always consistent. With the introduction of rapid response systems there has been an increasing research focus on predictors of deterioration and the use of early warning scores, however research about vital signs and observation charts has been limited. Within this context, decisions about observation charts and measurement of vital signs are frequently based on clinical experience, intuition and tradition (12, 13). In undertaking this initiative the Commission wants to build on current approaches with an explicit focus on the application of evidence to the development and use of observation charts to identify patients at risk.
This paper summarises evidence regarding vital signs, mechanisms to improve the identification of patients who are deteriorating and how information such as vital sign measurements can best be displayed. The purpose of this summary is to identify where there is an agreed, evidence-based approach to these issues, where there is uncertainty about the approach to be taken and where further evidence is needed. The paper also includes recommendations and guidelines to highlight the approach taken by other organisations on these issues.*
2. VITAL SIGNS AND OTHER PHYSIOLOGICAL MEASURES Observation charts are one of the primary tools for recording vital signs and other clinical information in hospitals, and thus have a key role in assisting with the identification of patients who are deteriorating. While there is increasing evidence about the association between physiological measures and the occurrence of serious adverse events, in general, research in this area is limited.
Vital signs and observation charts
Traditionally the vital signs have consisted of temperature, pulse, respiratory rate and blood pressure, although oxygen saturation is commonly considered to be a fifth vital sign (14). Other physiological measures and clinical information that are commonly recorded on observation charts include consciousness, urine output and analysis, bowels, weight, blood
* The recommendations included here come largely from two sources: a clinical guideline from the UK National Institute for Health and Clinical Excellence about recognising and responding to the deteriorating patient, and a program conducted by the NSW Clinical Excellence Commission about the deteriorating patient entitled Between the Flags. While there are a large number of systems in place in individual hospitals, there is limited material available that addresses these issues in a systematic way at a jurisdictional or national level.
3
sugar level and pain score. (See Appendix 1 for a summary of the physiological parameters recorded on a small sample of observation charts).†
† The Commission has collected a number of adult general observation charts. Many of these were provided by participants at a workshop held in November 2008 to discuss this initiative. While the number of charts is small (currently 24) and not representative, it does provide a picture of current observation charts in Australia.
The NSW Clinical Excellence Commission’s project, Between the Flags, tested solutions to identified problems regarding the identification and management of deteriorating patients. As part of this project focus group participants identified measures that were considered to be important for good patient care, and that should be included on an “ideal observation chart” (15). These elements included pulse, blood pressure, respiratory rate, temperature, pain score, bowels, weight, oxygen saturation, oxygen delivery rate and mode if applicable.
The National Institute for Health and Clinical Excellence (NICE) in the United Kingdom has released a clinical guideline regarding acutely ill patients in hospital (16). This guideline recommends that at a minimum the following physiological observations should be recorded at initial assessment and as part of routine monitoring: pulse, respiratory rate, systolic blood pressure, level of consciousness, oxygen saturation and temperature.
Physiological abnormalities and the occurrence of critical illness and serious adverse events
There is an increasing body of work regarding the association between vital signs and other physiological measures and the occurrence of critical illness and serious adverse events, and it is well recognised that abnormal physiology is associated with adverse clinical outcomes (16).
A number of studies have looked at this relationship specifically in the context of identifying patients at risk (1, 3-5, 17-20). Although these studies have used different methods, measures and outcomes, there is considerable consistency regarding measures associated with the occurrence of critical illness or serious adverse events, particularly for pulse, respiratory rate and blood pressure (see Appendix 2 for a summary of the findings of these studies). Consciousness and oxygen saturation have also been found to be associated with subsequent deterioration.
One Australian study, the SOCCER (Signs of Critical Conditions and Emergency Responses) study, looked in detail at predictors of deterioration (4, 21) (Appendix 3). These studies looked at the predictive value of a much wider range of physiological parameters than have generally been included in this type of research. In addition to the parameters mentioned above, this study also identified a relationship between mortality and arterial blood gas measures, peripheral circulation, airway obstruction, urinary output and drain fluid loss.
4
Practices regarding the collection of vital signs
The focus of this initiative is on the development of an observation chart that records information about vital signs. However the way in which this information is collected is relevant as it affects the accuracy and reliability of the measurements, and therefore their utility in identifying deteriorating patients. In addition, the frequency with which vital signs are measured can affect the identification of patients at risk. If vital signs are not measured frequently enough, signs of deterioration can be missed. However some regimes for monitoring vital signs have been reported to be time consuming and resource intensive, increasing workload unnecessarily (13).
There is limited research about the frequency with which vital signs should be measured, and little evaluation of different monitoring regimes (14). One Australian research program has looked in detail at measurement of postoperative vital signs and concluded that the practice of collecting vital signs postoperatively was based on tradition, not on evidence or clinical needs, and did not show any benefits to patient outcomes (13). Some research indicates that increasing the time between measurement of vital signs does not lead to any difference in outcomes such as survival or transfers to intensive care (14, 22).
As part of its Between the Flags project, the Clinical Excellence Commission made some broad recommendations regarding the frequency of vital signs recording (15). These included:
• All patients have observations taken and recorded on admission to any ward.
• The admitting medical team is responsible for documenting a medical management plan at the time of admission.
• The medical management plan would need to be reviewed by the primary care team on a regular basis or whenever levels of clinical supervision change such as following discharge from an area of high acuity such as ICU.
• All observations are then recorded at 4 hourly intervals for the first 24 hours.
• If no significant variance in clinical observations is identified the frequency of observations then decreases to 6 hourly.
• If a significant variance is identified observations sufficient to trigger medical officer review observations are increased to half-hourly until the patient is reviewed by a medical officer.
• Following implementation of a plan of care, a patient whose condition has changed is then closely monitored, usually second hourly according to clinical need.
• Any variation to the frequency of observation should be documented in the patient care plan by the treating medical team.
In their clinical guideline, NICE recommended that physiological observations should be monitored at least every 12 hours, unless a decision is made at a senior level to increase or decrease this frequency for an individual patient (16).
Regarding methods of measurement of vital signs, the use of technology is increasing, although there is limited research about the role or effectiveness of automatic or electronic methods (14). There is some evidence that it is quicker to measure vital signs by automated versus manual means, which translates as potential for cost saving across a hospital, however the cost effectiveness and accuracy of the automatic measurements has not always been assessed (14). On the other hand, there is also anecdotal evidence that taking
5
observations manually is valued by nurses as it increases their confidence and perception of connection with their patients (15).
Summary
The main points emerging from this discussion are as follows:
• There is strong evidence that abnormalities in a core set of physiological measures are associated with the occurrence of serious adverse events, particularly respiratory rate, pulse and blood pressure.
• There is also evidence that a wider range of physiological measures may also predict the occurrence of events, but these are not always measured on wards or recorded on observation charts.
• There is no evidence base regarding the content of observation charts, but considerable agreement in practice, with a core set of measures being included in most observation charts.
• The evidence base regarding the practice of taking observations is limited.
3. SYSTEMS TO SUPPORT EARLY IDENTIFICATION OF CLINICAL DETERIORATION
Based on the relationship between physiological abnormalities and the occurrence of serious adverse events systems have been developed to support the early identification of clinical deterioration. Generally these systems are known as “track and trigger” systems that rely on periodic measurement of vital signs (tracking), with a predetermined calling or response criteria (trigger) when a certain threshold is reached (16).
There has been considerable research regarding the development and use of track and trigger systems. These studies will not be summarised separately in this paper; the main source of the evidence described in this section comes from three systematic reviews about track and trigger systems, and the evidence review conducted by NICE as part of their guideline development process (12, 16, 23, 24).
Observation charts can be used as the mechanism for implementation of track and trigger systems (9-11). However, the results and evidence summarised in this section do not explicitly focus on observation charts, or the way in which track and trigger systems in observation charts can support improved identification of patients at risk.
Types of track and trigger systems
NICE have identified four main types of track and trigger system (16):
1. Single parameter systems: periodic observation of selected vital signs that are compared with a simple set of criteria with predefined thresholds, with a response algorithm being activated when any criterion is met. The most common type of single parameter system in Australia is the calling criteria for a medical emergency team (MET).
6
2. Multiple parameter system: response algorithm requires more than one criterion to be met, or differs according to the number of criteria met. This is could be a variant on the MET calling criteria that requires abnormalities for two different physiological parameters.
3. Aggregate scoring system: weighted scores are assigned to physiological values and compared with predefined trigger thresholds. The Modified Early Warning Score (MEWS) tool is one of the most common scoring system (see Appendix 5 for examples of different scoring systems).
4. Combination system: single or multiple parameter systems used in combination with aggregate weighted scoring systems.
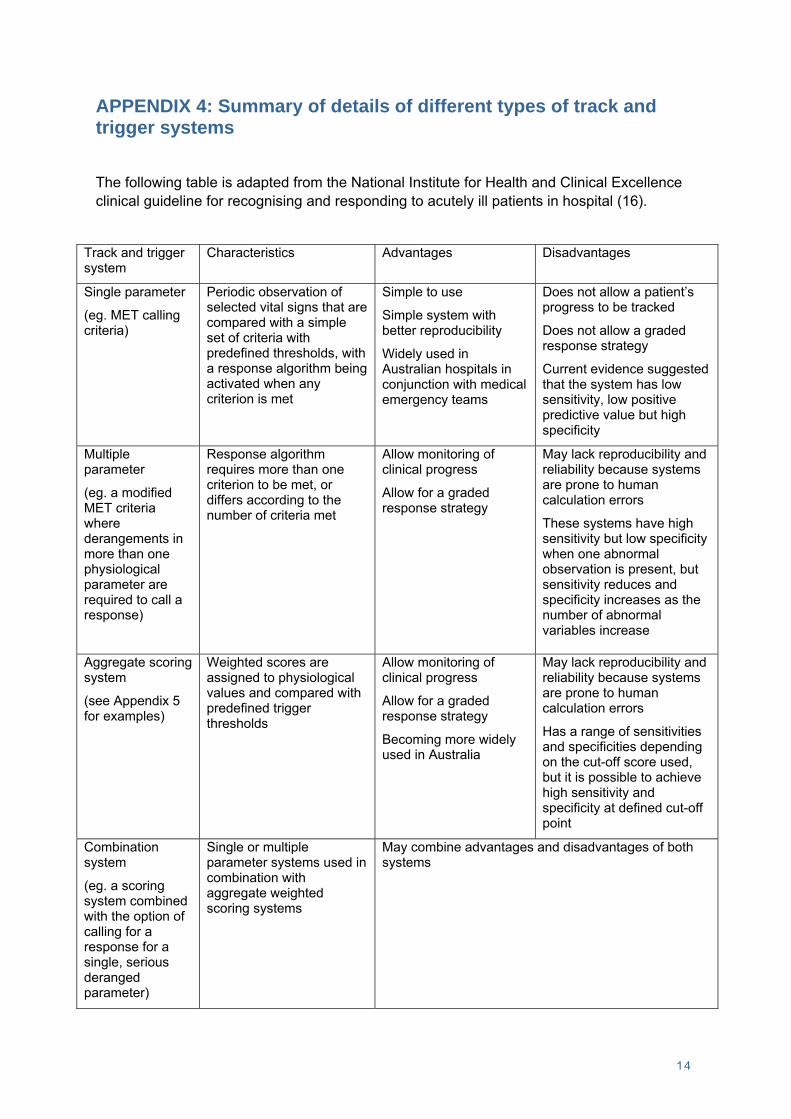
Characteristics, examples, advantages and disadvantages of these different systems are summarised in Appendix 4.
Based on research that has been published about track and trigger systems, it would appear that single parameter systems (such as the MET criteria) have been most commonly used in Australia, while aggregate weighted scoring systems (such as early warning scores) have been most commonly used in the United Kingdom (23). However anecdotal evidence suggests that this may be changing, with an increasing number of Australian hospitals and health services considering use of early warning scores, and incorporating them into observation charts.
Physiological measures and scoring algorithms included in track and trigger systems
There is variation in the type and number of physiological measures included in track and trigger systems. While there is a core set of parameters that are used in the majority of systems (pulse, respiratory rate, blood pressure, consciousness, temperature, oxygen saturation and urine output), some systems are much more complex and include a number of parameters that are not routinely measured on general wards (such as base excess, creatinine, and blood oxygen and carbon dioxide pressure) (16, 23).
There is also variation between track and trigger systems in the cut off points used to trigger a response, and, for aggregate scoring systems (such as early warning scores), differences in the weighting of measures and scoring algorithms. A small number of examples of these different scoring systems are shown in Appendix 5.
NICE recommend that trigger thresholds for track and trigger systems be set locally, and be reviewed regularly to optimise specificity and sensitivity (16). Anecdotally, there is strong support among practitioners regarding the need to be able vary triggers to meet the needs of individual patients, and for specific conditions.
Effectiveness of track and trigger systems
Three systematic reviews of track and trigger systems concluded the performance of most systems is poor and that they lack evidence of reliability, validity and utility (12, 23, 24). They were found to have low sensitivities and positive predictive values, and therefore would miss patients requiring assistance if used alone. One review suggested that it may be possible to increase the sensitivity of these systems if the trigger thresholds were increased, but that this would be at the expense of increased workload (because of the increased number of patients identified as deteriorating and needing attention) (23). Generally specificities and negative predictive values were acceptable.
7
Because of the variation in existing track and trigger systems it is difficult to compare them to make decisions about what is the best system to use. Indeed, one of the systematic reviews commented that “[d]ue to the wide variations in the characteristics of patients, response algorithms and data collection, we were unable to make direct comparison between the different [track and trigger systems] to establish the best existing [track and trigger system], or to develop a new high-quality [track and trigger system] for timely recognition of critically ill patients” (23). This same review also stated that none of the track and trigger systems had been validated for use in a wide variety of settings with confidence that it can change clinical behaviour and improve patient outcomes.
Issues associated with the use of track and trigger systems
A number of issues have been identified that have an impact of the successful implementation of track and trigger systems. Two of these are particularly relevant to this initiative. Firstly, there is evidence that the introduction of a track and trigger system improves recording of regular observations, particularly respiratory rate which is often poorly recorded (10, 25, 26). In one study this improvement continued to be observed more than a year after the introduction of the track and trigger system (25). It is considered that this increases the likelihood of clinicians identifying and acting on abnormal observations (16).
On the other hand, there are a number of studies that have identified that clinical staff can have difficulty using aggregated scoring systems, and that errors in scoring can occur (27-29). One study found that the more abnormal the observations, the more likely it was that errors in scoring would occur, and in some cases abnormal observations that should have triggered a response did not (29). The use of electronic devices to calculate scores may decrease the rate of occurrence of these errors (28).
Recommendations regarding track and trigger systems
In their clinical guideline regarding recognising and responding to acutely ill patients, NICE recommended that physiological track and trigger systems should be used to monitor all adult patients in acute hospital settings, and the track and trigger systems that are used should be multiple parameter or aggregate weighted scoring systems (16). The recommendations in the NICE guideline regarding track and trigger systems, and the evidence statements underpinning them are included in Appendix 6. As well as the evidence statements specified for each recommendation, part of the rationale for these recommendations was the evidence noted above that the use of early warning scores increases recording of regular observations. In addition, the use of track and trigger systems is widespread in NHS hospitals, and it was therefore considered that the recommendations would not be difficult to implement. However as noted earlier, the use of early warning scores is not as widespread in Australia as it is in the United Kingdom, so this consideration may not apply in Australia.
As part of their Between the Flags project, the NSW Clinical Excellence Commission recommended that a specifically designed observation chart aimed at identifying patients at risk be used in all NSW hospitals, and that this chart should be used as a track and trigger system (30).
8
Summary
The main issues arising from this discussion are as follows:
• There are a large number and wide variety of track and trigger systems in place with differences in the parameters included, cut-off points to trigger responses and weighting of measures in scoring systems.
• There is no evidence available about what is the best track and trigger system to use overall; it is not even possible to make conclusions about what may be the best system for specific circumstances or environments.
• Despite widespread use of track and trigger systems, their sensitivity is low and their utility, validity and reliability have been questioned.
• Nonetheless, there is evidence that use of these systems may improve the identification of patients who are deteriorating because of improved recording of observations.
4. DISPLAY OF INFORMATION If one of the purposes of an observation chart is to assist with the identification of patients who are deteriorating, information about physiological and other measures needs to be displayed in a way that supports early and easy identification of deterioration. It is well known that the way in which information is displayed affects speed and accuracy of perception and decision-making, however there has been very little research about the display of information in observation charts.
Types of observation charts
Based on the observation charts held by the Commission, there are three main types in use in Australia:
1. Colour-coded charts that incorporate a track and trigger system. The different colours in the charts reflect levels of physiological abnormality and are linked to weighted scores in aggregate scoring systems, or specific triggers in single or multiple parameter systems.
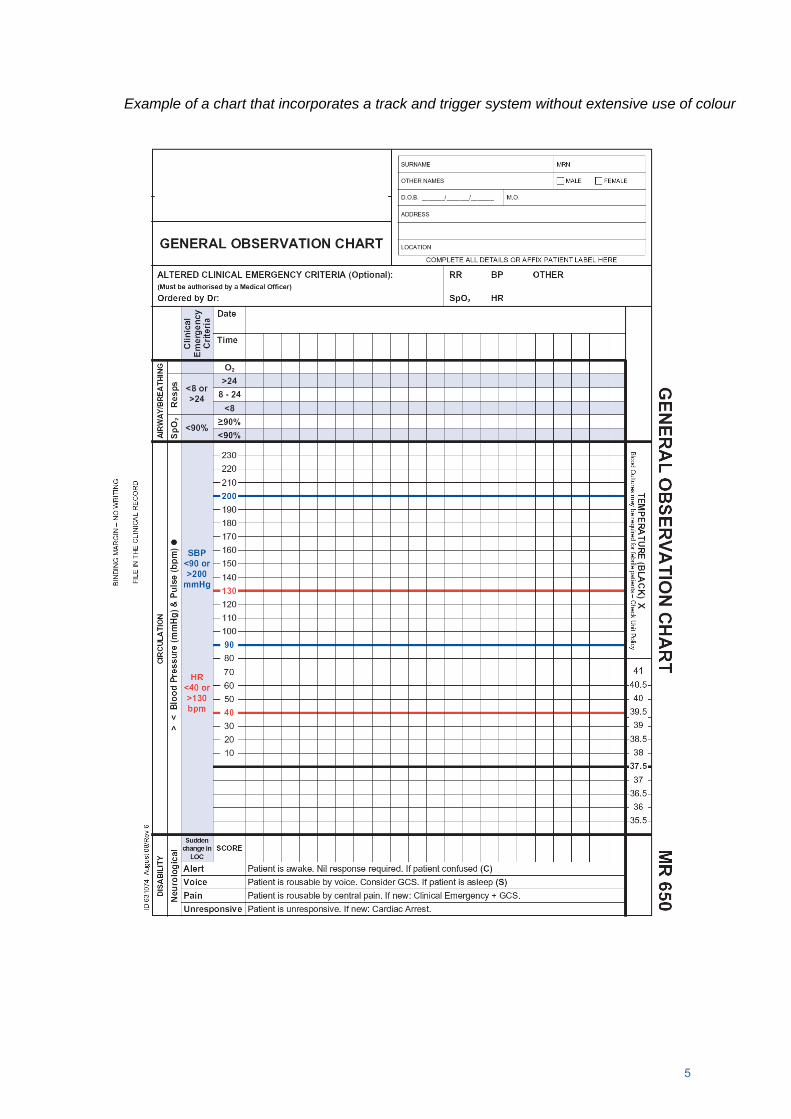
2. Charts that incorporate a track and trigger system without the use of colour. These charts use shading or coloured lines to indicate when there is physiological abnormality and a trigger is required.
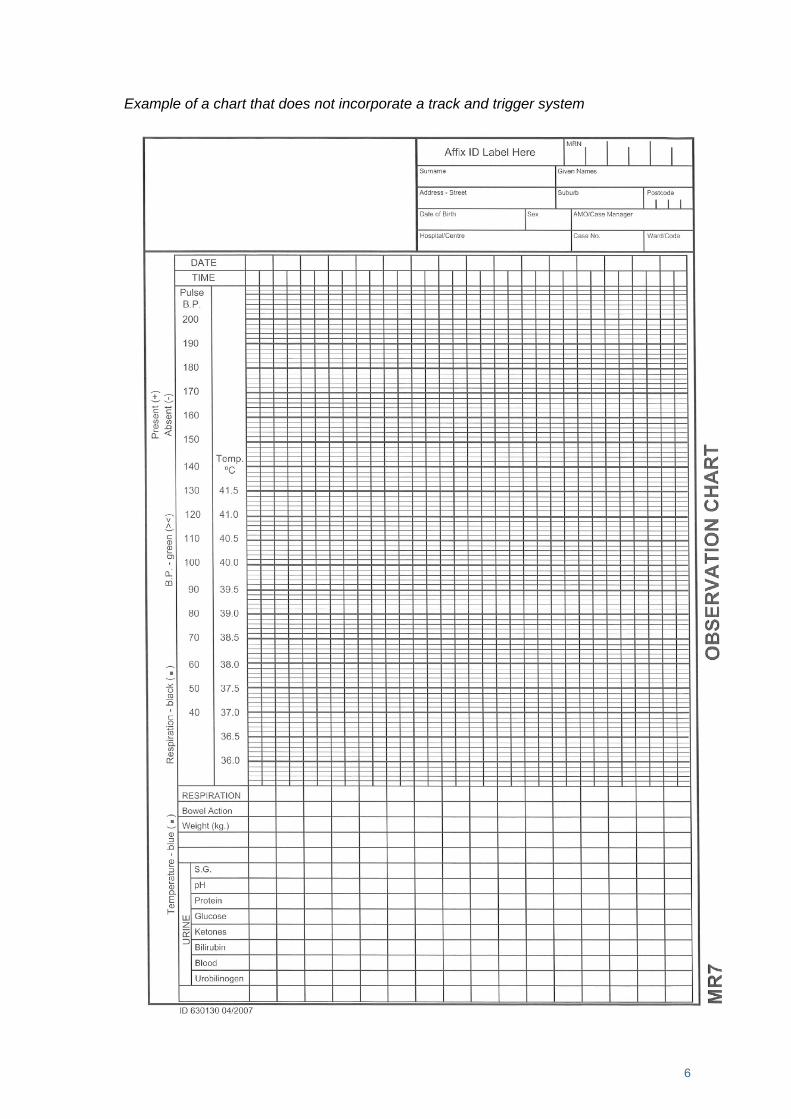
3. Charts that do not incorporate a track and trigger system. While these charts sometimes indicate normal values, they do not highlight physiological abnormalities or prompt a trigger if an abnormality is observed.
These charts generally use graphical recording (ie. use symbols) for core vital signs such as pulse, temperature and blood pressure. Some also use this form of recording for other parameters such as respiratory rate and oxygen saturation. For other charts the numerical values of these and other parameters are recorded. Examples of these three types of charts are included in Appendix 7.
9
The use of colour-coded and other charts incorporating track and trigger systems appears to be increasing in Australia. While there is some limited evidence about the best design of observation charts to identify patients at risk (see below), anecdotal information suggests that design is largely based on tradition and consensus. There have been no published evaluations regarding the effectiveness of different types of observation chart design in identifying patients who are deteriorating.
As part of their Between the Flags project, the Clinical Excellence Commission recommended the use of a specifically designed observation chart as a track and trigger system that met certain minimum standards (that are not defined in the report) (30).
Display of information and use of observation charts to identify clinical deterioration
There has been little research that has examined the design of observation charts. One study from the United Kingdom examined five different charts used within one hospital and found that the design of the charts had a significant effect on the ability of medical and nursing staff to detect patient deterioration, with detection rates for parameters showing deterioration ranging from 0% to 100% (9). Based on this analysis a new chart was designed which incorporated the use of a track and trigger system. Significant improvements were found in detection rates of parameters that were poorly identified initially, with rates of detection of abnormalities in respiratory rate and oxygenation increasing by 41% and 45% respectively.
In Australia, an intervention at The Canberra Hospital that included the introduction of a new observation chart linked to a track and trigger system, as well a comprehensive education program found improved recording of observations, a decrease in admissions of patients to intensive care and improved hospital outcomes (31).
Evidence regarding design and display of information
Although there is limited research about design and display of information in observation charts, there exists a considerable body of knowledge about design and display of health related information, and information more broadly. This is a large and complex area that covers a wide range of topics in disciplines such as human factors, informatics, cognitive science, sociology, psychology and graphic design.
Examination of this literature is beyond the scope of this paper, however there are lessons that can be learned from work in these areas that can inform the development of an observation chart to support the identification patients at risk. For example, the following points are drawn from a small number of papers and provide an indication of the broad scope of research in this area, and how it might influence the design of an observation chart.
• A study of computerised physiological monitoring systems in a neonatal intensive care unit found that medical and nursing staff had difficulty identifying the onset of adverse trends as they were developing, but could identify when a trend had commenced when looking at them in retrospect (32). The suggests that relying on staff to identify gradual deterioration without some form of assistance such as a track and trigger system may mean that patients who deteriorating are missed.
• A systematic review of computerised physiological monitoring displays found significant improvements in decision making time and accuracy for novel graphical displays compared to traditional numerical displays (33). Although this finding is for computers
10
rather than paper media, it emphasises the importance of the use of graphical means to display data.
• A series of experiments looking at the perceptual and conceptual processes underlying the extraction of information from graphs made a number of conclusions about the best way to display information. One of these was that colour schemes used to code data should be easily distinguishable. It is harder to identify different types of data in palettes where colour is varied in a single dimension (such as shades of grey) compared to spectral colour palettes (such as rainbow colours) (34). If this finding applies to the use of colour in track and trigger systems in observation charts, it suggests that the use of highly coloured charts may be more effective in identifying deterioration than those without colour.
• Research in a number of different areas has shown that the way in which information is displayed affects clinical decision making. For example the same information presented in a partogram that differed in the scaling of x- and y-axes resulted in different rates of medical intervention (35). Another study found that decisions about whether to stop clinical trials were affected by whether the same information was presented in tables or different types of graphs (36). These types of studies reinforce the potential ways in which data display can influence clinical decision making, including the identification of clinical deterioration.
11
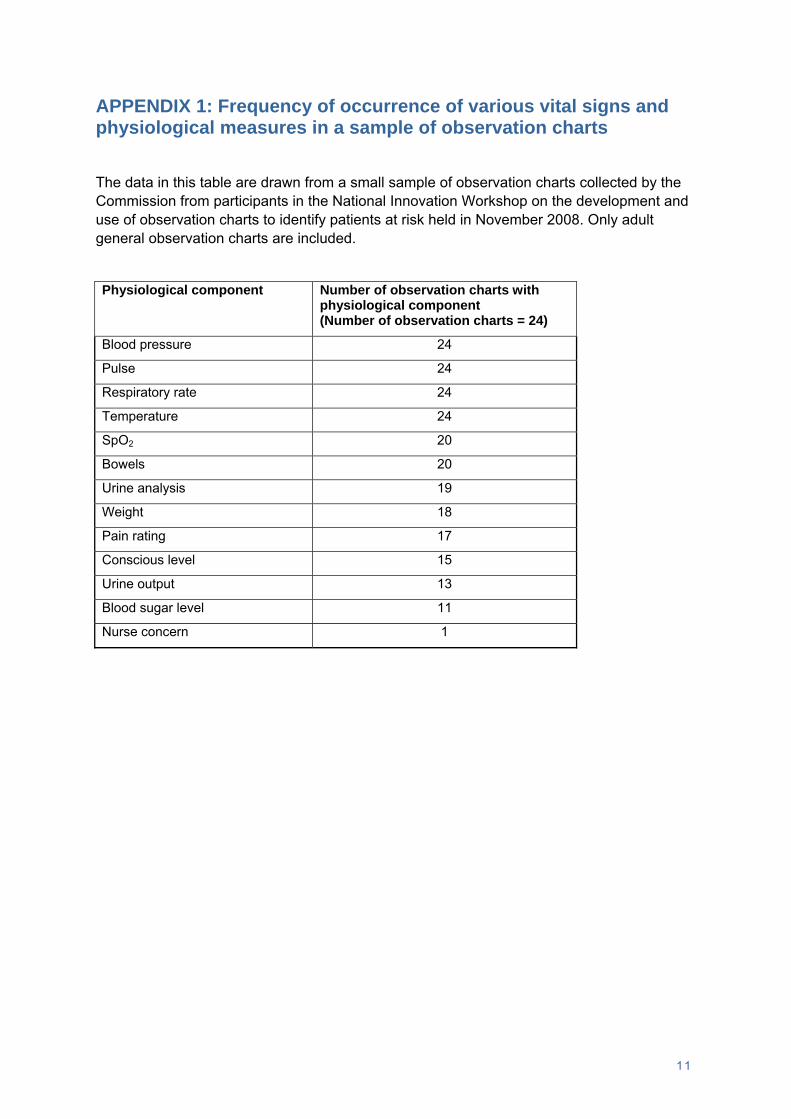
APPENDIX 1: Frequency of occurrence of various vital signs and physiological measures in a sample of observation charts
The data in this table are drawn from a small sample of observation charts collected by the Commission from participants in the National Innovation Workshop on the development and use of observation charts to identify patients at risk held in November 2008. Only adult general observation charts are included.
Physiological component Number of observation charts with physiological component (Number of observation charts = 24)
Blood pressure 24
Pulse 24
Respiratory rate 24
Temperature 24
SpO2 20
Bowels 20
Urine analysis 19
Weight 18
Pain rating 17
Conscious level 15
Urine output 13
Blood sugar level 11
Nurse concern 1
12
APPENDIX 2: Summary of studies that have examined the association between physiological abnormalities and the occurrence of adverse patient outcomes
This table is a summary of the results of a number of studies that have specifically looked at the association between derangements of a range of physiological parameters and the occurrence of outcomes such as death, cardiac arrest or admission to intensive care. The studies use different types of patient samples, methodologies, outcome measures and predictor variables, making it difficult to undertake a detailed comparison. However this high level summary below shows considerable consistency of results given the degree of variation that exists.
Significant association found Study
Pulse Respiratory rate
Blood pressure
Conscious-ness
Oxygen saturation
Other
Buist et al, 2004 (1) (Examined predictors of mortality)
Cretikos et al, 2007 (17) (Predictors (in combination) of serious events)
Cuthbertson et al, 2007 (18) (Predictors of admission to ICU for surgical patients)
Goldhill et al, 2004 (19) (Predictors of mortality)
Age
Hillman et al, 2001 (3) (Most common abnormalities 0-8hrs before death)
Hodgetts et al, 2002 (20) (Risk factors for cardiac arrest)
Temperature, documented shortness of breath, chest pain, clinician concern
Jacques et al, 2006 (4) (Predictors of mortality)
Arterial blood gas measures, airway obstruction, peripheral circulation, drain fluid loss, urinary output, level of pain
Kause et al, 2004 (5) (Most common abnormalities 15mins-24hrs before serious event)
13
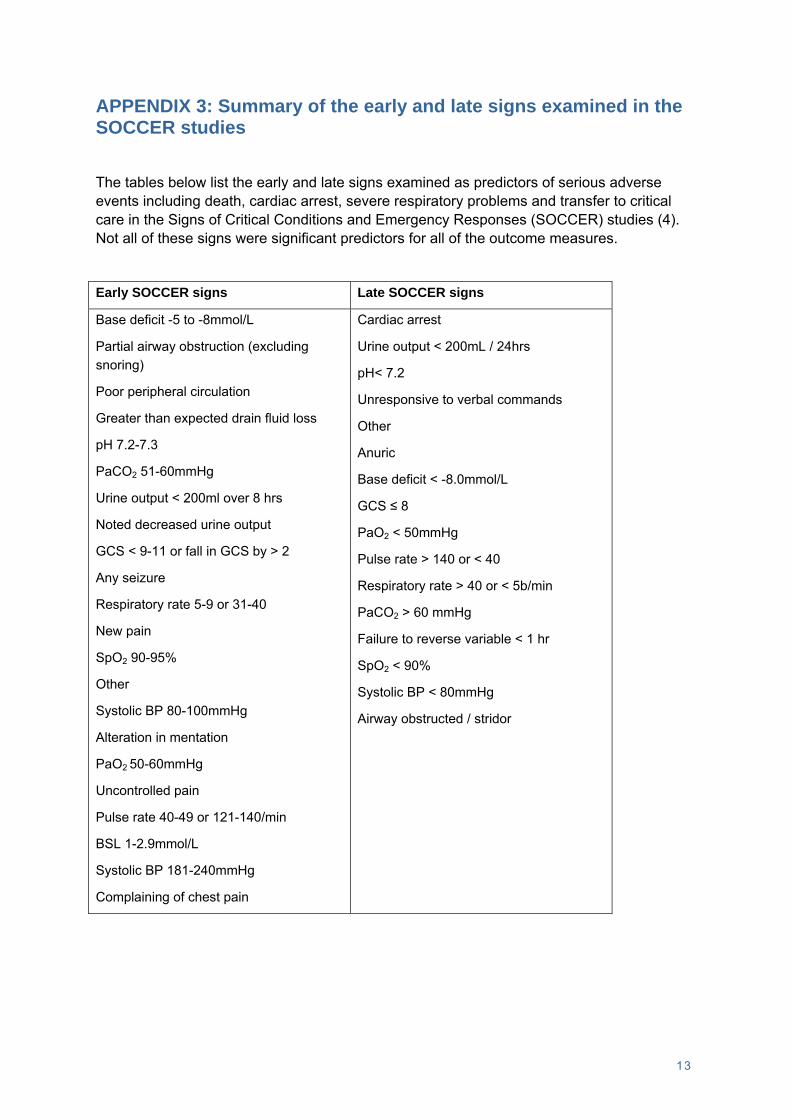
APPENDIX 3: Summary of the early and late signs examined in the SOCCER studies
The tables below list the early and late signs examined as predictors of serious adverse events including death, cardiac arrest, severe respiratory problems and transfer to critical care in the Signs of Critical Conditions and Emergency Responses (SOCCER) studies (4). Not all of these signs were significant predictors for all of the outcome measures.
Early SOCCER signs Late SOCCER signs
Base deficit -5 to -8mmol/L
Partial airway obstruction (excluding snoring)
Poor peripheral circulation
Greater than expected drain fluid loss
pH 7.2-7.3
PaCO2 51-60mmHg
Urine output < 200ml over 8 hrs
Noted decreased urine output
GCS < 9-11 or fall in GCS by > 2
Any seizure
Respiratory rate 5-9 or 31-40
New pain
SpO2 90-95%
Other
Systolic BP 80-100mmHg
Alteration in mentation
PaO2 50-60mmHg
Uncontrolled pain
Pulse rate 40-49 or 121-140/min
BSL 1-2.9mmol/L
Systolic BP 181-240mmHg
Complaining of chest pain
Cardiac arrest
Urine output < 200mL / 24hrs
pH< 7.2
Unresponsive to verbal commands
Other
Anuric
Base deficit < -8.0mmol/L
GCS ≤ 8
PaO2 < 50mmHg
Pulse rate > 140 or < 40
Respiratory rate > 40 or < 5b/min
PaCO2 > 60 mmHg
Failure to reverse variable < 1 hr
SpO2 < 90%
Systolic BP < 80mmHg
Airway obstructed / stridor
14
APPENDIX 4: Summary of details of different types of track and trigger systems
The following table is adapted from the National Institute for Health and Clinical Excellence clinical guideline for recognising and responding to acutely ill patients in hospital (16).
Track and trigger system
Characteristics Advantages Disadvantages
Single parameter
(eg. MET calling criteria)
Periodic observation of selected vital signs that are compared with a simple set of criteria with predefined thresholds, with a response algorithm being activated when any criterion is met
Simple to use
Simple system with better reproducibility
Widely used in Australian hospitals in conjunction with medical emergency teams
Does not allow a patient’s progress to be tracked
Does not allow a graded response strategy
Current evidence suggested that the system has low sensitivity, low positive predictive value but high specificity
Multiple parameter
(eg. a modified MET criteria where derangements in more than one physiological parameter are required to call a response)
Response algorithm requires more than one criterion to be met, or differs according to the number of criteria met
Allow monitoring of clinical progress
Allow for a graded response strategy
May lack reproducibility and reliability because systems are prone to human calculation errors
These systems have high sensitivity but low specificity when one abnormal observation is present, but sensitivity reduces and specificity increases as the number of abnormal variables increase
Aggregate scoring system
(see Appendix 5 for examples)
Weighted scores are assigned to physiological values and compared with predefined trigger thresholds
Allow monitoring of clinical progress
Allow for a graded response strategy
Becoming more widely used in Australia
May lack reproducibility and reliability because systems are prone to human calculation errors
Has a range of sensitivities and specificities depending on the cut-off score used, but it is possible to achieve high sensitivity and specificity at defined cut-off point
Combination system
(eg. a scoring system combined with the option of calling for a response for a single, serious deranged parameter)
Single or multiple parameter systems used in combination with aggregate weighted scoring systems
May combine advantages and disadvantages of both systems
15
APPENDIX 5: Examples of aggregated weighted scoring systems
This appendix provides examples of different aggregated weighted scoring systems. These systems differ in terms of the physiological parameters, cut off scores and weighting given to different levels of abnormality. The particular scoring systems have been selected to illustrate different types of systems.
The early warning scoring system parameters (EWSS) - Morgan et al 1997 (37) A score of 3 or more activates an escalation pathway
Score 3 2 1 0 1 2 3
Systolic blood pressure (mmHg)
Normal - 50
Normal – 30-40
Normal - 20
Normal Normal +20
Normal + 20-30
Normal +50
Heart rate (bpm)
<40 40-50 51-100 101-110 111-129 ≥130
Respiratory rate (bpm)
<8 9-14 15-20 21-29 ≥30
Temperature (°C)
<35 35-37.5 37.4 38.4 38.5
Response to stimulus
Alert Voice Pain Unresponsive
Urine (ml/hr) Nil <30 <50 >100
Assessment Score for Sick patient and Step-up in Treatment (ASSIST) - Subbe et al 2007 (38) A score of 4 or more triggers a medical emergency response
Score 4 3 2 1 0 1 2 3 4
Systolic blood pressure (mmHg)
<85 85-90 91-99 100-220 >220
Heart rate (min-1)
<50 50-60 61-100 101-120 121-140 >140
Respiratory rate (min-1)
<10 10-25 26-30 31-35 >35
Neurological score
Alert & orientated
Confused1 or agitated
Drowsy but easily rousable
Not rousable or only by nail pressure
Age (years) <70 ≥70
1Confusion should not be charted in patients with previously documented dementia
16
Activation criteria to alert a medical emergency team - Hodgetts et al 2002 (20) A score of 8 or more triggers the medical emergency team Score 4 3 2 1 0 1 2 3 4 Symptoms Nurse concern NEW Chest pain NEW AAA Pain NEW SOB NEW Physiology Pulse <45 45-49 50-54 55-60 90-99 100-119 120-139 >139 Temp - core (rectal / tympanic)
APPENDIX 6: NICE recommendations and evidence statements regarding track and trigger systems
The following information summarises the recommendations and evidence statements in the National Institute for Health and Clinical Excellence clinical guideline for recognising and responding to acutely ill patients in hospital regarding the use of track and trigger systems (16). The characters following each of these statements indicate the level of evidence specified by NICE. The meaning of these characters and the different levels of evidence used by NICE are described at the end of this appendix.
1. Recommendation 1.2.2.3: Physiological track and trigger systems should be used to monitor all adult patients in acute hospital settings. Physiological observations should be monitored at least every 12 hours, unless a decision has been made at a senior level to increase or decrease this frequency for an individual patient. The frequency of monitoring should increase if abnormal physiology is detected.
Evidence statements:
• Physiological track and trigger systems (single parameter, multiple parameter, aggregate weighted scoring and combination) have been developed and evaluated in selected patient populations. (III)
• Physiological track and trigger systems, as currently used, have variable performance in measures of diagnostic test accuracy for detecting the following key outcomes: (II)
o hospital mortality
o cardiac arrest
o admission to critical care
• Physiological track and trigger systems, as currently used in the NHS in England and Wales, have low sensitivity and positive predictive values but high specificity and negative predictive values. The low sensitivity can be improved by reducing the trigger threshold. (III)
• There is inter-rater and intra-rater variation in the measurement of the physiological variables, although better agreement exists in the thresholds to trigger. (II)
2. Recommendation 1.2.2.4: Track and trigger systems should use multiple-parameter or aggregate weighted scoring systems, which allow a graded response. These scoring systems should: • define the parameters to be measured and the frequency of observations
• include a clear and explicit statement of the parameters, cut-off points or scores that should trigger a response.
Evidence statements:
• Single parameter systems, as used by MET systems, have low sensitivity, low positive predictive values but high specificity. (II)
2
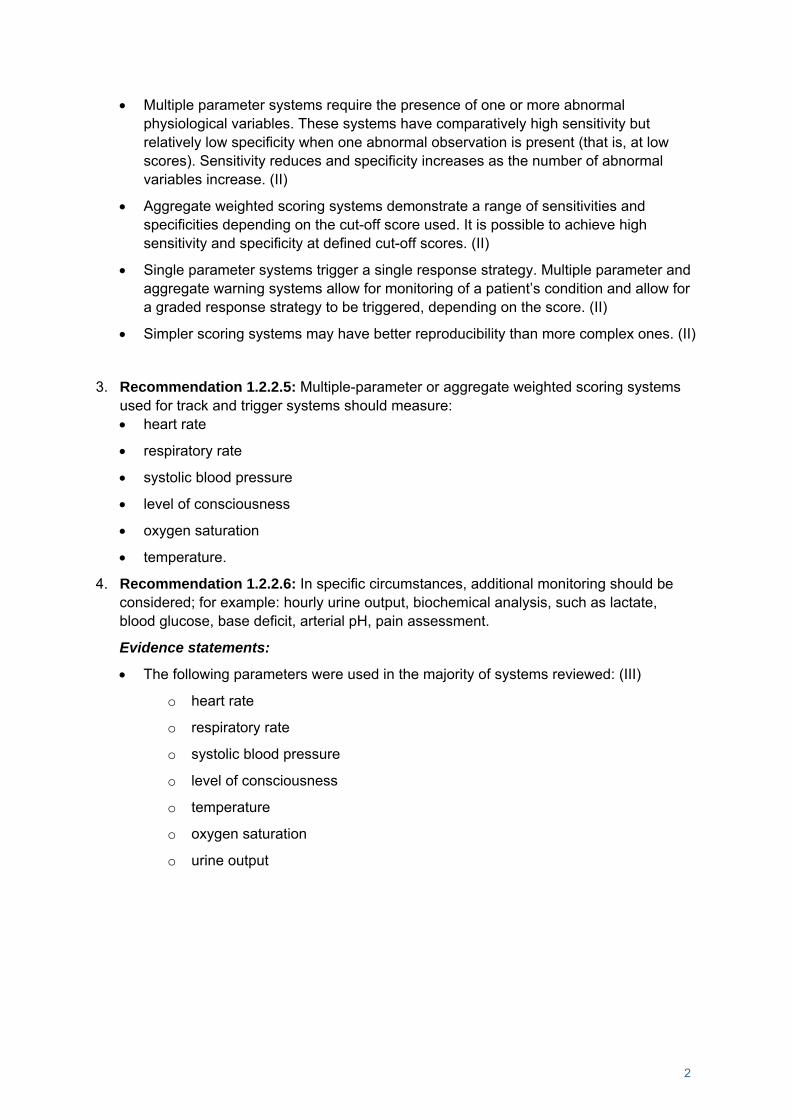
• Multiple parameter systems require the presence of one or more abnormal physiological variables. These systems have comparatively high sensitivity but relatively low specificity when one abnormal observation is present (that is, at low scores). Sensitivity reduces and specificity increases as the number of abnormal variables increase. (II)
• Aggregate weighted scoring systems demonstrate a range of sensitivities and specificities depending on the cut-off score used. It is possible to achieve high sensitivity and specificity at defined cut-off scores. (II)
• Single parameter systems trigger a single response strategy. Multiple parameter and aggregate warning systems allow for monitoring of a patient’s condition and allow for a graded response strategy to be triggered, depending on the score. (II)
• Simpler scoring systems may have better reproducibility than more complex ones. (II)
3. Recommendation 1.2.2.5: Multiple-parameter or aggregate weighted scoring systems used for track and trigger systems should measure: • heart rate
• respiratory rate
• systolic blood pressure
• level of consciousness
• oxygen saturation
• temperature.
4. Recommendation 1.2.2.6: In specific circumstances, additional monitoring should be considered; for example: hourly urine output, biochemical analysis, such as lactate, blood glucose, base deficit, arterial pH, pain assessment.
Evidence statements:
• The following parameters were used in the majority of systems reviewed: (III)
o heart rate
o respiratory rate
o systolic blood pressure
o level of consciousness
o temperature
o oxygen saturation
o urine output
3
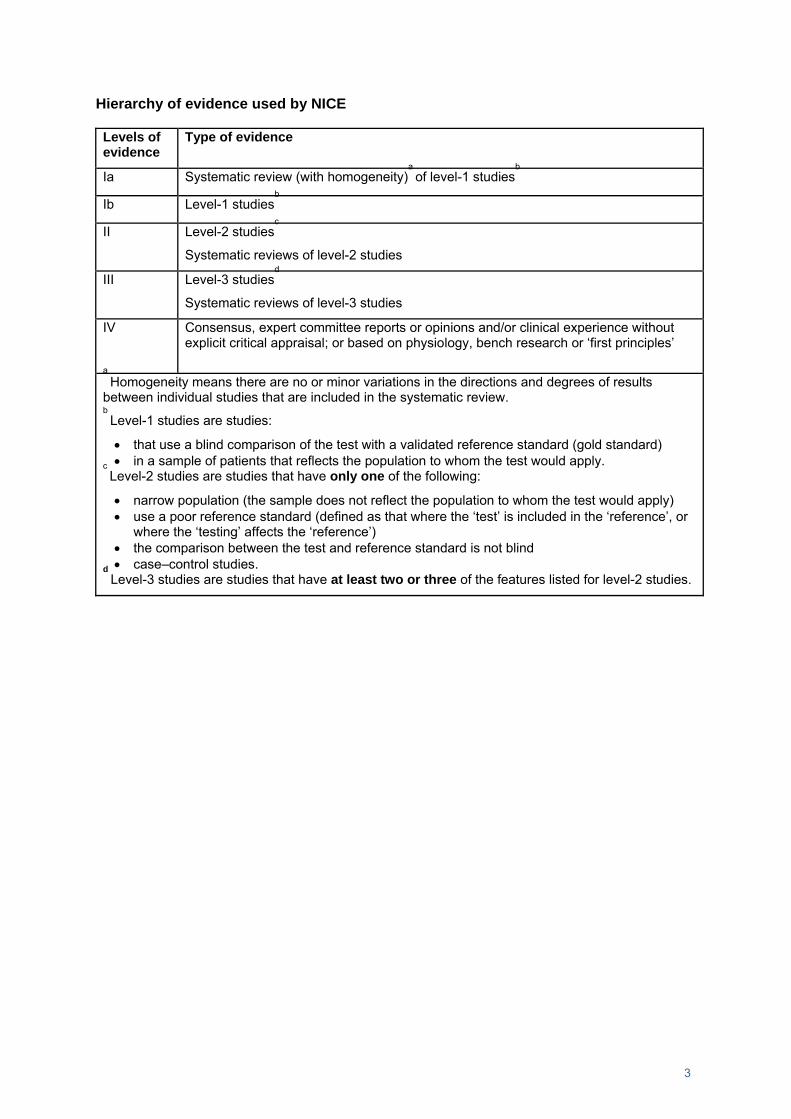
Hierarchy of evidence used by NICE
Levels of evidence
Type of evidence
Ia Systematic review (with homogeneity)a of level-1 studies
b
Ib Level-1 studiesb
II Level-2 studiesc
Systematic reviews of level-2 studies
III Level-3 studiesd
Systematic reviews of level-3 studies
IV Consensus, expert committee reports or opinions and/or clinical experience without explicit critical appraisal; or based on physiology, bench research or ‘first principles’
a Homogeneity means there are no or minor variations in the directions and degrees of results
between individual studies that are included in the systematic review. b Level-1 studies are studies:
• that use a blind comparison of the test with a validated reference standard (gold standard) • in a sample of patients that reflects the population to whom the test would apply. c
Level-2 studies are studies that have only one of the following:
• narrow population (the sample does not reflect the population to whom the test would apply) • use a poor reference standard (defined as that where the ‘test’ is included in the ‘reference’, or
where the ‘testing’ affects the ‘reference’) • the comparison between the test and reference standard is not blind • case–control studies. d
Level-3 studies are studies that have at least two or three of the features listed for level-2 studies.
4
APPENDIX 7: Examples of observation charts
Following are three observation charts that illustrate the three different types referred to in this paper.
Example of a colour coded chart that incorporates a track and trigger system
5
Example of a chart that incorporates a track and trigger system without extensive use of colour
6
Example of a chart that does not incorporate a track and trigger system
7
REFERENCES
1. Buist M, Bernard S, Nguyen TV, Moore G, Anderson J. Association between clinical abnormal observations and subsequent in-hospital mortality: a prospective study. Resuscitation. 2004;62:137-41.
2. Goldhill DR, White SA, Sumner A. Physiological values and procedures in the 24 h before ICU admission from the ward. Anaesthesia. 1999;54:529-34.
3. Hillman K, Bristow PJ, Chey T, Daffurn K, Jacques TC, Norman SL, et al. Antecedents to hospital deaths. Internal Medicine Journal. 2001;31:343-8.
4. Jacques T, Harrison GA, McLaws M-L, Kilborn G. Signs of critical conditions and emergency responses (SOCCER): A model for predicting adverse events in the inpatient setting. Resuscitation. 2006;69(2):175-83.
5. Kause J, Smith G, Prytherch D, Parr M, Flabouris A, Hillman K, et al. A comparison of Antecedents to Cardiac Arrests, Deaths and EMergency Intensive care Admissions in Australia and New Zealand and the United Kingdom - the ACADEMIA study. Resuscitation. 2004;62:275-82.
6. Fuhrmann L, Lippert A, Perner A, Østergard D. Incidence, staff awareness and mortality of patients at risk on general wards. Resuscitation. 2008;77(3):325-30.
7. MERIT Study Investigators. Introduction of the medical emergency team (MET) system: a cluster-randomised controlled trial. Lancet. 2005;365:2091-97.
8. Nurmi J, Harjola VP, Nolan J, Castrén M. Observations and warning signs prior to cardiac arrest. Should a medical emergency team intervene earlier? Acta Anaesthesiologica Scandinavica. 2005;49:702-6.
9. Chatterjee MT, Moon JC, Murphy R, McCrea D. The "OBS" chart: an evidence based approach to re-design of the patient observation chart in a district general hospital setting. Postgraduate Medical Journal. 2005;81:663-6.
10. Subbe CP, Davies RG, Williams E, Rutherford P, Gemmell L. Effect of introducing the Modified Early Warning score on clinical outcomes, cardio-pulmonary arrests and intensive care utilisation in acute medical admissions. Anaesthesia. 2003;58:775-803.
11. Van Leuvan C, Mitchell I. Missed opportunities? An observational study of vital sign measurements. Critical Care and Resuscitation. 2008;10(2):111-5.
12. Smith GB, Prytherch DR, Schmidt PE, Featherstone PI. Review and performance evaluation of aggregate weighted 'track and trigger' systems. Resuscitation. 2008;77(2):170-9.
13. Zeitz K, McCutcheon H. Observations and vital signs: ritual or vital for the monitoring of postoperative patients? Applied Nursing Research. 2006;19:204-11.
Department of Health. Between the Flags: Interim Report; November 2008. 16. National Institute for Health and Clinical Excellence. Acutely ill patients in hospital:
Recognition of and response to acute illness in adults in hospital. Clinical guideline: National Institute for Health and Clinical Excellence; July 2007.
17. Cretikos M, Chen J, Hillman K, Bellomo R, Finfer S, Flabouris A. The objective medical emergency team activation criteria: A case-control study. Resuscitation. 2007;73:62-72.
18. Cuthbertson BH, Boroujerdi M, McKie L, Aucott L, Prescott G. Can physiological variables and early warning scoring systems allow early recognition of the deteriorating surgical patient? Critical Care Medicine. 2007;35(2):402-9.
19. Goldhill DR, McNarry AF. Physiological abnormalities in early warning scores are related to mortality in adult inpatients. British Journal of Anaesthesia. 2004;92(6):882-4.
8
20. Hodgetts TJ, Kenward G, Vlachonikolis IG, Payne S, Castle N. The identification of risk factors for cardiac arrest and formulation of activation criteria to alert a medical emergency team. Resuscitation. 2002;54:125-31.
21. Harrison GA, Jacques TC, McLaws M-L, Kilborn G. Combinations of early signs of critical illness predict in-hospital death - The SOCCER Study (signs of critical conditions and emergency responses). Resuscitation. 2006 5 May 2006;71:327 - 34.
22. Mariani P, Saeed MU, Potti A, Hebert B, Sholes K, Lewis MJ, et al. Ineffectiveness of the measurement of 'routine' vial signs for adult inpatients with community acquired pneumonia. International Journal of Nursing Practice. 2006;12:105-9.
23. Gao H, McDonnell A, Harrison DA, Moore T, Adam S, Daly K, et al. Systematic review and evaluation of physiological track and trigger warning systems for identifying at-risk patients on the ward. Intensive Care Medicine. 2007;33:667-79.
24. McGaughey J, Alderdice F, Fowler R, Kapila A, Mayhew A, Moutray M. Outreach and early warning systems (EWS) for the prevention of intensive care admission and death of critically ill patients on general hospital wards. The Cochrane Collaboration; 2008.
25. McBride J, Knight D, Piper J, Smith G. Long-term effect of introducing an early warning score on respiratory rate charting on general wards. Resuscitation. 2005;65:41-4.
26. Chen J, Hillman K, Bellomo R, Flabouris A, Finfer S, Cretikos M, et al. The impact of introducing a medical emergency team system on the documentations of vital signs. Resuscitation. 2008.
27. Higgins Y, Maries-Tillott C, Quinton S, Richmond J. Promoting patient safety using an early warning system. Nursing Standard. 2008;22(44):35-40.
28. Prytherch DR, Smith GB, Schmidt P, Featherstone PI, Stewart K, Knight D, et al. Calculating early warning scores - A classroom comparison of pen and paper and hand-held computer methods. Resuscitation. 2006;70:173-8.
29. Smith AF, Oakey RJ. Incidence and significance of errors in a patient 'track and trigger' system during an epidemic of Legionnaires' disease: retrospective casenote analysis. Anaesthesia. 2006;61(3):222-8.
30. Clinical Excellence Commission, Greater Metropolitan Clinical Taskforce, NSW Department of Health. Between the Flags Project: The Way Forward; 2008.
31. Mitchell I. Patients at risk and the observation chart. Innovation workshop: Development and use of observation charts to identify patients at risk; 14 November 2008; Sydney.
32. Alberdi E, Gilhooly K, Hunter J, Logie R, Lyon A, McIntosh N, et al. Computerisation and decision making in neonatal intensive care: A cognitive engineering investigation. Journal of Clinical Monitoring and Computing. 2000;16:85-94.
33. Görges M, Staggers N. Evaluations of physiological monitoring displays: A systematic review. Journal of Clinical Monitoring and Computing. 2008;22:45-66.
34. Ratwani RM, Trafton JG, Boehm-Davis DA. Thinking graphically: Connecting vision and cognition during graph comprehension. Journal of Experimental Psychology: Applied. 2008;14(1):36-49.
35. Cartmill RSV, Thornton JG. Effect of presentation of partogram information on obstetric decision-making. The Lancet. 1992;339(8808):1520-2.
36. Elting LS, Martin CG, Cantor S, B., Rubenstein EB. Influence of data display formats on physician investigators' decisions to stop clinical trials: prospective trial with repeated measures. British Medical Journal. 1999;318:1527-31.
37. Morgan RJM, Williams F, Wright MM. An early warning scoring system for detecting developing critical illness. Clinical Intensive Care. 1997;8:100.
38. Subbe CP, Gao H, Harrison DA. Reproducibility of physiological track-and-trigger warning systems for identifying at-risk patients on the ward. Intensive Care Medicine. 2007;33:619-24.