Recombination of chlorine atoms on plasma-conditioned stainless steel surfaces in the presence of adsorbed Cl 2 This article has been downloaded from IOPscience. Please scroll down to see the full text article. 2009 J. Phys. D: Appl. Phys. 42 055206 (http://iopscience.iop.org/0022-3727/42/5/055206) Download details: IP Address: 150.216.68.200 The article was downloaded on 15/09/2013 at 01:29 Please note that terms and conditions apply. View the table of contents for this issue, or go to the journal homepage for more Home Search Collections Journals About Contact us My IOPscience
Transcript
Recombination of chlorine atoms on plasma-conditioned stainless steel surfaces in the
presence of adsorbed Cl2
This article has been downloaded from IOPscience. Please scroll down to see the full text article.
2009 J. Phys. D: Appl. Phys. 42 055206
(http://iopscience.iop.org/0022-3727/42/5/055206)
Download details:
IP Address: 150.216.68.200
The article was downloaded on 15/09/2013 at 01:29
Please note that terms and conditions apply.
View the table of contents for this issue, or go to the journal homepage for more
Home Search Collections Journals About Contact us My IOPscience
IOP PUBLISHING JOURNAL OF PHYSICS D: APPLIED PHYSICS
J. Phys. D: Appl. Phys. 42 (2009) 055206 (8pp) doi:10.1088/0022-3727/42/5/055206
Recombination of chlorine atoms onplasma-conditioned stainless steelsurfaces in the presence of adsorbed Cl2Luc Stafford1, Rohit Khare2, Joydeep Guha2, Vincent M Donnelly2,Jean-Sebastien Poirier3 and Joelle Margot3
1 Departement de Physique, Universite de Montreal, Montreal, Quebec, H3C 3J7, Canada2 Department of Chemical and Biomolecular Engineering, University of Houston, Houston,TX 77204, USA3 Departement de Physique, Universite de Montreal, Montreal, Quebec, H3C 3J7, Canada
Received 8 September 2008, in final form 13 January 2009Published 17 February 2009Online at stacks.iop.org/JPhysD/42/055206
AbstractWe investigated the interactions of atomic and molecular chlorine with plasma-conditionedstainless steel surfaces through both experiments and modelling. The recombination of Clduring adsorption and desorption of Cl2 was characterized using a rotating-substrate techniquein which portions of the cylindrical substrate surface are periodically exposed to an inductivelycoupled chlorine plasma and then to an Auger electron spectrometer in separate, differentiallypumped chambers. After several hours of exposure to the Cl2 plasma, the stainless steelsubstrate became coated with a Si-oxychloride-based layer (Fe : Si : O : Cl ≈ 1 : 13 : 13 : 3) dueto chlorine adsorption and the erosion of the silica discharge tube. Desorption of Cl2 from thissurface was monitored through measurements of pressure rises in the Auger chamber as afunction of substrate rotation frequency. Significant adsorption and desorption of Cl2 wasobserved with the plasma off, similar to that observed previously on plasma-conditionedanodized aluminium surfaces, but with much faster desorption rates that are most likelyattributable to the smoother and non-porous stainless steel surface morphology. When theplasma was turned on, a much larger pressure rise was observed due toLangmuir–Hinshelwood recombination of Cl atoms. Recombination coefficients, γCl, rangedfrom 0.004 to 0.03 and increased with Cl-to-Cl2 number density ratio. This behaviour wasobserved previously for anodized aluminium surfaces, and was explained by the blocking of Clrecombination sites by adsorbed Cl2. Application of this variable recombination coefficient tothe modelling of high-density chlorine plasmas gives a much better agreement with measuredCl2 percent dissociations compared with predictions obtained with a recombination coefficientthat is independent of plasma conditions.
(Some figures in this article are in colour only in the electronic version)
1. Introduction
In chlorine-containing plasmas commonly used for thin filmetching in micro- and nanoscale device manufacturing, bothCl2 molecules and Cl atoms formed by electron-impactdissociation of Cl2 in the gas phase react with selected devicematerials to form volatile reaction products. Cl is usuallymore reactive than Cl2, although this is not always the case.
For example, beam studies have indicated that the ion-assistedchemical etch yield of poly-Si is larger with Cl than with Cl2[1, 2], whereas the opposite trend was observed with Al [3, 4].The degree of Cl2 dissociation in the plasma therefore playsan important role in the reactivity of the discharge and in turnon the etching rates and quality of etched profiles [5, 6].
Efforts to improve the accuracy of models for chlorineetching plasmas have demonstrated the importance of the
J. Phys. D: Appl. Phys. 42 (2009) 055206 L Stafford et al
assumed wall recombination coefficient of Cl atoms, γCl, inpredicting neutral and ion compositions and number densities[6–10]. This is because at the low pressures commonly usedfor plasma etching (<100 mTorr), atom recombination is morelikely to occur on the chamber walls or wafer surfaces thanthrough three-body gas phase reactions. As a consequence,in chlorine high-density plasmas with relatively low γCl, Clatoms are usually present at higher concentrations than anyother species, the main positive ion is Cl+, and electron numberdensities exceed those of Cl−. In contrast, when γCl isrelatively high, Cl2 dominates the neutral composition and Cl−
and Cl+2 are the dominant charged species [6, 7, 11, 12].
In spite of the importance of surface recombinationreactions in chlorine etching plasmas, there have been only afew attempts to directly measure γCl under conditions relevantto materials processing. The main difficulty in performing suchmeasurements comes from the ‘conditioning’ or ‘seasoning’ ofthe surface following exposure to reactive plasmas [13–16].For example, Aydil and co-workers found that prolongedexposure of anodized aluminium chamber walls to a chlorineinductively coupled plasma (ICP) increased the concentrationof Cl atoms in the discharge [17]. This was shown toresult from a decrease in γCl with plasma exposure time asthe anodized Al walls became coated with a Si-oxychloride(SiOxCly) layer due to the erosion of the quartz windowadjacent to the ICP coil. Surface recombination coefficientson anodized Al or stainless steel walls with large quartz orsilica surfaces exposed to the plasma are thus much lower thanthose expected on ‘bare’ anodized Al or stainless steel surfaces[18, 19]. For example, at 300 K, Kota et al [20] obtainedγCl = 0.2 for anodized Al and γCl = 0.7 for stainless steelin a molecular beam experiment, whereas γCl values reportedfor the same materials in chlorine high-density plasma reactorsusing a combination of experiments and modelling are usuallyin the 0.01–0.04 range [12, 16, 21, 22].
In a plasma, surface recombination kinetics can alsodepend on operating parameters such as power and gaspressure. For example, the recombination coefficient, γO,for oxygen atoms on stainless steel in a parallel-plate, radio-frequency discharge was found to increase with increasingpower and decrease with increasing O2 pressure (0.1–3 Torr)[23]. Similar pressure dependences of γO were reported byGomez et al [24] and by Hsu et al [25] in inductively coupledoxygen plasma reactors. This behaviour was ascribed to anenhanced creation of recombination sites by ion bombardmentat low pressures and high powers. It is worth pointing outthat experiments by Kurunczi et al [26] are at odds with thisexplanation; γO was observed to be independent of pressure,power and the presence or absence of ion bombardment.Recombination of chlorine atoms on anodized Al in aninductively coupled chlorine plasma was also studied with thesame apparatus [27] as that used by Kurunczi et al [26] and inthis study. γCl was found to increase with increasing power anddecrease with increasing Cl2 pressure (1.25–20 mTorr), a resultascribed to a competition for adsorption sites between Cl2 andCl [27]. From the above survey, it is evident that the factorsinfluencing surface recombination kinetics at the plasma wallremain poorly understood such that the control of the etching
characteristics of several materials both over time and acrosslarge area wafers continues to remain a challenge.
In this paper, we investigate the adsorption and desorptiondynamics of atomic and molecular chlorine on plasma-conditioned stainless steel surfaces using the rotating-substratetechnique specially developed to study surface reactions at theplasma wall. In this set-up, a cylindrical substrate made of orcoated with the material of interest is rapidly rotated throughskimmers, allowing portions of the surface to be periodicallyexposed to an inductively coupled chlorine plasma and then tobe analysed in near real-time by Auger electron spectroscopyin a separate, differentially pumped chamber. The goal is toobtain a comprehensive picture of the influence of the plasmaconditions on the surface recombination kinetics.
2. Experimental details
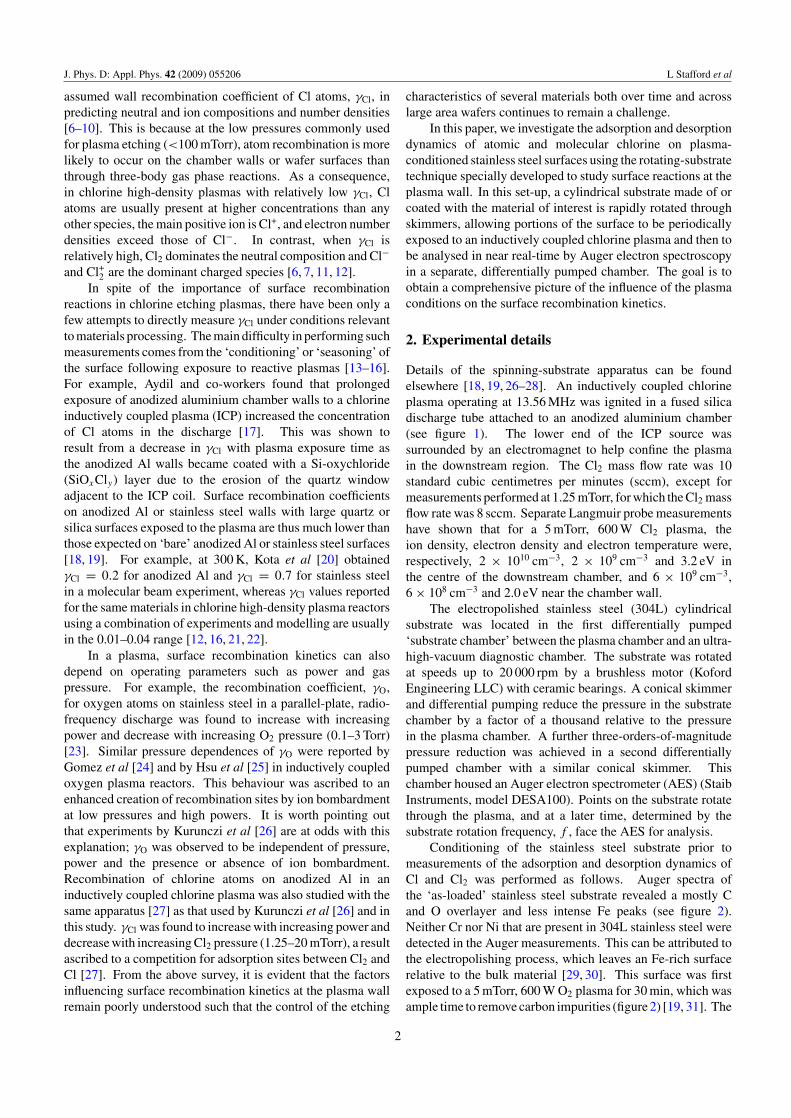
Details of the spinning-substrate apparatus can be foundelsewhere [18, 19, 26–28]. An inductively coupled chlorineplasma operating at 13.56 MHz was ignited in a fused silicadischarge tube attached to an anodized aluminium chamber(see figure 1). The lower end of the ICP source wassurrounded by an electromagnet to help confine the plasmain the downstream region. The Cl2 mass flow rate was 10standard cubic centimetres per minutes (sccm), except formeasurements performed at 1.25 mTorr, for which the Cl2 massflow rate was 8 sccm. Separate Langmuir probe measurementshave shown that for a 5 mTorr, 600 W Cl2 plasma, theion density, electron density and electron temperature were,respectively, 2 × 1010 cm−3, 2 × 109 cm−3 and 3.2 eV inthe centre of the downstream chamber, and 6 × 109 cm−3,6 × 108 cm−3 and 2.0 eV near the chamber wall.
The electropolished stainless steel (304L) cylindricalsubstrate was located in the first differentially pumped‘substrate chamber’ between the plasma chamber and an ultra-high-vacuum diagnostic chamber. The substrate was rotatedat speeds up to 20 000 rpm by a brushless motor (KofordEngineering LLC) with ceramic bearings. A conical skimmerand differential pumping reduce the pressure in the substratechamber by a factor of a thousand relative to the pressurein the plasma chamber. A further three-orders-of-magnitudepressure reduction was achieved in a second differentiallypumped chamber with a similar conical skimmer. Thischamber housed an Auger electron spectrometer (AES) (StaibInstruments, model DESA100). Points on the substrate rotatethrough the plasma, and at a later time, determined by thesubstrate rotation frequency, f , face the AES for analysis.
Conditioning of the stainless steel substrate prior tomeasurements of the adsorption and desorption dynamics ofCl and Cl2 was performed as follows. Auger spectra ofthe ‘as-loaded’ stainless steel substrate revealed a mostly Cand O overlayer and less intense Fe peaks (see figure 2).Neither Cr nor Ni that are present in 304L stainless steel weredetected in the Auger measurements. This can be attributed tothe electropolishing process, which leaves an Fe-rich surfacerelative to the bulk material [29, 30]. This surface was firstexposed to a 5 mTorr, 600 W O2 plasma for 30 min, which wasample time to remove carbon impurities (figure 2) [19, 31]. The
2
J. Phys. D: Appl. Phys. 42 (2009) 055206 L Stafford et al
Figure 1. Schematic of the experimental set-up used for the study of the adsorption–desorption dynamics of Cl and Cl2 onplasma-conditioned stainless steel surfaces during exposure to an inductively coupled Cl2 plasma. P0, P1 and P2 are pressure gauges for themain plasma, substrate and Auger chambers, respectively. The reaction time is defined as the time taken for a point on the surface to rotatefrom the midpoint of exposure to the plasma chamber (θ = 0) to the midpoint of the region probed by AES (θ = π ), i.e. the inverse of twicethe substrate rotation frequency.
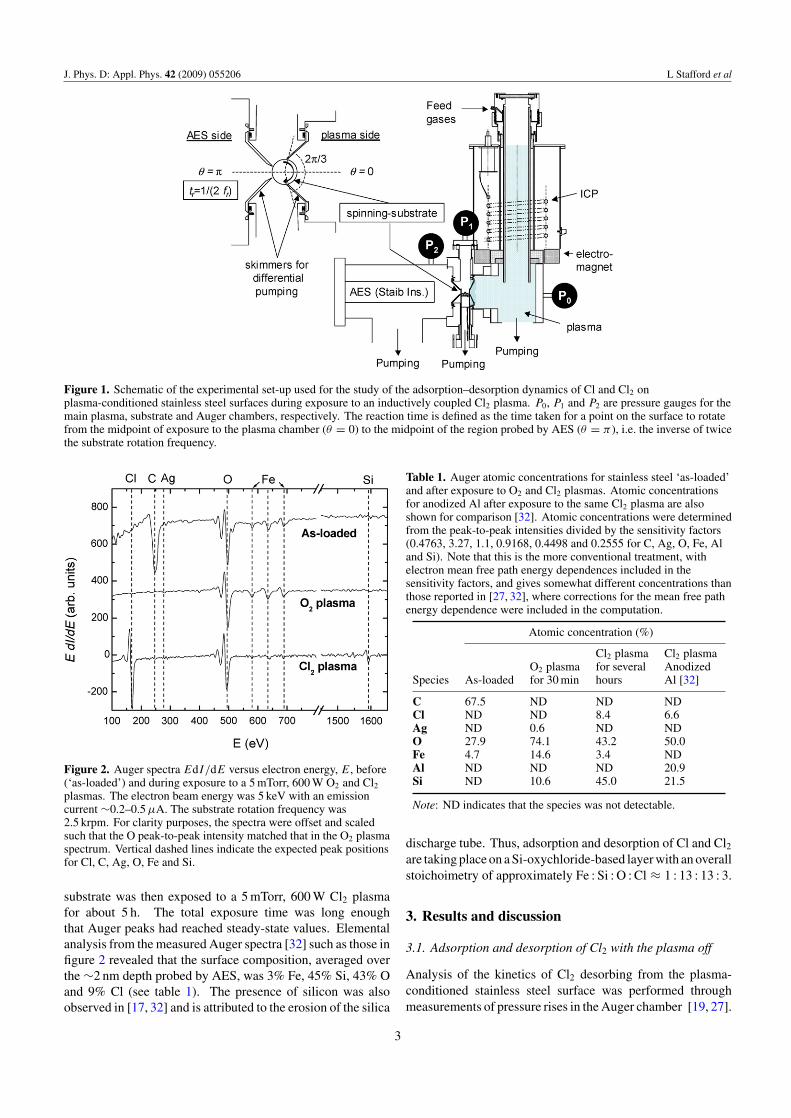
Figure 2. Auger spectra EdI/dE versus electron energy, E, before(‘as-loaded’) and during exposure to a 5 mTorr, 600 W O2 and Cl2
plasmas. The electron beam energy was 5 keV with an emissioncurrent ∼0.2–0.5 µA. The substrate rotation frequency was2.5 krpm. For clarity purposes, the spectra were offset and scaledsuch that the O peak-to-peak intensity matched that in the O2 plasmaspectrum. Vertical dashed lines indicate the expected peak positionsfor Cl, C, Ag, O, Fe and Si.
substrate was then exposed to a 5 mTorr, 600 W Cl2 plasmafor about 5 h. The total exposure time was long enoughthat Auger peaks had reached steady-state values. Elementalanalysis from the measured Auger spectra [32] such as those infigure 2 revealed that the surface composition, averaged overthe ∼2 nm depth probed by AES, was 3% Fe, 45% Si, 43% Oand 9% Cl (see table 1). The presence of silicon was alsoobserved in [17, 32] and is attributed to the erosion of the silica
Table 1. Auger atomic concentrations for stainless steel ‘as-loaded’and after exposure to O2 and Cl2 plasmas. Atomic concentrationsfor anodized Al after exposure to the same Cl2 plasma are alsoshown for comparison [32]. Atomic concentrations were determinedfrom the peak-to-peak intensities divided by the sensitivity factors(0.4763, 3.27, 1.1, 0.9168, 0.4498 and 0.2555 for C, Ag, O, Fe, Aland Si). Note that this is the more conventional treatment, withelectron mean free path energy dependences included in thesensitivity factors, and gives somewhat different concentrations thanthose reported in [27, 32], where corrections for the mean free pathenergy dependence were included in the computation.
Atomic concentration (%)
Cl2 plasma Cl2 plasmaO2 plasma for several Anodized
Note: ND indicates that the species was not detectable.
discharge tube. Thus, adsorption and desorption of Cl and Cl2are taking place on a Si-oxychloride-based layer with an overallstoichoimetry of approximately Fe : Si : O : Cl ≈ 1 : 13 : 13 : 3.
3. Results and discussion
3.1. Adsorption and desorption of Cl2 with the plasma off
Analysis of the kinetics of Cl2 desorbing from the plasma-conditioned stainless steel surface was performed throughmeasurements of pressure rises in the Auger chamber [19, 27].
3
J. Phys. D: Appl. Phys. 42 (2009) 055206 L Stafford et al
Figure 3. Pressure rises in the Auger chamber versus substraterotation frequency as a function of pressure in the plasma chamberwith the plasma off. Dashed lines are to guide the eyes only.
Previous desorption mass spectrometry measurements per-formed on the same set-up on a plasma-conditioned anodizedaluminium surface indicated that Cl2 is the only desorptionproduct after exposure to Cl2 (i.e. no Cl, AlClx or SiClx des-orbs) with the plasma on as well as off [27]. Therefore, weexpect the pressure rise in the Auger chamber to be a goodindicator of the Cl2 desorption flux. An example of pressurerise versus substrate rotation frequency is shown in figure 3 asa function of Cl2 pressure in the main plasma chamber with theplasma off. When the substrate is not rotated and Cl2 is intro-duced into the plasma chamber, a small amount of it leaks intothe substrate chamber through the first conical skimmer anda small fraction of this leaks into the Auger chamber throughthe second conical skimmer. As the substrate is rotated, Cl2molecules adsorb on the surface and then desorbs, thus pro-ducing a pressure rise. As shown in figure 3, the pressure riseincreased with substrate rotation frequency at a given pres-sure and increased with pressure at a given substrate rotationfrequency. The ‘step-like’ behaviours presented in figure 3result from the relatively small pressure rises with respect tothe Auger base pressure and the two digit precision of theion gauge readout. For example, at 5 mTorr, the base pres-sure in the Auger chamber was ∼2.1 × 10⁻⁸ Torr such that theminimum pressure rise increment that could be measured was1 × 10−9 Torr. Desorption of Cl2 with the plasma off can beattributed to either the physisorption–desorption of Cl2 or bydissociative adsorption of Cl2 followed by recombination ofadsorbed Cl and desorption of Cl2. The present experimentscannot distinguish between the two mechanisms.
The pressures rises with the plasma off, �Poff , presentedin figure 3 were converted into absolute desorption fluxes, Doff ,according to Doff = α(�Poff)/A, where α is a proportionalityconstant that contains contributions from the pumping speedin the diagnostic chamber and the relative sensitivity of theionization gauge and A (= 0.77 cm2) is the area of the rotatingsample that is exposed to the Auger chamber. The value ofα was obtained in a previous study [27], using a calibration
Anodized aluminium
Figure 4. (Colour online) Cl2 desorption flux normalized to the Cl2
impingement flux as a function of reaction time, tr (reciprocal oftwice the rotation frequency) with the plasma off. Desorption fluxeswere calculated using pressure rises plotted in figure 2 withα = 6.52 × 10²² Torr−1 s−1 and A = 0.77 cm2. Pressures were 1.25( ), 5 (•), 10 (�), 20 (�) and 30 mTorr (�). Cl2 desorption fluxesmeasured with the same set-up on an anodized aluminium substrateare also shown for comparison [27] with pressures of 1.25 (��), 5 (◦),10 (�) and 20 mTorr (�). The dashed lines correspond to desorptionrates of 165 s−1 (anodized Al) and 740 s−1 (stainless steel).
procedure in which a known gas flow was introduced into thediagnostic chamber and the corresponding pressure rise wasmeasured. (Here we made an additional compensation forthe measured change in the pumping speed of the cryopumpused in the Auger chamber, relative to the turbomolecularpump in the previous work [27]). For the configuration usedin this work, we found α = 6.5 × 10²² Torr−1 s−1. Wehave normalized Doff values to the Cl2 impingement flux,�Cl2 = nCl2v/4, where nCl2 is the Cl2 density calculated usingthe ideal gas law and v is the thermal speed of Cl2 moleculesat 300 K. The results are shown in figure 4 as a function ofreaction time, tr, defined as the time taken for a point on thesurface to rotate from the midpoint of exposure to the plasmachamber to the midpoint of the region observed by AES, i.e.tr = (2f )−1 (see figure 1). Previous results obtained on ananodized aluminium surface are also shown for comparison.
In a Langmuir mechanism in which Cl2 adsorbs (withor without dissociation) on the plasma-conditioned stainlesssteel surface, we expect the desorption rate to increase linearlywith �Cl2 at low flux and saturate at high flux [27, 33]. Forboth materials, Doff/�Cl2 values presented in figure 4 aresimilar for all pressures investigated, indicating that the surfaceis far from being saturated with adsorbed Cl2. Doff/�Cl2
decay non-exponentially with reaction time in a manner thatindicates a range of binding sites with varying desorptionrates [27, 34, 35]. The most striking differences betweenstainless steel and anodized Al are the two- to ten-fold lowerDoff/�Cl2 values and the more rapid fall-off at longer timesfor stainless steel. Single exponential fits to the 2–12 msreaction time range yielded desorption rates of 740±40 s−1 forstainless steel, compared with 165 ± 20 s−1 for anodized Al.
4
J. Phys. D: Appl. Phys. 42 (2009) 055206 L Stafford et al
(a) Anodized aluminium
(a) Stainless steel
Figure 5. SEM images from (a) anodized aluminium and(b) electropolished stainless steel surfaces. The electron beamenergy was 10 kV.
This can probably be attributed to the smoother and non-porous stainless steel surface, compared with the anodized Alsurface. As displayed in figure 5, flat samples of anodized Alsurfaces examined by scanning electron microscopy (SEM)exhibit roughness on varying length scales of 10 µm andbelow, whereas SEM images from electropolished stainlesssteel surfaces show much smoother surface morphology. Weare not aware of reports on the influence of surface roughnesson the adsorption and desorption dynamics of Cl2 on stainlesssteel or anodized Al, but it has been reported that the wateroutgassing rate from Al decreases by an order of magnitude formirror smooth surfaces compared with untreated surfaces [36].
3.2. Langmuir–Hinshelwood recombination of Cl atoms
Figure 6 shows the pressure rise in the Auger chamber as afunction of substrate frequency for a 20 mTorr Cl2 plasmaat 100 and 600 W ICP power. Measurements with theplasma off are also shown for comparison. The plasma-on pressure rises increase with power and are substantiallylarger than those recorded with the plasma off. As thesurface is exposed to the chlorine plasma, Cl atoms stickto the surface and then recombine over a time comparableto the substrate rotation period, forming Cl2 that desorbsand thus produces a pressure rise. As discussed in previouspublications [18, 19, 27], the experiments described above onlydetect delayed Langmuir–Hinshelwood (L–H) recombinationreactions, not prompt Eley–Rideal (E–R) reactions. In thecase of L–H recombination, Cl atoms can reside on the surfacebefore recombining, allowing a substantial time between Cladsorption and Cl2 desorption.
Figure 6. Pressure rise measurements with the plasma on at 600 and100 W as a function of substrate rotation frequency for a pressure of20 mTorr in the plasma chamber. Pressure rises with the plasma offare also shown for comparison.
As discussed previously for Cl recombination on anodizedAl [27], the recombination kinetics of Cl atoms with the plasmaon must be analysed while taking into account adsorptionand desorption of Cl2. Following the procedure in [27], thecontribution of L–H recombination of adsorbed Cl atoms tothe pressure rise with the plasma on, �Prec, was extractedaccording to �Prec = �Pon − (non
Cl2/noff
Cl2)�Poff , where
�Pon and �Poff are pressure rises with the plasma on andoff. In this expression, the pressure rise with the plasmaoff was scaled to the fractional decrease in the Cl2 numberdensity with the plasma on. This approach is valid providedthat the pressure rise with the plasma off increases linearlywith the Cl2 impingement flux (i.e. with the Cl2 numberdensity), independent of rotation frequency; a result that wasconfirmed in figures 3 and 4. The plasma on-to-plasma off Cl2number density ratios, non
Cl2/noff
Cl2, were determined in a previous
publication using optical emission spectroscopy [27]. As anexample, in a 20 mTorr, 600 W Cl2 plasma, non
Cl2/noff
Cl2= 0.877.
The net Cl2 desorption due to Cl atoms recombination, Drec,was then calculated using the α and A values given above.
Drec values were determined as a function of rotationfrequency, pressure (1.25–20 mTorr) and ICP power (100–600 W). Example plots of Drec versus tr on the plasma-conditioned stainless steel substrate are shown in figure 7 for20 mTorr Cl2 plasmas at 100 and 600 W. Previously reportedvalues for an anodized Al substrate under the same conditionsare also shown for comparison [27]. Drec falls off more rapidlyas a function of increasing tr for stainless steel than for anodizedAl. This trend is similar to, though less pronounced, than thatobserved for adsorbed Cl2 (figure 4). Again, we attribute this toa lower density of higher binding energy sites on the smootherstainless steel surface.
Plots of Drec versus tr were extrapolated to tr → 0 toobtain the desorption fluxes at pseudo-steady-state condition,Drec
tr→ 0, where the rotation frequency is much faster than the
rate-limiting step in Cl recombination, and Cl2 desorption thus
5
J. Phys. D: Appl. Phys. 42 (2009) 055206 L Stafford et al
Figure 7. Net desorption flux, Drec, of Cl2 formed by Cl atomrecombination as a function of reaction time, tr (reciprocal of twicethe rotation frequency) at 20 mTorr for different ICP source powers.Net desorption flux of Cl2 measured on the same experimentalset-up on an anodized aluminium substrate is also shown forcomparison [27]. Dashed lines are decay fits of the data (see text) toextract the desorption flux at tr → 0.
becomes independent of reaction time [27]. In such cases, itis as though the sample is continuously in the plasma, but theimpingement flux is reduced by the fraction of time a pointis exposed to the plasma per rotation. For our geometry,this corresponds to about 1/3 of the rotation period (seefigure 1). Extrapolations were obtained for each experimentalcondition by fitting to the measured values of Drec versustr, a function of the form Drec = a + b exp(−ctr), where a,b and c are fitting parameters. Examples of these fits arerepresented by the dashed lines in figure 7. Drec
tr→0 increasedfrom 6.5 × 1014 cm2 s−1 at 100 W to 9.1 × 1014 cm2 s−1 at600 W. For anodized Al under the same Cl2 plasma conditions,Drec
tr→0 increased from 1.1 × 1015 cm2 s−1 at 100 W to 2.4 ×1015 cm2 s−1 at 600 W (see figure 7 and [27]).
L–H recombination coefficients, defined as the probabilityat steady state that an impinging Cl atom will combine withanother Cl atom and lead to delayed desorption of Cl2, weredetermined from the relationship γCl = 2Dtr→0
rec /(�Cl/3) =6Dtr→0
rec /�Cl [27]. Again, the factor of 3 in this expressionarises from the fraction of time that a point on the surface ofthe spinning-substrate is exposed to the plasma per rotation(see figure 1), while the factor of 2 from the 2 Cl atomsper product Cl2 molecule. The density of Cl atoms near thespinning-substrate was determined in a previous publication byactinometry measurements, using Cl (792.4 nm) emission andXe (828.0 nm) as the actinometer gas [27, 37]. The temperatureof the gas near the spinning-substrate was assumed to be equalto the wall temperature of 300 K for all conditions, yieldingCl atoms impingement flux, �Cl, in the 1.9 × 10¹⁷ to 1.2 ×1018 cm−2 s−1 range depending on pressure (1.25–20 mTorr)and ICP power (100–600 W) [27].
Recombination coefficients determined using the aboveanalysis are presented in figure 8 as a function of the Cl/Cl2number density ratio, which was varied by changing the
Anodized aluminium
Figure 8. Recombination coefficient of Cl atoms on stainless steel(closed symbols) as a function of the Cl-to-Cl2 number density ratiovaried by changing the plasma pressure (1.25–20 mTorr) and ICPpower (100–600 W). Previously reported recombination coefficientsobtained on an anodized aluminium substrate (open symbols) arealso shown for comparison [27]. Inverted triangles, triangles, circlesand squares correspond to 20, 10, 5 and 1.25 mTorr pressures.Dashed lines are first-order least squares fits.
pressure and ICP power. Recombination coefficients foran anodized Al substrate exposed to the same Cl2 plasmaconditions are also shown for comparison [27]. γCl forthe plasma-conditioned stainless steel surface increased from0.004 to 0.03 with increasing Cl-to-Cl2 number density ratio,and, within the scatter of the data, perhaps began to increasemore slowly or level off for Cl/Cl2 � 0.6. This behaviouris similar to that observed for plasma-conditioned anodizedAl, although γCl values are lower by about a factor of 2–3.This could result from the higher Si coverage on the plasma-conditioned stainless steel surface (45% versus 21.5% foranodized Al, see table 1) and the much lower recombinationcoefficient of Cl atoms on silica surfaces [17, 20, 38].
The values displayed in figure 8 for high Cl/Cl2 ratios arecomparable to the ones reported by Malyshev et al [21] ina chlorine ICP reactor with stainless steel and silica surfacesexposed to the plasma. In that study, a value of γCl = 0.04was extracted from the best agreement between the predictionsof a global model and the measured Cl2 neutral densities. Onthe other hand, Kota et al [20] reported a value of γCl = 0.7for Cl atoms impinging on stainless steel surfaces that weresputter-cleaned with a 500 eV Ar+ beam. As described above,in plasma reactors with large silica surfaces exposed to theplasma such as the ones investigated here and in Malyshevet al [21] one should find γCl values that are much lower thanthat on ‘bare’ stainless steel because of the expected coatingof sputtered silica on chamber walls [15, 17].
The increase of γCl with increasing Cl/Cl2 number densityratio presented in figure 8 was also observed previously foranodized Al [27], and was attributed to Cl2 adsorption thatblocks sites for Cl adsorption and L–H recombination; hencefor a given Cl number density, γCl decreases as the Cl2 numberdensity increases. To further validate this observation, we have
6
J. Phys. D: Appl. Phys. 42 (2009) 055206 L Stafford et al
Figure 9. Influence of gas pressure on the degree of Cl2 dissociationin a chlorine high-density plasma sustained by travellingelectromagnetic surface waves in a stainless steel chamber withlarge amount of silica exposed to the plasma. Dashed lines are thepredictions of a fluid model for different values of γCl (from [12]).
re-examined a comparison of measured and computed degreesof dissociation of Cl2 versus pressure in a high-density chlorineplasma [12]. In that study, the authors developed a simple fluidmodel in which the particle balance equations for electrons,Cl, Cl2, Cl+, Cl+
2 and Cl− were solved together with thecorresponding flux equations and the energy balance equations.The model was used to describe magnetized high-densitychlorine plasmas sustained by an electromagnetic surface wavein a reactor with large areas of stainless steel and silica surfacesexposed to the plasma. Figure 9 presents values of the Cl2percent dissociation, τd, measured in this plasma reactor usingactinometry on Cl2 molecules with Xe as the actinometer gas[39] and by plasma sampling mass spectrometry [40]. Theseresults are compared with those determined from the modelfor different values of γCl, as a function of pressure. In [12]it was concluded that the experimental data were best fittedwhen assuming a recombination coefficient of 0.02. Recently,Corr et al [22] confirmed this value in a Cl2 ICP, and alsothe fact that γCl is much lower than the 0.7 value reported byKota et al [20]. It is clear from figure 9, however, that thevalue of γCl that best matches the experimental data is notconstant, but rather decreases with increasing pressure from0.03 at 0.2 mTorr to 0.01–0.015 at 10 mTorr. These valuesfollow the same trend as the results presented in figure 8, andwhere overlapping, are in good agreement (see figure 10). Forexample, for a Cl/Cl2 number density ratio of 0.78 (200 W,1.25 mTorr), we found γCl = 0.018, which is similar to the0.01–0.015 value displayed in figure 9 at 10 mTorr, whereτd ≈ 30%, corresponds to nCl/nCl2 ≈ 0.8. Thus, consideringthat γCl depends on the Cl/Cl2 number density ratio rather thanbeing independent of plasma conditions yields a much betteragreement between the model predictions and the measureddegree of dissociation of Cl2 in the plasma.
This dependence of γCl on nCl/nCl2 are further validatedby adding on figure 10 the data points of Malyshev et al [21] in
Figure 10. Recombination coefficient of Cl atoms onplasma-conditioned stainless steel surfaces as a function of theCl-to-Cl2 number density ratio obtained from the spinning-substratetechnique (closed inverted triangles, triangles, circles and squarescorresponding to 20, 10, 5 and 1.25 mTorr pressures), along withvalues obtained through modelling of data from Stafford et al [12]of surface-wave plasmas (�) [40], from Malyshev andDonnelly [21] of a highly dissociated ICP (◦), from Corr et al [22]in a moderately dissociated ICP (�) and from Richards and Sawin ina weakly dissociated CCP (�).
a highly dissociated ICP (γCl = 0.04 for nCl/nCl2 ∼ 30), Corret al [22] (γCl = 0.02 for nCl/nCl2 ∼ 3) in a moderatelydissociated ICP and Richard and Sawin [41] in a weaklydissociated capacitively coupled plasma (CCP) (γCl = 0.007for nCl/nCl2 ∼ 0.08). This complete set of data suggestssome ‘universal dependence’ of the recombination coefficientof Cl atoms in the presence of adsorbed Cl2: γCl increases asthe Cl-to-Cl2 number density ratio in the plasma increases.The small difference between γCl values taken from differentreactors under comparable nCl/nCl2 conditions can probably beattributed to variations in Si coverage for one plasma reactorto the other. For example, the value obtained by Richards andSawin [41] is slightly higher than those obtained at 20 mTorr inthe spinning-substrate reactor; this is consistent with the muchsmaller silica surface exposed to the plasma in their reactorand thus the smaller deposition rate of silica on the stainlesssteel surface. Finally, it should be pointed out that the data infigure 2 of the report by Corr et al [22] also suggest a γCl thatdecreases with increasing pressure and therefore with Cl/Cl2number density ratio. It is however impossible to extract thefull dependence of γCl on nCl/nCl2 from this set of data due tothe limited number of γCl values investigated in the modellingof the pressure dependence of the Cl atom density.
4. Conclusion
In summary, we investigated the adsorption and desorptiondynamics of atomic and molecular chlorine on stainless steelsurfaces coated with a mostly silicon-oxychloride layer ininductively coupled chlorine plasmas using the spinning-substrate method. Substantial Cl2 adsorption and desorption
7
J. Phys. D: Appl. Phys. 42 (2009) 055206 L Stafford et al
was observed with the plasma off with desorption rates muchfaster than those obtained previously on plasma-conditionedanodized aluminium. This was ascribed to a lower numberof higher binding energy sites on stainless steel due to itssmoother surface morphology. A much larger desorption fluxof Cl2 was observed with the plasma on due to Langmuir–Hinshelwood recombination of Cl atoms. The recombinationcoefficient ranged from 0.004 to 0.03 and increased with Cl-to-Cl2 number density ratio. A similar dependence on this numberdensity ratio was observed for a rough anodized aluminiumsurface and was ascribed to blocking of Cl recombinationsites by transient adsorbed Cl2 [27]. It appears that a similarmechanism is occurring on the smoother stainless steel surface.This effect was also shown to explain the pressure-dependenceof the degree of dissociation of Cl2 that was previously foundin high-density chlorine plasmas with large areas of stainlesssteel and silica surfaces exposed to the plasma.
Acknowledgments
The authors would like to acknowledge Sung Joong Kang forhis help with SEM measurements. This research was supportedby the National Science and Engineering Research Council(NSERC), the National Science Foundation and Lam ResearchCorporation.
References
[1] Chang J P and Sawin H H 1997 J. Vac. Sci. Technol. A 15 1853[2] Chang J P, Arnold J C, Zau G C H, Shin H-S and Sawin H H
1997 J. Vac. Sci. Technol. A 15 610[3] Smith D L and Saviano P G 1982 J. Vac. Sci. Technol. 21 769[4] Danner D A and Hess D W 1986 J. Appl. Phys. 59 940[5] Mahorowala A P and Sawin H H 2002 J. Vac. Sci. Technol.
B 20 1077[6] Lee C, Graves D B and Lieberman M A 1996 Plasma Chem.
Plasma Process. 16 99[7] Lee C M and Lieberman M A 1995 J. Vac. Sci. Technol.
A 13 368[8] Deshmukh S C and Economou D J 1992 J. Appl. Phys. 72 4597[9] Wise R S, Lymberopoulos D P and Economou D J 1995
Plasma Sources Sci. Technol. 4 317[10] Lymberopoulos D P and Economou D J 1995 IEEE Trans.
Plasma Sci. 23 573[11] Malyshev M V and Donnelly V M 2001 J. Appl. Phys.
90 1130
[12] Stafford L, Margot J, Vidal F, Chaker M, Giroux K, Poirier J S,Quintal-Leonard A and Saussac J 2005 J. Appl. Phys.98 063301
[13] Lee G W and Kang Y B 2003 Electrochem. Solid State Lett.6 G49
[14] Miwa K and Mukai T 2002 J. Vac. Sci. Technol. B 20 2120[15] Cunge G, Joubert O and Sadeghi N 2003 J. Appl. Phys.
94 6285[16] Agarwal A and Kushner M J 2008 J. Vac. Sci. Technol.
A 26 498[17] Ullal S J, Godfrey A R, Edelberg E, Braly L, Vahedi V and
Aydil E S 2002 J. Vac. Sci. Technol. A 20 43[18] Guha J, Kurunczi P F, Stafford L, Donnelly V M and Pu Y-K
2008 J. Phys. Chem. C 112 8963[19] Stafford L, Guha J and Donnelly V M 2008 J. Vac. Sci.
Technol. A 26 455[20] Kota G P, Coburn J W and Graves D B 1998 J. Vac. Sci.
Technol. A 16 270[21] Malyshev M V and Donnelly V M 2000 J. Appl. Phys. 88 6207[22] Corr C S, Despiau-Pujo E, Chabert P, Graham W G, Marro F G
and Graves D B 2008 J. Phys. D: Appl. Phys. 41 185202[23] Tserepi A D and Miller T A 1995 J. Appl. Phys. 77 505[24] Gomez S, Steen P G and Graham W G 2002 Appl. Phys. Lett.
81 19[25] Hsu C-C, Nierode M A, Coburn J W and Graves D B 2006
J. Phys. D: Appl. Phys. 39 3272[26] Kurunczi P F, Guha J and Donnelly V M 2005 J. Phys.
Chem. B 109 20989[27] Guha J, Donnelly V M and Pu Y-K 2008 J. Appl. Phys.
103 013306[28] Kurunczi P F, Guha J and Donnelly V M 2006 Phys. Rev. Lett.
96 018306[29] Rao T, Vook R W, Meyer W and Joshi A 1986 J. Vac. Sci.
Technol. A 4 1604[30] Lee S-J and Lai J-J 2003 J. Mater. Proc. Technol. 140 206[31] Baker M A 1980 Thin Solid Films 69 359[32] Guha J, Pu Y-K and Donnelly V M 2006 J. Vac. Sci.
Technol. A 25 347–52[33] Oura K, Lifshits V G, Saranin A A, Zotov A V and
Katayama M 2003 Surface Science, An Introduction(Berlin: Springer) pp 295–308, chapter 12
[34] Kim Y C and Boudart M 1991 Langmuir 7 2999[35] Cartry G, Magne L and Cernogora G 2000 J. Phys. D: Appl.
Phys. 33 1303[36] Lafferty J M (ed) 1998 Foundations of Vacuum Science and
Technology (New York: Wiley) p 619[37] Malyshev M V and Donnelly V M 2000 J. Appl. Phys. 88 6207[38] Ogryzlo E A 1961 Can. J. Chem. 39 2256[39] Donnelly V M 1996 J. Vac. Sci. Technol. A 14 1076[40] Stafford L, Margot J, Chaker M and Pauna O 2003 J. Appl.
Phys. 93 1907[41] Richards A D and Sawin H H 1987 J. Appl. Phys. 62 799