Recommendation ITU-R F.758-7 (11/2019) System parameters and considerations in the development of criteria for sharing or compatibility between digital fixed wireless systems in the fixed service and systems in other services and other sources of interference F Series Fixed service
Transcript
Recommendation ITU-R F.758-7 (11/2019)
System parameters and considerations in the development of criteria for sharing
or compatibility between digital fixed wireless systems in the fixed service
and systems in other services and other sources of interference
F Series
Fixed service
ii Rec. ITU-R F.758-7
Foreword
The role of the Radiocommunication Sector is to ensure the rational, equitable, efficient and economical use of the radio-
frequency spectrum by all radiocommunication services, including satellite services, and carry out studies without limit
of frequency range on the basis of which Recommendations are adopted.
The regulatory and policy functions of the Radiocommunication Sector are performed by World and Regional
Radiocommunication Conferences and Radiocommunication Assemblies supported by Study Groups.
Policy on Intellectual Property Right (IPR)
ITU-R policy on IPR is described in the Common Patent Policy for ITU-T/ITU-R/ISO/IEC referenced in Resolution
ITU-R 1. Forms to be used for the submission of patent statements and licensing declarations by patent holders are
available from http://www.itu.int/ITU-R/go/patents/en where the Guidelines for Implementation of the Common Patent
Policy for ITU-T/ITU-R/ISO/IEC and the ITU-R patent information database can also be found.
Series of ITU-R Recommendations
(Also available online at http://www.itu.int/publ/R-REC/en)
Series Title
BO Satellite delivery
BR Recording for production, archival and play-out; film for television
BS Broadcasting service (sound)
BT Broadcasting service (television)
F Fixed service
M Mobile, radiodetermination, amateur and related satellite services
P Radiowave propagation
RA Radio astronomy
RS Remote sensing systems
S Fixed-satellite service
SA Space applications and meteorology
SF Frequency sharing and coordination between fixed-satellite and fixed service systems
SM Spectrum management
SNG Satellite news gathering
TF Time signals and frequency standards emissions
V Vocabulary and related subjects
Note: This ITU-R Recommendation was approved in English under the procedure detailed in Resolution ITU-R
1.
Electronic Publication
Geneva, 2019
ITU 2019
All rights reserved. No part of this publication may be reproduced, by any means whatsoever, without written permission of ITU.
and other antennas in point-to-multipoint systems for use in sharing studies in the frequency
range from 1 GHz to about 70 GHz.
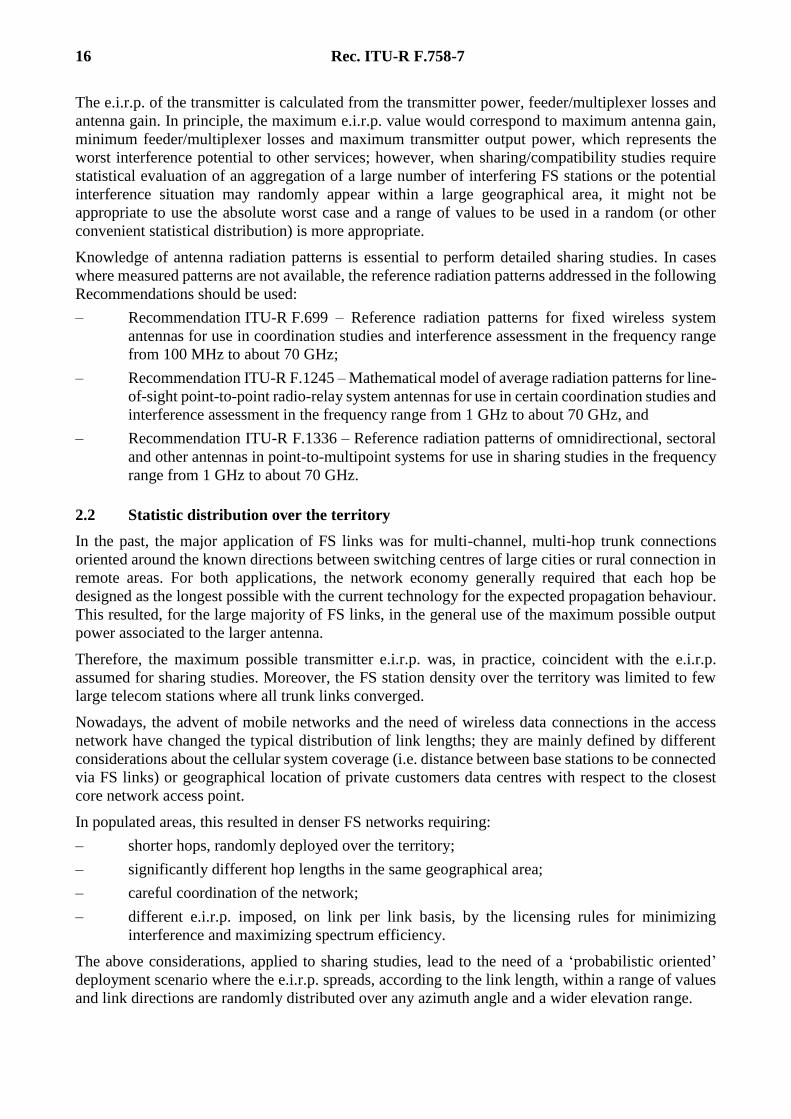
2.2 Statistic distribution over the territory
In the past, the major application of FS links was for multi-channel, multi-hop trunk connections
oriented around the known directions between switching centres of large cities or rural connection in
remote areas. For both applications, the network economy generally required that each hop be
designed as the longest possible with the current technology for the expected propagation behaviour.
This resulted, for the large majority of FS links, in the general use of the maximum possible output
power associated to the larger antenna.
Therefore, the maximum possible transmitter e.i.r.p. was, in practice, coincident with the e.i.r.p.
assumed for sharing studies. Moreover, the FS station density over the territory was limited to few
large telecom stations where all trunk links converged.
Nowadays, the advent of mobile networks and the need of wireless data connections in the access
network have changed the typical distribution of link lengths; they are mainly defined by different
considerations about the cellular system coverage (i.e. distance between base stations to be connected
via FS links) or geographical location of private customers data centres with respect to the closest
core network access point.
In populated areas, this resulted in denser FS networks requiring:
– shorter hops, randomly deployed over the territory;
– significantly different hop lengths in the same geographical area;
– careful coordination of the network;
– different e.i.r.p. imposed, on link per link basis, by the licensing rules for minimizing
interference and maximizing spectrum efficiency.
The above considerations, applied to sharing studies, lead to the need of a ‘probabilistic oriented’
deployment scenario where the e.i.r.p. spreads, according to the link length, within a range of values
and link directions are randomly distributed over any azimuth angle and a wider elevation range.
Rec. ITU-R F.758-7 17
The achievable link length decreases as the operating frequency increases, due to fixed power output
levels according to administration domestic regulatory requirements and higher propagation
attenuation. Therefore, for each band, the e.i.r.p. upper bound is limited by the maximum available
on the market, while the lower bound is, in practice, limited by the minimum ‘economic’ link length
in the band. In fact most licensing conditions imply a fee-per-link which decreases as the operating
band increases; therefore, the user is economically encouraged to use higher bands (where equipment
is also cheaper) for the shorter links instead of just reducing the e.i.r.p. in lower bands.
Therefore, the power output and e.i.r.p. ranges reported in Tables 6 through 13 give the sensible range
of values useful for ‘probabilistic’ studies.
As the link length distribution function is ultimately related to the geographical distribution of mobile
base stations or customer premises, the e.i.r.p. statistical distribution cannot be assumed ‘Gaussian’
but might be evaluated on a case-by-case basis. Attachment 1 to this Annex shows examples of these
calculations.
To build an accurate probabilistic model, a sharing model should distribute the fixed service links in
a nodal arrangement with random distribution over the geographical area. A weighted factor should
be assumed for urban, suburban and rural locations, which roughly identify the characteristics of the
FS used in average, to distribute the fixed nodes more accurately.
The weighting factor is dependent on the kind of fixed service to be deployed and should be
determined on a case-by-case basis. The actual percentage subdivision in these geographical areas
may vary from country to country. As an example, in one country, values of 60% / 30% / 10% are
used for urban, suburban and rural, respectively.
3 Receiver characterization
3.1 Equipment parameters
Assessment of the effects of interference into the FS from other services requires knowledge of the
performance characteristics of the radio receiver. The following receiver parameters are important
for frequency sharing studies:
– noise figure;
– noise bandwidth;
– receiver thermal noise power density;
– received signal power for 1 10−3, 1 10−6, 1 10−10 BER (post-error-correction) (Refer to
Note 1);
– nominal receiver input level.
NOTE 1 – Typically, for uncoded systems, the carrier level corresponding to 1 10−6 BER is around 4 dB
higher than that for 1 10–3 BER; the carrier level difference between the 1 10−6 and 1 10−10 BER points
is also about 4 dB. For radio equipment using forward error correction (FEC), the carrier level corresponding
to 1 10−6 BER is 1 to 2 dB higher than that for 1 10−3 BER; the carrier difference between 1 10−6 and
1 10−10 is also 1 to 2 dB. In the following Tables, the received signal power for 1 10−6 is only addressed,
since the corresponding parameters for other BERs could be theoretically derived from the modulation scheme
or the error correction effect.
The received signal levels and interference levels could be referenced to the low noise amplifier
(LNA)/mixer input of the receiver, so that they would be independent of receive antenna gain and
feeder/multiplexer losses (assuming this to be the same for both transmitter/receiver).
It should also be noted that deterministic (station-by-station) sharing calculations require information
on the frequency selectivity of the radio equipment. Generic sharing/compatibility studies, in the same
18 Rec. ITU-R F.758-7
allocated band, are usually based on co-channel interference situation; hence the noise bandwidth is
sufficient.
The required signal levels for given BERs could be derived from the calculated receiver thermal noise
level adding the required signal-to-thermal noise ratio, S/N, for a given BER. Information on
theoretical and practical S/N for the most common modulation formats may be found in
Recommendation ITU-R F.1101.
3.2 Permitted interference
It is necessary to specify maximum interference levels for both long- and short-term time percentages.
Where aggregate long-term interference is specified, if interference from multiple sources can
simultaneously occur, it should be noted that single-entry interference criteria will be correspondingly
lower. In the case of short-term interference, the time percentages of interest will be related to the
system performance objectives.
The long- and short-term interference levels, and associated time percentages, must be individually
derived for each system type in accordance with the principles described in Annex 1.
4 Tables of system parameters
Tables 6 to 14 show representative parameter values to be used in studies of sharing/compatibility for
digital FWS that are currently used in various frequency bands.
In most of the bands, a large variety (e.g. in terms of channel spacing and modulation formats) of FWS
are present in the world; their actual use in a geographical area depends on regional and national
allocations and needs. Therefore, the system parameters shown are not representative of any actual
FS system, but represent an averaging or an expected range of values suitable for generic
sharing/compatibility studies.
Each row in the Tables takes into account a specific parameter (or its expected range) that has been
defined or derived according to the principles in the following paragraphs.
4.1 Frequency range and its related reference ITU-R Recommendation
The range is approximate and generally covered by the relevant radio-frequency channel arrangement
Recommendation; actual band limits depend on regional and national allocations to FS.
4.2 Modulation format
For each frequency range, the two columns refer to two types of applications. The first is assumed as
representative of simpler (e.g. narrower band, low complexity modulation format) systems, which
often exhibit the higher e.i.r.p. density. The second is assumed to be representative of more complex
(e.g. wider band, high complexity modulation format) systems, which usually require high error
performance and are consequently assumed to be more sensitive to interference.
Sharing studies are generally independent of modulation, because they are based upon I/N objectives.
The modulation format, in principle, is useful only for the evaluation of Rx signal levels (nominal
and for BER 1 × 10⁻⁶), which may be used for short-term interference evaluation.
It should be noted that, mostly in point-to-multipoint (PMP) but also in point-to-point (PP), adaptive
modulation operation (i.e. the modulation is changed according to the propagation and/or intra-
system interference situation) can be used for increasing the available throughput/capacity of the
system when possible.
Rec. ITU-R F.758-7 19
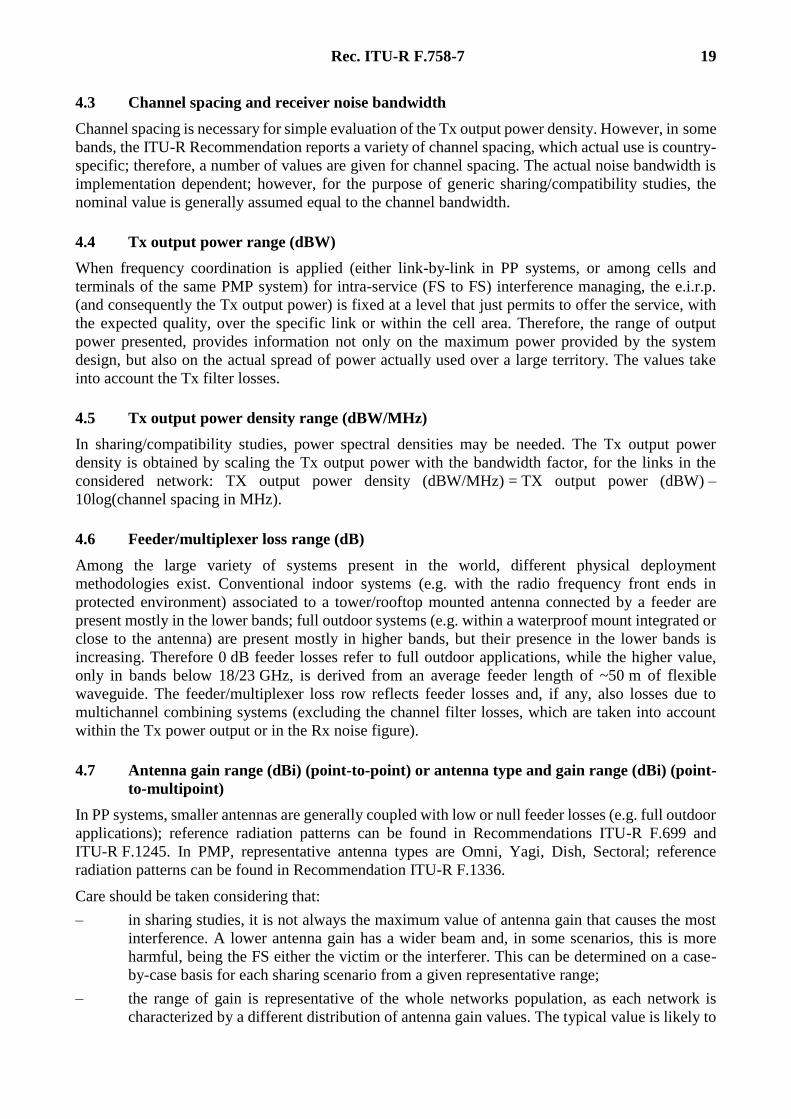
4.3 Channel spacing and receiver noise bandwidth
Channel spacing is necessary for simple evaluation of the Tx output power density. However, in some
bands, the ITU-R Recommendation reports a variety of channel spacing, which actual use is country-
specific; therefore, a number of values are given for channel spacing. The actual noise bandwidth is
implementation dependent; however, for the purpose of generic sharing/compatibility studies, the
nominal value is generally assumed equal to the channel bandwidth.
4.4 Tx output power range (dBW)
When frequency coordination is applied (either link-by-link in PP systems, or among cells and
terminals of the same PMP system) for intra-service (FS to FS) interference managing, the e.i.r.p.
(and consequently the Tx output power) is fixed at a level that just permits to offer the service, with
the expected quality, over the specific link or within the cell area. Therefore, the range of output
power presented, provides information not only on the maximum power provided by the system
design, but also on the actual spread of power actually used over a large territory. The values take
into account the Tx filter losses.
4.5 Tx output power density range (dBW/MHz)
In sharing/compatibility studies, power spectral densities may be needed. The Tx output power
density is obtained by scaling the Tx output power with the bandwidth factor, for the links in the
considered network: TX output power density (dBW/MHz) = TX output power (dBW) –
10log(channel spacing in MHz).
4.6 Feeder/multiplexer loss range (dB)
Among the large variety of systems present in the world, different physical deployment
methodologies exist. Conventional indoor systems (e.g. with the radio frequency front ends in
protected environment) associated to a tower/rooftop mounted antenna connected by a feeder are
present mostly in the lower bands; full outdoor systems (e.g. within a waterproof mount integrated or
close to the antenna) are present mostly in higher bands, but their presence in the lower bands is
increasing. Therefore 0 dB feeder losses refer to full outdoor applications, while the higher value,
only in bands below 18/23 GHz, is derived from an average feeder length of ~50 m of flexible
waveguide. The feeder/multiplexer loss row reflects feeder losses and, if any, also losses due to
multichannel combining systems (excluding the channel filter losses, which are taken into account
within the Tx power output or in the Rx noise figure).
4.7 Antenna gain range (dBi) (point-to-point) or antenna type and gain range (dBi) (point-
to-multipoint)
In PP systems, smaller antennas are generally coupled with low or null feeder losses (e.g. full outdoor
applications); reference radiation patterns can be found in Recommendations ITU-R F.699 and
ITU-R F.1245. In PMP, representative antenna types are Omni, Yagi, Dish, Sectoral; reference
radiation patterns can be found in Recommendation ITU-R F.1336.
Care should be taken considering that:
– in sharing studies, it is not always the maximum value of antenna gain that causes the most
interference. A lower antenna gain has a wider beam and, in some scenarios, this is more
harmful, being the FS either the victim or the interferer. This can be determined on a case-
by-case basis for each sharing scenario from a given representative range;
– the range of gain is representative of the whole networks population, as each network is
characterized by a different distribution of antenna gain values. The typical value is likely to
20 Rec. ITU-R F.758-7
lay somewhere in a given range, which would also depend on different national
considerations.
4.8 e.i.r.p. range (dBW)
The e.i.r.p. range depends on the above-mentioned Power output, feeder losses and antenna gain as
e.i.r.p. = (Tx output power) + (Antenna gain) – (Feeder losses). However, the actual e.i.r.p. range is
not to be computed as the direct sum of the highest and lowest values as the following considerations
apply:
– When a feeder losses range is given, the 0 dB value refers to full outdoor applications, which
usually exhibit moderate output power.
– Where regulatory limits apply, e.i.r.p. may not be equal to the maximum power plus the
maximum gain – the minimum feeder loss (in decibels).
– Systems with less complex modulation may, in principle, have low transmitter back-off and
consequent higher power; however, a design tailored on the average link budget required by
the market for that application suggests, for economy reasons, to maintain a moderate power.
Nevertheless, when used in smaller channel spacing, the e.i.r.p. density (dBW/MHz) may
become higher.
– Systems with higher order of modulation, require higher transmitter back-off and, when
associated to high capacity wideband systems, use the maximum power commonly available.
Nevertheless, the e.i.r.p. density (dBW/MHz) might not be the highest among FS
applications.
– In a given network, the highest Tx output power is not necessarily associated with the highest
antenna gain.
The e.i.r.p. at different antenna directions may be calculated taking into account the antenna radiation
pattern.
4.9 e.i.r.p. density range (dBW/MHz)
In sharing/compatibility studies, the e.i.r.p. spectral density is often used. It can be easily obtained by
scaling with the bandwidth factor for the links in the considered network: e.i.r.p. density (dBW/MHz)
= e.i.r.p. (dBW) – 10log (channel spacing in MHz).
In some cases, a mode is also provided, where the mode is the statistical parameter for the most
frequently occurring value.
4.10 Receiver noise figure typical (dB)
The receiver noise figure includes the Rx filter losses. The value is intended to be a cost-effective
balancing for the application (mostly dependent on the required link budget targeted in the system
design).
4.11 Receiver noise power density typical (dBW/MHz)
The receiver noise power density typical is derived from the thermal noise power density and is
described as: −144 dBW/MHz + Noise figure. Absolute Rx noise power may be derived adding the
nominal noise bandwidth factor = 10 log(channel spacing (in MHz)).
Rec. ITU-R F.758-7 21
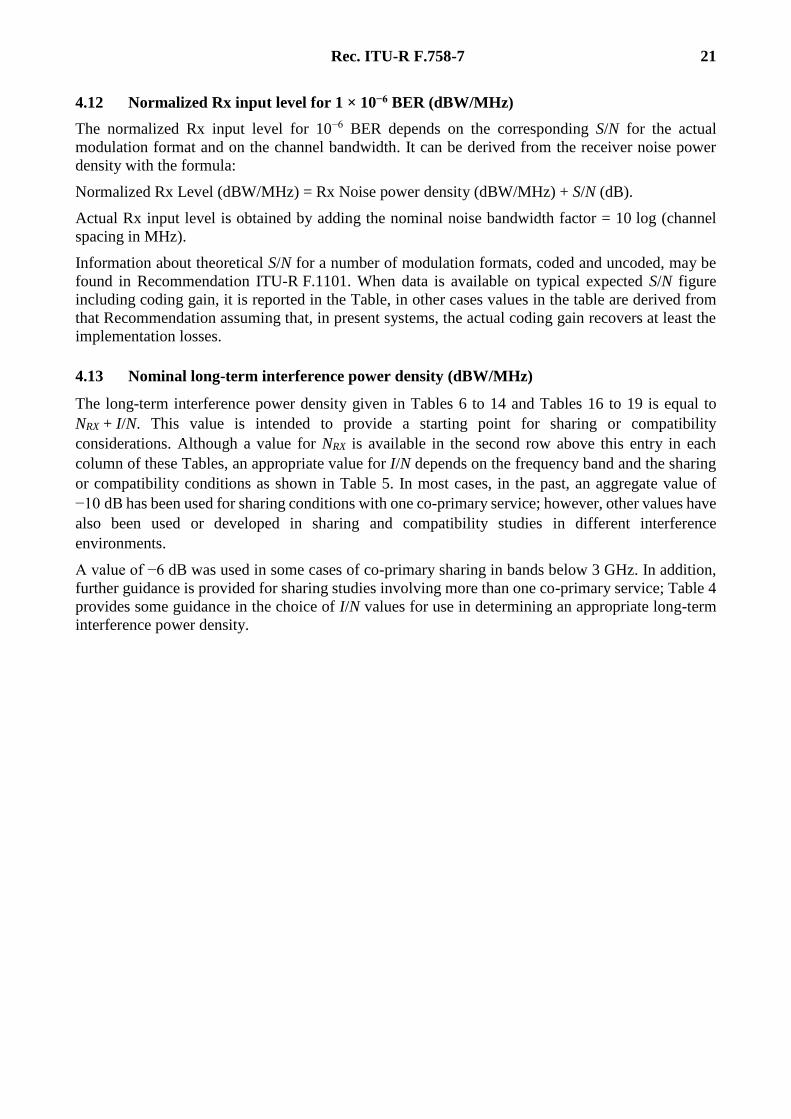
4.12 Normalized Rx input level for 1 × 10⁻⁶ BER (dBW/MHz)
The normalized Rx input level for 10−6 BER depends on the corresponding S/N for the actual
modulation format and on the channel bandwidth. It can be derived from the receiver noise power
density with the formula:
Normalized Rx Level (dBW/MHz) = Rx Noise power density (dBW/MHz) + S/N (dB).
Actual Rx input level is obtained by adding the nominal noise bandwidth factor = 10 log (channel
spacing in MHz).
Information about theoretical S/N for a number of modulation formats, coded and uncoded, may be
found in Recommendation ITU-R F.1101. When data is available on typical expected S/N figure
including coding gain, it is reported in the Table, in other cases values in the table are derived from
that Recommendation assuming that, in present systems, the actual coding gain recovers at least the
implementation losses.
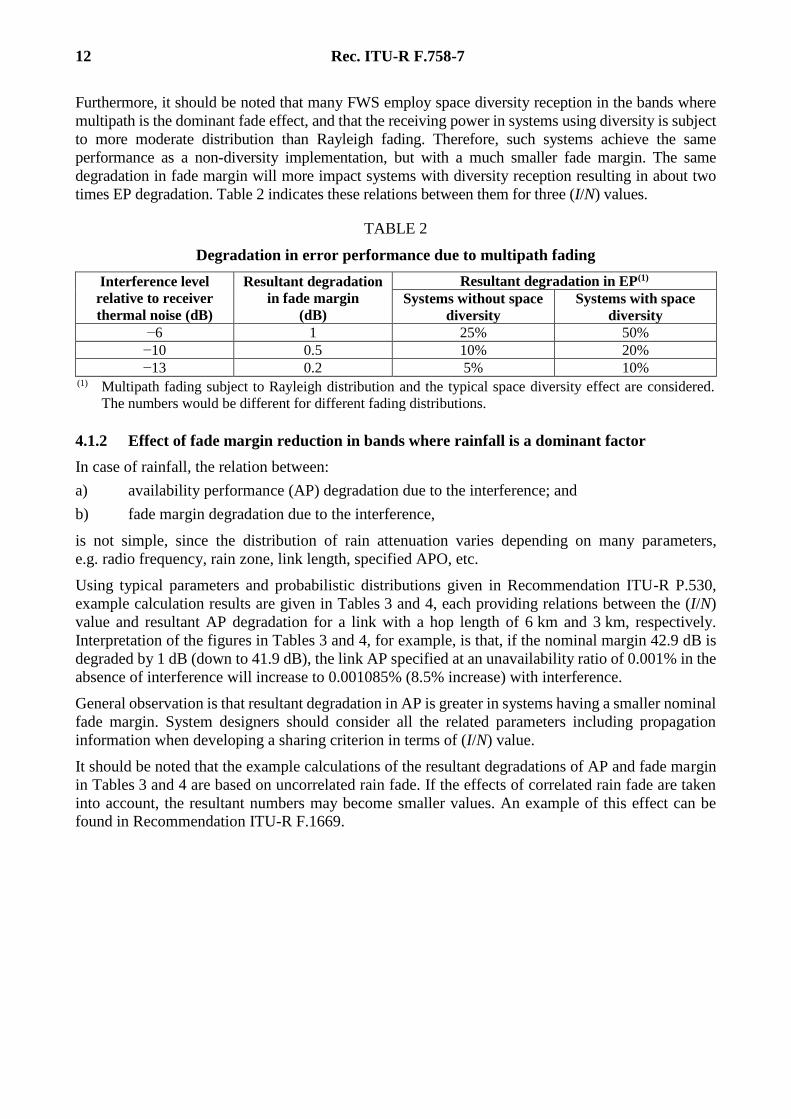
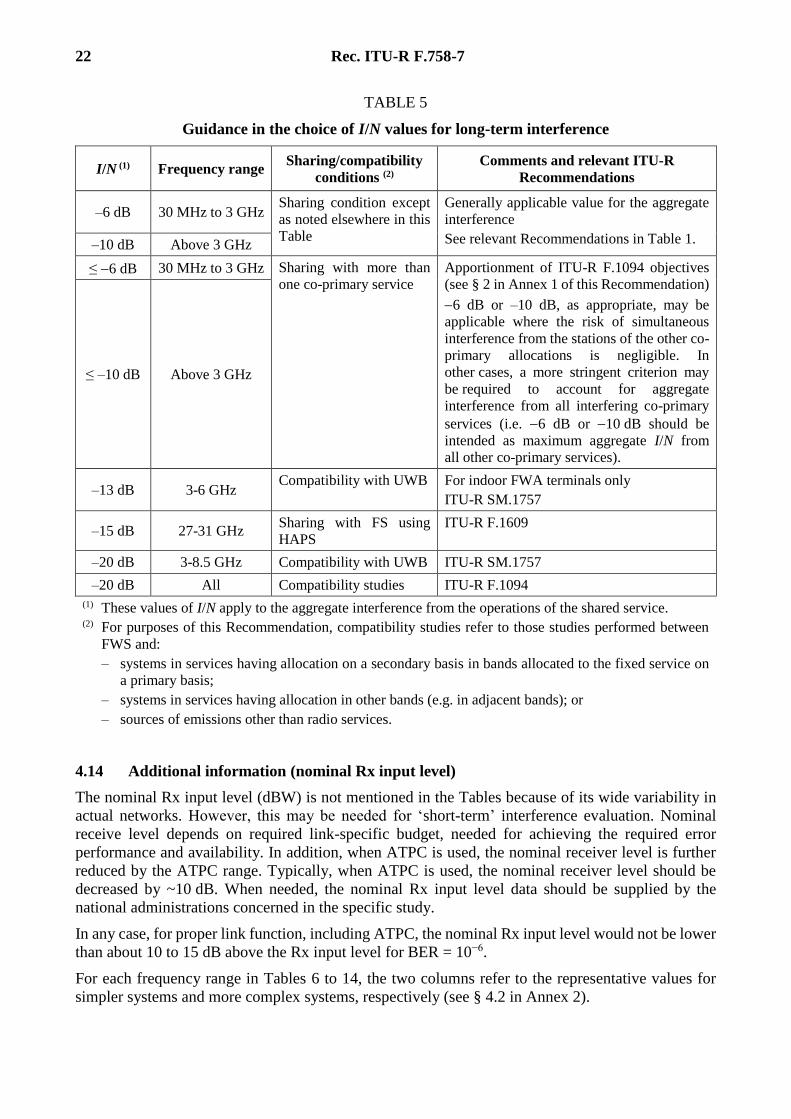
4.13 Nominal long-term interference power density (dBW/MHz)
The long-term interference power density given in Tables 6 to 14 and Tables 16 to 19 is equal to
NRX + I/N. This value is intended to provide a starting point for sharing or compatibility
considerations. Although a value for NRX is available in the second row above this entry in each
column of these Tables, an appropriate value for I/N depends on the frequency band and the sharing
or compatibility conditions as shown in Table 5. In most cases, in the past, an aggregate value of
−10 dB has been used for sharing conditions with one co-primary service; however, other values have
also been used or developed in sharing and compatibility studies in different interference
environments.
A value of −6 dB was used in some cases of co-primary sharing in bands below 3 GHz. In addition,
further guidance is provided for sharing studies involving more than one co-primary service; Table 4
provides some guidance in the choice of I/N values for use in determining an appropriate long-term
interference power density.
22 Rec. ITU-R F.758-7
TABLE 5
Guidance in the choice of I/N values for long-term interference
I/N (1) Frequency range Sharing/compatibility
conditions (2)
Comments and relevant ITU-R
Recommendations
–6 dB 30 MHz to 3 GHz Sharing condition except
as noted elsewhere in this
Table
Generally applicable value for the aggregate
interference
See relevant Recommendations in Table 1. –10 dB Above 3 GHz
≤ 6 dB 30 MHz to 3 GHz Sharing with more than
one co-primary service
Apportionment of ITU-R F.1094 objectives
(see § 2 in Annex 1 of this Recommendation)
6 dB or –10 dB, as appropriate, may be
applicable where the risk of simultaneous
interference from the stations of the other co-
primary allocations is negligible. In
other cases, a more stringent criterion may
be required to account for aggregate
interference from all interfering co-primary
services (i.e. 6 dB or 10 dB should be
intended as maximum aggregate I/N from
all other co-primary services).
≤ –10 dB Above 3 GHz
–13 dB 3-6 GHz Compatibility with UWB For indoor FWA terminals only
ITU-R SM.1757
–15 dB 27-31 GHz Sharing with FS using
HAPS
ITU-R F.1609
–20 dB 3-8.5 GHz Compatibility with UWB ITU-R SM.1757
–20 dB All Compatibility studies ITU-R F.1094
(1) These values of I/N apply to the aggregate interference from the operations of the shared service. (2) For purposes of this Recommendation, compatibility studies refer to those studies performed between
FWS and:
– systems in services having allocation on a secondary basis in bands allocated to the fixed service on
a primary basis;
– systems in services having allocation in other bands (e.g. in adjacent bands); or
– sources of emissions other than radio services.
4.14 Additional information (nominal Rx input level)
The nominal Rx input level (dBW) is not mentioned in the Tables because of its wide variability in
actual networks. However, this may be needed for ‘short-term’ interference evaluation. Nominal
receive level depends on required link-specific budget, needed for achieving the required error
performance and availability. In addition, when ATPC is used, the nominal receiver level is further
reduced by the ATPC range. Typically, when ATPC is used, the nominal receiver level should be
decreased by ~10 dB. When needed, the nominal Rx input level data should be supplied by the
national administrations concerned in the specific study.
In any case, for proper link function, including ATPC, the nominal Rx input level would not be lower
than about 10 to 15 dB above the Rx input level for BER = 10−6.
For each frequency range in Tables 6 to 14, the two columns refer to the representative values for
simpler systems and more complex systems, respectively (see § 4.2 in Annex 2).
Rec. ITU-R F.758-7 23
TABLE 6
System parameters for PP FS systems in allocated bands below 3 GHz
NOTE – The intended set of parameters for two reference systems for sharing/compatibility studies currently are partially or completely unavailable; On a provisional basis, the
parameters reported in Annex 3 for the same bands may be used. (1) Receiver noise power density in the channel will be −159 dBW/12.5 kHz. (2) Normalize Rx input level for 1 × 10⁻⁶ BER in the channel will be −140 dBW/12.5 kHz. (3) Nominal long-term interference power density in the channel will be −159+I/N dBW /12.5 kHz.
24 Rec. ITU-R F.758-7
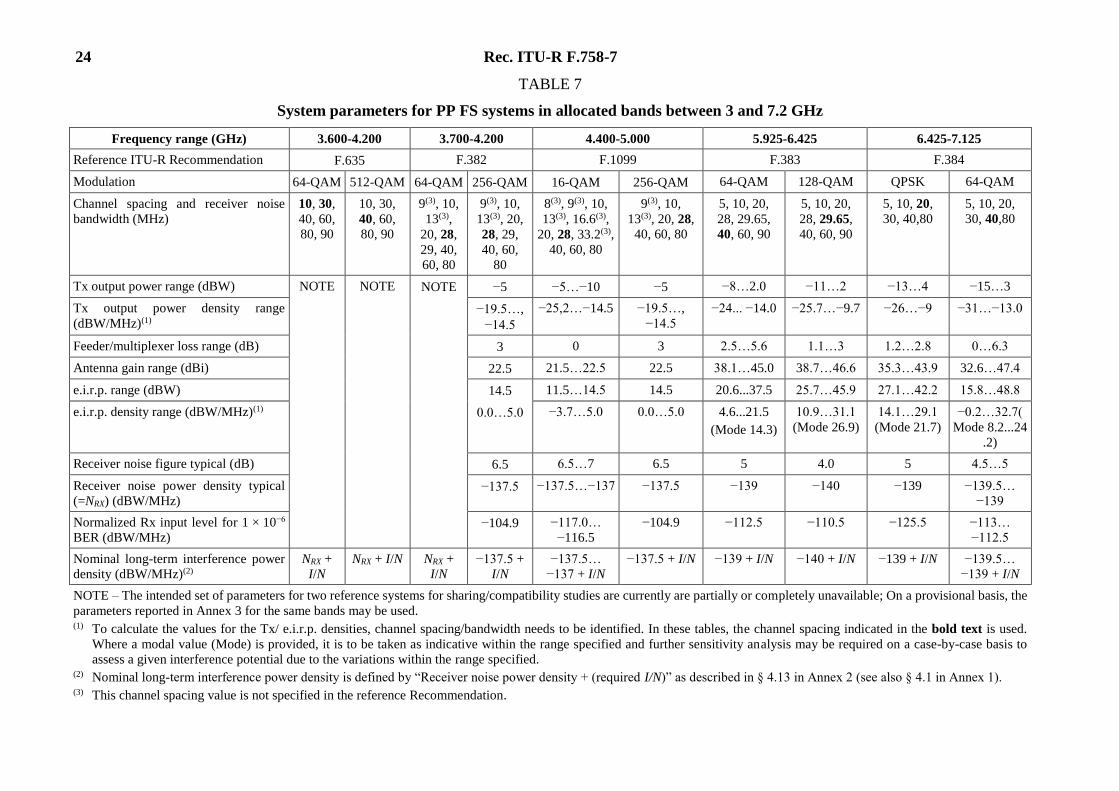
TABLE 7
System parameters for PP FS systems in allocated bands between 3 and 7.2 GHz
Frequency range (GHz) 3.600-4.200 3.700-4.200 4.400-5.000 5.925-6.425 6.425-7.125
NOTE – The intended set of parameters for two reference systems for sharing/compatibility studies are currently are partially or completely unavailable; On a provisional basis, the
parameters reported in Annex 3 for the same bands may be used. (1) To calculate the values for the Tx/ e.i.r.p. densities, channel spacing/bandwidth needs to be identified. In these tables, the channel spacing indicated in the bold text is used.
Where a modal value (Mode) is provided, it is to be taken as indicative within the range specified and further sensitivity analysis may be required on a case-by-case basis to
assess a given interference potential due to the variations within the range specified. (2) Nominal long-term interference power density is defined by “Receiver noise power density + (required I/N)” as described in § 4.13 in Annex 2 (see also § 4.1 in Annex 1). (3) This channel spacing value is not specified in the reference Recommendation.
Rec. ITU-R F.758-7 25
TABLE 8
System parameters for PP FS systems in allocated bands between 7.1 and 14 GHz
Frequency range (GHz) 7.110-7.900 7.725-8.500 10.5-10.68 10.7-11.7 12.75-13.25
NOTE – The intended set of parameters for two reference systems for sharing/compatibility studies currently are partially or completely unavailable; On a provisional basis, the
parameters reported in Annex 3 for the same bands may be used. (1) To calculate the values for the Tx/e.i.r.p. densities, channel spacing/bandwidth needs to be identified. In these tables, the channel spacing indicated in the bold text is used.
Where a modal value (Mode) is provided, it is to be taken as indicative within the range specified and further sensitivity analysis may be required on a case-by-case basis to
assess a given interference potential due to the variations within the range specified. (2) Nominal long-term interference power density is defined by “Receiver noise power density + (required I/N)” as described in § 4.13 in Annex 2 (see also § 4.1 in Annex 1). (3) This channel spacing value is not specified in the reference Recommendation.
26 Rec. ITU-R F.758-7
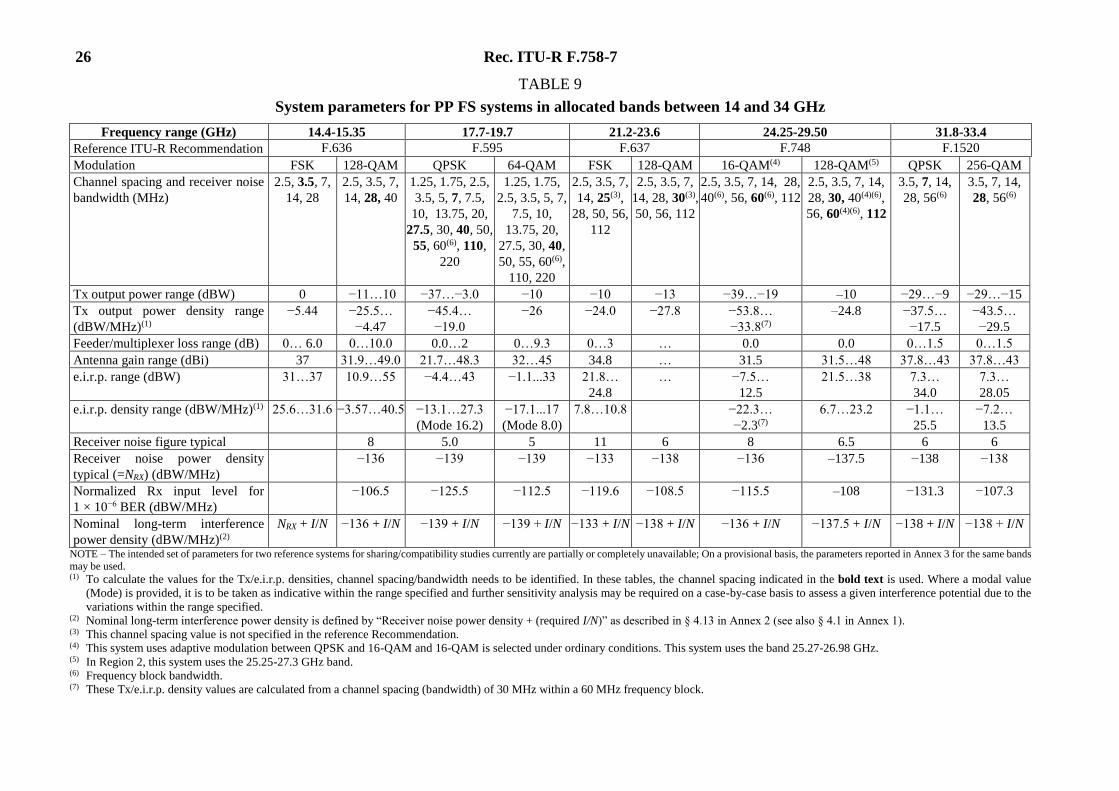
TABLE 9
System parameters for PP FS systems in allocated bands between 14 and 34 GHz
Frequency range (GHz) 14.4-15.35 17.7-19.7 21.2-23.6 24.25-29.50 31.8-33.4
NOTE – The intended set of parameters for two reference systems for sharing/compatibility studies currently are partially or completely unavailable; On a provisional basis, the parameters reported in Annex 3 for the same bands
may be used. (1) To calculate the values for the Tx/e.i.r.p. densities, channel spacing/bandwidth needs to be identified. In these tables, the channel spacing indicated in the bold text is used. Where a modal value
(Mode) is provided, it is to be taken as indicative within the range specified and further sensitivity analysis may be required on a case-by-case basis to assess a given interference potential due to the
variations within the range specified. (2) Nominal long-term interference power density is defined by “Receiver noise power density + (required I/N)” as described in § 4.13 in Annex 2 (see also § 4.1 in Annex 1). (3) This channel spacing value is not specified in the reference Recommendation. (4) This system uses adaptive modulation between QPSK and 16-QAM and 16-QAM is selected under ordinary conditions. This system uses the band 25.27-26.98 GHz. (5) In Region 2, this system uses the 25.25-27.3 GHz band. (6) Frequency block bandwidth. (7) These Tx/e.i.r.p. density values are calculated from a channel spacing (bandwidth) of 30 MHz within a 60 MHz frequency block.
Rec. ITU-R F.758-7 27
TABLE 10
System parameters for PP FS systems in allocated bands between 36 and 59 GHz
NOTE – The intended set of parameters for two reference systems for sharing/compatibility studies currently are partially or completely unavailable. On provisional
basis, the parameters reported in Annex 3 for the same bands may be used. (1) To calculate the values for the Tx/e.i.r.p. densities, channel spacing/bandwidth needs to be identified. In these tables, the channel spacing indicated in the bold
text is used. Where a modal value (Mode) is provided, it is to be taken as indicative within the range specified and further sensitivity analysis may be required
on a case-by-case basis to assess a given interference potential due to the variations within the range specified. (2) Nominal long-term interference power density is defined by “Receiver noise power density + (required I/N)” as described in § 4.13 in Annex 2 (see also § 4.1
in Annex 1). (3) This channel spacing value is not specified in the reference Recommendation.
28 Rec. ITU-R F.758-7
TABLE 11
System parameters for PP FS systems in allocated bands beyond 59 GHz
(1) To calculate the values for the Tx/ e.i.r.p. densities, channel spacing/bandwidth needs to be identified. In these tables, the channel spacing indicated in the bold
text is used. Where a modal value (Mode) is provided, it is to be taken as indicative within the range specified and further sensitivity analysis may be required
on a case-by-case basis to assess a given interference potential due to the variations within the range specified. (2) Nominal long-term interference power density is defined by “Receiver noise power density + (required I/N)” as described in § 4.13 in Annex 2 (see also § 4.1 in
Annex 1). (3) This channel spacing value is not specified in the reference Recommendation.
Rec. ITU-R F.758-7 29
TABLE 12
System parameters of PMP FS systems below 0.47 GHz
Frequency range
(GHz) 0.457-0.464
Reference ITU-R Recommendation
Modulation format Central stations
4-FSK, QPSK
Terminal stations
4-FSK, QPSK
Channel spacing and receiver noise bandwidth (MHz) 0.0125 0.0125
Maximum Tx output power range (dBW) 1 to 10 1 to 10
Maximum Tx output power density range
(dBW/MHz)(1)
20 to 29 20 to 29
Minimum feeder/multiplexer loss range (dB) 1 … 3 1 … 4
Maximum antenna gain range (dBi) 2 … 11
(omni / sectoral)
8 … 17
(directional)
Maximum e.i.r.p. range (dBW) 14 to 20 18 to 24
Maximum e.i.r.p. density range (dBW/MHz)(1) 33 to 39 37 to 43
Receiver noise figure (dB) 4 4
Receiver noise power density typical (=NRX)
(dBW/MHz)
–140 (1) –140(1)
Normalized Rx input level for 1 × 10⁻⁶ BER
(dBW/MHz)
–121(2) –121(2)
Nominal long-term interference power density
(dBW/MHz)(2)
–140 + I/N(3) –140 + I/N(3)
(1) Receiver noise power density in the channel will be −159 dBW/12.5 kHz. (2) Normalize Rx input level for 1 × 10⁻⁶ BER in the channel will be −140 dBW/12.5 kHz. (3) Nominal long-term interference power density in the channel will be −159 + I/N dBW / 12.5 kHz.
30 Rec. ITU-R F.758-7
TABLE 13
System parameters of PMP FS systems in allocated bands between 1.3 and 11 GHz
NOTE – The intended set of parameters for two reference systems for sharing/compatibility studies currently are partially or completely unavailable. On a provisional basis, the parameters reported in
Annex 3 for the same bands may be used. (1) To calculate the values for the Tx/e.i.r.p. densities, channel spacing/bandwidth needs to be identified. In these tables, the channel spacing indicated in the bold text is used. Where a modal value
(Mode) is provided, it is to be taken as indicative within the range specified and further sensitivity analysis may be required on a case-by-case basis to assess a given interference potential due to
the variations within the range specified. (2) Nominal long-term interference power density is defined by “Receiver noise power density + (required I/N)” as described in § 4.13 in Annex 2 (see also § 4.1 in Annex 1). (3) This channel spacing value is not specified in the reference Recommendation. (4) Frequency block bandwidth. (5) The modulation format is usually changed dynamically according to the propagation impairment. (6) Recommendation ITU-R F.701 recommends only a basic pattern of 0.5 MHz (or its integer multiple). The values of 5, 5.5 and 6 MHz are proposed as most common channel spacings for these
systems. (7) Recommendation ITU-R F.1488 recommends only a basic pattern of 0.25 MHz (or its integer multiple). The values of 1.75, 3.5, … 14 MHz are proposed as most common channel spacings for
these systems.
Rec. ITU-R F.758-7 31
TABLE 14
System parameters of PMP FS systems in allocated bands above 11 GHz
NOTE – The intended set of parameters for two reference systems for sharing/compatibility studies currently are partially or completely unavailable; On a provisional basis, the parameters reported
in Annex 3 for the same bands may be used. (1) To calculate the values for the Tx/e.i.r.p. densities, channel spacing/bandwidth needs to be identified. In these tables, the channel spacing indicated in the bold text is used. Where a modal value
(Mode) is provided, it is to be taken as indicative within the range specified and further sensitivity analysis may be required on a case-by-case basis to assess a given interference potential due to
the variations within the range specified. (2) Nominal long-term interference power density is defined by “Receiver noise power density + (required I/N)” as described in § 4.13 in Annex 2 (see also § 4.1 in Annex 1). (3) This channel spacing value is not specified in the reference Recommendation. (4) Frequency block bandwidth. (5) These Tx/e.i.r.p. density values are calculated from a channel spacing (bandwidth) of 30 MHz within a 60 MHz frequency block. (6) The modulation format is usually changed dynamically according to the propagation impairment.
32 Rec. ITU-R F.758-7
Attachment 1
to Annex 2
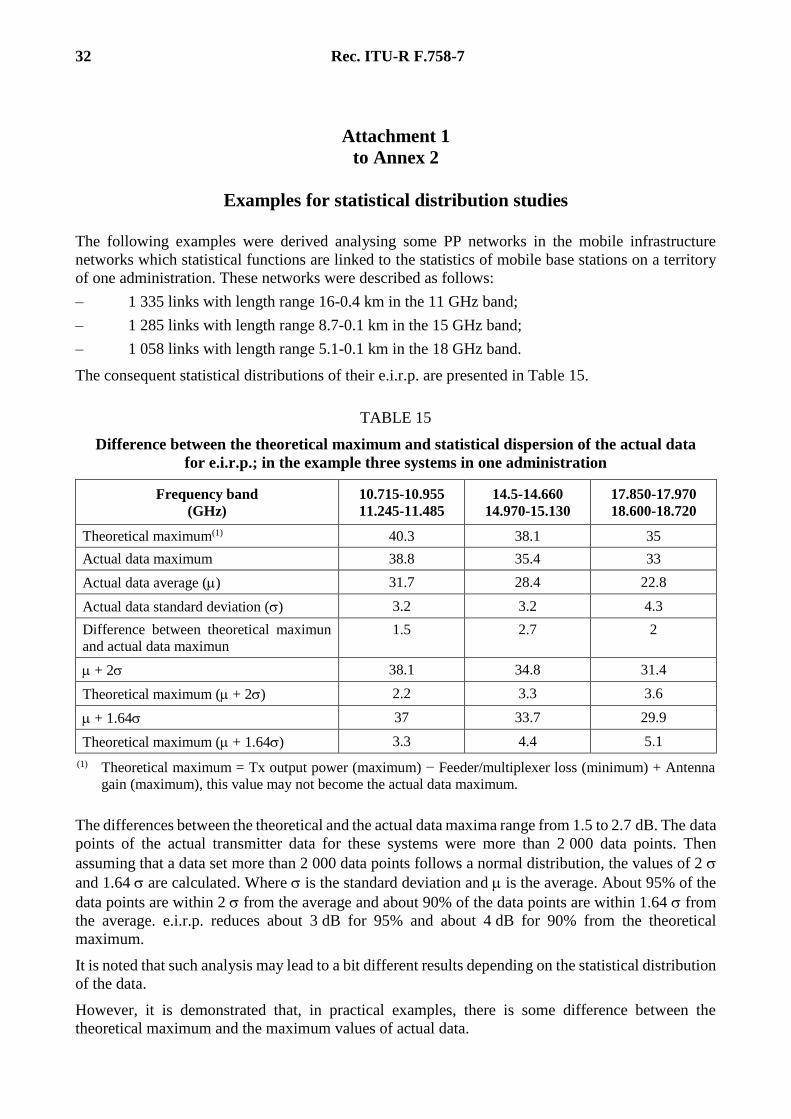
Examples for statistical distribution studies
The following examples were derived analysing some PP networks in the mobile infrastructure
networks which statistical functions are linked to the statistics of mobile base stations on a territory
of one administration. These networks were described as follows:
– 1 335 links with length range 16-0.4 km in the 11 GHz band;
– 1 285 links with length range 8.7-0.1 km in the 15 GHz band;
– 1 058 links with length range 5.1-0.1 km in the 18 GHz band.
The consequent statistical distributions of their e.i.r.p. are presented in Table 15.
TABLE 15
Difference between the theoretical maximum and statistical dispersion of the actual data
for e.i.r.p.; in the example three systems in one administration
Frequency band
(GHz)
10.715-10.955
11.245-11.485
14.5-14.660
14.970-15.130
17.850-17.970
18.600-18.720
Theoretical maximum(1) 40.3 38.1 35
Actual data maximum 38.8 35.4 33
Actual data average () 31.7 28.4 22.8
Actual data standard deviation () 3.2 3.2 4.3
Difference between theoretical maximun
and actual data maximun
1.5 2.7 2
+ 2 38.1 34.8 31.4
Theoretical maximum ( + 2) 2.2 3.3 3.6
+ 1.64 37 33.7 29.9
Theoretical maximum ( + 1.64) 3.3 4.4 5.1
(1) Theoretical maximum = Tx output power (maximum) − Feeder/multiplexer loss (minimum) + Antenna
gain (maximum), this value may not become the actual data maximum.
The differences between the theoretical and the actual data maxima range from 1.5 to 2.7 dB. The data
points of the actual transmitter data for these systems were more than 2 000 data points. Then
assuming that a data set more than 2 000 data points follows a normal distribution, the values of 2
and 1.64 are calculated. Where is the standard deviation and is the average. About 95% of the
data points are within 2 from the average and about 90% of the data points are within 1.64 from
the average. e.i.r.p. reduces about 3 dB for 95% and about 4 dB for 90% from the theoretical
maximum.
It is noted that such analysis may lead to a bit different results depending on the statistical distribution
of the data.
However, it is demonstrated that, in practical examples, there is some difference between the
theoretical maximum and the maximum values of actual data.
Rec. ITU-R F.758-7 33
Annex 3
Other FS specific system parameters
The information in this Annex still represents real systems deployed along the times. Some of these
parameters may be obsolete but no new consolidated set of parameters have been yet contributed
from administrations; however, they can still be used on a provisional basis when reference systems
data, for the interested bands, are not found in the Tables in Annex 2.
This Annex is based on Report ITU-R F.2108. The following terms are updated:
- The terms ‘Hub’, ‘Base station’, ‘Central station’ have been unified to ‘Central station’.
- The terms ‘Remote station’, ‘Out station’, ‘Terminal station’ have been unified to ‘Terminal
station’.
For each frequency range in Tables 16 to 19, the two columns refer to the representative values for
simpler systems and more complex systems, respectively (see § 4.3 in Annex 2).
34 Rec. ITU-R F.758-7
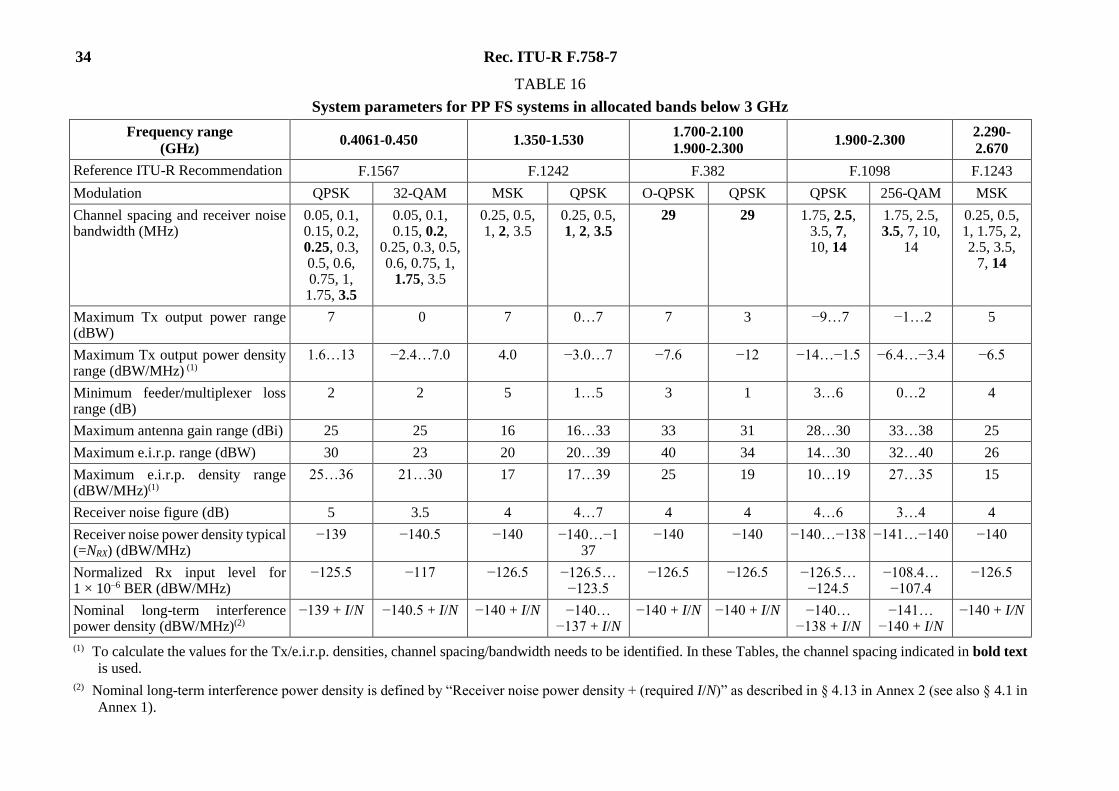
TABLE 16
System parameters for PP FS systems in allocated bands below 3 GHz
(1) To calculate the values for the Tx/e.i.r.p. densities, channel spacing/bandwidth needs to be identified. In these Tables, the channel spacing indicated in bold text
is used.
(2) Nominal long-term interference power density is defined by “Receiver noise power density + (required I/N)” as described in § 4.13 in Annex 2 (see also § 4.1 in
Annex 1).
Rec. ITU-R F.758-7 35
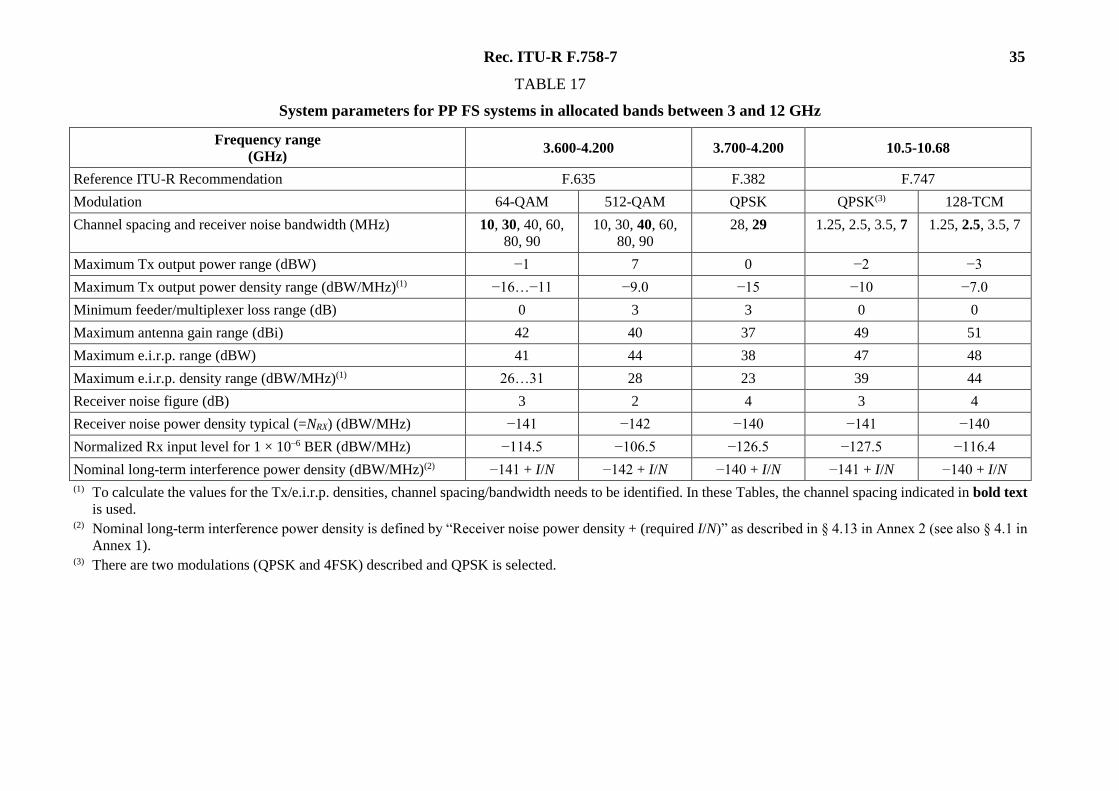
TABLE 17
System parameters for PP FS systems in allocated bands between 3 and 12 GHz
(1) To calculate the values for the Tx/e.i.r.p. densities, channel spacing/bandwidth needs to be identified. In these Tables, the channel spacing indicated in bold text
is used. (2) Nominal long-term interference power density is defined by “Receiver noise power density + (required I/N)” as described in § 4.13 in Annex 2 (see also § 4.1 in
Annex 1).
(3) There are two modulations (QPSK and 4FSK) described and QPSK is selected.
36 Rec. ITU-R F.758-7
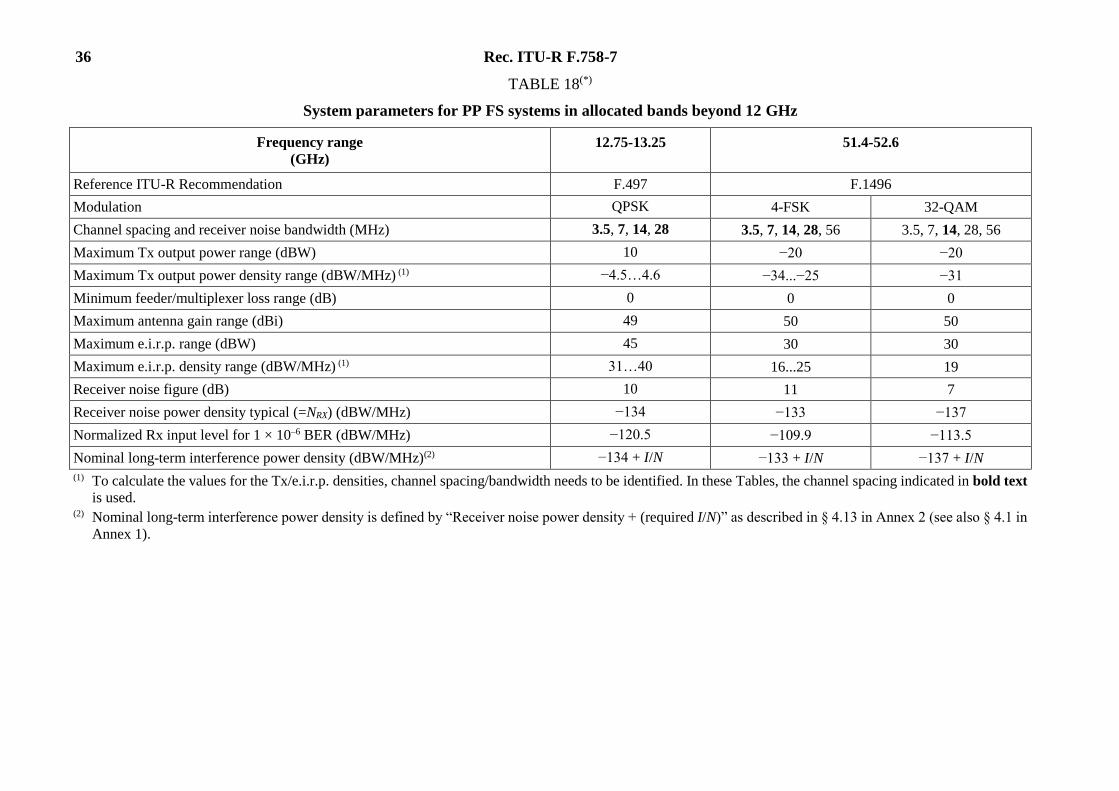
TABLE 18(*)
System parameters for PP FS systems in allocated bands beyond 12 GHz
Maximum Tx output power density range (dBW/MHz) (1) −4.5…4.6 −34...−25 −31
Minimum feeder/multiplexer loss range (dB) 0 0 0
Maximum antenna gain range (dBi) 49 50 50
Maximum e.i.r.p. range (dBW) 45 30 30
Maximum e.i.r.p. density range (dBW/MHz) (1) 31…40 16...25 19
Receiver noise figure (dB) 10 11 7
Receiver noise power density typical (=NRX) (dBW/MHz) −134 −133 −137
Normalized Rx input level for 1 × 10⁻⁶ BER (dBW/MHz) −120.5 −109.9 −113.5
Nominal long-term interference power density (dBW/MHz)(2) −134 + I/N −133 + I/N −137 + I/N
(1) To calculate the values for the Tx/e.i.r.p. densities, channel spacing/bandwidth needs to be identified. In these Tables, the channel spacing indicated in bold text
is used. (2) Nominal long-term interference power density is defined by “Receiver noise power density + (required I/N)” as described in § 4.13 in Annex 2 (see also § 4.1 in
Maximum Tx output power density range (dBW/MHz)(1) −3.0…1.6 −3.0…1.6
Minimum feeder/multiplexer loss range (dB) 0…4.4 0…4
Maximum antenna gain range (dBi) 13 (omni/sectoral)
... 17 (omni/section)
17.5 (yagi/horn)
... 27 (dish/horn)
Maximum e.i.r.p. range (dBW) 6…24 16…34
Maximum e.i.r.p. density range (dBW/MHz)(1) 3.0…19 13…29
Receiver noise figure (dB) 3.5…4 3.5…4
Receiver noise power density typical (=NRX) (dBW/MHz) −140.5…−140 −140.5…−140
Normalized Rx input level for 1 × 10⁻⁶ BER (dBW/MHz) −127…−126.5 −127…−126.5
Nominal long-term interference power density (dBW/MHz)(2) −140.5…−140 + I/N −140.5…−140 + I/N
(1) To calculate the values for the Tx/e.i.r.p. densities, channel spacing/bandwidth needs to be identified. In
these tables, the channel spacing indicated in bold text is used. (2) Nominal long-term interference power density is defined by “Receiver noise power density + (required
I/N)” as described in § 4.13 in Annex 2 (see also § 4.1 in Annex 1). (3) There are systems using O-QPSK and QPSK in the band and the QPSK system is selected since it has all
the parameters. (4) Recommendation ITU-R F.701 recommends only a basic pattern of 0.5 MHz (or its integer multiple). The
values of 2 and 3.5 MHz are proposed as most common channel spacings for these systems.