Stage 4 Distribution, July 1, 2009 December 2006 (Revised May 2009) Technical Memorandum: UCPRC-TM-2006-13 R R R e e e c c c o o o m m m m m m e e e n n n d d d a a a t t t i i i o o o n n n o o o f f f a a a G G G r r r a a a v v v e e e l l l F F F a a a c c c t t t o o o r r r f f f o o o r r r P P P u u u l l l v v v e e e r r r i i i z z z e e e d d d A A A s s s p p p h h h a a a l l l t t t C C C o o o n n n c c c r r r e e e t t t e e e U U U s s s e e e d d d a a a s s s a a a n n n U U U n n n b b b o o o u u u n n n d d d B B B a a a s s s e e e Authors: Bruce Steven, Eung-Jin Jeon, and John T. Harvey Work Conducted as part of Partnered Pavement Research Center Strategic Plan Element No. 2.4.2: Recommend G f for Rehabilitation by Pulverization of Existing Base PREPARED FOR: California Department of Transportation (Caltrans) Caltrans District 2 Office of Pavement Rehabilitation PREPARED BY: University of California Pavement Research Center Davis and Berkeley
Authors:Bruce Steven, Eung-Jin Jeon, and John T. Harvey
Work Conducted as part of Partnered Pavement Research Center Strategic Plan Element No. 2.4.2:
Recommend Gf for Rehabilitation by Pulverization of Existing Base
PREPARED FOR: California Department of Transportation (Caltrans) Caltrans District 2 Office of Pavement Rehabilitation
PREPARED BY:University of California
Pavement Research Center Davis and Berkeley
Stage 4 Distribution, July 1, 2009
ii UCPRC-TM-2006-13
DOCUMENT RETRIEVAL PAGE Technical Memorandum No.:
UCPRC-TM-2006-13
Title: Initial Recommendation of a Gravel factor for Pulverized Asphalt Concrete Used as an Unbound Base
Authors: Bruce Steven, Eung-Jin Jeon, and John Harvey
Prepared for: California Department of Transportation Division of Research and Innovation Office of Roadway Research
FHWA No.: Memorandum Date: December 2006,
revised May 2009
Work Submitted Date:April 19, 2007
Strategic Plan Element No.: 2.4.2
Status: Draft
Version No.:1
Abstract: A mechanistic-empirical analysis of a range of pavements designed using the standard Caltrans pavement design procedure (TI and subgrade R-value) was undertaken to calculate a new gravel factor for pulverized aggregate base when it is used as a substitute for Class 2 aggregate base in the construction of a rehabilitated pavement structure. The pulverized aggregate base is created by pulverizing the complete depth of existing hot-mix asphalt material plus at least 25 mm (0.08 ft) of the underlying material. Analysis of field and laboratory data from pavements that have been rehabilitated using pulverized aggregate base showed that the stiffness of the pulverized material was 140 percent stiffer than Caltrans Class 2 aggregate. This increase in stiffness suggests that a reduction in the thickness of the granular layers is possible in order to achieve an equivalent pavement life when pulverized aggregate base is used in place of Class 2 aggregate base. This potential reduction in thickness of the granular layer means that a gravel factor of up to 1.15 could be used for pulverized aggregate base without modification.
Proposals for Implementation: That a gravel factor of 1.15 be adopted for pulverized aggregate base material when it is used a substitute for Class 2 aggregate base.
Related Documents: • Li, H., Fu, P., Jeon, E.-J., and Harvey, J. 2009. Recommendation of Provisional Gravel Factors for Pulverized
Asphalt Concrete Modified with Lime or Portland Cement for Use as Base. Technical memorandum prepared for the California Department of Transportation by the University of California Pavement Research Center, Davis and Berkeley. (UCPRC-TM-2009-02)
• Steven, B., Lane, L., and Harvey, J. T. 2008. Life Cycle Cost Analysis for Pulverized Hot Mix Asphalt Used as an Unbound Base. Technical memorandum prepared for the California Department of Transportation by the University of California Pavement Research Center, Davis and Berkeley. (UCPRC-TM-2008-09)
• Jeon, E.-J., Harvey, J., and Steven, B. 2009. Comprehensive Performance Evaluation of In-Place Recycled Hot Mix Asphalt as Unbound Granular Material. Report prepared for the California Department of Transportation by the University of California Pavement Research Center, Davis and Berkeley. (UCPRC-RR-2008-15)
Signatures:
Bruce Steven First Author
Carl Monismith, Pengcheng Fu, John Harvey Technical Review
David Spinner Editor
John T. Harvey Principal Investigator
T. Joe Holland Caltrans Contract Manager
Stage 4 Distribution, July 1, 2009
UCPRC-TM-2006-13 iii
DISCLAIMER The contents of this report reflect the views of the authors who are responsible for the facts and accuracy of the data presented herein. The contents do not necessarily reflect the official views or policies of the State of California or the Federal Highway Administration. This report does not constitute a standard, specification, or regulation.
PROJECT OBJECTIVES The work presented in this technical memorandum was carried out as part of a forensic investigation project, Element 2.4.2 in the 2003–2004 Partnered Pavement Research Center (PPRC) Strategic Plan. The principal objectives of the project were to:
1. Perform a literature survey to determine the “state-of-the-practice” for this strategy outside of California.
2. Perform field testing and materials sampling on three to five pilot projects to be conducted in District 2.
3. Perform laboratory testing on the original and pulverized materials, and on other Caltrans granular materials with currently accepted gravel factors. Also perform testing on pulverized materials modified with lime and cement.
4. Perform field pavement condition surveys for several years after the completion of construction (dependent on continued funding) by the PPRC, and longer term monitoring by Caltrans.
5. Perform mechanistic-empirical analysis to estimate performance of the pavements with the pulverization strategy and compare with estimated performance of conventional pavements, and empirical data for performance of Caltrans overlay strategies (to the extent possible, dependent on the availability of data).
6. Recommend gravel factor(s) for the pulverization strategy based on the results of Objectives 1–3 and 5.
7. Develop estimates of life-cycle cost based on cost data from the pilot projects and the results of the other objectives of this project, and compare with life-cycle cost of current rehabilitation strategies.
In partial completion of Objective 6, this technical memorandum presents the mechanistic-empirical performance analysis for unmodified pulverized aggregate base when it is used as an unbound aggregate base in a new or rehabilitated pavement structure, and the resulting recommendations for a provisional gravel factor. A separate technical memorandum presents the initial analysis and recommendation for a provisional gravel factor for pulverized aggregate base modified with 3.0 percent lime or 1.0 percent portland cement, completing Objective 6. The results from completion of Objectives 1 through 5 are presented in a separate research report. A separate technical memorandum presents the results of Objective 7.
Stage 4 Distribution, July 1, 2009
iv UCPRC-TM-2006-13
CONVERSION FACTORS
SI* (MODERN METRIC) CONVERSION FACTORS Symbol Convert From Convert To Symbol Conversion
LENGTH
mm millimeters inches in mm x 0.039
m meters feet ft m x 3.28
km kilometers mile mile km x 1.609
AREA
mm2 square millimeters square inches in2 mm2 x 0.0016
m2 square meters square feet ft2 m2 x 10.764
VOLUME
m3 cubic meters cubic feet ft3 m3 x 35.314
MASS
kg kilograms pounds lb kg x 2.202
TEMPERATURE (exact degrees)
C Celsius Fahrenheit F °C x 1.8 + 32
FORCE and PRESSURE or STRESS
N newtons poundforce lbf N x 0.225
kPa kilopascals poundforce/square inch lbf/in2 kPa x 0.145
*SI is the symbol for the International System of Units. Appropriate rounding should be made to comply with Section 4 of ASTM E380. (Revised March 2003)
Stage 4 Distribution, July 1, 2009
UCPRC-TM-2006-13 v
TABLE OF CONTENTS List of Tables ............................................................................................................................................... v List of Figures.............................................................................................................................................. v Abbreviations and Terms Used in the Text ............................................................................................. vi 1. Introduction .......................................................................................................................................... 1 2. Method of Analysis ............................................................................................................................... 3
2.1 Candidate Caltrans Pavement Designs.................................................................................................... 3 2.2 Determination of Inputs for Mechanistic Analysis ................................................................................. 4
3. Analysis of Pavement Designs ............................................................................................................. 9 4. Parametric Studies ............................................................................................................................. 13 5. Conclusions: Determination of Draft Gravel Factor for Pulverized Asphalt Base Material ...... 17 References.................................................................................................................................................. 19
LIST OF TABLES Table 1. Pavement Designs Used in Analysis............................................................................................... 4 Table 2. Stiffness Values for the HMA......................................................................................................... 6 Table 3. Backcalculation Results for the FWD Data .................................................................................... 6 Table 4. Summary of Stiffness Values for the Pavement Materials ............................................................. 8 Table 5. Summary of Ratios of Granular Layer Thickness for the AB and PAB Pavements .................. 11 Table 6. Stiffness Values for AB/PAB Parametric Study........................................................................... 13
LIST OF FIGURES Figure 1. Pavement designs used for Gf determination................................................................................. 5 Figure 2. Histogram of AB stiffness values from Alturas FWD measurements......................................... 7 Figure 3. Repeated load triaxial test results for AB and PAB materials. ...................................................... 7 Figure 4. Histogram of PAB stiffness values from (a) Alturas, (b) Beckwourth, and (c) Poison
Lake FWD measurements. ................................................................................................................... 8 Figure 5. Determination of the equivalent thickness for the same life for the PAB material. .................... 10 Figure 6. Results of parametric study on granular layer stiffness............................................................... 14 Figure 7. Results of parametric study on subgrade stiffness....................................................................... 14 Figure 8. Results of parametric study on HMA stiffness............................................................................ 15
Stage 4 Distribution, July 1, 2009
vi UCPRC-TM-2006-13
ABBREVIATIONS AND TERMS USED IN THE TEXT Aggregate Base (AB)
Asphalt Institute (AI)
California R-value (R-value)
Equivalent Standard Axle Load (ESAL)
Falling Weight Deflectometer (FWD)
Gravel equivalence (GE)
Gravel factor (Gf)
Hot Mix Asphalt (HMA)
Lane Distribution Factor (LDF)
Layer thickness of a particular material (t)
Maximum Dry Density (MDD)
Mean Monthly Air Temperatures (MMAT)
Optimum Moisture Content (OMC)
Post Mile (PM)
Pulverized Aggregate Base (PAB)
Resilient Modulus (Mr)
Traffic Index (TI)
University of California Pavement Research Center (UCPRC)
Stage 4 Distribution, July 1, 2009
UCPRC-TM-2006-13 1
1. INTRODUCTION The work presented in this technical memorandum was carried out as part of a forensic investigation project, Item 2.4.2 in the 2003–2004 Partnered Pavement Research Center (PPRC) Strategic Plan. The principal objective of the project is to evaluate a rehabilitation strategy that consists of in-place recycling of existing failed hot-mix asphalt and a portion of the aggregate base, placement and compaction of these materials on the road as a new granular layer, then placement of a hot-mix asphalt surface course. The construction is performed using full-depth recycling techniques and equipment. The in-place recycled base is referred to as pulverized aggregate base (PAB) in this document.
The objective of this technical memorandum is to recommend a provisional gravel factor for PAB when it is used as an unbound aggregate base in a new or rehabilitated pavement structure. Provisional gravel factors are needed by the California Department of Transportation (Caltrans) to design pavement structures for rehabilitation and new pavement projects. These provisional gravel factors should eventually be updated based on long-term field performance data.
The current Caltrans design method for flexible pavements is based on a relationship between the gravel equivalent (GE) of the pavement structural materials, the Traffic Index (TI), and the California R-value of the underlying material. This type of design process is considered to be an empirical approach. While the quality and strength or stiffness of materials may be assessed by accepted or sound engineering principles or tests, the relationship between the measured materials properties and the response or performance of the pavement structure may not be theoretically sound. The relationship between the input values (GE, TI, and R-value) was developed by Caltrans through research and field experimentation over a number of years.
The GE represents the thickness of pavement consisting of gravel subbase determined according to the following expression:
( )0.975 100GE TI R= × − (1)
where R is the R-value of the material beneath the pavement structure (subgrade).
Since different thicknesses of other materials could have the ability to provide the same pavement performance as the GE with different thicknesses, the concept of gravel equivalency using the gravel factor (Gf) was introduced. Thus the thickness (t) of a material with a specific value of Gf producing the same performance as the gravel (AS) is determined from the following:
f
GEt = G
(2)
In this expression, the value of Gf for gravel subbase is 1.0 (1). Over the years Caltrans has developed gravel factors for various pavement materials based on cohesiometer measurements (a test method developed in the 1950s), test roads, and observed performance of in-service pavements. These values are summarized in Table 663.1B of the 2006 version of the Caltrans Highway Design Manual (HDM) (1).
The approach used to develop a Gf for PAB in a similar fashion to many of those in the HDM was not considered feasible or desirable because of the availability of new testing and analysis methods, and the cost and time required to build experimental test tracks and pavement sections. Accordingly, an approach using a mechanistic-empirical framework described in the following sections was utilized to identify provisional gravel factors for PAB.
Stage 4 Distribution, July 1, 2009
2 UCPRC-TM-2006-13
Stage 4 Distribution, July 1, 2009
UCPRC-TM-2006-13 3
2. METHOD OF ANALYSIS The general approach used in this Technical Memorandum is to undertake a mechanistic analysis of a series of typical Caltrans pavement designs covering a range of Traffic Indexes (TI) and subgrade R-values. An outline of the procedure that was used in this Technical Memorandum is given below:
1. A three-layer (HMA, unbound aggregate base, and subgrade) pavement structure is designed using the Caltrans design method for a given TI and R-value.
2. The stiffness of the three layers is determined as follows: HMA, estimated from typical HMA mixes used in Caltrans District 2; AB and PAB, representative values from FWD backcalculation of field sites and laboratory resilient modulus tests; and subgrade, determined from the Asphalt Institute (AI) equation for relating R-value and resilient modulus.
3. The pavement structure from Step 1 is analyzed using the material properties from Step 2 and two pavement lives are determined using the AI performance criteria for HMA fatigue and permanent deformation based on a subgrade strain criteria. The pavement structure is analyzed again, this time setting the stiffness of the aggregate base layer to the value determined for the PAB material instead of the AB material. The thickness of the PAB layer is altered so that the pavement lives are equal to those determined in Step 3.
4. The Gf is calculated for the PAB material based on the ratio of the thicknesses of the AB and PAB layers and the Gf for AB using Equation (1).
5. Steps 1 to 4 are repeated for each pavement design.
It is realized that the Asphalt Institute performance criteria may result in predicted lives that bear no resemblance to the pavement lives calculated from the TI. In addition, the AI performance equations may give different lives for the HMA fatigue and the subgrade strain criteria. However, the purpose of this analysis is to calculate the relative difference between the AB and PAB materials so the values of the predicted lives are not critical.
2.1 Candidate Caltrans Pavement Designs
For this study it was decided that a number of different pavement designs would be analyzed in order to determine a typical Gf value. The pavement designs were based on a factorial matrix of three TI and three subgrade R values. This combination of input variables results in nine different pavement designs. The values of TI chosen for the pavement matrix were based on values that have been used for four of the Caltrans projects that have used the pulverization strategy to date. The subgrade R-values were chosen to represent the range of R-values that can be expected in California.
Objective 4 of the PPRC Strategic Plan Element (SPE) 2.4.2 includes the long-term monitoring of selected pavements that have been reconstructed using the pulverization strategy. Four such projects are currently being monitored (locality names in parenthesis); MOD395 PM11.0/20.8 (Alturas), PLU70 PM85.9/91.2 (Beckwourth), LAS44 PM0.0/14.7 (Poison Lake), and SHA89 PM29.4/43.3 (Cayton Creek). The TI and subgrade R-values for these projects were reviewed and found to range from 8.5 to 9 and from 18 to 40 respectively. The range of TI values used in these projects is small; these values translate to ten-year Equivalent Standard Axle Loads (ESALs) ranging from 619,000 to 1,000,000. The conversion from TI to ESALs was done using the equation given in Chapter 613.3 of the Caltrans Highway Design Manual (HDM) (1):
0.119
69.010
LDF ESALsTI ×⎛ ⎞= ⎜ ⎟⎝ ⎠
(3)
In this equation, LDF is the Lane Distribution Factor (1.0 for a single lane in each direction). The low design TI is in keeping with the locations of the projects; low areas of population in the northeastern part of California.
Stage 4 Distribution, July 1, 2009
4 UCPRC-TM-2006-13
Harvey et al (2) undertook a similar study to calculate a gravel factor for asphalt-treated permeable base material and they used TI values ranging from 10 to 14 (2.4 to 41 million ESALs). Therefore for this study it was decided to use three values of TI: 8, 10, and 13 (0.37, 2.4, and 22 million ESALs). The subgrade R-values that were used as inputs to the pavement matrix were 5, 20, and 40.
The Caltrans HDM offers no specific guidance on the ideal mix of layer thicknesses so two different pavement designs were selected following the HDM Empirical method (Chapter 633.1) for each combination of TI and subgrade R-value. This increased the number of different pavement designs to 18. For each combination of TI and subgrade R-value, a design was selected so that the thickness of the HMA layer was close to the minimum allowable value. The second pavement design for each TI and subgrade R-value pair was based on the thickness of the HMA layer being 120 percent of the first design. The resulting pavement designs are listed in Table 1 and shown in Figure 1.
2.2 Determination of Inputs for Mechanistic Analysis
In order to undertake a mechanistic analysis on the candidate pavement structures, material properties were assigned to each pavement layer. The values were based on the best available information from various sources: literature surveys, laboratory testing, and field testing.
The stiffness of the HMA layer was extracted from historical UCPRC mix test results of flexural frequency sweep master curve plots and Mean Monthly Air Temperatures (MMAT) for two climate regions in Caltrans District 2 (High Mountain and Inland Valley). The frequency for the master curve equation was chosen assuming a time of loading corresponding to approximately 90 km/h (56 mph). The selection of two values of stiffness for the HMA meant that the analysis of the 18 pavement structures was repeated twice, once for each value of HMA stiffness.
Table 1. Pavement Designs Used in Analysis
Thickness of Pavement Layers (mm) Design One1 Design Two2 Traffic
Index ESALs from TI
Subgrade R-value
HMA AB HMA AB
5 150 405 180 345
20 135 330 165 270 8 371,661
40 120 210 150 165
5 210 480 255 360
20 180 420 210 345 10 2,423,913
40 150 285 180 240
5 270 645 330 510
20 240 540 285 435 13 21,979,811
40 195 390 240 315
Notes 1GE of HMA layer = 40% of required pavement GE 2Thickness of HMA layer = 120% of Design One
Stage 4 Distribution, July 1, 2009
UCPRC-TM-2006-13 5
270 mm
645 mm
330 mm
510 mm
210 mm
480 mm
255 mm
360 mm
150 mm
405 mm
180 mm
345 mm8
10
13
180 mm
420 mm
210 mm
345 mm
240 mm
540 mm
285 mm
435 mm
135 mm
330 mm
165 mm
270 mm
150 mm
285 mm
180 mm
240 mm
195 mm
390 mm
240 mm
315 mm
120 mm
210 mm
150 mm
165 mm
Traffic Index
Subgrade R-value 5 20 40Min 120% MinHMA thickness Min 120% Min Min 120% Min
Hot Mix Asphalt Aggregate Base Subgrade
Figure 1. Pavement designs used for Gf determination.
Stage 4 Distribution, July 1, 2009
6 UCPRC-TM-2006-13
Table 2. Stiffness Values for the HMA
Climate Region
Locality for Determining MMAT
MMAT (°C)
PG Binder Grade Stiffness (MPa)
High Mountain Alturas 8 PG 64-28 7157
Inland Valley Redding 17 PG 64-10 5500
The stiffness of the AB material was determined from the analysis of Falling Weight Deflectometer (FWD) measurements from a control section in the Alturas project and the results of repeated load triaxial testing in the UCPRC laboratory. The FWD measurements were done in 2005 and 2006 on a section (PM10.0/11.0) of the project that was constructed as a conventional pavement. The backcalculation analysis was done using the CalBack computer program, which is currently being developed for Caltrans by the UCPRC. The results of the backcalculation analysis are shown in Table 3 and Figure 2. The resilient modulus of the AB was determined using the repeated load triaxial test for two different AB materials: Alturas and a material from Caltrans District 4. Each test specimen was compacted to 95 percent of Maximum Dry Density (MDD) at the Optimum Moisture Content (OMC) and tested in accordance with the SHRP P46 protocol (3). The results of the testing are shown in Figure 3.
The stiffness of the PAB material was determined in the same way as the AB material: by FWD analysis and repeated load triaxial testing. In addition to FWD data from Alturas, data from Beckwourth and Poison Lake were also used for the FWD and repeated load triaxial analysis. The results are shown in Table 3 and Figure 4.
An analysis of the values of stiffness of the AB and PAB from the FWD and laboratory testing showed a consistent difference between the two types of material. The stiffness of the PAB material was on average 144% of the stiffness of the AB material. Based on the comparison of the mean and relative stiffness of the AB and PAB material, a stiffness of 250 MPa was selected for the AB material and 360 MPa for the PAB material.
The range of stiffness values of the subgrade material was based on the backcalculation results from tests performed by the UCPRC on various materials from around the state. This resulted in subgrade stiffness values of 25, 85, and 160 MPa for R-values of 5, 20, and 40 respectively.
The stiffness values for each material for the analysis factorial are given in Table 4. The Poisson ratio for all of the materials was set at 0.35 and the loading on the pavement was half of a standard axle load (80 kN/18 kip) which was represented by two circles loaded to 20 kN each and a uniform contact pressure of 700 kPa (4.5 kip/100 psi).
Table 3. Backcalculation Results for the FWD Data
Alturas Beckwourth Poison Lake
EAB (MPa) EPAB (MPa) EPAB (MPa) EPAB (MPa)
Mean 283 379 316 513
Std. Deviation 124 126 187 165
Minimum 114 139 73 126
Maximum 687 975 918 923
25 191 285 180 404
50 245 362 243 484 Percentiles
75 350 443 412 629
Stage 4 Distribution, July 1, 2009
UCPRC-TM-2006-13 7
0
5
10
15
50 200 350 500 650 800 950
Mr (MPa)
Freq
uenc
y
Figure 2. Histogram of AB stiffness values from
Alturas FWD measurements.
100
1000
10 100 1000Bulk Stress (kPa)
Res
ient
Mod
ulus
(MPa
)
District 2 ABDistrict 4 ABAlturas PABBeckwourth PABPoison Lake PAB
All materials compacted to 95% of respective MDD, at OMC.
Figure 3. Repeated load triaxial test results for AB and PAB materials.
Stage 4 Distribution, July 1, 2009
8 UCPRC-TM-2006-13
0
5
10
15
20
25
30
35
50 200 350 500 650 800 950
Mr (MPa)
Freq
uenc
y
(a)
0
5
10
50 200 350 500 650 800 950
Mr (MPa)
Freq
uenc
y
(b)
0
5
10
15
50 200 350 500 650 800 950
Mr (MPa)
Freq
uenc
y
(c)
Figure 4. Histogram of PAB stiffness values from (a) Alturas, (b) Beckwourth, and (c) Poison Lake FWD measurements.
Table 4. Summary of Stiffness Values for the Pavement Materials
Material
HMA AB PAB Subgrade
7157 250 360 25
5500 85
Stiffness values (MPa)
160
Stage 4 Distribution, July 1, 2009
UCPRC-TM-2006-13 9
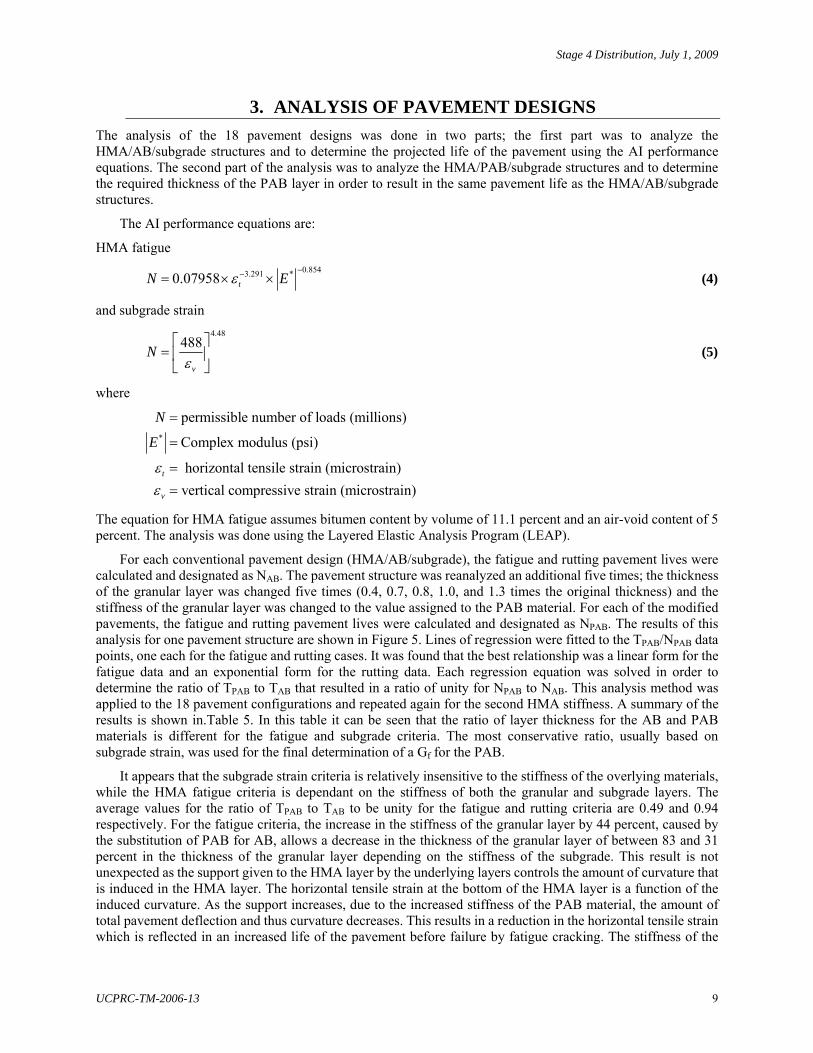
3. ANALYSIS OF PAVEMENT DESIGNS The analysis of the 18 pavement designs was done in two parts; the first part was to analyze the HMA/AB/subgrade structures and to determine the projected life of the pavement using the AI performance equations. The second part of the analysis was to analyze the HMA/PAB/subgrade structures and to determine the required thickness of the PAB layer in order to result in the same pavement life as the HMA/AB/subgrade structures.
The equation for HMA fatigue assumes bitumen content by volume of 11.1 percent and an air-void content of 5 percent. The analysis was done using the Layered Elastic Analysis Program (LEAP).
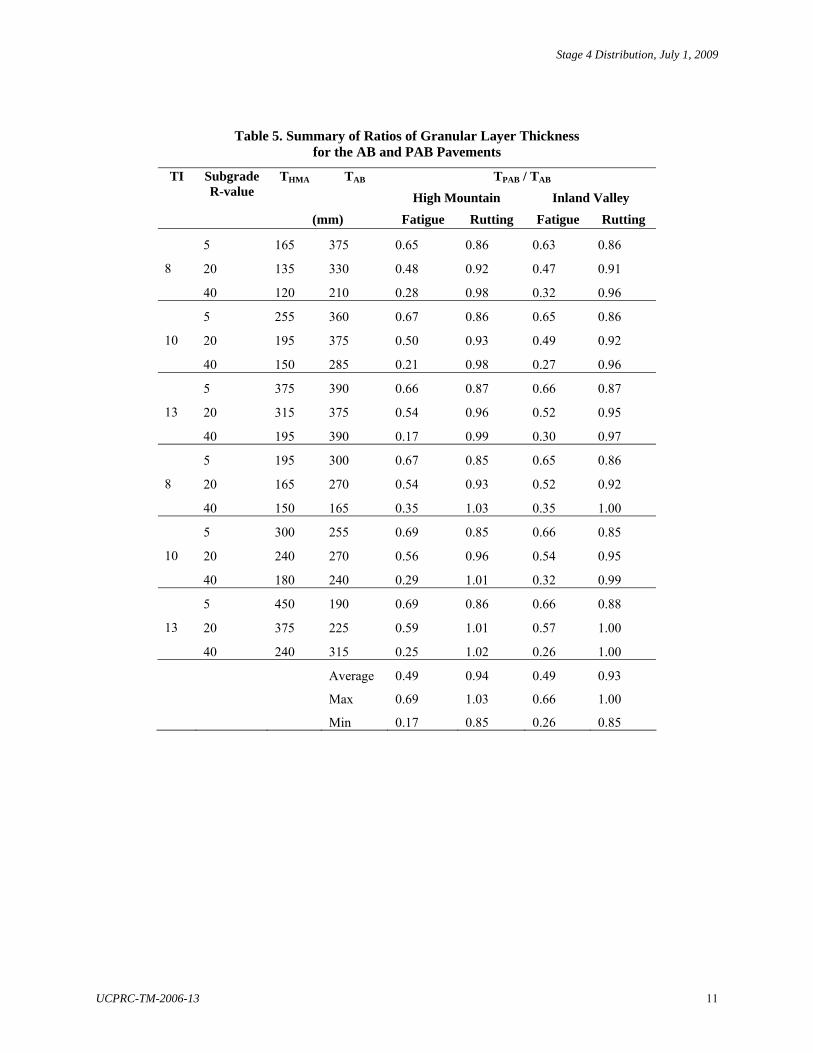
For each conventional pavement design (HMA/AB/subgrade), the fatigue and rutting pavement lives were calculated and designated as NAB. The pavement structure was reanalyzed an additional five times; the thickness of the granular layer was changed five times (0.4, 0.7, 0.8, 1.0, and 1.3 times the original thickness) and the stiffness of the granular layer was changed to the value assigned to the PAB material. For each of the modified pavements, the fatigue and rutting pavement lives were calculated and designated as NPAB. The results of this analysis for one pavement structure are shown in Figure 5. Lines of regression were fitted to the TPAB/NPAB data points, one each for the fatigue and rutting cases. It was found that the best relationship was a linear form for the fatigue data and an exponential form for the rutting data. Each regression equation was solved in order to determine the ratio of TPAB to TAB that resulted in a ratio of unity for NPAB to NAB. This analysis method was applied to the 18 pavement configurations and repeated again for the second HMA stiffness. A summary of the results is shown in.Table 5. In this table it can be seen that the ratio of layer thickness for the AB and PAB materials is different for the fatigue and subgrade criteria. The most conservative ratio, usually based on subgrade strain, was used for the final determination of a Gf for the PAB.
It appears that the subgrade strain criteria is relatively insensitive to the stiffness of the overlying materials, while the HMA fatigue criteria is dependant on the stiffness of both the granular and subgrade layers. The average values for the ratio of TPAB to TAB to be unity for the fatigue and rutting criteria are 0.49 and 0.94 respectively. For the fatigue criteria, the increase in the stiffness of the granular layer by 44 percent, caused by the substitution of PAB for AB, allows a decrease in the thickness of the granular layer of between 83 and 31 percent in the thickness of the granular layer depending on the stiffness of the subgrade. This result is not unexpected as the support given to the HMA layer by the underlying layers controls the amount of curvature that is induced in the HMA layer. The horizontal tensile strain at the bottom of the HMA layer is a function of the induced curvature. As the support increases, due to the increased stiffness of the PAB material, the amount of total pavement deflection and thus curvature decreases. This results in a reduction in the horizontal tensile strain which is reflected in an increased life of the pavement before failure by fatigue cracking. The stiffness of the
Stage 4 Distribution, July 1, 2009
10 UCPRC-TM-2006-13
subgrade (related to the subgrade R-value) also has an effect on the total pavement deflection, thus the reduction in required thickness of the PAB layer as the subgrade stiffness increases.
The relatively small ranges of thickness ratios for the subgrade strain criteria can be explained by a limitation in the underlying elastic theory that is used to analyze pavements. The modular ratio of the HMA and AB layers (7157/250 ≈ 29) is quite high and changing the stiffness of the AB/PAB layer from 250 to 360 MPa only reduces the modular ratio to approximately 20. This change in modular ratio results in a very small change in the stress distribution in the granular layer and subgrade. Since the stiffness is a constant value and the stress only changes by a small amount, the strain, which is a function of the stiffness and stress, will only change by a small amount as well, resulting in a small change in the required thickness of the PAB material.
y = 0.0417e3.6779x
R2 = 0.9998
y = 1.451x + 0.0635R2 = 0.9986
0
1
2
3
4
5
6
0.2 0.4 0.6 0.8 1.0 1.2 1.4TPAB / TAB
NPA
B /
NA
B
Fatigue Rutting
TI = 8, subgrade R-value = 5
Figure 5. Determination of the equivalent thickness for the same life for the PAB material.
Stage 4 Distribution, July 1, 2009
UCPRC-TM-2006-13 11
Table 5. Summary of Ratios of Granular Layer Thickness for the AB and PAB Pavements
TPAB / TAB THMA TAB High Mountain Inland Valley
TI Subgrade R-value
(mm) Fatigue Rutting Fatigue Rutting
5 165 375 0.65 0.86 0.63 0.86
20 135 330 0.48 0.92 0.47 0.91 8
40 120 210 0.28 0.98 0.32 0.96
5 255 360 0.67 0.86 0.65 0.86
20 195 375 0.50 0.93 0.49 0.92 10
40 150 285 0.21 0.98 0.27 0.96
5 375 390 0.66 0.87 0.66 0.87
20 315 375 0.54 0.96 0.52 0.95 13
40 195 390 0.17 0.99 0.30 0.97
5 195 300 0.67 0.85 0.65 0.86
20 165 270 0.54 0.93 0.52 0.92 8
40 150 165 0.35 1.03 0.35 1.00
5 300 255 0.69 0.85 0.66 0.85
20 240 270 0.56 0.96 0.54 0.95 10
40 180 240 0.29 1.01 0.32 0.99
5 450 190 0.69 0.86 0.66 0.88
20 375 225 0.59 1.01 0.57 1.00 13
40 240 315 0.25 1.02 0.26 1.00
Average 0.49 0.94 0.49 0.93
Max 0.69 1.03 0.66 1.00
Min 0.17 0.85 0.26 0.85
Stage 4 Distribution, July 1, 2009
12 UCPRC-TM-2006-13
Stage 4 Distribution, July 1, 2009
UCPRC-TM-2006-13 13
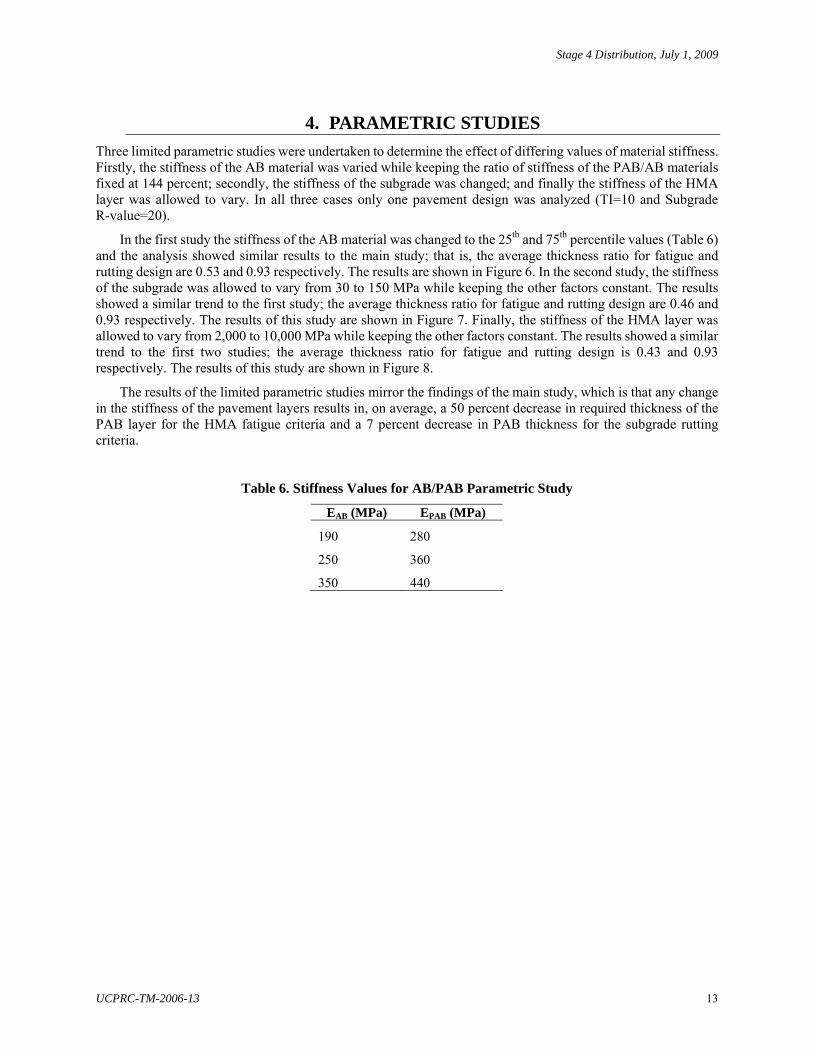
4. PARAMETRIC STUDIES Three limited parametric studies were undertaken to determine the effect of differing values of material stiffness. Firstly, the stiffness of the AB material was varied while keeping the ratio of stiffness of the PAB/AB materials fixed at 144 percent; secondly, the stiffness of the subgrade was changed; and finally the stiffness of the HMA layer was allowed to vary. In all three cases only one pavement design was analyzed (TI=10 and Subgrade R-value=20).
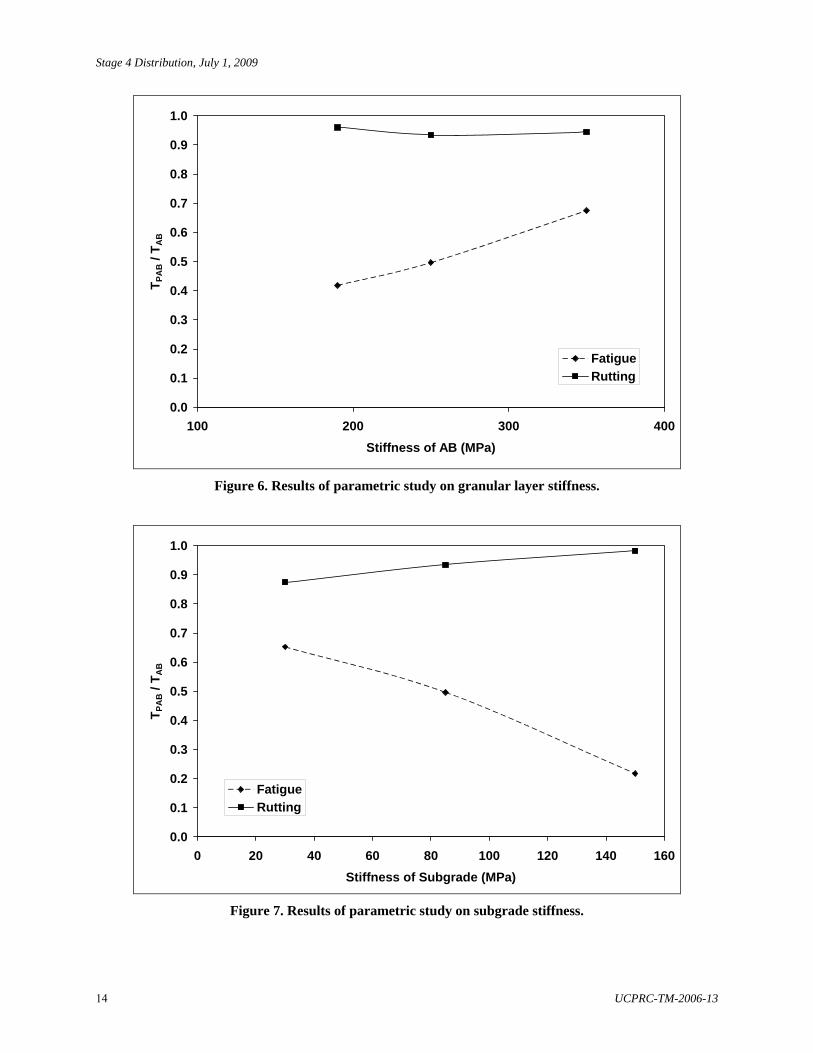
In the first study the stiffness of the AB material was changed to the 25th and 75th percentile values (Table 6) and the analysis showed similar results to the main study; that is, the average thickness ratio for fatigue and rutting design are 0.53 and 0.93 respectively. The results are shown in Figure 6. In the second study, the stiffness of the subgrade was allowed to vary from 30 to 150 MPa while keeping the other factors constant. The results showed a similar trend to the first study; the average thickness ratio for fatigue and rutting design are 0.46 and 0.93 respectively. The results of this study are shown in Figure 7. Finally, the stiffness of the HMA layer was allowed to vary from 2,000 to 10,000 MPa while keeping the other factors constant. The results showed a similar trend to the first two studies; the average thickness ratio for fatigue and rutting design is 0.43 and 0.93 respectively. The results of this study are shown in Figure 8.
The results of the limited parametric studies mirror the findings of the main study, which is that any change in the stiffness of the pavement layers results in, on average, a 50 percent decrease in required thickness of the PAB layer for the HMA fatigue criteria and a 7 percent decrease in PAB thickness for the subgrade rutting criteria.
Table 6. Stiffness Values for AB/PAB Parametric Study
EAB (MPa) EPAB (MPa)
190 280
250 360
350 440
Stage 4 Distribution, July 1, 2009
14 UCPRC-TM-2006-13
0.0
0.1
0.2
0.3
0.4
0.5
0.6
0.7
0.8
0.9
1.0
100 200 300 400Stiffness of AB (MPa)
T PA
B /
T AB
FatigueRutting
Figure 6. Results of parametric study on granular layer stiffness.
Figure 7. Results of parametric study on subgrade stiffness.
Stage 4 Distribution, July 1, 2009
UCPRC-TM-2006-13 15
0.0
0.1
0.2
0.3
0.4
0.5
0.6
0.7
0.8
0.9
1.0
0 2000 4000 6000 8000 10000 12000Stiffness of HMA (MPa)
T PA
B /
T AB
FatigueRutting
Figure 8. Results of parametric study on HMA stiffness.
Stage 4 Distribution, July 1, 2009
16 UCPRC-TM-2006-13
Stage 4 Distribution, July 1, 2009
UCPRC-TM-2006-13 17
5. CONCLUSIONS: DETERMINATION OF DRAFT GRAVEL FACTOR FOR PULVERIZED ASPHALT BASE MATERIAL
A gravel factor (Gf) for PAB material can be calculated by using the ratios of required layer thickness of the PAB and AB materials and Equation (2). Since the required gravel equivalent for the AB and PAB materials is the same and the relative thickness of the two materials has been calculated in order to provide the same mechanistic pavement life, the Gf for the PAB material can be calculated as follows:
AB
PAB
AB AB f
PAB PAB f
GE t G
GE t G
= ×
= ×
since
AB PABGE GE=
therefore
AB PAB
PAB AB
AB f PAB f
ABf f
PAB
t G t G
tG Gt
× = ×
= ×
The results of the analysis show that subgrade rutting is the controlling criterion as it allows the smallest reduction in required layer thickness. The average reduction in thickness of the PAB layer over the AB material is 6 percent. Since the Gf for a Caltrans Class 2 aggregate is 1.1, the calculated gravel factor for the PAB material is:
PABfG = 94.01
1.1×
= 17.1
PABfG = 15.1
This allows the additional qualities of the PAB material to be recognized in the pavement design through a reduction in the amount of material that is required. The presence of the binder and the high-quality fines that were used in the production of the original HMA will improve the qualities of the unbound material, potentially resulting in better performance under wet or saturated conditions and improved resistance to permanent deformation than is captured in this analysis.
Stage 4 Distribution, July 1, 2009
18 UCPRC-TM-2006-13
Stage 4 Distribution, July 1, 2009
UCPRC-TM-2006-13 19
REFERENCES
1. Caltrans, Highway Design Manual. Fifth ed. 2006: California Department of Transportation.
2. Harvey, J.T., B.W. Tsai, F. Long, and D. Hung, CAL/APT PROGRAM — ASPHALT TREATED PERMEABLE BASE (ATPB). FHWA/CA/OR-99/09, 1999, Partners for Advanced Transit and Highways (PATH), California Department of Transportation, Federal Highway Administration. 178p.
3. SHRP, Resilient Modulus of Unbound Granular Base/Subbase Materials and Subgrade Soils. 1989: Strategic Highway Research Program.