1 RECOMMENDATIONS FOR THE DEVELOPMENT OF A WATER QUALITY RESPONSE MODEL AND AN APPROACH TO ASSESSING WATER QUALITY IN THE ESTUARINE WATERS OF SARASOTA COUNTY Technical Memorandum Prepared for: Sarasota County Water Resources 2817 Cattlemen Road Sarasota Fl 34232 Prepared By: Janicki Environmental, Inc. 1155 Eden Isle Drive NE St. Petersburg, Florida 33704 September, 2007
Transcript
1
RECOMMENDATIONS FOR THE DEVELOPMENT OF
A WATER QUALITY RESPONSE MODEL AND AN APPROACH TO ASSESSING
WATER QUALITY IN THE ESTUARINE WATERS OF SARASOTA COUNTY
Technical Memorandum
Prepared for:
Sarasota County Water Resources
2817 Cattlemen Road Sarasota Fl 34232
Prepared By:
Janicki Environmental, Inc. 1155 Eden Isle Drive NE
St. Petersburg, Florida 33704
September, 2007
1
EXECUTIVE SUMMARY
Sarasota County has initiated a watershed planning process to address water quantity and quality issues in the county. A major element in this process involves an assessment of water quality in the County’s estuarine waters. There are several key elements in the development of a comprehensive watershed management plan that are discussed in this technical memorandum, including:
• predictive water quality modeling, • water quality monitoring, and • water quality assessment and reporting.
Each of these elements is critical to the watershed planning process. In their absence there will be no ability to predict likely responses in the receiving waters to any management actions, no ability to assess the actual responses in these after the actions are taken, and no ability to provide feedback to the resource managers that would allow them to make more informed decisions in the future. The following recommendations are made for future efforts:
• refine and apply the current EFDC hydrodynamic model so that it can provide the necessary driving variables to allow predictive water quality modeling;
• develop an estuarine water quality response model using the EPA WASP model code; and
• review existing ambient water quality monitoring design and refine as needed; and • define a simple, effective means to assess and report the outputs from these efforts,
particularly the ambient water quality monitoring.
2
Background Sarasota County has initiated a watershed planning process to address water quantity and quality issues in the county. A major element in this process involves an assessment of water quality in the County’s estuarine waters. Recently, the Florida Department of Environmental Protection and U.S. Environmental Protection Agency (USEPA) have identified a number of water bodies within Sarasota County to be impaired with respect to nutrient and dissolved oxygen concentrations, including Northern Roberts Bay and a series of tributaries that drain into Sarasota Bay and Lemon Bay. The County embarked on a proactive approach to develop the proper science and community-based vision as a foundation for formulating, evaluating, prioritizing, and implementing watershed management actions to address the water quality issues in these water bodies. Towards this goal, the County’s Environmental Sensitive Lands Protection Program (ESLPP) has recently acquired lands that are strategically located in the watershed at Red Bug Slough. Additionally, the Celery Fields Regional Stormwater Project was constructed in the Phillippi Creek watershed. The Phillippi Creek Septic System Replacement Program Capital Improvement Project removes individual septic systems from areas throughout the Phillippi Creek basin. The County has initiated monitoring of water quality, stage and discharge, and environmental indicators in tributaries leading to Roberts Bay, and the tidal portions of Roberts Bay. Implementation of this plan will provide a model in watershed management and involve several state, regional, and federal partners. This will become a regional initiative that promotes and furthers the implementation of the Sarasota County Comprehensive Plan, the Sarasota Bay Estuary Program and Charlotte Harbor Estuary Program Comprehensive Conservation Management Plans, and the Southwest Florida Water Management District’s (DISTRICT) Southern Coastal Comprehensive Watershed Management (CWM) Plan. There are several key elements in the development of a comprehensive watershed management plan that are discussed in this technical memorandum, including:
• predictive water quality modeling, • water quality monitoring, and • water quality assessment and reporting.
Each of these elements is critical to the watershed planning process. In their absence there will be no ability to predict likely responses in the receiving waters to any management actions, no ability to assess the actual responses in these after the actions are taken, and no ability to provide feedback to the resource managers that would allow them to make more informed decisions in the future. Predictive Water Quality Modeling The watershed management planning process will include identification of potential actions that could contribute to achieving the water quality targets in the receiving water bodies. The final selection of the specific actions to be implemented will depend upon a number of criteria such as permittability and cost. A major criterion to be considered in the selection of appropriate management actions will be the expected effectiveness of the actions, particularly with respect to the water quality responses within the receiving water bodies.
3
This can only be accomplished by first, estimating the reduction in pollutant loading associated with a particular management action and secondly, estimating the water quality response to the estimated pollutant load reductions. Pollutant Load Modeling - Pollutant load modeling is currently underway, being conducted by Jones Edmunds & Associates for Sarasota County. The pollutant loading sources will include stormwater runoff, baseflow, point sources, on-site disposal systems, and atmospheric deposition. The estimates of hydrologic and pollutant loading will provide input to both a hydrodynamic model that will predict the movement of water to and from as well as within the receiving water body. The hydrodynamic model output will then be used to drive the estuarine water quality response model. That model will allow prediction of the changes in water quality that can be expected by the implementation of management actions within the watershed. Earlier pollutant loading studies included estimates provided by CDM (1992), ERD (2004), and JEA (2005). The CDM and ERD models provided loading estimates to Sarasota Bay and Lemon Bay, respectively, and included the following sources:
• WWTP (point sources), • atmospheric deposition, • groundwater baseflow, • groundwater seepage directly to bay, • septic system, and • surface water runoff.
Hydrodynamic Modeling - Hydrodynamic modeling of Sarasota Bay has been accomplished in the past by several investigators. Dr. Peter Sheng of the University of Florida developed a hydrodynamic model of Sarasota Bay for the Sarasota Bay National Estuary Program. The results from this model were reported in the SBNEP CCMP document. Dr. Steve Peene also developed a hydrodynamic model of Sarasota Bay in partial fulfillment of his doctoral program requirements at the University of Florida. The code for neither model is currently available (S. Peene, pers. comm.). More recently, a hydrodynamic model was developed by Applied Technology & Management, Inc. for Sarasota County to allow examination of the potential effects of the re-opening of Midnight Pass on currents, residence time, salinity, and water quality. This model provides a significant starting point for the development of a hydrodynamic model that can be used to drive the estuarine water quality response model. Figure 1 presents an overview of this hydrodynamic model. The model is formulated in the Environmental Fluid Dynamics Code (EFDC) model developed for the USEPA. This model is part of the model toolbox supported by USEPA for development of Total Maximum Daily Loads (TMDLs). Most recently, several refinements to the existing EFDC model are necessary to enable its use in assessing the effects of freshwater inflow on salinity in Dona and Roberts Bays (ATM and Janicki Environmental, 2007). These refinements included several changes in the spatial resolution of the model.
4
Several minor refinements of the EFDC model will be necessary to allow any water quality model to be run for the entire length of the County estuarine waters. First, the model domain needs to be expanded both at its northern and southern ends and at the various passes that allow water to move to and from between Sarasota Bay and the Gulf of Mexico. At the northern end, the model boundary should be constructed at the interface of Anna Maria Sound and Lower Tampa Bay. Palma Sola Bay will also be included in the model domain. The existing southern model boundary needs to be extended to encompass all of Lemon Bay.
Figure 1. Recently refined EFDC model grid. (ATM and Janicki Environmental, 2007).
5
Water Quality Modeling - There are two candidate models that could be utilized for the estuarine water quality response model:
• WASP - The Water Quality Analysis Simulation Program (WASP7) is a dynamic compartment-modeling program for aquatic systems, including both the water column and the underlying benthos. WASP allows the user to investigate one-, two- or three-dimensional systems, and a variety of pollutant types. The time varying processes of advection, dispersion, point and diffuse mass loading and boundary exchange are represented in the model. WASP can be linked with hydrodynamic and sediment transport models that can provide flows, depths velocities, temperature, salinity and sediment fluxes. WASP has been used to examine eutrophication of Tampa Bay, FL; phosphorus loading to Lake Okeechobee, FL; eutrophication of the Neuse River Estuary, NC; eutrophication Coosa River and Reservoirs, AL; and eutrophication of the Potomac Estuary.
• CE-QUAL-ICM – The CE-QUAL-ICM model was initially developed as one component of a model package employed to study eutrophication processes in Chesapeake Bay. CE-QUAL-ICM is a non-proprietary model. ICM stands for “integrated compartment model”, which is analogous to the finite volume numerical method. The model computes constituent concentrations resulting from transport and transformations in well-mixed cells that can be arranged in arbitrary one-, two- or three-dimensional configurations. The model does not compute hydrodynamics. Flows, diffusion coefficients, and volumes must be specified externally and read into the model. The model computes and reports concentrations, mass transport, kinetics transformations, and mass balances. The eutrophication model computes 22 state variables including physical properties; multiple forms of algae, carbon, nitrogen, phosphorus, and silica; and dissolved oxygen. ICM also incorporates a diagenetic sediment sub-model. The sub-model interactively predicts sediment-water oxygen and nutrient fluxes. Alternatively, these fluxes may be specified based on observations. The CE-QUAL-ICM model has been applied to a variety of water bodies, including Chesapeake Bay, Inland Bays of Delaware, New York Bight, Newark Bay, New York - New Jersey Harbors and estuaries, Lower Green Bay, Los Angeles - Long Beach Harbors, Cache River wetland, San Juan Bay and estuaries, Florida Bay, and Lower St. Johns River.
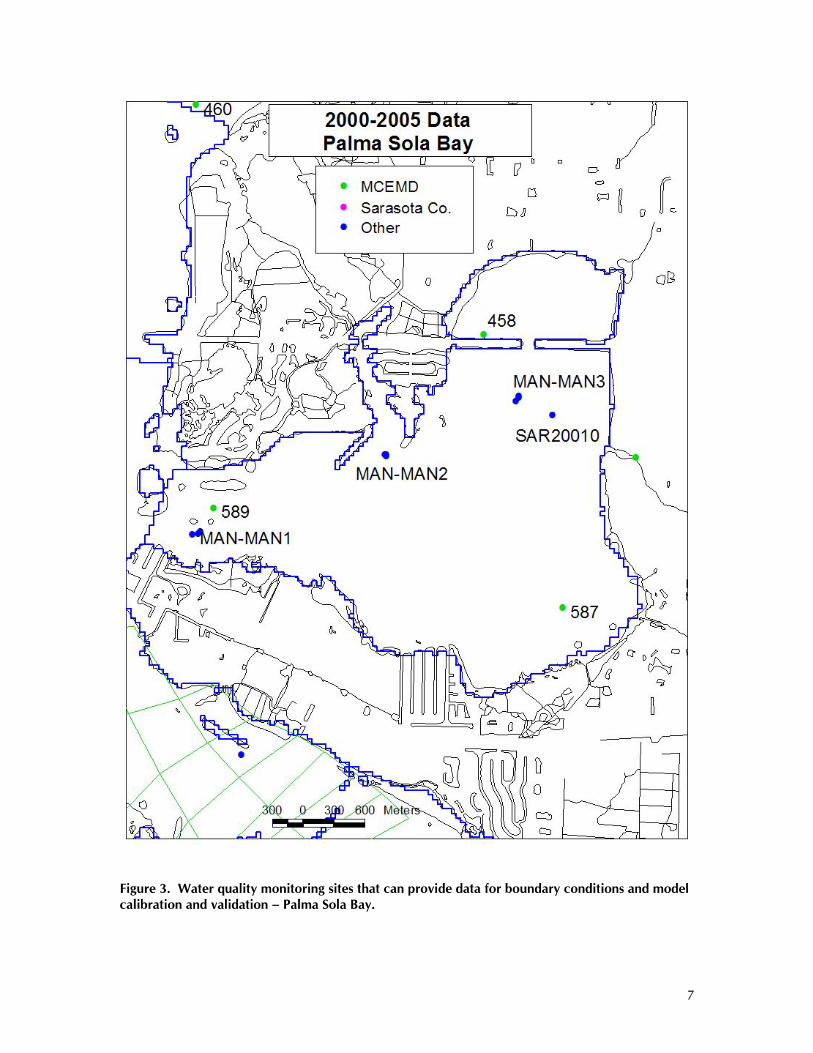
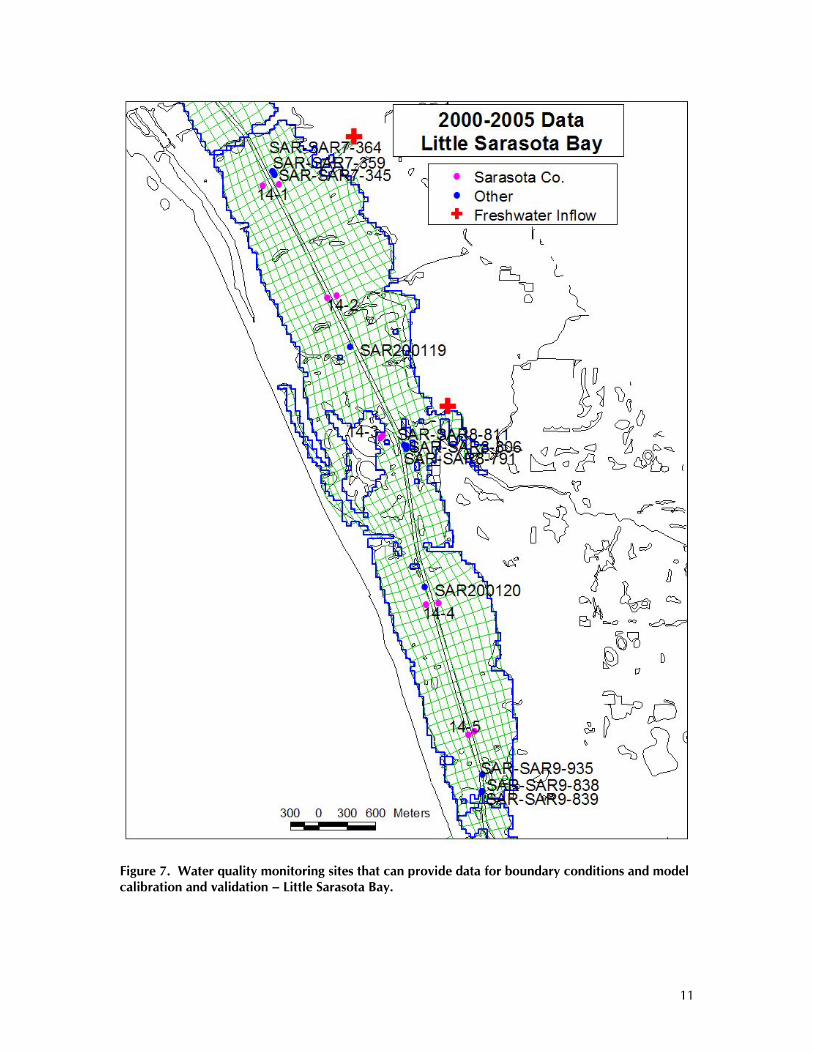
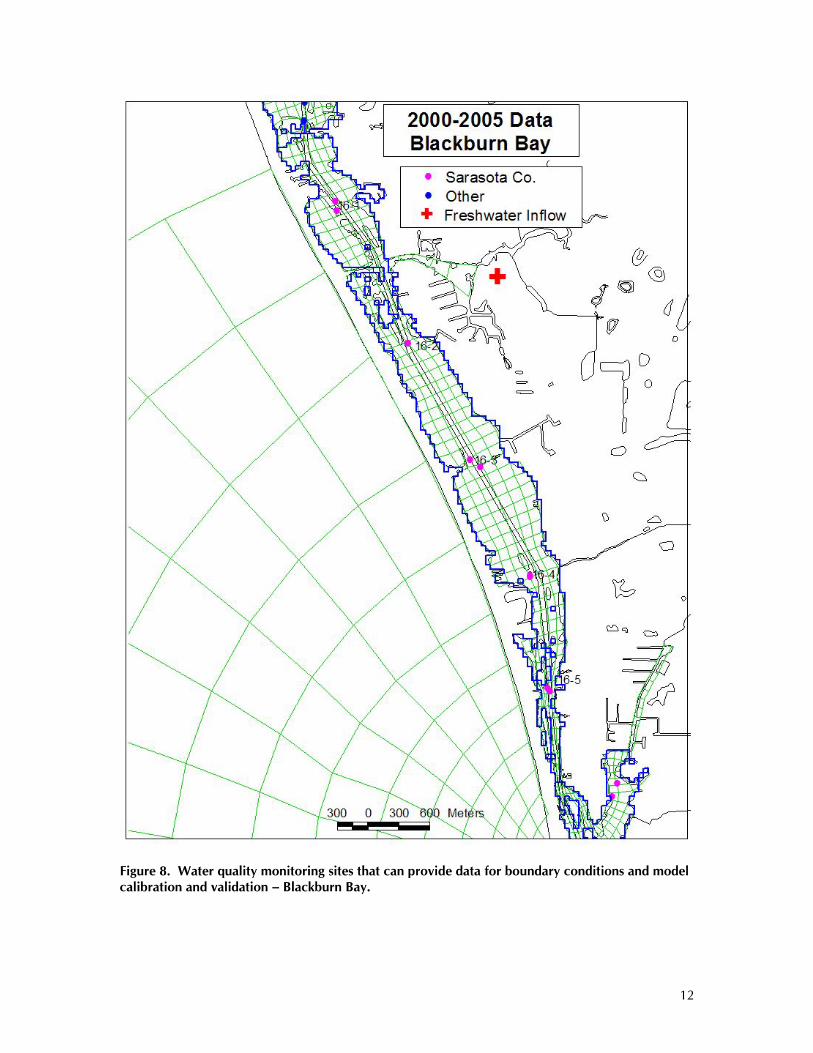
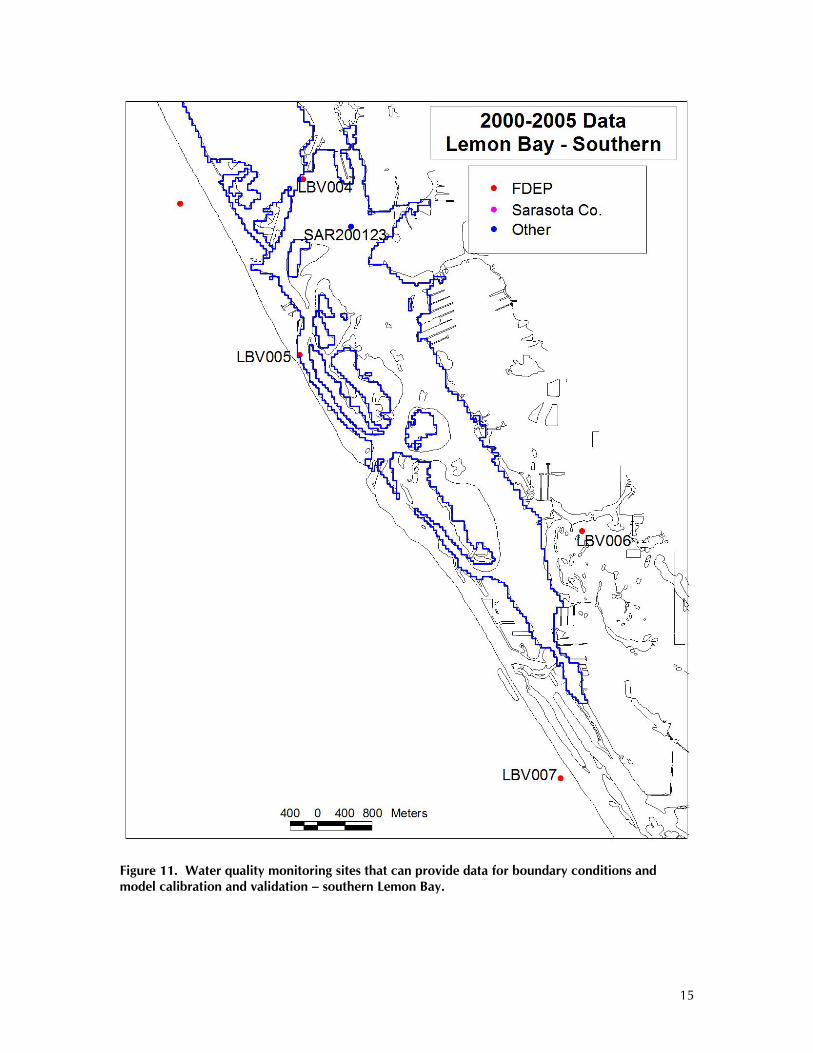
Both water quality models can use output from EFDC. As with the EFDC model, USEPA includes the WASP model as part of its TMDL model toolbox. Given this apparent preference, and given that both EFDC and WASP are non-proprietary codes, it is recommended that the estuarine water quality response model utilize these two models. The available water quality data collected in the estuarine waters of the County were investigated to determine if any additional data might be needed to support development of the estuarine water quality response model. Figures 2 - 11 present the location of water quality monitoring sites that can provide boundary conditions as well as data for model calibrations and validation. Table 1 presents a summary of the water quality monitoring sites shown in these figures.
6
Figure 2. Water quality monitoring sites that can provide data for boundary conditions and model calibration and validation - Anna Maria Sound.
7
Figure 3. Water quality monitoring sites that can provide data for boundary conditions and model calibration and validation – Palma Sola Bay.
8
Figure 4. Water quality monitoring sites that can provide data for boundary conditions and model calibration and validation – northern Sarasota Bay.
9
Figure 5. Water quality monitoring sites that can provide data for boundary conditions and model calibration and validation – southern Sarasota Bay.
10
Figure 6. Water quality monitoring sites that can provide data for boundary conditions and model calibration and validation – Northern Roberts Bay.
11
Figure 7. Water quality monitoring sites that can provide data for boundary conditions and model calibration and validation – Little Sarasota Bay.
12
Figure 8. Water quality monitoring sites that can provide data for boundary conditions and model calibration and validation – Blackburn Bay.
13
Figure 9. Water quality monitoring sites that can provide data for boundary conditions and model calibration and validation – Dona and Roberts Bay.
14
Figure 10. Water quality monitoring sites that can provide data for boundary conditions and model calibration and validation – northern Lemon Bay.
15
Figure 11. Water quality monitoring sites that can provide data for boundary conditions and model calibration and validation – southern Lemon Bay.
16
Table 1. Water quality monitoring sites identified as potential sources for model boundary conditions, calibration, and validation. Segment WBID Data Source Station ID Begin Date End Date Frequency
North of Anna Maria Manatee 435 08FEB2000 21DEC2005 Quarterly North of Anna Maria Manatee 455 07FEB2000 30NOV2005 Quarterly North of Anna Maria Manatee 456 08FEB2000 21DEC2005 Quarterly North of Anna Maria Manatee 459 08FEB2000 30NOV2005 Quarterly
Anna Maria Sound 1968A Florida SAR20010 05JUL2001 05JUL2001 One obs Anna Maria Sound 1968A Manatee 460 13MAR2000 30NOV2005 Quarterly Anna Maria Sound 1968A Manatee 464 07FEB2000 21DEC2005 Quarterly
Palma Sola Bay 1883 Florida MAN-MAN1 21MAY2001 21MAY2001 One obs Palma Sola Bay 1883 Florida MAN-MAN1 05DEC2000 05DEC2000 One obs Palma Sola Bay 1883 Florida MAN-MAN1 02MAR2001 02MAR2001 One obs Palma Sola Bay 1883 Florida MAN-MAN2 05DEC2000 05DEC2000 One obs Palma Sola Bay 1883 Florida MAN-MAN2 02MAR2001 02MAR2001 One obs Palma Sola Bay 1883 Florida MAN-MAN2 21MAY2001 21MAY2001 One obs Palma Sola Bay 1883 Florida MAN-MAN3 21MAY2001 21MAY2001 One obs Palma Sola Bay 1883 Florida MAN-MAN3 05DEC2000 05DEC2000 One obs Palma Sola Bay 1883 Florida MAN-MAN3 02MAR2001 02MAR2001 One obs Palma Sola Bay 1883 Florida SAR20010 06JUL2001 06JUL2001 One obs Palma Sola Bay 1883 Manatee 587 08FEB2000 30NOV2005 Quarterly Palma Sola Bay 1883 Manatee 589 08FEB2000 21DEC2005 Quarterly Palma Sola Bay 1883B Manatee 458 14MAR2000 30NOV2005 Quarterly
Sarasota Bay 1 1968B Florida STR20011 06JUL2001 06JUL2001 One obs Sarasota Bay 1 1968B Manatee 658 08FEB2000 30NOV2005 Quarterly Sarasota Bay 1 1968B SARASOTAES_WQ 10-1 11JAN2000 04JAN2006 Monthly Sarasota Bay 1 1968B SARASOTAES_WQ 10-2 11JAN2000 04JAN2006 Monthly Sarasota Bay 1 1968B SARASOTAES_WQ 10-3 11JAN2000 04JAN2006 Monthly Sarasota Bay 1 1968B SARASOTAES_WQ 11-1 11JAN2000 04JAN2006 Monthly Sarasota Bay 1 1968B SARASOTAES_WQ 11-2 11JAN2000 04JAN2006 Monthly Sarasota Bay 1 1968B SARASOTAES_WQ 11-3 11JAN2000 04JAN2006 Monthly Sarasota Bay 1 1968B SARASOTAES_WQ 7-1 15AUG2001 04JAN2006 Monthly Sarasota Bay 1 1968B SARASOTAES_WQ 7-2 15AUG2001 04JAN2006 Monthly
17
Table 1. Water quality monitoring sites identified as potential sources for model boundary conditions, calibration, and validation. Segment WBID Data Source Station ID Begin Date End Date Frequency
Sarasota Bay 1 1968B SARASOTAES_WQ 8-1 15AUG2001 04JAN2006 Monthly Sarasota Bay 1 1968B SARASOTAES_WQ 8-2 15AUG2001 04JAN2006 Monthly Sarasota Bay 1 1968B SARASOTAES_WQ US-1 10NOV2004 07DEC2004 Four obs Sarasota Bay 1 1968B SARASOTAES_WQ US-2 10NOV2004 07DEC2004 Four obs Sarasota Bay 1 1968B SARASOTAES_WQ US-3 10NOV2004 07DEC2004 Four obs Sarasota Bay 1 1968B SARASOTAES_WQ US-4 10NOV2004 07DEC2004 Four obs Sarasota Bay 1 1968B SARASOTAES_WQ US-5 10NOV2004 07DEC2004 Four obs Sarasota Bay 1 1968B STORET_21FLFMRI SAR200108 05JUL2001 05JUL2001 One obs Sarasota Bay 1 1968B STORET_21FLFMRI SAR200110 10JUL2001 10JUL2001 One obs Sarasota Bay 1 1968B STORET_21FLFMRI SAR200111 10JUL2001 10JUL2001 One obs Sarasota Bay 1 1968B STORET_21FLFMRI SAR200112 10JUL2001 10JUL2001 One obs Sarasota Bay 1 1968B STORET_21FLFMRI SAR200113 10JUL2001 10JUL2001 One obs Sarasota Bay 1 1968B STORET_21FLFMRI SAR200114 11JUL2001 11JUL2001 One obs Sarasota Bay 1 1968B STORET_21FLKWAT SAR-SAR2-083 21MAY2001 21MAY2001 One obs Sarasota Bay 1 1968B STORET_21FLKWAT SAR-SAR2-088 02MAR2001 02MAR2001 One obs Sarasota Bay 1 1968B STORET_21FLKWAT SAR-SAR3-958 21MAY2001 21MAY2001 One obs Sarasota Bay 1 1968B STORET_21FLKWAT SAR-SAR3-964 05DEC2000 02MAR2001 Two obs Sarasota Bay 1 1968B STORET_21FLMANA 597 14MAR2000 14JUN2005 Monthly Sarasota Bay 1 1968B STORET_21FLMANA 598 08FEB2000 14JUN2005 Monthly Sarasota Bay 1 1968B STORET_21FLMANA 600 08FEB2000 09MAY2005 Monthly Sarasota Bay 1 1968B STORET_21FLMANA 604 08FEB2000 09MAY2005 Monthly Sarasota Bay 1 1968B STORET_21FLMANA 607 08FEB2000 09MAY2005 Monthly Sarasota Bay 1 1968B STORET_21FLMANA 608 14MAR2000 09MAY2005 Monthly Sarasota Bay 1 1968B STORET_21FLMANA 659 14MAR2000 14JUN2005 Monthly Sarasota Bay 1 1968B STORET_21FLMANA 660 08FEB2000 09MAY2005 Monthly Sarasota Bay 1 1968B STORET_21FLMANA 667 14MAR2000 09MAY2005 Monthly Sarasota Bay 1 1968B STORET_21FLMANA 668 08FEB2000 09MAY2005 Monthly Sarasota Bay 1 1968B STORET_21FLMANA 669 14MAR2000 09MAY2005 Monthly Sarasota Bay 1 1968B STORET_21FLMANA 676 14MAR2000 14JUN2005 Monthly
Sarasota Bay 2 1968C SARASOTAES_WQ 10-4 11JAN2000 04JAN2006 Monthly Sarasota Bay 2 1968C SARASOTAES_WQ 10-5 11JAN2000 04JAN2006 Monthly Sarasota Bay 2 1968C SARASOTAES_WQ 11-4 11JAN2000 04JAN2006 Monthly
18
Table 1. Water quality monitoring sites identified as potential sources for model boundary conditions, calibration, and validation. Segment WBID Data Source Station ID Begin Date End Date Frequency
Sarasota Bay 2 1968C SARASOTAES_WQ 11-5 11JAN2000 04JAN2006 Monthly Sarasota Bay 2 1968C SARASOTAES_WQ 12-1 15AUG2001 17AUG2004 Monthly Sarasota Bay 2 1968C SARASOTAES_WQ 12-2 15AUG2001 17AUG2004 Monthly Sarasota Bay 2 1968C STORET_21FLFMRI SAR200115 11JUL2001 11JUL2001 One obs
Roberts Bay 1968D SARASOTAES_WQ 13-1 12JAN2000 04JAN2006 Monthly Roberts Bay 1968D SARASOTAES_WQ 13-2 12JAN2000 04JAN2006 Monthly Roberts Bay 1968D SARASOTAES_WQ 13-3 12JAN2000 04JAN2006 Monthly Roberts Bay 1968D STORET_21FLFMRI SAR200117 11JUL2001 11JUL2001 One obs Roberts Bay 1968D STORET_21FLFMRI SAR200118 12JUL2001 12JUL2001 One obs
Little Sarasota Bay 1968E SARASOTAES_WQ 13-4 12JAN2000 04JAN2006 Monthly Little Sarasota Bay 1968E SARASOTAES_WQ 13-5 12JAN2000 04JAN2006 Monthly Little Sarasota Bay 1968E SARASOTAES_WQ 14-1 12JAN2000 04JAN2006 Monthly Little Sarasota Bay 1968E SARASOTAES_WQ 14-2 12JAN2000 04JAN2006 Monthly Little Sarasota Bay 1968E SARASOTAES_WQ 14-3 12JAN2000 04JAN2006 Monthly Little Sarasota Bay 1968E SARASOTAES_WQ 14-4 12JAN2000 04JAN2006 Monthly Little Sarasota Bay 1968E SARASOTAES_WQ 14-5 12JAN2000 04JAN2006 Monthly Little Sarasota Bay 1968E STORET_21FLFMRI SAR200119 12JUL2001 12JUL2001 One obs Little Sarasota Bay 1968E STORET_21FLFMRI SAR200120 12JUL2001 12JUL2001 One obs Little Sarasota Bay 1968E STORET_21FLKWAT SAR-SAR7-345 06APR2001 06APR2001 One obs Little Sarasota Bay 1968E STORET_21FLKWAT SAR-SAR7-359 05DEC2000 05DEC2000 One obs Little Sarasota Bay 1968E STORET_21FLKWAT SAR-SAR7-364 21MAY2001 21MAY2001 One obs Little Sarasota Bay 1968E STORET_21FLKWAT SAR-SAR8-791 05DEC2000 05DEC2000 One obs Little Sarasota Bay 1968E STORET_21FLKWAT SAR-SAR8-806 06APR2001 06APR2001 One obs Little Sarasota Bay 1968E STORET_21FLKWAT SAR-SAR8-811 21MAY2001 21MAY2001 One obs Little Sarasota Bay 1968E STORET_21FLKWAT SAR-SAR9-838 06APR2001 06APR2001 One obs Little Sarasota Bay 1968E STORET_21FLKWAT SAR-SAR9-839 05DEC2000 05DEC2000 One obs Little Sarasota Bay 1968E STORET_21FLKWAT SAR-SAR9-935 21MAY2001 21MAY2001 One obs
Blackburn Bay 1968F SARASOTAES_WQ 16-1 11JAN2000 04JAN2006 Monthly Blackburn Bay 1968F SARASOTAES_WQ 16-2 11JAN2000 04JAN2006 Monthly Blackburn Bay 1968F SARASOTAES_WQ 16-3 11JAN2000 04JAN2006 Monthly Blackburn Bay 1968F SARASOTAES_WQ 16-4 11JAN2000 04JAN2006 Monthly
19
Table 1. Water quality monitoring sites identified as potential sources for model boundary conditions, calibration, and validation. Segment WBID Data Source Station ID Begin Date End Date Frequency
Blackburn Bay 1968F SARASOTAES_WQ 16-5 11JAN2000 04JAN2006 Monthly
Dona and Roberts Bays 2002 SARASOTAES_WQ DR-1 18MAR2003 04JAN2006 Monthly Dona and Roberts Bays 2002 SARASOTAES_WQ DR-2 18MAR2003 04JAN2006 Monthly Dona and Roberts Bays 2018 SARASOTAES_WQ DR-3 18MAR2003 04JAN2006 Monthly Dona and Roberts Bays 2018 SARASOTAES_WQ DR-4 18MAR2003 04JAN2006 Monthly Dona and Roberts Bays 2018 SARASOTAES_WQ DR-5 18MAR2003 04JAN2006 Monthly
Lemon Bay 1 1983A SARASOTAES_WQ LB-1 12JAN2005 04JAN2006 Monthly Lemon Bay 1 1983A SARASOTAES_WQ LB-1 11JAN2000 07DEC2004 Monthly Lemon Bay 1 1983A SARASOTAES_WQ LB-2 11JAN2000 04JAN2006 Monthly Lemon Bay 1 1983A SARASOTAES_WQ LB-3 11JAN2000 04JAN2006 Monthly Lemon Bay 1 1983A SARASOTAES_WQ LB-4 11JAN2000 04JAN2006 Monthly Lemon Bay 1 1983A SARASOTAES_WQ LB-5 11JAN2000 04JAN2006 Monthly Lemon Bay 1 1983A STORET_21FLCHAR LBV002 03JAN2000 04DEC2000 Monthly Lemon Bay 1 1983A STORET_21FLFMRI SAR200121 17JUL2001 17JUL2001 One obs Lemon Bay 1 1983A STORET_21FLFMRI SAR200122 17JUL2001 17JUL2001 One obs Lemon Bay 1 1983A STORET_21FLKWAT CHA-CHA1-681 12APR2001 12APR2001 One obs Lemon Bay 1 1983A STORET_21FLKWAT CHA-CHA1-686 06DEC2000 06DEC2000 One obs Lemon Bay 1 1983A STORET_21FLKWAT CHA-CHA1-689 22MAY2001 22MAY2001 One obs Lemon Bay 1 1983A LB Preserve Volunteer LBV001 03JAN2000 05DEC2005 Monthly Lemon Bay 1 1983A LB Preserve Volunteer LBV002 03JAN2000 05DEC2005 Monthly Lemon Bay 1 1983A LB Preserve Volunteer LBV003 03JAN2000 05DEC2005 Monthly
The following steps will be necessary to develop a water quality model for the County’s estuarine waters:
• Define specific questions to be addressed by the model, • Define appropriate spatial and temporal resolution to address these questions, • Construct model grid, define boundary conditions, and prepare model input files, • Calibrate model using existing ambient water quality data, • Verify model using additional ambient water quality data • Demonstrate model to County staff , • Define model scenarios, • Apply model to these scenarios, and • Report model output and assess model scenarios.
Water Quality Monitoring The existing water quality monitoring programs provide a great deal of information regarding the status of water quality in the estuarine waters of the county. It is recommended that a workshop regarding the current County monitoring program design be held to ensure that the major questions regarding water quality can be addressed.
21
Volunteer monitoring can prove to be a very effective means by which the public can be made aware of the importance of water quality to all of those affected by this critical natural resource. It is recommended that consideration be given to establishing a volunteer monitoring program that focuses on water clarity in the estuarine waters of the county. County staff have already begun discussion regarding a volunteer monitoring program for seagrasses. A sampling design to address both indicators (i.e., water clarity and seagrass extent) could be formulated and relatively easily implemented. Water Quality Assessment and Reporting One of the major failures of monitoring programs is the lack of adequate analysis and reporting of the data gathered. It has also been acknowledged that the reporting of this information should be tailored not only for those that are technically competent but also for others such as decision makers and the public at large. It is recommended that efforts to develop reporting methods be considered. Specifically, the intended audience of the reporting should be identified. Also, the appropriate spatial and temporal reporting units should be defined. Consideration should be given especially to the recently developed water clarity targets for estuarine waters of the county. Similar efforts in Tampa Bay resulted in the development of a decision matrix that synthesizes monitoring data by geographic units on an annual basis. The matrix takes into account the influence of extreme meteorological conditions that can result in unfavorable water quality but are beyond the control of even the most effective management programs.
22
References Applied Technology and Management, Inc., and Janicki Environmental, Inc. 2007. Cow Pen Slough MFL, Hydrodynamic Model Development, Dona and Roberts Bay. Prepared for Southwest Florida Water Management District. CDM. 1992. Point/Non-Point Source Pollution Loading Assessment – Phase I. Submitted to Sarasota Bay National Estuary Program. ERD. 2004. JEA. 2005. Sarasota County County-Wide Non-Point Source Pollutant Loading Model. Prepared by Jones Edmunds and Associates, Inc. Prepared for Sarasota County.