Recommendations of the Expert Panel to Define Removal Rates for Individual Stream Restoration Projects Presentation at the Joint Meeting of the Urban Stormwater Workgroup, Agricultural Workgroup, and Watershed Technical Workgroup December 17, 2012
Transcript
Recommendations of the Expert Panel to Define Removal Rates for Individual Stream
Restoration Projects
Presentation at the Joint Meeting of the Urban Stormwater Workgroup, Agricultural Workgroup, and Watershed Technical Workgroup
December 17, 2012
Outline of Presentation
1. The Panel Process and Adaptive Management
2. Review of the Science
3. Definitions, Qualifying Conditions & Environmental Issues
4. The Four Protocols and Design Examples
5. Verification Procedures
6. Implementation Issues
7. Other Panelist Perspectives
8. Audience Questions and Comments
1. The Panel Process
Outlined in the BMP Review Protocol (WQGIT, 2010)
BMP Expert Panel reviews existing research set of recommendations
7 calls, 2 workshops, 5 drafts over 12 months
Product: Technical Memo and 5 Appendices
BMP EXPERT PANEL
URBAN STORMWATER WORKGROUP
WATER QUALITY GIT
The Agriculture Work Group, Watershed Technical Workgroup and Stream Habitat GIT is also actively involved in the review process.
Panelist Affiliation Deb Cappuccitti Maryland Department of Environment Bob Kerr Kerr Environmental Services (VA) Matthew Meyers, PE Fairfax County (VA) Dept of Public Works and Environmental Services Daniel E. Medina, PE Atkins (MD) Joe Berg Biohabitats (MD) Lisa Fraley-McNeal Center for Watershed Protection (MD) Steve Stewart Baltimore County Dept of Env. Protection and Sustainability (MD) Dave Goerman Pennsylvania Department of Environmental Protection Natalie Hartman West Virginia Department of Environmental Protection Josh Burch District Department of Environment Dr. Robert C. Walter Franklin and Marshall College Dr. Sujay Kaushal University of Maryland Dr. Solange Filoso University of Maryland Julie Winters US Environmental Protection Agency CBPO Bettina Sullivan Virginia Department of Environmental Quality Panel Support Tom Schueler Bill Stack
Chesapeake Stormwater Network (facilitator) Center for Watershed Protection (co-facilitator)
Other Panel Support: Russ Dudley – Tetra Tech, Debra Hopkins – Fish and Wildlife Service, Molly Harrington, CBP CRC, Norm Goulet, Chair Urban Stormwater Work Group, Gary Shenk, EPA CBPO, Jeff Sweeney, EPA CBPO
Expert Panel on Urban Stream Restoration
Charge to the Panel
Review all of the available science on the nutrient and sediment removal performance associated with stream restoration projects in relation to those generated by degraded urban stream channels.
Provide a specific definition of what constitutes
effective stream restoration, and define the qualifying conditions under which a local stream restoration project may be eligible to receive the credit.
Assess whether the existing CBP-approved removal rate
is suitable for qualifying stream restoration projects, or whether new protocols need to be developed to define improved rates.
Charge to the Panel
Consider project specific factors such as physiographic
region, landscape position, stream order, type of stream restoration practices employed and upstream or subwatershed conditions.
Recommend procedures for reporting, tracking, and
verifying any recommended stream restoration credits over time.
Critically analyze possible unintended consequences associated with the credit and the potential for over-counting of the credit, with a specific reference to any upstream BMPs installed.
Important Caveat on Permitting
The Panel recognizes that stream restoration projects as defined in this report may be subject to authorization and associated requirements from federal, state, and local agencies.
The recommendations in this report are not intended to supersede any other requirements or standards mandated by other government authorities.
Consequently, some stream restoration projects may conflict with other regulatory requirements and may not be suitable or authorized in certain locations.
Note: EPA and COE have put together a task force on stream restoration permitting issues
Urban Stream Restoration Expected by 2025 in Bay State Phase 2 Watershed Implementation Plans
State
Urban Stream Restoration
Non-Urban Stream Restoration
Linear Feet (Miles) Delaware 200 (0.02) 63,202 (12) District of Columbia 42,240 (8) 0 Maryland 2,092,325 (396) 73,975 (14) New York 26,500 (5) 337,999 (64) Pennsylvania 55,000 (10) 529,435 (100) Virginia 116,399 (22) 104,528 (20) West Virginia 0 19,618 (3.7) TOTAL 441 miles 214 miles 1 Acres under urban and non urban stream restoration in each state by 2025 as reported in the Phase 2 Watershed Implementation Plan submissions to EPA in 2012, as summarized in May and July 2012 spreadsheets provided by Jeff Sweeney, EPA CBPO. Totals are inclusive of historical and planned implementation.
Stream Restoration is Expected to Increase Substantially to Meet the WIP Targets
Adaptive Management Approach
Panel acknowledges that while we have a lot more science than we
had ten years ago, there are still gaps in our understanding of urban stream nutrient dynamics
Recommendations and associated protocols were developed with the notion that they could be improved/refined over time as better data becomes available
Many research and management recommendations provided to
increase confidence in the methods and the implementation of stream restoration practices
Protocols should be revisited in 2017 when more stream restoration research, better practitioner experience, and an improved CBWM model all become available to Bay managers
2. Review of the Science
Review of the old rate How sediment and nutrients are simulated in the CBWM Nutrient flux at stream reach level
Nutrients and physical properties of stream sediment
In-stream nitrogen processing Nutrient dynamics in restored floodplain wetlands Regenerative stormwater conveyance systems Effect of riparian cover on stream restoration
effectiveness Longevity of stream restoration practices
More than 125 papers and reports reviewed by Panel
Removal Rate per Linear Foot of Qualifying Stream Restoration
Source TN TP TSS Spring Branch
N=1 0.02 lbs 0.0035 2.55 lbs
At some point applied to non-urban stream restoration projects.
Review of the Old Rate
Revised Removal Rate per Linear Foot for Spring Branch Based on Four
Additional Years of Sampling and Data Reanalysis Source TN TP TSS
Spring Branch N=1
0.227 lbs 0.0090 3.69 lbs 1
% Removal in Reach
42% 43% 83%
Source: Stewart et al (2008) and Steve Stewart presentation to expert panel 1/25/2012 1 the project did not directly measure nutrient and sediment removal due to prevented streambank erosion, so these numbers are still considered very conservative
Interim Approved Removal Rate per Linear Foot of Qualifying Stream Restoration
Source TN TP TSS
New Interim CBP Rate 0.20 lbs 0.068 lbs 310* lbs
Derived from six stream restoration monitoring studies: Spring Branch, Stony Run, Powder Mill Branch, Moore’s Run, Beaver Run and Beaver Dam Creek located in MD or PA *Removal rate for TSS is representative of edge-of-field rates and is subject to a sediment delivery ratio in the CBWM.
2012 Interim Approved Removal Rate
1
10
100
1,000
10,000
100,000 Edge-of-Field Erosion Rate (lb/ft/yr)
Why a Universal Restoration Credit Doesn’t Make Sense (CWP Literature Review)
Str
ea
mb
an
k E
ro
sio
n R
ate
(l
b/f
t/y
r)
How Sediment and Nutrients are Simulated in the CBWM
Relationship between Edge-of-Stream Urban Sediment Loads and Impervious Cover developed from data from Langland and Cronin (2003)
Sediment Delivery The Project Reach versus the CBWM River Basin Segment
How Sediment and Nutrients are Simulated in the CBWM
Scale in Phase 5 - Sediment
BMP Factor
Land Acre Factor
Delivery Factor
Edge of Field
Expected loads from one acre
Edge of Stream
60-100 sq miles
In Stream Concentrations
Scour/ Deposition Calibrated to core trend stations
Nutrient Flux at the Stream Reach Level
Studies measured the change in flow-weighted nutrient and sediment concentrations above and below a stream restoration reach and often compared to an unrestored condition (i.e., 9 year monitoring of Spring Branch by Stewart (2008)).
Filoso and Palmer (2011) and Filoso (2012) - Sediment and
nutrient mass balance for 8 low-order streams in AACo, including 4 NCD, 2 RSC, and 2 unrestored. 2 of the 6 restored reaches were effective at reducing export of TN downstream. Most effective: lowland channels, projects that restored wetland-stream complexes, and those that reduce peak flows during high flow conditions.
Richardson et al. (2011) – Restoration project in NC piedmont that involved floodplain reconnection and wetland creation. Found significant TSS retention, 64% reduction nitrate-N, and 28% reduction TP. Stream, wetland, and floodplain restoration together maximize functional benefits.
Table 5: TN and TP Concentrations in Sediments in Different Parts of the Urban Landscape1
Location Median TP TP Range
Median TN TN Range Location Reference
Upland Soils 0.045 0.0025-0.577
0.8 0.05-3.3 MD Pouyat et al. 2007
Street Solids 0.52 0.19-0.72 1.08 0.324-2.71 MD Diblasi, 2008
Catch Basin3 0.49 0.057-0.97 1.74 0.055-6.27 MD Law et al. 2008
BMP Sediments
0.29 0.014-1.38 1.47 0.11-5.6 National Schueler, 1994
1.61 3.81 MD Stewart, 2012 0.357 0.23-4.69 1.1 0.7-1.7 PA Land Studies,
20052 1.2 -- 2.6 -- PA Merritts et al,
20102 1 all units are lb/ton 2 the Pennsylvania data on stream bank sediments were in rural/agricultural subwatersheds 3 catch basin values are for sediment only, excluding leaves
Nutrients and Physical Properties of Stream Sediment
In-Stream Nitrogen Processing
• The Panel identified a series of factors that could promote greater dry weather N reduction:
o Increase retention time in floodplain wetlands
o Add DOC – reforestation, debris jams, woody debris
o Reconnect streams to the floodplain
o Focus on stream with high dry-weather N concentration
o Ensure the restored reach is long enough to achieve minimum hydrologic residence time
o Install in-stream and floodplain wetland practices with a high surface area to depth ratio
o Attenuate flows and reduce pollutants through upstream or lateral stormwater retrofits
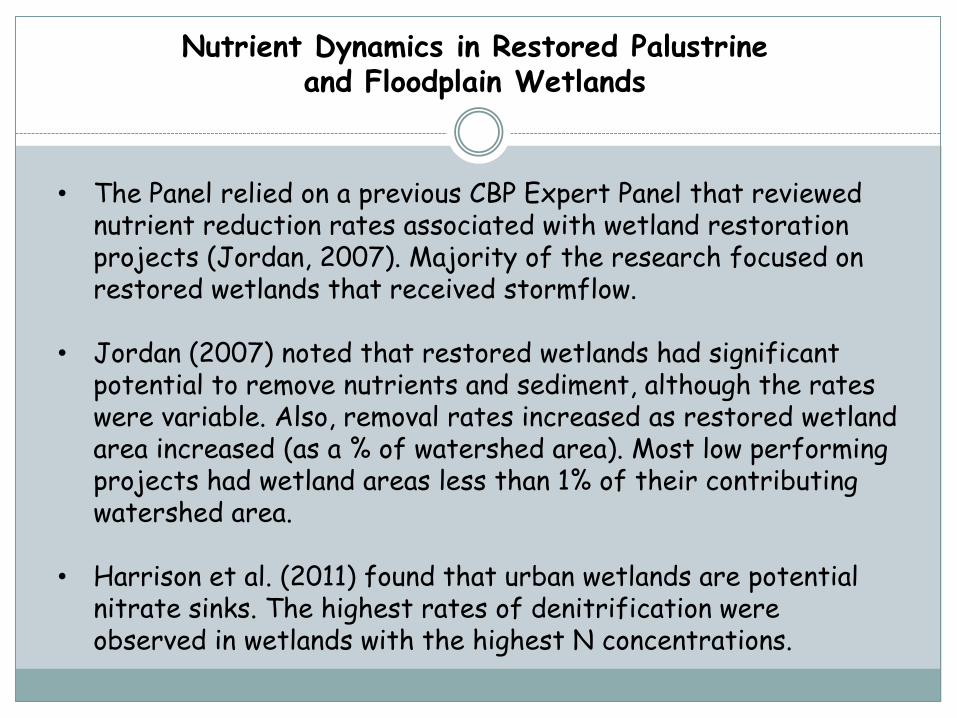
Nutrient Dynamics in Restored Palustrine and Floodplain Wetlands
• The Panel relied on a previous CBP Expert Panel that reviewed nutrient reduction rates associated with wetland restoration projects (Jordan, 2007). Majority of the research focused on restored wetlands that received stormflow.
• Jordan (2007) noted that restored wetlands had significant potential to remove nutrients and sediment, although the rates were variable. Also, removal rates increased as restored wetland area increased (as a % of watershed area). Most low performing projects had wetland areas less than 1% of their contributing watershed area.
• Harrison et al. (2011) found that urban wetlands are potential nitrate sinks. The highest rates of denitrification were observed in wetlands with the highest N concentrations.
Nutrient Dynamics in Restored Palustrine and Floodplain Wetlands
Study by Jordan, Smithsonian Environmental Research Center as published in Weammert and Simpson, 2009. The rate of increase declines as the proportion of wetland area increases . Thus, the additional benefit of adding more wetland area gradually diminishes.
Relationship between Nutrient Removal and Ratio of Wetland Area to Watershed Area
Regenerative Stormwater Conveyance (RSC)
Two specific classes of stream restoration as defined in the technical guidance developed by Flores (2011) in Anne Arundel County, Maryland. The RSC approach has also been referred to as coastal plain outfalls, regenerative step pool storm conveyance, and biofiltration conveyance.
Dry Channel RSC involves restoration of ephemeral streams or eroding gullies using a combination of step pools, sand seepage wetlands, and native plants. These applications are often located at the end of storm drain outfalls or channels. The receiving channels are “dry” in that they are located above the water table and carry water only during and immediately after a storm event.
Wet Channel RSC are located further down the perennial stream network and use in-stream weirs to spread storm flows across the floodplain at moderate increases in the stream stage (i.e., for events smaller than the 1.5 year storm). Wet channel RSC may also include sand seepage wetlands or other wetland types in the floodplain that increase floodplain connection or interactions with the stream.
Regenerative Stormwater Conveyance (RSC)
Source: Underwood & Associates (Carriage Hills)
Regenerative Stormwater Conveyance Systems
• The Panel classified dry channel RSC as an upland stormwater retrofit rather than a stream restoration practice. Removal rates are calculated using retrofit rate adjuster curves developed by the Stormwater Retrofit Expert Panel.
• The Panel concluded that wet channel RSC systems were a stream restoration practice and their removal rate can be estimated based on the appropriate stream restoration protocols.
Effect of Riparian Cover on Stream Restoration Effectiveness
• Several recent studies have documented the critical importance of riparian cover in enhancing nutrient removal associated with individual stream restoration practices.
• Projects that involve extensive channel reconfiguration or remove existing riparian cover are likely to see less functional uplift, including nutrient removal. The Panel included reestablishment of forest cover as a key qualifying condition in its recommendations.
• Stream restoration should be coupled with upland retrofits and other practices to manage multiple stressors.
• The Panel concluded that a stream functional assessment needs to be an important part of project design and monitoring.
Longevity of Stream Restoration Practices
• Until recently, post-project monitoring has been rarely conducted to assess how well stream restoration projects meet their intended design objectives.
• The Panel decided to utilize a stringent approach to verify the performance of individual projects over time. The approach establishes measurable restoration objectives, project monitoring plans, and a limited 5 year credit duration that can be renewed pending verification that the project is still working.
Refers to any NCD, RSC, LSR or other restoration project that meets the qualifying conditions for credits, including environmental limitations and stream functional improvement. The Panel suggest that any single design approach was not superior to the others, as any project can fail if it is inappropriately located, assessed, designed, constructed, or maintained.
Stream Restoration
3. Definitions, Qualifying Conditions, and Environmental Issues
Natural Channel Design (NCD)- Application of fluvial geomorphology to create stable channels that maintain a state of dynamic equilibrium among water, sediment, and vegetation such that they do not aggrade or degrade over time. This class of stream restoration utilizes data on current channel morphology, including stream cross section, plan form, pattern, profile, and sediment characteristics for a stream classified according to the Rosgen (1996).
Legacy Sediment Removal (LSR) - A class of stream and wetland restoration that seeks to remove legacy sediments that have accumulated behind small mill dams and recreate the pre-colonial valley form of multiple thread channels in a wet meadow corridor.
NCD and LSR
Prevented Sediment - The annual mass of sediment and associated nutrients that are retained by a stable, restored stream bank or channel that would otherwise be eroded and delivered downstream in an actively enlarging or incising urban stream.
Functional Uplift - A general term for the ability for a degraded urban stream to recover hydrologic, hydraulic, geomorphic, physiochemical, or biological indicators of healthy stream function.
Hyporheic Zone - The hyporheic zone is defined as the region below
and alongside a stream, occupied by a porous medium where there is an exchange and mixing of shallow groundwater and the surface water in the channel. The dimensions of the hyporheic zone are defined by the hydrology of the stream, substrate material, its surrounding environment, and local groundwater sources. This zone has a strong influence on stream ecology, biogeochemical cycling, and stream water temperatures.
Other Key Terms
Floodplain – floodplains are defined as relatively flat areas of land between the stream channel and the valley wall that will receive excess storm flows when the channel capacity is exceeded. Therefore, floodwaters access the floodplain much more frequently.
Floodplain Reconnection Volume - This quantifies the benefit that a given project may provide in terms of bringing floodwaters in contact with the floodplain. It is defined as the additional annual volume of stream runoff and base flow from an upstream subwatershed that is effectively diverted onto the available floodplain, riparian zone, or wetland complex, over and above the pre-project volume.
Floodplain
Qualifying Conditions
Stream restoration projects that are primarily designed to protect public infrastructure by bank armoring or rip rap do not qualify for a credit.
The urban stream reach must be greater than 100 feet in length
and be still actively enlarging or degrading in response to upstream development or adjustment to previous disturbances in the watershed (e.g., a road crossing).
The project must utilize a comprehensive approach to stream restoration design, involving the channel and banks.
Special consideration is given to projects that are explicitly designed to reconnect the stream with its floodplain or create wetlands and/or instream habitat features known to promote nutrient uptake or denitrification.
Environmental Concerns
Each project must comply with all state and federal permitting requirements, including 404 and 401 permits, which may contain conditions for pre-project assessment and data collection, as well as post construction monitoring.
Stream restoration is a carefully designed intervention to improve the
hydrologic, hydraulic, geomorphic, water quality, and biological condition of degraded urban streams, and cannot and should not be implemented for the sole purpose of nutrient or sediment reduction.
Urban stream restoration is generally only warranted in urban stream
reaches that have been or are currently being degraded by upstream watershed development.
There may be a few classes of legacy sediment stream restoration
projects that do not fall into the preceding statement. Also, there may instances where limited bank stabilization is needed to protect critical public infrastructure (which may need to be mitigated and does not qualify for any sediment or reduction credits).
A qualifying project must meet certain presumptive criteria to ensure that high- functioning portions of the urban stream corridor are not used for in-stream stormwater treatment (i.e., where existing stream quality is still good). These may include one or more of the following:
Geomorphic evidence of active stream degradation (i.e., BEHI score) An IBI of fair or worse Hydrologic evidence of floodplain disconnection Evidence of significant depth of legacy sediment in the project reach
Stream restoration should be directed to areas of more severe stream impairment,
and the use and design of a proposed project should also consider the level of degradation, the restoration needs of the stream, and the potential functional uplift.
Before credits are granted, stream restoration projects will need to meet post-
construction monitoring requirements, document successful vegetative establishment, and conduct initial project maintenance.
A qualifying project must demonstrate that it will maintain or expand riparian
vegetation in the stream corridor, and compensate for any project-related tree losses in project work areas.
All qualifying projects must have a designated authority responsible for development
of a project maintenance program that includes routine and long-term maintenance.
Environmental Concerns
Stream restoration projects should utilize a functional assessment process, such as the stream functions pyramid (Harman et al, 2012) or functional equivalent, to:
Set programmatic goals and objectives Site selection and watershed assessment Conduct site-level function-based assessment Determine restoration potential Establish specific restoration design objectives Select restoration design approach and alternative analysis Project design review Implement post-construction monitoring
The level of detail needed to perform a function-based
assessment will be based on the size, complexity and landscape position of the proposed project.
Stream Functional Assessment
4. Stream Restoration Protocols and Design Examples
Summary of Stream Restoration Credits for Individual Restoration Projects 1, 2
No Name Units Pollutants Method Reduction Rate
1 Prevented Sediment (S)
Pounds Per Year
Sediment TN,TP
Define Bank Retreat Using BANCS
Measured N/P Content in Stream Sediment
2 Instream Denitrification (B)
Pounds Per Year
TN Define Hyporheic Box for Reach
Measured Unit Stream Denit Rate
3 Stormflow Floodplain Reconnection (S)
Pounds Per Year
Sediment TN,TP
Use Curves to Define Volume for Reconnection Storm Event
Measured Removal Rates for Floodplain Wetland Restoration Projects
4 Dry Channel RSC as a Retrofit (S/B)
Removal Rate
Sediment TN,TP
Determine Stormwater Treatment Volume
Use Adjustor Curves from Retrofit Expert Panel
1 Depending on project design, more than one protocol may be applied to each project, and the load reductions are additive. 2 Sediment load reductions are further reduced by a sediment delivery factor in the CBWM (which is not used in local sediment TMDLs)
S: applies to stormflow conditions B: applies to base flow or dry weather conditions
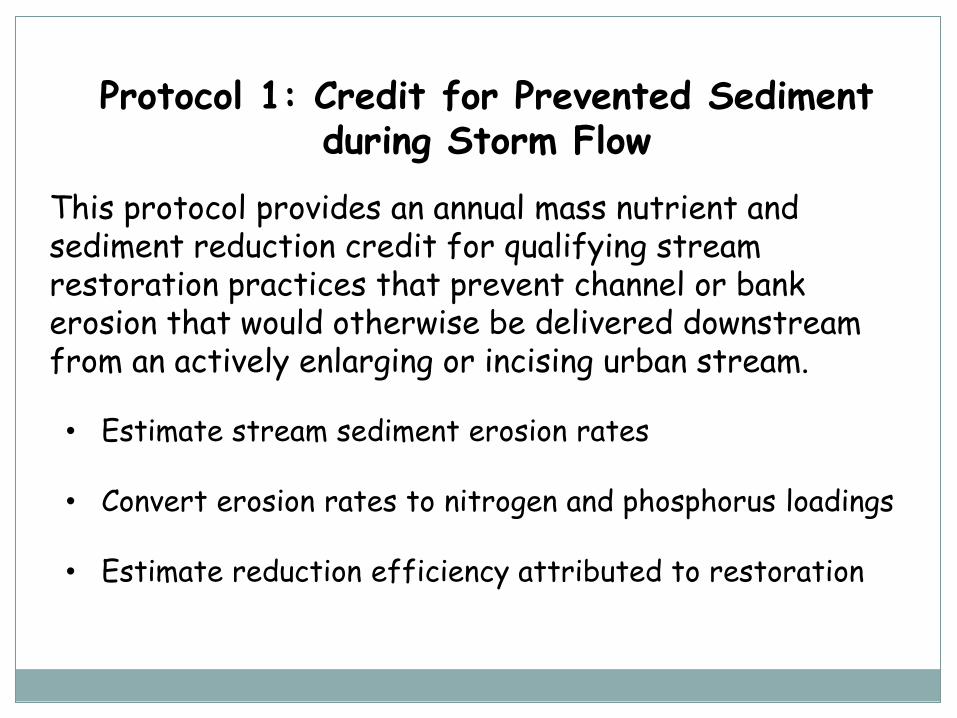
Protocol 1: Credit for Prevented Sediment during Storm Flow
This protocol provides an annual mass nutrient and sediment reduction credit for qualifying stream restoration practices that prevent channel or bank erosion that would otherwise be delivered downstream from an actively enlarging or incising urban stream.
• Estimate stream sediment erosion rates • Convert erosion rates to nitrogen and phosphorus loadings • Estimate reduction efficiency attributed to restoration
Estimate reach-wide sediment loading by summing the predicted erosion rates for each eroded bank using BEHI and NBS assessment or equivalent.
Step1.Estimate Stream Sediment Erosion Rates Using the BANCS Method
Protocol 1: Credit for Prevented Sediment during Storm Flow
Step1.Estimate Stream Sediment Erosion Rates Using the BANCS Method
Protocol 1: Credit for Prevented Sediment during Storm Flow
Streambank Characteristics used to develop BEHI
Velocity Gradient and Near-Bank Stress Indices
Regional Curve for Determining “R” in equation: S = ∑(C×A×R)
Curve for Hickey Run – Washington DC- USFWS
Protocol 1: Credit for Prevented Sediment during Storm Flow
1
10
100
1,000
10,000
100,000
Hickey Run - Reach 1
Hickey Run - Reach 2
Hickey Run - Reach 3
Hickey Run - Reach 4
Hickey Run - Reach 5
Oxon Run Mainstem
Suitland Parkway Trib
Barnaby Run Owens Road Trib
Glassmanor Trib
Forest Heights Trib
Stre
amb
ank
Ero
sio
n R
ate
(l
b/f
t/yr
) Protocol 1: Credit for Prevented Sediment
during Storm Flow
Predicted Erosion Rate (lb/ft/yr) for Reaches in Hickey Run, Washington, DC
S=∑(c x A x R ) / 2,000
• Where: S = sediment load (ton/year) for reach or stream
• c = bulk density of soil (lbs/cubic foot)
• R = bank erosion rate (feet/year) (from regional curve)
• A = eroding bank area (square feet)
• 2,000 = conversion from lbs to tons
Step 2.Convert erosion rates to loadings
Protocol 1: Credit for Prevented Sediment during Storm Flow
Table 5: TN and TP Concentrations in Sediments in Different Parts of the Urban Landscape1
Location Median TP TP Range
Median TN TN Range Location Reference
Upland Soils 0.045 0.0025-0.577
0.8 0.05-3.3 MD Pouyat et al. 2007
Street Solids 0.52 0.19-0.72 1.08 0.324-2.71 MD Diblasi, 2008
Catch Basin3 0.49 0.057-0.97 1.74 0.055-6.27 MD Law et al. 2008
BMP Sediments
0.29 0.014-1.38 1.47 0.11-5.6 National Schueler, 1994
1.61 3.81 MD Stewart, 2012 0.357 0.23-4.69 1.1 0.7-1.7 PA Land Studies,
20052 1.2 -- 2.6 -- PA Merritts et al,
20102 1 all units are lb/ton 2 the Pennsylvania data on stream bank sediments were in rural/agricultural subwatersheds 3 catch basin values are for sediment only, excluding leaves
Multiply sediment load times TN and TP concentrations
Step 3.Use conservative 50% reduction efficiency based on local data, literature values or anecdotal observations by practitioners
Protocol 1: Credit for Prevented Sediment during Storm Flow
Spring Branch - In-Stream Site
Before=(2857.34)*CFS**(0.9338504) R=.85
After=(355.0036)*CFS**(0.710926) R=.67
CFS/Acre
TSS (mg/L)
0
60
120
180
240
300
0.01 0.02 0.03 0.04 0.05 0.06 0.07 0.08
After Restoration
Before Restoration
This protocol provides an annual mass nitrogen reduction credit for qualifying projects using empirical measurements of denitrification during base flow within a stream's hyporheic zone (stream, riparian and floodplain)
Protocol 2: Credit for Denitrification in the Hyporheic Zone during Base Flow
Functional ecomorphology: Feedbacks between form and function in fluvial landscape ecosystems. Stuart G. Fisher, , James B. Heffernan, Ryan A. Sponseller, Jill R. Welter
Protocol 2: Credit for Denitrification in the Hyporheic Zone during Base Flow
5 feet + stream width + 5 feet
5 feet depth
Step 1.Determine the total post construction stream length that has been reconnected using the bank height ratio of 1.0 or less (for NCD) or the 1.0 inch storm (other design approaches that do not use the bank full storm) Step 2. Determine the dimensions of the hyporheic box Step 3. Multiply the hyporheic box mass by the unit denitrification rate
Annual mass nutrient reduction credit for projects that reconnect stream channels to their floodplain over a wide range of storm events
Protocol 3: Credit for Floodplain Reconnection Volumes during Storm Flow
Takes credit for how much annual runoff, sediment and nutrient loadings enters the flood plain?
Accounts for how much of the flood plain can be considered wetlands?
This Protocol is based on the following:
Annual runoff volume going to floodplain wetlands when floodplain is accessed at 1.0”
Annual runoff volume going to floodplain wetlands when floodplain is accessed at 0.5”
In-channel flow
Protocol 3: Credit for Floodplain Reconnection Volumes during Storm Flow
Step 1.Estimate the floodplain connection volume
Protocol 3: Credit for Floodplain Reconnection Volumes during Storm Flow
Step 2.Estimate the N and P removal rate attributable to floodplain reconnection (using Jordan 2009 study)
Protocol 3: Credit for Floodplain Reconnection Volumes during Storm Flow
Step 3.Compute the annual N, P, and TSS load delivered to the project during storms
Edge of Stream Unit Loading Rates for Bay States Using CBWM
v. 5.3.2
No Action Run, State-wide Average Loading Rates,
average of regulated and unregulated MS4 areas
BAY
STATE
Total
Nitrogen
Total
Phosphorus
Suspended
Sediment
Pounds/acre/year Tons/acre/year
IMPERV PERV IMPERV PERV IMPERV PERV
DC 13.2 6.9 1.53 0.28 1165 221
DE 12.4 8.7 1.09 0.25 360 42
MD 15.3 10.8 1.69 0.43 1116 175
NY 12.3 12.2 2.12 0.77 2182 294
PA 27.5 21.6 2.05 0.61 1816 251
VA 13.9 10.2 2.21 0.60 1175 178
WV 21.4 16.2 2.62 0.66 1892 265
Source: Spreadsheet output provided by Chris Brosch, CBPO, 1/4/2012
Step 4.Multiply the pollutant load by the project removal rate to define the reduction credit
The Panel decided to classify dry channel RSC systems as an upland stormwater retrofit. Designers should use the protocols developed by the Urban Stormwater Retrofit Expert Panel to derive the sediment and nutrient removal rates. The general process is to determine runoff reduction credit from adjustor curves that determine TP, TN, and TSS removal rates based on the depth of rainfall captured over the contributing impervious area treated by the RSC. The final removal rate is then applied to the entire drainage area to the dry channel RSC project.
Protocol 4: Dry Channel RSC as a Stormwater Retrofit
Protocol 4: Dry Channel RSC as a Stormwater Retrofit
Design Examples and Comparison to Interim Rate
Design examples were created to show the application of the four protocols. Depending on the project design, more then one protocol may apply. Protocol 1 – Bay City, VA is planning on restoring 7,759 ft of Hickey Run. The data used for this example are taken from Hickey Run collected by the USFWS. Protocol 2 – Bay City would like to determine what additional nutrient reduction enhancement credits could be earned by incorporating in-stream design features that promote biological nutrient processing. It was determined that in-stream design features were possible for 500 ft of the stream and only on one side of the channel. Protocol 3 – Bay City is not satisfied with the credits from the above restoration approaches and wants to compare these approaches to one where the stream can be reconnected to the floodplain. The watershed area is 1,102 acres with an impervious cover of 41%.
Design Examples and Comparison to Interim Rate
Edge-of-Stream Load Reductions for Various Treatment Options (lbs/year)
Total Watershed Loading1
Protocol 1 (BANCS)2
Protocol 2 (Hyporehic Box)3
Protocol 3 (Floodplain reconnection)4
Total Load Reduction5 Interim Rate6
TN
12,896
1,754
181
220
2,155
1,552
TP
1,382 810 -- 50 860 528
TSS7 642,226 236,000 -- 18,600 254,600 420,926
1 Edge of stream loadings calculated from Table 6, assuming watershed area of 1102 acres and 41% impervious cover 2 For the design conditions as outlined in protocol 1 example 3 For the design conditions as outlined in protocol 2 example 4 For the design conditions as outlined in protocol 3 example 5 Assuming the all three protocols are applied to the same project 6 Applying the unit rate to 7,759 linear feet of the project 7 For Protocol 1 and interim methods for TSS reductions, a sediment delivery ratio of 0.175 was applied.
5. Verification Procedures
Duration of Stream Restoration Credit
• Max duration for the removal credits is 5 years
• Can be renewed based on a field performance inspection that verifies the project still exists, is adequately maintained and operating as designed.
• Duration of the credit is shorter than other structural urban BMPs, as these projects are: o subject to catastrophic damage from extreme flood
events o have requirements for 3 to 5 years of post-construction
monitoring to satisfy permit conditions
Typical Reporting Information Includes:
• Type, length and width of stream restoration project
• Location coordinates
• Year of installation and maximum duration of credit
• 12 digit watershed in which it is located
• Protocol(s) used
• Projected sediment, nitrogen, and phosphorus load reduction
Localities should check with their state agency on the specific data to report for individual projects.
Initial Verification of Performance
Prior to submitting the load reduction to the state tracking database, the installing agency will need to provide a post-construction certification that the stream restoration project: was installed properly,
meets or exceeds its functional restoration objectives
hydraulically and vegetatively stable,
Initial verification is provided either by the designer, local inspector or state permit authority
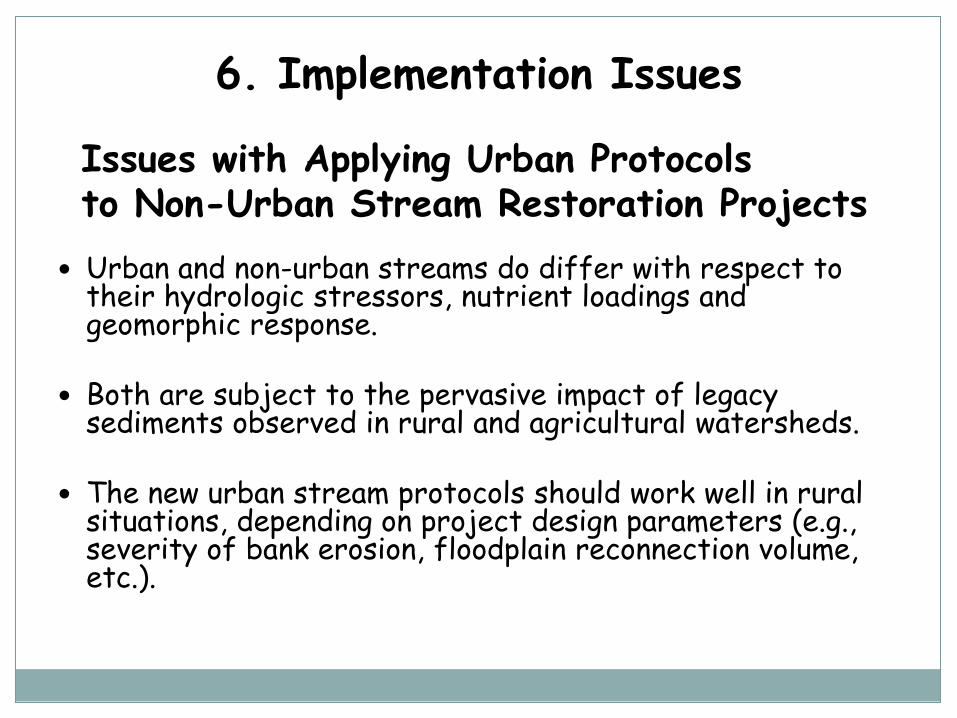
Urban and non-urban streams do differ with respect to their hydrologic stressors, nutrient loadings and geomorphic response.
Both are subject to the pervasive impact of legacy sediments observed in rural and agricultural watersheds.
The new urban stream protocols should work well in rural situations, depending on project design parameters (e.g., severity of bank erosion, floodplain reconnection volume, etc.).
6. Implementation Issues
Issues with Applying Urban Protocols to Non-Urban Stream Restoration Projects
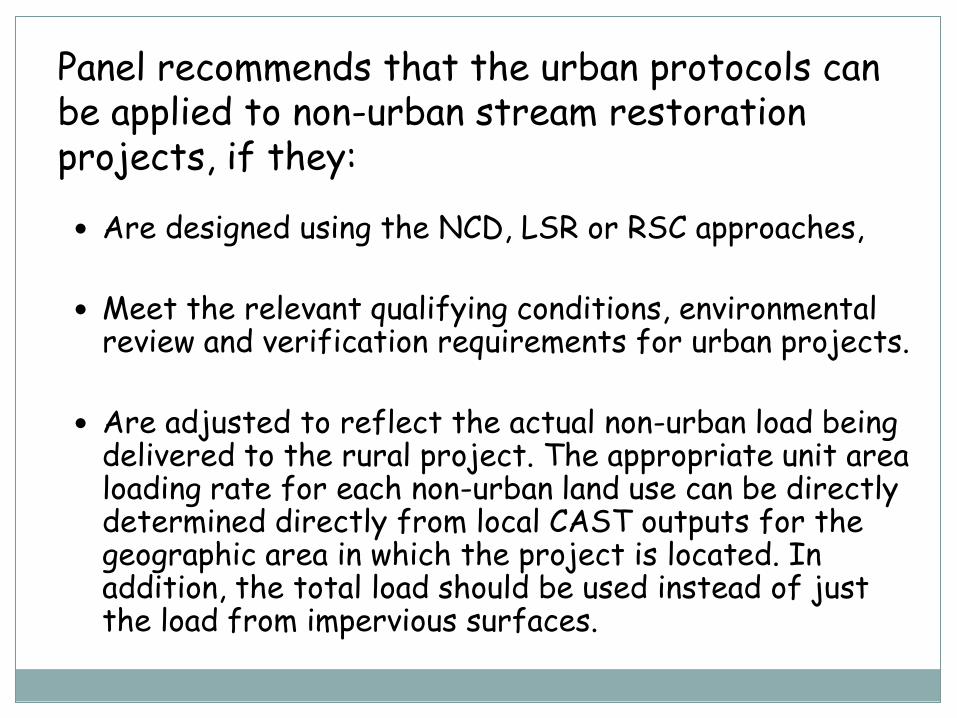
Are designed using the NCD, LSR or RSC approaches,
Meet the relevant qualifying conditions, environmental review and verification requirements for urban projects.
Are adjusted to reflect the actual non-urban load being delivered to the rural project. The appropriate unit area loading rate for each non-urban land use can be directly determined directly from local CAST outputs for the geographic area in which the project is located. In addition, the total load should be used instead of just the load from impervious surfaces.
Panel recommends that the urban protocols can be applied to non-urban stream restoration projects, if they:
Enhancement projects where the stream is in fair to good condition, but habitat features are added to increase fish production (e.g., trout stream habitat, brook trout restoration, removal of fish barriers, etc.).
Projects that seek to restore streams damaged by acid mine drainage
Riparian fencing projects to keep livestock out of streams
Some types of non-urban stream restoration projects will not qualify for sediment or nutrient credit including:
Issues Related to Mitigation and Trading
The Panel was clear that a stream restoration project MUST provide a NET watershed removal benefit in order to be eligible for either a sediment or nutrient credit.
NO removal credit cannot be granted for any project that is built to offset, compensate, or otherwise mitigate for an impact to a stream or waterway elsewhere in the watershed.
More frequent and stringent verification process for any stream restoration project built for the purpose of nutrient trading or banking, in order to assure that the project is meeting its nutrient or sediment reduction design objectives.
The “Test-Drive” Process
Recommended protocols are new, somewhat complex and will require project-based interpretation on the part of practitioners and regulators alike.
Panel strongly recommends that both groups should "test-drive" the protocols on real world projects over the next six months.
Based on their collective experience, convene a Bay-wide meeting to develop any additional supplemental information or procedures to effectively implement the protocols.
Series of webcast or workshops to deliver a clear and
consistent message to the Bay stream restoration community on how to apply the protocols.
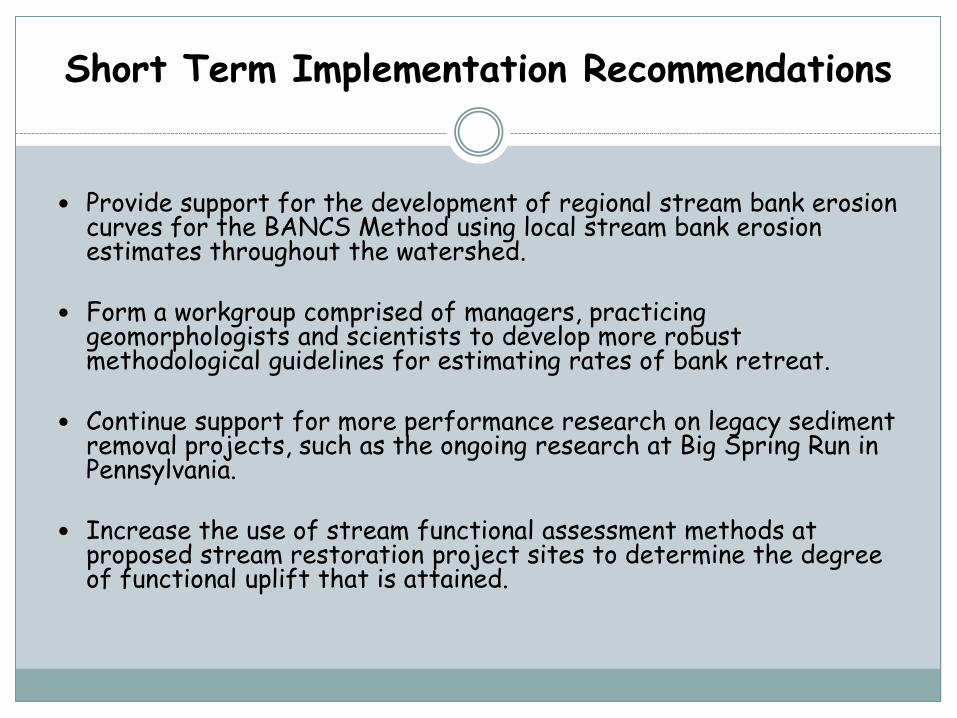
Short Term Implementation Recommendations
Provide support for the development of regional stream bank erosion curves for the BANCS Method using local stream bank erosion estimates throughout the watershed.
Form a workgroup comprised of managers, practicing
geomorphologists and scientists to develop more robust methodological guidelines for estimating rates of bank retreat.
Continue support for more performance research on legacy sediment
removal projects, such as the ongoing research at Big Spring Run in Pennsylvania.
Increase the use of stream functional assessment methods at
proposed stream restoration project sites to determine the degree of functional uplift that is attained.
Short Term Implementation Recommendations
Establish an ongoing stream restoration monitoring consortium and data clearinghouse within the CBPO to share project data, train the practitioner and permitting community, and provide ongoing technical support.
Coordinate with state and federal wetland permitting authorities
to ensure that stream restoration projects used for credit in the Bay TMDL are consistently applied and meet or exceed permitting requirements established to protect waters of the US.
Test the protocols’ ability to adequately estimate load reductions
in more coastal plain, ridge and valley, and Appalachian plateau conditions, and non-urban stream restoration projects.
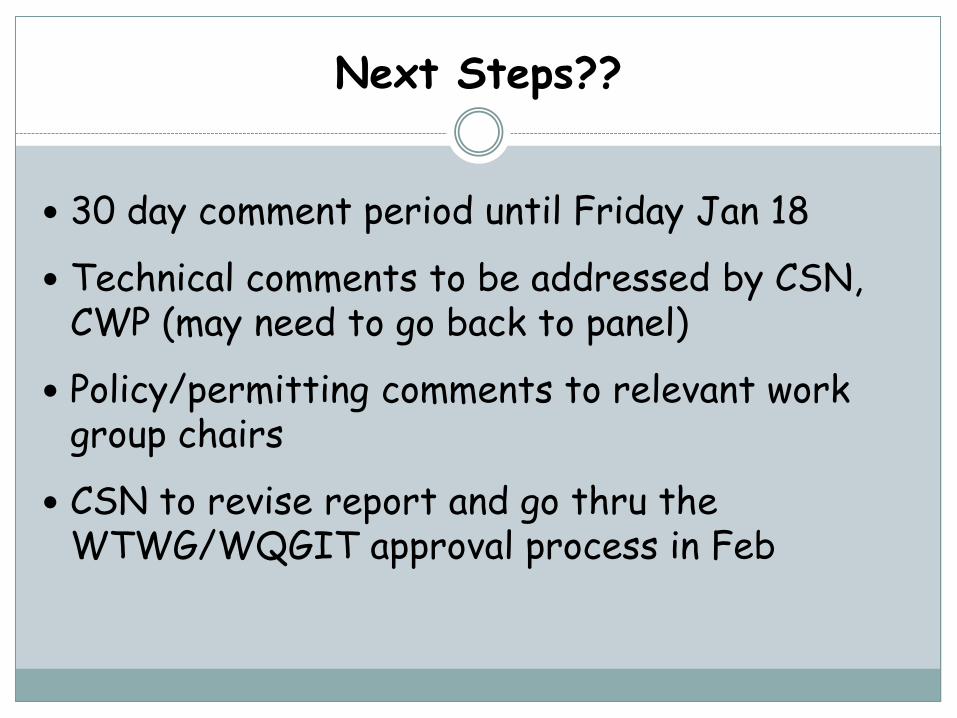
Next Steps??
30 day comment period until Friday Jan 18
Technical comments to be addressed by CSN, CWP (may need to go back to panel)
Policy/permitting comments to relevant work group chairs
CSN to revise report and go thru the WTWG/WQGIT approval process in Feb