1 Recommendations of the Expert Panel to Define Removal Rates for Urban Stormwater Retrofit Projects Ray Bahr, Ted Brown, LJ Hansen, Joe Kelly, Jason Papacosma, Virginia Snead, Bill Stack, Rebecca Stack and Steve Stewart Accepted by Urban Stormwater Work Group: April 30, 2012 Revised based on Watershed Technical Work Group feedback: May 29, 2012 Resubmitted to Watershed Technical Work Group: July 15, 2012 Conditionally Approved by Watershed Technical Work Group: August 1, 2012 Conditionally Approved by Water Quality Goal Implementation Team: August 13, 2012 Resubmitted to WQGIT: September 28, 2012 Final Approval by WQGIT: October 9 2012 Prepared by: Tom Schueler and Cecilia Lane Chesapeake Stormwater Network
Transcript
1
Recommendations of the Expert Panel to Define Removal Rates for Urban Stormwater Retrofit
Projects
Ray Bahr, Ted Brown, LJ Hansen, Joe Kelly, Jason Papacosma, Virginia Snead, Bill Stack, Rebecca Stack and Steve Stewart
Accepted by Urban Stormwater Work Group: April 30, 2012 Revised based on Watershed Technical Work Group feedback: May 29, 2012
Resubmitted to Watershed Technical Work Group: July 15, 2012 Conditionally Approved by Watershed Technical Work Group: August 1, 2012
Conditionally Approved by Water Quality Goal Implementation Team: August 13, 2012 Resubmitted to WQGIT: September 28, 2012
Final Approval by WQGIT: October 9 2012
Prepared by: Tom Schueler and Cecilia Lane
Chesapeake Stormwater Network
2
Table of Contents
Page
Summary of Recommendations 3 Section 1. The Expert Panel and its Charge 4 Section 2. Background on Stormwater Retrofits in the Bay Watershed 6 Section 3. Retrofit Definitions and Qualifying Conditions 8 Section 4. Protocol for Defining Removal Rates for Individual
Retrofit Projects 12 Section 5. Examples 19 Section 6. Accountability Procedures 23 Appendix A Review of BMP Performance Monitoring Studies 26 Appendix B Derivation of the Retrofit Removal Adjustor Curves 32 Appendix C Panel Meeting Minutes 40 Appendix D Conformity with BMP Review Protocol 58 References 60 List of common acronyms used throughout the text: BMP Best Management Practices CAST Chesapeake Assessment Scenario Tool CBP Chesapeake Bay Program CBWM Chesapeake Bay Watershed Model GIS Geographic Information Systems GPS Global Positioning System ICPRB Interstate Commission on the Potomac River Basin LID Low Impact Development MS4 Municipal Separate Storm Sewer System RR Runoff Reduction RT VM Reporting, Tracking, Verification and Monitoring ST Stormwater Treatment TMDL Total Maximum Daily Load TN Total Nitrogen TP Total Phosphorus TSS Total Suspended Solids WIP Watershed Implementation Plan WQGIT Water Quality Group Implementation Team WTM Watershed Treatment Model Note: text in blue denotes additional language added by Watershed
Technical Work Group or Water Quality Goal Implementation Team
3
Summary of Panel Recommendations
Over the last two decades, the Chesapeake Bay states have pioneered new techniques for finding, designing and delivering retrofits to remove pollutants, improve stream health and maintain natural hydrology in developed watersheds. Several important regulatory drivers are likely to increase the amount of future stormwater retrofit implementation across the Chesapeake Bay watershed. Some communities need to install retrofits to meet pollutant reduction targets under recently issued municipal stormwater permits or meet local TMDLs. In addition, each of the seven Bay states are considering greater use of urban stormwater retrofits as part of an overall strategy to meet nutrient and sediment load reduction targets for existing urban development under the Chesapeake Bay TMDL. Stormwater retrofits are a diverse group of projects that provide nutrient and sediment reduction on existing development that is currently untreated by any BMP or is inadequately treated by an existing BMP. The Panel classified retrofits into two broad project categories -- new retrofit facilities and retrofits of existing BMPs. These two categories encompass a broad range of potential local retrofit options and applications including new constructed wetlands, green streets or rain gardens, as well as conversion, enhancements or restoration of older BMPs to boost their performance. Given the diversity of possible retrofit applications, the Panel decided that assigning a single universal removal rate was not practical or scientifically defensible. Every retrofit is unique, depending on the drainage area it treats, the treatment mechanism employed, its volume or size and the antecedent degree of stormwater treatment, if any. Instead, the Panel elected to develop a protocol whereby the removal rate for each individual retrofit project is determined based on the amount of runoff it treats and the degree of runoff reduction it provides. The Panel conducted an extensive review of recent BMP performance research and developed a series of retrofit removal adjustor curves to define sediment, nitrogen and phosphorus removal rates. The Panel then developed specific calculation methods tailored for different retrofit categories. To assist users, the Panel has included numerous design examples to illustrate how retrofit removal rates are calculated. The Panel recommended simple retrofit reporting criteria to reduce the administrative burden on local and state agencies. The Panel also stressed that verification of retrofit installation and subsequent performance is critical to ensure that pollutant reductions are actually achieved and maintained across the watershed. To this end, the Panel recommends that the retrofit removal rate be limited to 10 years, although it can be renewed based on a field inspection that verifies the retrofit still exists, is adequately maintained and operating as designed. To prevent double counting, removal rates cannot be granted if the retrofit project is built to offset, compensate or otherwise mitigate for a lack of compliance with new development stormwater performance standards elsewhere in the jurisdiction.
4
Section 1 The Expert Panel and its Charge
EXPERT BMP REVIEW PANEL Stormwater Retrofits Panelist Affiliation Ray Bahr Maryland Department of the Environment Steve Stewart Baltimore County Ted Brown Biohabitats, Inc. LJ Hansen City of Suffolk, VA Jason Papacosma Arlington, VA Bill Stack Center for Watershed Protection Rebecca Stack District Department of the Environment Joe Kelly Pennsylvania Department of Environmental Protection
Virginia Snead Virginia Department of Conservation and Recreation
Jeff Sweeney U.S. Environmental Protection Agency, Chesapeake Bay Program Office Tom Schueler Chesapeake Stormwater Network (facilitator) The Panel would like to acknowledge the following additional people for their contribution: Norm Goulet, Chair Urban Stormwater Workgroup Lucinda Power, U.S. Environmental Protection Agency, Chesapeake Bay Program Office Chris Brosch formerly of University of Maryland and the Chesapeake Bay Program Office modeling team
The charge of the Panel was to review all of the available science on the pollutant removal performance and runoff reduction capability of BMPs that can be used to derive methods or protocols to derive nutrient and sediment removal rates for individual retrofits. Stormwater retrofits are a diverse group of projects that provide nutrient and sediment reduction on existing development that is currently untreated by any BMP or is inadequately treated by an existing BMP. Removal rates will need to be inferred from other known BMP pollutant removal and runoff reduction data. Every retrofit is unique, depending on the drainage area treated, BMP treatment mechanisms, volume or sizing and the antecedent degree of stormwater treatment, if any. Stormwater retrofits can be classified into two broad project categories, as shown below:
a. New retrofit facilities b. BMP conversions, enhancements, or restoration
The Panel was specifically requested to:
Provide a specific definition for each class of retrofits and the qualifying conditions under which a locality can receive a nutrient/sediment removal rate.
5
Assess whether the retrofit class can be addressed by using existing CBP-approved BMP removal rates, or whether new methods or protocols need to be developed to define improved rates.
Evaluate which load estimation methods are best suited to characterize the baseline pre-retrofit for the drainage area to each class of retrofit.
Define the proper units that local governments will report retrofit implementation to the state to incorporate into the Watershed Model.
Beyond this specific charge, the Panel was asked to:
Determine whether to recommend if an interim BMP rate should be established for one or more classes of retrofits prior to the conclusion of the Panel for WIP planning purposes.
Recommend procedures for reporting, tracking and verifying the recommended retrofit removal rates. The Panel also will look at the potential to develop regional monitoring consortium to devise strategies for future collaborative monitoring to better define the performance of various retrofit projects.
Critically analyze any unintended consequence associated with the removal rates and any potential for double or over-counting of the load reduction achieved.
While conducting its review, the Panel followed the procedures and process outlined in the WQGIT BMP review protocol (WQGIT, 2010). The process begins with BMP expert panels that evaluate existing research and make initial recommendations on removal rates. These, in turn, are reviewed by the Urban Stormwater Workgroup, and other Chesapeake Bay Program (CBP) management committees, to ensure they are accurate and consistent with the Chesapeake Bay Watershed Model (CBWM) framework. Appendix C documents the process by which the expert panel reached consensus, in the form of a series of five meeting minutes that summarize their deliberations. Appendix D documents how the Panel satisfied the requirements of the BMP review panel protocol.
6
Section 2 Background on Retrofitting in the Bay
Over the last two decades, communities across the Chesapeake Bay have pioneered new techniques for finding, designing and delivering retrofits to remove pollutants, improve stream health and maintain natural hydrology in developed watersheds (Schueler, 2007). Several important regulatory drivers are likely to increase the amount of future stormwater retrofit implementation across the Chesapeake Bay watershed. For example, some communities need to install retrofits to meet pollutant reduction targets under recently issued municipal stormwater permits. Other communities are employing retrofits to control pollutants to meet local TMDLs. Each of the seven Bay states are considering greater use of urban stormwater retrofits as part of an overall strategy to remove nutrients and sediment loads, to meet reduction targets for existing urban development under the Chesapeake Bay TMDL. This section provides highlights about these retrofit strategies, which differ from state to state. More detail on individual state retrofitting strategies can be found in the stormwater sector section of their Phase 1 and Phase 2 Watershed Implementation Plans, the links to which can be found in Table 1. PA DEP indicated that most of the retrofit activity in the Pennsylvania portion of the watershed to this point has involved various demonstration projects, many of which were funded under the Growing Greener program. The scope of retrofit activity will expand in the coming years as communities implement their new PAG-13 MS4 permits which require localities to develop strategies in the form of a local Chesapeake Bay Pollutant Reduction Plan by 2013. VA DCR indicated that most of the retrofit activity in the Commonwealth included demonstration projects under state grants and revolving funds, although some suburban counties have also supported strong retrofit programs employing their own capital budgets. VA DCR intends to issue new Phase 1 MS4 permits during 2012 that will require as much as 40% pollutant reduction for existing development over a 15 year period. The pollutant reductions from existing development may be achieved by a variety of urban restoration practices, including stormwater retrofits. During the first permit cycle, communities are encouraged to conduct local watershed assessments to identify the most cost effective combinations of retrofits and other restoration practices. MDE noted that Maryland has had a long retrofitting history. For more than a decade, Phase 1 MS4 communities have needed to treat 10% of their impervious cover in each five year permit cycle. Most communities have elected to meet that target through stormwater retrofits. Over the years, MDE has offered several grant programs to defray local retrofit project costs, but most communities have relied on their local capital budgets to finance the majority of their retrofits. MDE intends to issue new Phase 1 permits during 2012 that will expand the retrofit requirement to as much as 20% of untreated impervious cover during each permit cycle, and may also institute numerical retrofitting requirements for Phase 2 MS4 permits.
7
The District of Columbia has also had a long history of retrofitting, particularly in the Anacostia watershed. The focus of retrofitting in DC has evolved over the years to reflect the challenges and opportunities within their highly urban watersheds. DDOE currently relies on several residential and business incentive programs to build on-site LID retrofits, such as bioretention, rain barrels, green roofs or permeable pavers. The District is also implementing an extensive green street retrofit program on municipal streets. DDOE tracks these retrofits over time using a GIS tracking tool to record the aggregate acreage treated, and generally assumes a five year removal rate duration for on-site retrofits, which can be renewed based on inspection. While Delaware has been involved in numerous retrofits over the years, they are not relying heavily on them in the small portion of their state that actually drains to the Chesapeake Bay. This part of the watershed area is primarily rural, and most of their urban restoration activity will involve septic system upgrades rather than retrofitting. Similarly, the other upstream states (West Virginia and New York) are not expecting a great deal of stormwater retrofit activity in the coming years, and are focusing on other pollutant source sectors (e.g., agricultural, wastewater, abandoned mines) to achieve the bulk of their pollutant reductions. Both states, however, are expanding stormwater treatment requirements on new and redevelopment projects to prevent increased urban loading. Stormwater retrofits have been uncommon at federal facilities until quite recently. The President's Executive Order on the Chesapeake Bay directed federal agencies to lead by example and demonstrate more pollution prevention and stormwater retrofits at the many federal properties in the watershed. Numerous federal agencies are now conducting retrofit and site benchmarking investigations at their facilities and it is likely that much more federal retrofit implementation will occur in the coming years. Table 1 Key Web links for State and Federal Bay TMDL and WIP Guidance1
EPA http://www.epa.gov/chesapeakebaytmdl/
DC http://ddoe.dc.gov/service/total-maximum-daily-load-tmdl-chesapeake-bay
DE http://www.dnrec.delaware.gov/wr/Information/Pages/Chesapeake_WIP.aspx
Section 3 Retrofit Definitions and Qualifying Conditions
Definition: Stormwater retrofits are a diverse group of projects that provide nutrient and sediment reduction on existing development that is currently untreated by any BMP or is inadequately treated by an existing BMP. Stormwater retrofits can be classified into two broad project categories, as shown below:
1. New retrofit facilities 2. Existing BMP retrofits
1. New retrofit facilities: This category includes new retrofit projects that create storage to reduce nutrients from existing developed land that is not currently receiving any stormwater treatment. Common examples of new retrofit facilities include creating new storage:
(a) Near existing stormwater outfalls (b) Within the existing stormwater conveyance system (c) Adjacent to large parking lots (d) Green street retrofits (e) On-site LID retrofits
With the exception of (e), many new retrofit facilities are typically located on public land, and utilize a range of stormwater treatment and runoff reduction mechanisms. Due to site constraints, new retrofits may not always meet past or future performance standards for BMP sizing that applies to new development. 2. Existing BMP retrofits: are a fairly common approach where an existing BMP is either:
(a) Converted into a different BMP that employs more effective treatment mechanism(s).
(b) Enhanced by increasing its treatment volume and/or increasing its hydraulic retention time.
(c) Restored to renew its performance through major sediment cleanouts, vegetative harvesting, filter media upgrades, or full-scale replacement.
Most BMP conversions involve retrofits of older existing stormwater ponds, such as converting a dry pond into a constructed wetland or wet pond, although many other types of BMP conversions are also possible. BMP conversions can be located within existing BMPs located on public land, or at privately-owned BMPs. BMP conversions can utilize a wide range of stormwater treatment mechanisms. BMP enhancements utilize the original stormwater treatment mechanism, but improve removal by increasing storage volume or hydraulic residence time. An example of a BMP enhancement is an upgrade to an older stormwater pond built under less
9
stringent sizing and design standards. These upgrades may increase treatment volume, prevent short circuiting, extend flow path or hydraulic residence time, or add internal design features to enhance overall nutrient and/or sediment reduction. BMP enhancements typically occur within existing BMPs located on public land, or at privately-owned BMPs. BMP restoration applies to major maintenance upgrades to existing BMPs that have either failed or lost their original stormwater treatment capacity. The method to calculate the removal rate increase depends on whether or not the BMP has previously been reported to EPA. If the BMP has been previously reported, a lower removal rate is calculated using the curves that reflects the existing level of treatment, and this value must be reported for at least one progress reporting cycle. After the qualifying BMP restoration is completed, the curves are used to derive a higher rate for the increased treatment volume in subsequent years. If the BMP was not previously reported to EPA, it is considered a new retrofit, and the curves are used to define the removal rate based on the total treatment volume provided. Only four types of BMP restoration are allowed:
(a) Major Sediment Cleanouts – Removal of sediment, muck and debris that is
equal to or greater than 1/10 the volume of the facility. For wet ponds, the volume of the facility would be where the normal water elevation or invert of the outfall pipe is. For dry ponds or enhanced extended detention facilities, the volume would include the volume of any fore bays, to their overflows, and ½ the height of the dewatering structure.
(b) Vegetative Harvesting – Removal of excessive, non-planned vegetative growth
with off-site sequestration or composting. Appropriate plant species shall be re-planted and re-established when the vegetative harvesting causes an erosive or denuded condition.
(c) Filter Media Enhancements – Removal and sequestration of contaminated
material and replacement with a media that is superior to those originally proposed in the design specification (i.e., replacing sand with a sand/organic or sand/zeolite mixture).
(d) Complete BMP Rehabilitation – Complete rehabilitation of a failed BMP to
restore its performance (e.g., converting a failed infiltration basin into a constructed wetland). This restoration option only applies to older BMPs that were not previously reported to EPA.
10
Figure 1. Examples of New Retrofit Facilities and their Potential Applications
New retrofit facilities provide stormwater treatment in places that treatment did not previously occur. There are many opportunities for new retrofit facilities in the urban landscape. Some common examples are listed below.
Near Existing Stormwater Outfalls Within the Existing Stormwater Conveyance
System
Adjacent to Large Parking Lots Green Street Retrofits
On-Site LID Retrofits
11
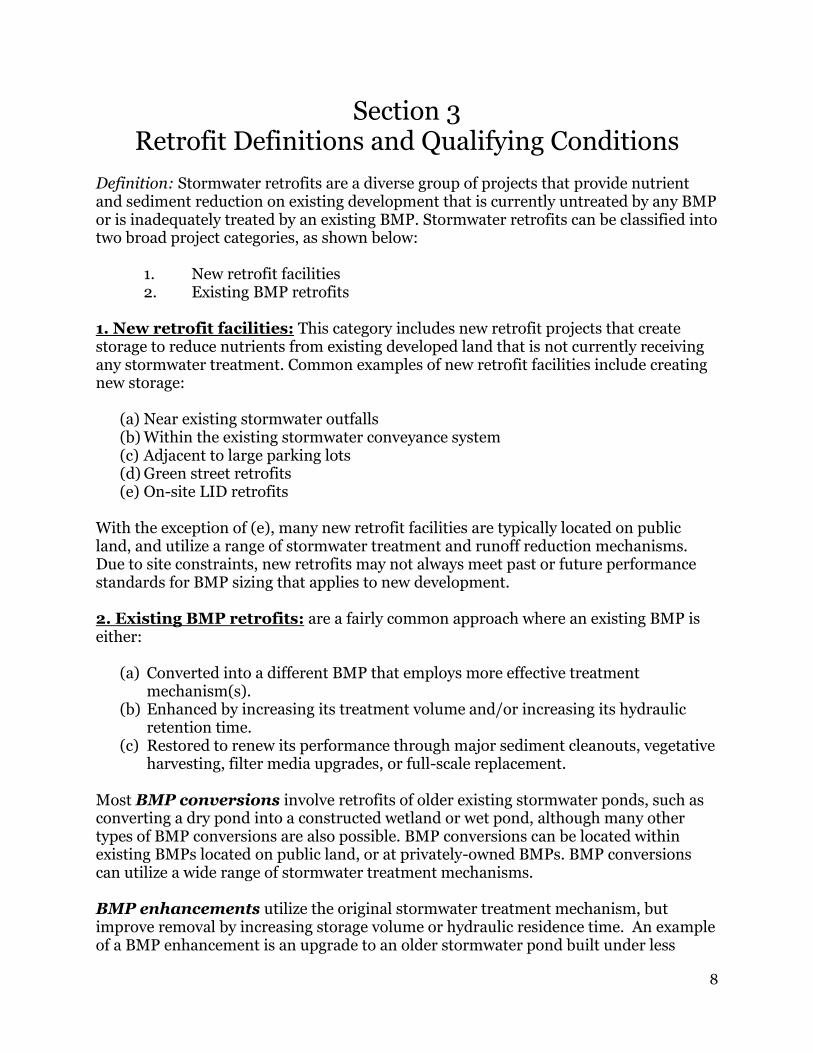
Figure 2. Examples of Existing BMP Retrofit Facilities and their Potential Applications
BMP Conversion: from a Dry Pond (left) to a Constructed Wetland (right) to allow for more effective treatment of stormwater.
BMP Enhancement: by adding a berm you can increase the flow path thereby extending the hydraulic retention time within the practice leading to better treatment.
BMP Restoration: increasing performance of a BMP by conducting major repairs or upgrades. In this example, an underperforming pond is dredged for sediment thereby restoring it to its
full performance capacity.
Important Notes:
No pollutant removal rates are given for routine maintenance of existing stormwater practices.
Routine maintenance is essential to ensure the pollutant removal performance of any stormwater practice.
12
The WTWG added a further qualifying condition that the proposed BMP restoration activities must be significant enough to achieve the intent of the original water quality design criteria in the era in which it was built (e.g., sediment cleanouts would, at a minimum, need to recover the original water quality storage capacity under the prevailing design standards at the time the BMP was constructed).
Individual state stormwater agencies are encouraged to develop more detailed guidance on the qualifying conditions for acceptable BMP restoration.
Applying more stringent stormwater requirements at redevelopment sites that had not previously treated stormwater runoff is functionally equivalent to a new retrofit facility. However, the Performance Standards Expert Panel recommended a protocol to compute load reductions at redevelopment projects.
13
Section 4 Protocol for Determining Retrofit Removal Rates
Basic Approach Given the diversity of possible retrofit applications, the Panel decided that assigning a single universal removal rate was not practical or scientifically defensible. Instead, the Panel opted to develop a protocol whereby the removal rate for each individual retrofit project is determined based on the amount of runoff it treats and the degree of runoff reduction it provides. This approach is generally supported by a review of the recent pollutant removal and runoff reduction research, which is summarized in Appendix A. The Panel initially developed a retrofit removal rate adjustor table that provides increasing sediment and nutrient removal rates for retrofits that treat more runoff and/or employ runoff reduction practices. For ease of use, the adjustor table was converted into a series of three curves, which are portrayed in Figures 3 to 5. Readers that wish to see the technical derivation for the adjustor curves should consult Appendix B. In order to determine the runoff volume treated by a retrofit practice, the designer must first estimate the Runoff Storage volume (RS) in acre-feet. This, along with the Impervious Area (IA) in acres, is used in the standard retrofit equation to determine the amount of runoff volume in inches treated at the site:
Where: RS = Runoff Storage Volume (acre-feet)
IA = Impervious Area (acres)
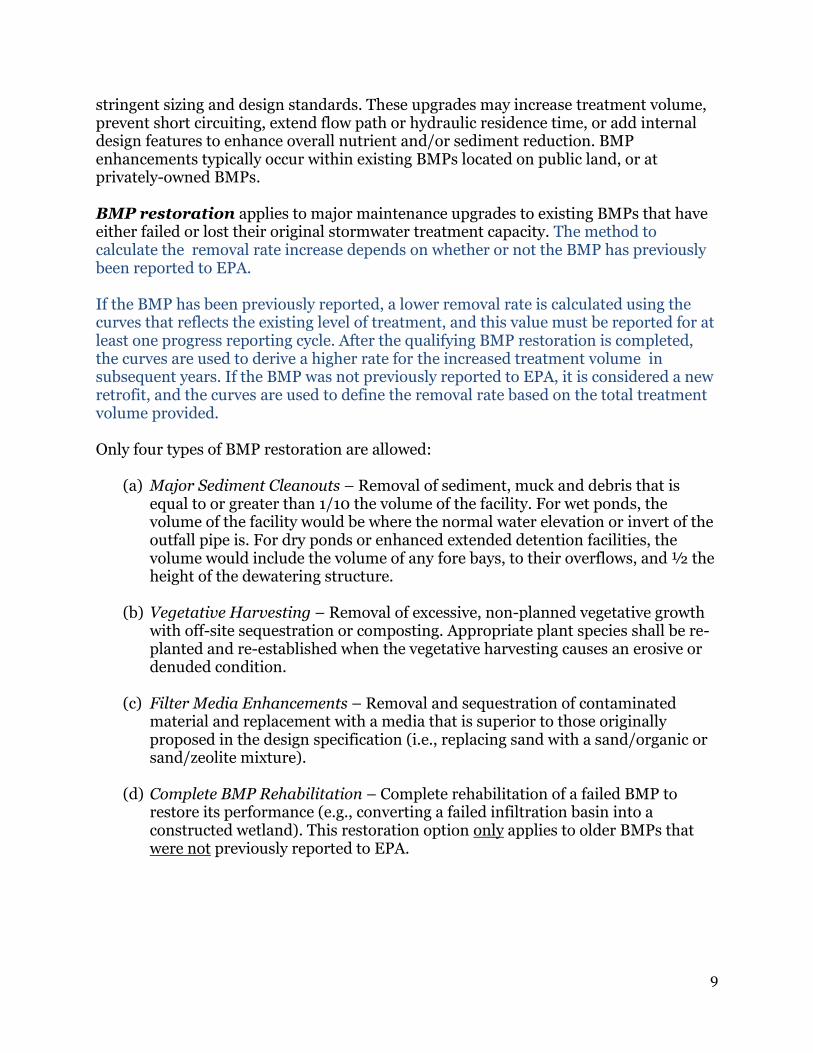
Once the amount of runoff captured by the practice is determined, the retrofit removal adjustor curves make it easy to determine pollutant removal rates for individual stormwater retrofits. The designer first defines the runoff depth treated by the project (on the x-axis), and then determines whether the project is classified as having runoff reduction (RR) or stormwater treatment (ST) capability (from Table 2). The designer then goes upward to intersect with the appropriate curve, and moves to the left to find the corresponding removal rate on the y-axis (see example in Figure 3).
14
Figure 3. Retrofit Removal Adjustor Curve for Total Phosphorus
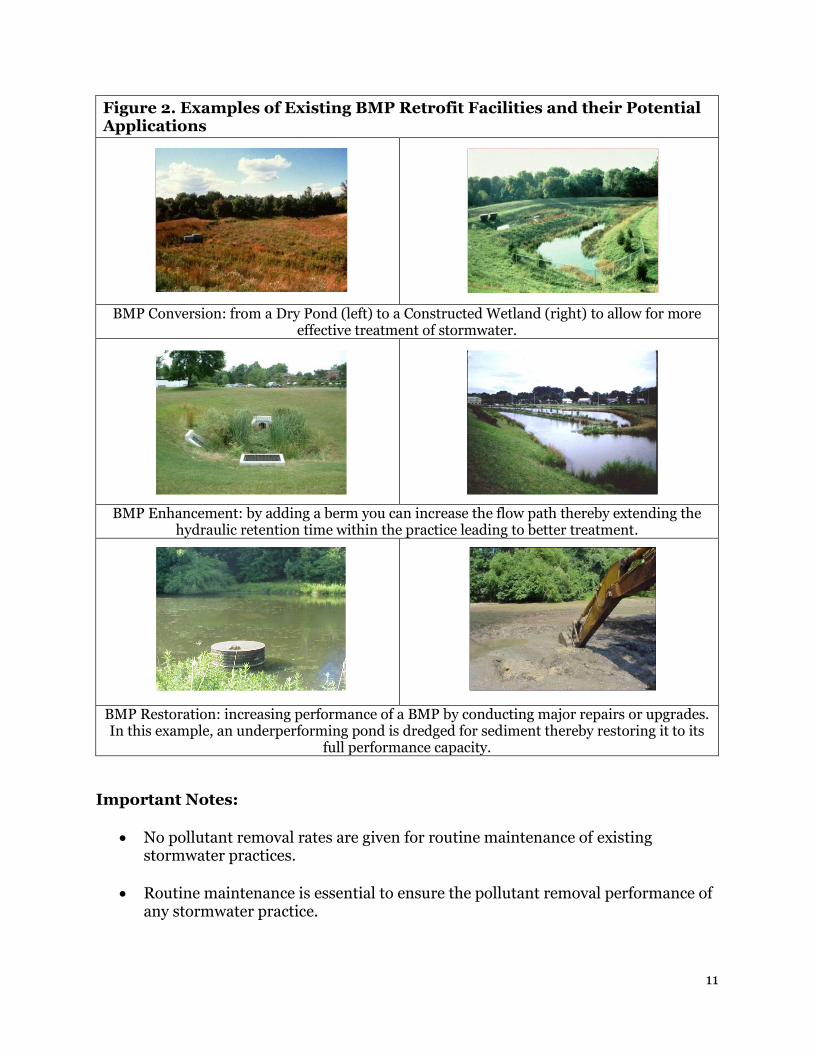
Figure 4. Retrofit Removal Adjustor Curve for Total Nitrogen
15
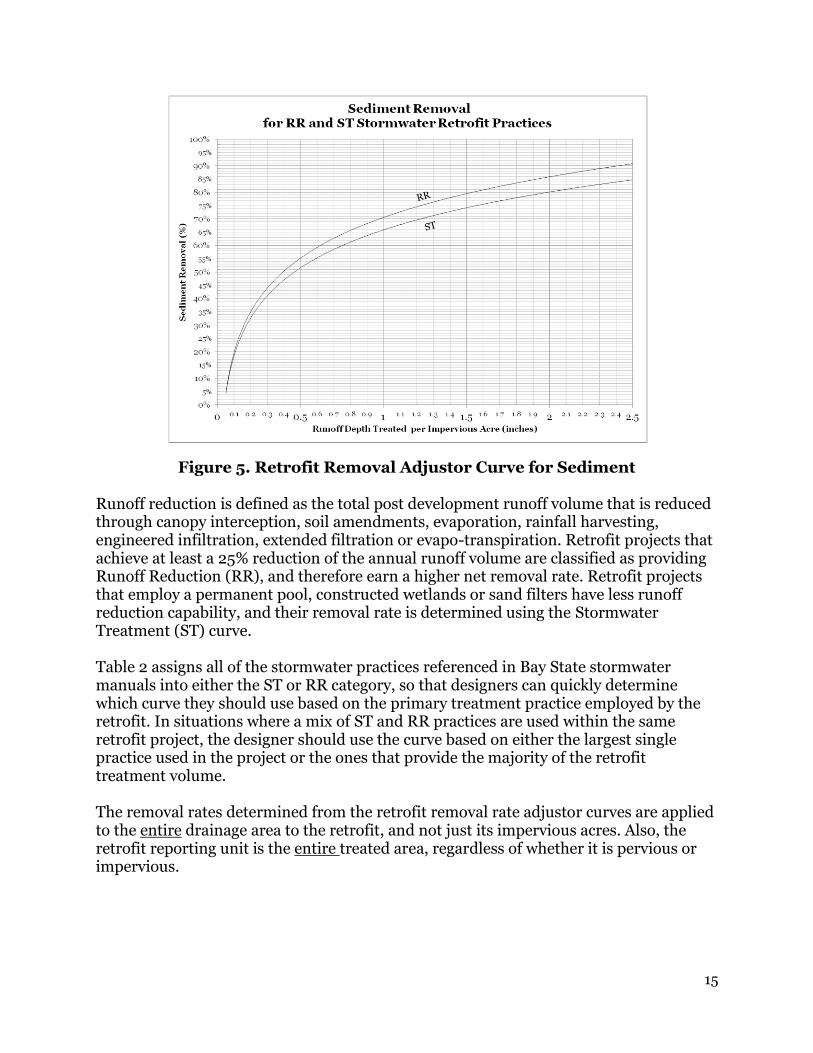
Figure 5. Retrofit Removal Adjustor Curve for Sediment Runoff reduction is defined as the total post development runoff volume that is reduced through canopy interception, soil amendments, evaporation, rainfall harvesting, engineered infiltration, extended filtration or evapo-transpiration. Retrofit projects that achieve at least a 25% reduction of the annual runoff volume are classified as providing Runoff Reduction (RR), and therefore earn a higher net removal rate. Retrofit projects that employ a permanent pool, constructed wetlands or sand filters have less runoff reduction capability, and their removal rate is determined using the Stormwater Treatment (ST) curve. Table 2 assigns all of the stormwater practices referenced in Bay State stormwater manuals into either the ST or RR category, so that designers can quickly determine which curve they should use based on the primary treatment practice employed by the retrofit. In situations where a mix of ST and RR practices are used within the same retrofit project, the designer should use the curve based on either the largest single practice used in the project or the ones that provide the majority of the retrofit treatment volume. The removal rates determined from the retrofit removal rate adjustor curves are applied to the entire drainage area to the retrofit, and not just its impervious acres. Also, the retrofit reporting unit is the entire treated area, regardless of whether it is pervious or impervious.
16
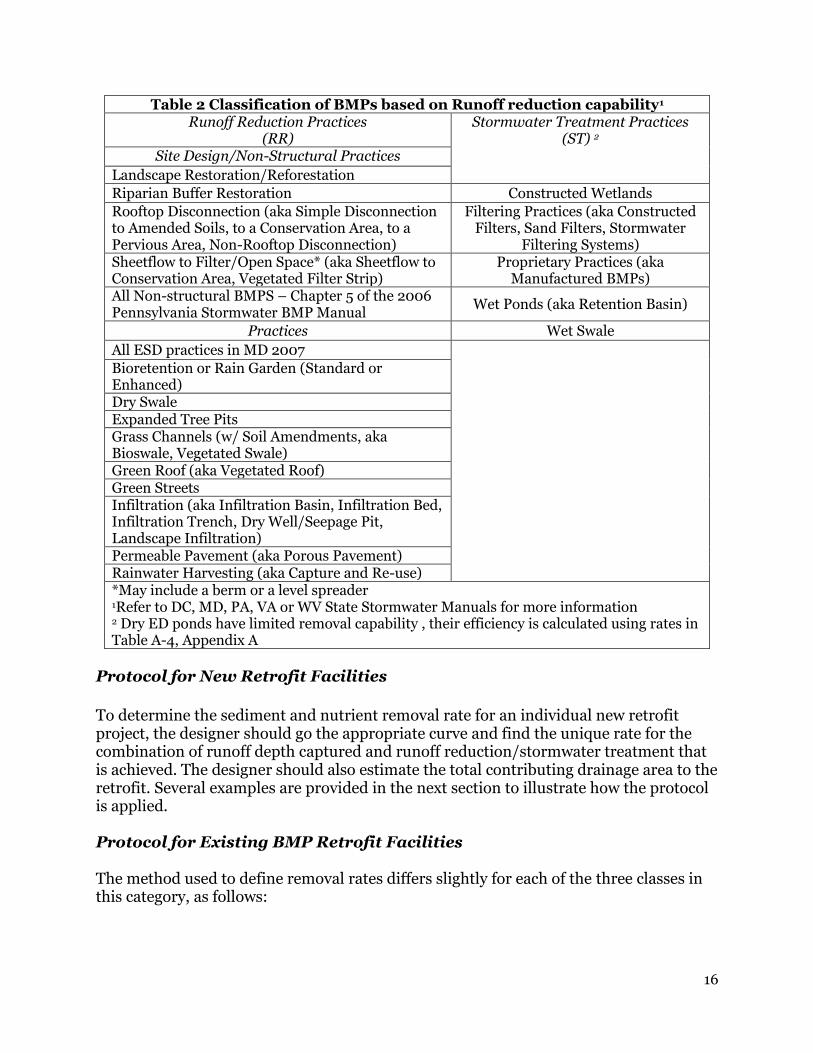
Table 2 Classification of BMPs based on Runoff reduction capability1
Runoff Reduction Practices (RR)
Stormwater Treatment Practices (ST) 2
Site Design/Non-Structural Practices
Landscape Restoration/Reforestation
Riparian Buffer Restoration Constructed Wetlands
Rooftop Disconnection (aka Simple Disconnection to Amended Soils, to a Conservation Area, to a Pervious Area, Non-Rooftop Disconnection)
Filtering Systems) Sheetflow to Filter/Open Space* (aka Sheetflow to Conservation Area, Vegetated Filter Strip)
Proprietary Practices (aka Manufactured BMPs)
All Non-structural BMPS – Chapter 5 of the 2006 Pennsylvania Stormwater BMP Manual
Wet Ponds (aka Retention Basin)
Practices Wet Swale
All ESD practices in MD 2007
Bioretention or Rain Garden (Standard or Enhanced) Dry Swale Expanded Tree Pits Grass Channels (w/ Soil Amendments, aka Bioswale, Vegetated Swale) Green Roof (aka Vegetated Roof) Green Streets Infiltration (aka Infiltration Basin, Infiltration Bed, Infiltration Trench, Dry Well/Seepage Pit, Landscape Infiltration) Permeable Pavement (aka Porous Pavement) Rainwater Harvesting (aka Capture and Re-use) *May include a berm or a level spreader 1Refer to DC, MD, PA, VA or WV State Stormwater Manuals for more information 2 Dry ED ponds have limited removal capability , their efficiency is calculated using rates in Table A-4, Appendix A
Protocol for New Retrofit Facilities
To determine the sediment and nutrient removal rate for an individual new retrofit project, the designer should go the appropriate curve and find the unique rate for the combination of runoff depth captured and runoff reduction/stormwater treatment that is achieved. The designer should also estimate the total contributing drainage area to the retrofit. Several examples are provided in the next section to illustrate how the protocol is applied. Protocol for Existing BMP Retrofit Facilities The method used to define removal rates differs slightly for each of the three classes in this category, as follows:
17
BMP Conversion: The specific method for defining the removal rate depends on the type and age of the BMP being converted:
If the BMP being converted is a dry detention pond or flood control structure that currently is providing no effective water quality treatment, then the existing BMP will have a zero removal rate. A higher CBP-approved BMP rate that reflects the improved stormwater treatment mechanism associated with the conversion can be taken directly from Table A-5 of Appendix A (i.e., dry ED, wet pond, constructed wetland or bioretention)
If the BMP being converted involves a significant increase in runoff capture volume and/or an increase in runoff reduction, than an incremental rate is used. The removal rate for the existing BMP should be determined from the adjustor curve. A higher removal for the converted BMP will reflect the higher degree of runoff treatment and/or runoff reduction associated with the retrofit, as determined from the retrofit removal adjustor curves (Figure 3 to 5). This method will generally be the most applicable to the majority of conversion retrofits.
In all cases, the designer should also estimate the total contributing drainage area to the retrofit. Examples are provided in the next section, that illustrate how both of these methods are applied to conversion retrofits. BMP Enhancement: The sediment and nutrient removal rates for individual BMP enhancement retrofits are also expressed as an incremental removal rate (enhanced BMP - existing BMP).
The rate for the existing BMP is defined based on its combination of runoff treatment and runoff reduction using the retrofit removal adjustor curves. Designers may reduce the actual amount of runoff treatment in the existing BMP that is not effective (e.g., treatment volume that is ineffective because of short-circuiting or other design problems that reduce the hydraulic retention time).
The enhanced BMP will have either a greater runoff treatment volume and/or achieve a better runoff reduction rate. Designers can determine the higher rate for the enhanced BMP using the retrofit removal adjustor curves.
The removal rate for the BMP enhancement is then defined as the difference between the enhanced rate and the existing rate. An example of how to apply this protocol for BMP enhancements is provided in the next section.
BMP Restoration: The removal rate for BMP restoration depends on whether the existing BMP has been previously reported to EPA.
18
If the BMP has not been previously reported, it is considered to be a new retrofit facility and the removal rate is determined by the retrofit removal adjustor curves for the drainage area contributing to the BMP.
If the BMP was previously reported to EPA, then the removal rate for a restored BMP is expressed as an incremental removal rate (restored BMP - existing BMP). The existing BMP removal rate is defined using the curves based on the original BMP sizing and design criteria. The restored BMP rate is defined using the retrofit removal rate adjustor curve for the runoff treatment volume "restored" (i.e., by sediment cleanouts, vegetative harvesting or practice rehabilitation) and/or shifting to RR runoff reduction (i.e., media replacement).
To prevent double counting, the removal rate credit is reported to EPA by the jurisdiction in a two step process. First, it must be reported at the degraded condition (lower removal rate) for at least one annual progress run. Second, the incremental rate improvement associated with the BMP restoration is then reported the next progress year.
Other Key Issues: What Data to Report
To be eligible for the removal rates in the model, localities need to check with their state stormwater agency on the specific data to report individual retrofit projects, and must meet the BMP reporting and tracking procedures established by their state. The Panel recommended that the following information be reported:
a. Retrofit class (i.e., new retrofit facility or existing BMP retrofit) b. GPS coordinates c. Year of installation (and expected rate duration) d. 12 digit watershed in which it is located e. Total drainage area and impervious cover area treated f. Runoff volume treated and identify “type” of BMP g. Projected sediment, nitrogen and phosphorus removal rates
Jurisdictions will also be responsible for other tracking and verification procedures as outlined in Section 6 of this memo. The Baseline Load Issue The protocol developed by the Panel does not require jurisdictions to define a pre-retrofit baseline load. The Panel acknowledges, however, that many jurisdictions may want to estimate pre-retrofit baseline loads when it comes to finding the most cost-effective combination of retrofit projects to pursue in their subwatershed retrofit investigations.
19
Analyzing Retrofit Options in the Context of CAST/MAST/VAST The Panel acknowledges that its retrofit assessment protocol does not fit easily within the context of assessment and scenario builder tools that have been recently developed to assist states and localities to evaluate BMP options to develop watershed implementation plans (i.e., each retrofit has a unique rate and consequent load reduction, while the CAST tools apply a universal rate for all retrofits). The CBPO modeling team has expressed a willingness to incorporate the adjustor curves into the CAST modeling framework in the next year or so. Until these refinements are made, the Panel felt that it was reasonable, for planning purposes, for each state to assign a single removal rate to characterize the performance of a generic type of retrofit to evaluate alternate BMP scenarios. As an example, a state might assume a generic stormwater retrofit that is a 50/50 blend of RR and ST practices and treat 1 inch of runoff from impervious area. This generic retrofit rate could be used in the context of CAST to compare load reductions for different levels of local drainage area treated by retrofits. As noted, each state would elect to develop its own scenarios to be consistent with their unique scenario assessment tools.
Section 5 Retrofit Examples
The following examples have been created in order to demonstrate the proper application of the retrofit removal adjustor curves for the purpose of determining the nutrient and sediment removal rates of retrofits. New Retrofit Facilities
Constructed Wetland. A Bay County has discovered an un-utilized parcel of
parkland where it is feasible to build a constructed wetland. The engineer has estimated that the retrofit storage in the constructed wetland is 1.67 acre-feet. The proposed retrofit will treat the runoff from a 50 acre residential neighborhood with 40% impervious cover. The engineer determines the number of inches that the retrofit will treat using the standard retrofit equation:
The constructed wetland retrofit will capture and treat 1.0 inch of rainfall. Table 2 informs that constructed wetlands are considered to be a ST practice.
20
By referring to Figures 3-5, we can see that this proposed retrofit will have the following pollutant removal rates:
TP TN TSS 52% 33% 66%
Green Street. A Bay City is considering a plan to construct green streets as part of
a revitalization project for the downtown commercial area. Their engineering consultant plans to employ permeable pavement, expanded tree pits and street bioretention to treat runoff and she estimates the runoff storage volume for the combined practices to be 0.27 acre-feet. Since the 4.3 acres of 100% impervious urban land that drain to the existing street have not provided stormwater management in the past, the new green street project is classified as a new retrofit. The engineer determines the number of inches that the retrofit will treat using standard retrofit equation:
Collectively, the new LID practices will treat 0.75 inches of runoff and fall under
the RR practice category. Based on this information, the City uses the retrofit removal adjustor curves (Figures 3 to 5) to determine the following removal rates for the green street retrofit project:
TP TN TSS 60% 51% 64%
On-Site LID Retrofits. A Bay Township creates an incentive program for
residential homeowners to install rain gardens on their property and would like to determine the pollutant removal rates associated with such a program. Each homeowner has an average roof size of 500 ft2 and if 100 homeowners participate in the program, treatment can occur for a combined drainage area of 1.15 acres, at 100% impervious. The runoff storage volume associated with the combined retrofits is estimated to be 0.05 acre-feet. The amount of runoff volume treated by the rain gardens is calculated using standard retrofit equation:
Each rain garden is assumed to treat 0.5 inches of rainfall and is classified as a
RR practice. The township engineer uses the curves to estimate the projected removal rates associated with the rain garden incentive program:
TP TN TSS 52% 44% 55%
In all three of the above examples, the information that needs to be reported is the retrofit removal rates and the total contributing drainage area to the practices.
21
Existing BMP Retrofits BMP Conversion. A dry pond was built in 1985 in Maryland which was designed
to provide flood control only. The designer is able to create new water quality storage using a combination of a forebay with a permanent pool, a submerged gravel wetland cell and a final bioretention polishing cell. As a result, the facility now provides a runoff storage volume of 1.3 acre-feet for its 65 acre urban drainage area that is 40% impervious. The amount of runoff volume treated by the converted BMP is calculated using the standard retrofit equation:
Because the project is a dry pond conversion, the designer evaluated both methods to assess pollutant removal rates. The designer rejected the use of existing CBP-approved rates because the conversion involved three different stormwater treatment mechanisms. Instead the designer opted to use the retrofit removal adjustor curves, since the retrofit conversion produced a large increase in runoff treatment volume and a modest increase in runoff reduction. The comparative removal rate projections are shown below:
BMP Enhancement. A dry extended detention pond was built in a Bay County in
1995 that served a 10 acre commercial property. The facility was originally designed to under older standards that only required that the “first flush” of stormwater runoff be treated. Analysis of drainage area characteristics indicated that the dry ED pond was sized to capture only 0.3 inches of runoff per impervious acre. In addition, field investigations showed that the pond had a major short-circuiting problem, such that half of its storage volume was hydraulically ineffective.
The Bay County engineer realized that this site was a good candidate for a BMP
enhancement retrofit, and modified the configuration of the pond to increase its hydraulic retention time, provide missing pretreatment and excavate several shallow wetland cells in the bottom of the pond to improve treatment.
Collectively, these design enhancements created an additional 0.3 inches of new
runoff treatment volume per impervious acre, for a total runoff of 0.6 inches. For BMP enhancement retrofits, the removal rate is defined as the incremental difference between the new removal rate and the original removal rate. The engineer analyzed the retrofit removal adjustor curves, and computed the net effect of the BMP design enhancements, as follows:
BMP Restoration. A wet pond was installed in Bay City in 1980, which captured 0.5 inches of runoff from the impervious cover of its contributing watershed. Bay City had previously reported the pond to Bay State. Over time, however, the storage capacity of the wet pond was seriously diminished due to sedimentation and growth of invasive plants. The maintenance crew noted that 60% of the pond's storage capacity had been lost, resulting in an actual capacity of a mere 0.2 inches of runoff treatment.
Bay City DPW conducted a major dredging effort to clean out the sediments and replanted the pond with native species. As a result of the pond restoration, 0.3 inches of storage were recovered, increasing the total storage in the pond to its original design volume of 0.5 inches of runoff depth captured. Bay County employed the retrofit removal adjustor curves for ST practices to determine the incremental pollutant removal rates associated with the pond restoration, as follows:
Consequently, Bay City would report the existing rate to the state in the first year, and then submit the additional incremental rate for the restoration in subsequent years after the BMP is restored.
BMP Restoration (Non-Reported BMP). A sand filter was built in Bay City in
1998 and was sized to capture 0.5 inches of runoff from a municipal parking garage. Due to poor design, the sand filter had clogged over time and is no longer functioning as a BMP. Because the sand filter had never been reported to the state, it was eligible to get the full BMP pollutant reduction rate. Bay City DPW upgraded the original sand filter to improve its retention time and replace the old media with a more effective bioretention mix. The removal rates are calculated from the retrofit removal adjustor curves:
TP TN TSS 52% 44% 55%
Non Eligible Restoration Example. Bay County inspectors concluded that it was
time to clean out sediments trapped within the pre-treatment cell of a large bioretention facility. The facility was originally sized to capture 1.0 inch of runoff volume and achieves a 66% TP removal rate. This routine maintenance operation recovered 0.05 inches of runoff volume capacity in the bioretention area. Because this cleanout did not
23
meet the 10% recovery threshold, it does not qualify for BMP restoration and no additional removal rate credit is given.
24
Section 6 Accountability Procedures
The Panel concurs with the conclusion of the National Research Council (NRC, 2011) that verification of BMP installation and subsequent performance is a critical element to ensure that pollutant reductions are actually achieved and sustained across the watershed. The Panel also concurred with the broad principles for urban BMP reporting, tracking and verification contained in the draft memo to the Urban Stormwater Workgroup. The Panel recommends that CBP adopt the following reporting, tracking and verification protocols for stormwater retrofit projects:
1. Duration of Retrofit Removal Rate. The maximum duration for the removal rate will be 10 years, although it can be renewed based on a field performance inspection that verifies the retrofit still exists, is adequately maintained and operating as designed. The duration of the removal rate will be 5 years for on-site retrofits installed on private property, and can only be renewed based on visual inspection that the on-site retrofit still exists.
2. No Double Counting. A removal rate cannot be granted if the retrofit project is
built to offset, compensate or otherwise mitigate for a lack of compliance with new development stormwater performance standards elsewhere in the jurisdiction. Instead, the removal rate can only be applied as an offset (i.e., the acres of new development that will now fully meet the state stormwater performance standard). The Panel also recommends more frequent inspection and verification process for any retrofit built for the purpose of stormwater mitigation, offsets, trading or banking, in order to assure the project(s) is meeting its nutrient or sediment reduction design objectives.
3. Initial Verification of Performance. Jurisdictions will need to provide a post-
construction certification that the urban retrofit was installed properly, meets or exceeds the design standards under its retrofit classification and is achieving its hydrologic function prior to submitting the retrofit removal rate to the state tracking database. This initial verification is provided either by the retrofit designer or a local inspector as a condition of retrofit acceptance, as part of the normal municipal retrofit design and review process. From a reporting standpoint, the MS4 community would simply indicate in its annual report whether or not it has retrofit review and inspection procedures in place and adequate staff to implement them.
4. Retrofit Reporting Units. Localities will submit documentation to the state
stormwater or TMDL agency to document the nutrient/sediment reduction claimed for each individual urban retrofit project that is actually installed. Localities should check with their state stormwater agency on the specific data to report for individual retrofit projects. The Panel recommends that the following reporting data be submitted:
25
a. Retrofit class b. GPS coordinates c. Year of installation (and expected duration) d. 12 digit watershed in which it is located e. Total drainage area and impervious cover area treated f. Runoff volume treated and identify “type” of BMP g. Projected sediment, nitrogen and phosphorus removal rates
5. Retrofit Recordkeeping. The agency that installs the retrofit should maintain a
more extensive project file for each urban retrofit project installed (i.e., construction drawings, as-built survey, digital photos, inspection records, and maintenance agreement, etc). The file should be maintained for the lifetime for which the retrofit removal rate will be claimed.
6. Ongoing Field Verification of BMP Performance. Inspectors need to look at
visual and other indicators every 10 years to ensure that individual retrofit projects are still capable of removing nutrients/sediments. If the field inspection indicates that a retrofit is not performing to its original design, the jurisdiction has up to one year to take corrective maintenance or rehabilitation actions to bring it back into compliance. If the facility is not fixed after one year, the pollutant reduction rate for the retrofit would be eliminated, and the jurisdiction would report this in its annual MS4 report. The retrofit removal rate can be renewed, however, if evidence is provided that corrective maintenance actions have restored retrofit performance.
Collaborative Monitoring of Retrofit Performance The Panel agreed on the continuing need to monitor the effectiveness of retrofits at both the project and watershed scale to provide greater certainty in the removal rate estimates. The Panel also noted the importance of monitoring both innovative and traditional retrofit techniques in varied applications, terrain and climatic conditions. The Panel indicated the best route to acquire such monitoring data was through retrofit monitoring programs undertaken as part of municipal MS4 stormwater permit programs. The Panel recommended that localities pool their scarce local MS4 monitoring resources together to create a monitoring consortium that could fund selected retrofit monitoring projects to be performed by monitoring experts (i.e., universities and qualified consulting firms). In the interim, the Panel recommended that any local retrofit monitoring be conducted under a standard quality assurance project plan (QAPP) developed under the auspices of the USWG to ensure the performance data is reliable and accurate. Since several communities may be interested retrofit monitoring, USWG might not have the capacity to review all of the designs. The Panel therefore recommended that the CBP retain a consultant with expertise in “applied” monitoring to develop basic QAPP guidelines and
26
make suggestions to monitoring plans. A possible model might be the 3-tiered QA certification process that increases in rigor with the increased need for data accuracy employed by the city of Suffolk and other Virginia communities (Details can be found at http://www.deq.virginia.gov/cmonitor/guidance.html). The consultant would also be charged with identifying synergies among research to avoid duplication of effort and also prioritize monitoring needs. The initial guidelines would be fairly generic cutting across retrofit types and would be flexible to account for local site conditions. Ultimately, the Panel recommended that a standard methodology be established for each type of retrofit practice as long as it allows for local site variability. The Panel also discussed the timeframe by which new retrofit monitoring data would be considered in adjusting future retrofit efficiencies, and recommended the Panel be reconvened at every two year WIP milestone, which fits in nicely with the “adaptive management” approach that is advocated by NRC (2011). One of the chief considerations should be whether the efficiency changes would be adjusted locally or applied globally across the Bay watershed.
Baldwin, A., T. Simpson and S. Weammert. 2003. Reports of urban BMP efficiencies. Prepared for EPA Chesapeake Bay Program. Urban Stormwater Workgroup. University of Maryland, College Park Brown, W. and T. Schueler. 1997. National Pollutant Removal Database for Stormwater BMPs. First Edition. Center for Watershed Protection. Ellicott City, MD. Caraco, D. 2010. The watershed treatment model: Version 3.0. U.S. Environmental Protection Agency, Region V. Center for Watershed Protection. Ellicott City, MD CWP. 2007. National Pollutant Removal Performance Database Version 3.0. Center for Watershed Protection, Ellicott City, MD. CWP and Chesapeake Stormwater Network (CSN). 2008. Technical Support for the Baywide Runoff Reduction Method. Baltimore, MD www.chesapeakestormwater.net Chesapeake Stormwater Network (CSN). 2011. Nutrient Accounting Methods to Document Local Stormwater Load Reductions in the Chesapeake Bay Watershed. Technical Bulletin No. 9. Baltimore, MD. Collins, K.A., Hunt, W.F., and Hathaway, J.M. 2008b. Nutrient and TSS removal comparison of four types of permeable pavement and standard asphalt in eastern North Carolina. Delaware Department of Natural Resources and Environmental Control (DNREC). Under Development. Stormwater Guidebook. Dover, DE. District Department of the Environment (DDOE). 2011. DRAFT Stormwater Guidebook. Washington DC. International Stormwater BMP Database (ISBD). 2010. International stormwater best management practice database pollutant category summary: nutrients. Prepared by Geosyntec Consultants and Wright Water Engineers. ISBD. 2011a. International stormwater best management practice database pollutant category summary: solids (TSS, Turbidity and TDS). Prepared by Geosyntec Consultants and Wright Water Engineers. IBSD. 2011b. International stormwater best management practice database: technical summary of volume reduction. Prepared by Geosyntec Consultants and Wright Water Engineers.
28
Jones, J., Clary, J., Strecker, E., Quigley, M. 2008. 15 Reasons you should think twice before using percent removal to assess STP performance. Stormwater Magazine. Jan/Feb 2008. Kim, H., E. Seagren, and A. Davis. 2003. Engineering bioretention for removal of nitrate in stormwater. Water Environment Research 75(4);355-367 Long, B., S. Clark, K. Baker, R. Berghage. 2006. Green roof media selection for minimization of pollutant loadings in roof runoff. Center for Green Roof Research. Pennsylvania State University. Maryland Department of Environment (MDE). 200o. Maryland stormwater design manual. Volumes 1 and 2. Baltimore, MD. MDE. 2009. Stormwater Regulations and Supplement to the 2000 Stormwater Design Manual. Baltimore, MD MDE, 2011. Accounting for stormwater wasteload allocations and impervious acres treated: guidance for NPDES stormwater permits. June 2011 Draft. Baltimore, MD. Metropolitan Washington Council of Governments. 1983. The Washington DC Nationwide Urban Runoff Project: Final Report. Department of Environmental Program. Prepared for US EPA. Washington, DC. National Research Council (NRC). 2008. Stormwater Management in the United States. National Academy of Science Press www.nap.edu Washington, DC. NRC. 2011. Achieving Nutrient and Sediment Reduction Goals in the Chesapeake Bay: an evaluation of program strategies and implementation. National Academy of Science Press www.nap.edu Washington, DC. North Carolina State University. 2009. Designing bioretention with an internal water storage layer. Urban Waterways. Pennsylvania Department of Environmental Protection (PA DEP). 2006. Pennsylvania Stormwater Best Management Practices Manual. Harrisburg, PA. Pitt, R., T. Brown and R. Morchque. 2004. National Stormwater Quality Database. Version 2.0. University of Alabama and Center for Watershed Protection. Final Report to U.S. Environmental Protection Agency. Schueler, T. 2012a. June 6, 2012 Memo to Expert Panels. Watershed Technical Workgroup Responses to Final Recommendation Report. Chesapeake Stormwater Network, Baltimore, MD. Schueler, T. 2012b. July 2, 2012 Memo to Urban Stormwater Group and Expert Panels. Resolution of Technical Issues Related to the Urban Retrofit and Performance
Standards Expert Panel Recommendation. Chesapeake Stormwater Network, Baltimore, MD. Schueler, T. 1987. Controlling urban runoff: a manual for planning and designing urban stormwater best management practices. Metropolitan Washington Council of Governments. Washington, DC. Schueler, T., P. Kumble and M. Heraty. 1992. A current assessment of urban best management practices: techniques for reducing nonpoint source pollution in the coastal zone. EPA Office of Wetlands, Oceans and Watersheds. Metropolitan Washington Council of Governments. Washington, DC. Schueler, T. 2007. Urban stormwater retrofit practices. Manual 3.Small Watershed Restoration Manual Series. U.S. EPA. Center for Watershed Protection. Ellicott City, MD Simpson, T. and S. Weammert. 2009. Developing nitrogen, phosphorus, and sediment efficiencies for tributary strategy practices. BMP Assessment Final Report. University of Maryland Mid-Atlantic Water Program. College Park, MD. Stewart, S., E. Gemmill and N. Pentz. 2005. An evaluation of the functions and effectiveness of urban riparian forest buffers. Baltimore County Dept. of Environmental Protection and Resource Management. Final Report Project 99-WSM-4. For Water Environment Research Foundation. U.S. EPA. 2011. Final Chesapeake Bay Watershed Implementation Plan in response to Bay-wide TMDL. United States Environmental Protection Agency, Region 3. Philadelphia, PA. UNH. 2009. University of New Hampshire Stormwater Center. 2009 Annual Report. Durham, NH. Urban Stormwater Workgroup (USWG). 2011. Technical Memo on street sweeping and BMP era recommendation of expert panel. 3.1.2011. Chesapeake Bay Program. Annapolis, MD. Virginia Department of Conservation and Recreation (VA DCR). Under Development. Virginia Stormwater Management Handbook. Richmond, VA. Water Quality Goal Implementation Team (WQGIT). 2010. Protocol for the development, review and approval of loading and effectiveness estimates for nutrient and sediment controls in the Chesapeake Bay Watershed Model. US EPA Chesapeake Bay Program. Annapolis, MD. Weiss, P., J. Gulliver, A, Erickson, 2010. The performance of grass swales as infiltration and pollution prevention practices. A Literature Review. University of Minnesota. Stormwater Center.
30
West Virginia Department of Environmental Protection (WV DEP). Under Development. Stormwater Manual. Charleston, WV. Winer, R. 2000. National pollutant removal database for stormwater treatment practices. 2nd edition. EPA Office of Science and Technology. Center for Watershed Protection. Ellicott City, MD