This article has been accepted for publication in a future issue of this journal. Content may differ from finalpublication. Citation information: DOI 10.1145/3266426, ACM Transactions on Software Engineering and
Methodology.Recommending Who to Follow in the Software EngineeringTwitter Space
ABHISHEK SHARMA, YUAN TIAN, AGUS SULISTYA, DINUSHA WIJEDASA, AND DAVIDLO, School of Information Systems, Singapore Management University, Singapore
With the advent of social media, developers are increasingly using it in their software development activities.Twitter is also one of the popular social mediums used by developers. A recent study by Singer et al. found thatsoftware developers use Twitter to “keep up with the fast-paced development landscape”. Unfortunately, dueto the general purpose nature of Twitter, it’s challenging for developers to use Twitter for their developmentactivities. Our survey with 36 developers who use Twitter in their development activities highlights thatdevelopers are interested in following specialized software gurus who share relevant technical tweets.
To help developers perform this task, in this work we propose a recommendation system to identifyspecialized software gurus. Our approach first extracts different kinds of features that characterize a Twitteruser and then employs a two-stage classification approach to generate a discriminative model, which candifferentiate specialized software gurus in a particular domain from other Twitter users that generate domain-related tweets (aka domain-related Twitter users). We have investigated the effectiveness of our approach infinding specialized software gurus for four different domains (JavaScript, Android, Python, and Linux) on adataset of 86,824 Twitter users who generate 5,517,878 tweets over one month. Our approach can differentiatespecialized software experts from other domain-related Twitter users with an F-measure of up to 0.820.Compared with existing Twitter domain expert recommendation approaches, our proposed approach canoutperform their F-measure by at least 7.63%.
CCS Concepts: • Software and its engineering→ Collaboration in software development;
Additional Key Words and Phrases: Twitter, Software Engineering, Recommendation Systems
ACM Reference Format:Abhishek Sharma, Yuan Tian, Agus Sulistya, Dinusha Wijedasa, and David Lo. 2018. Recommending Whoto Follow in the Software Engineering Twitter Space. ACM Trans. Softw. Eng. Methodol. 1, 1 (January 2018),34 pages. https://doi.org/10.1145/3266426
1 INTRODUCTIONTwitter is a popular social media platform and is continuously gaining traction and users. As ofJuly 2017, Twitter has a total of more than 328 million active monthly users who generate about500 million short messages (aka tweets or microblogs) daily [54]. Twitter allows users to post shortmessages that are broadcasted to other users who have chosen to follow them. These messages canbe further retweeted (i.e., propagated) to reach even a larger number of Twitter users. Additionally,users can mention other users (by specifying user names prefixed by the “@” symbols), or attachhashtags (keywords prefixed by the “#” symbols) in their tweets. Twitter allows users to get fast
This article has been accepted for publication in a future issue of this journal. Content may differ from final publication. Citation information: DOI10.1145/3266426, ACM Transactions on Software Engineering and Methodology.
up-to-date information about recent events and is a powerful platform for information sharing,having characteristics at the intersection of news media and social networks[22].Twitter and general social media channels have revolutionized the way developers work and
interact with one another. Singer et al. surveyed 271 GitHub developers and found that Twitter “helpsthem keep up with the fast-paced development landscape” [45]. Among their respondents, morethan 70% of them used Twitter to help them stay current about the latest technologies, practices,and tools they use, and learn things that they aren’t actively looking for. Furthermore, a majority ofthe respondents used Twitter to connect to and build trust with other developers, and a significantpercentage of respondents used Twitter to build communities around software development projects.The survey highlighted the increasing role that Twitter plays in the professional activities of softwaredevelopers.Despite the benefit brought by Twitter, its enormous size poses a number of challenges for its
users, including software developers. Singer et al. highlighted that a central challenge faced bydevelopers is to maintain a relevant network. Due to the fact that following other users is thepreferred way of getting information from Twitter (besides search), not carefully curating thenetwork might make it hard for developers to find relevant information that is interesting anduseful. To validate this challenge, Singer et al. surveyed developers for their experience in usingTwitter. Seventy-two percent of the respondents in their survey agree that they carefully considerwhom they would want to follow. Unfortunately, finding suitable users to follow among the morethan 328 million users in Twitter is not an easy feat.
In this work, we would like to help developers find interesting people to follow. To accomplishthis goal, we first surveyed about 38 developers to better understand developers’ needs. For 36 ofthem who actively use Twitter in their development activities, we asked them about the kinds ofTwitter accounts they would like to follow (see Section 3). Our survey questionnaire was openended and developers were free to enter any type of account that they wanted to follow. We findthat more than 75% of the 36 respondents prefer to follow specialized software gurus in theirdomains of interest. Our finding is in line with that of Singer et al. which observed that manydevelopers follow thought leaders from their technological niches [45].To follow up on this finding, we propose an automated approach that can identify specialized
software gurus from a large number of Twitter users. Our criteria for a specialized software guruis: he/she must be an experienced software developer in a specialized domain, and he/she musthave shared useful information for other developers in the specialized domain. We include the lastcriterion since a guru (meaning teacher, in Sanskrit) must have imparted knowledge to others. Also,it would be pointless to follow an expert developer who never shares something useful.Our guru recommendation system identifies software gurus by first finding a subset of Twitter
users that are potentially interested in software development and who generate domain-relatedtweets (i.e., tweets mentioning a particular domain of interest, e.g., Python). Our approach thenextracts different kinds of features from each user in this set of domain-related users (i.e., usersthat generate domain-related tweets). These features can be grouped into four families: Content,Network, Profile and GitHub. Based on these features, this candidate user set is then further analyzedby a two-stage classification process which generates a discriminative model (aka a classifier) thatdifferentiates specialized software gurus from other domain-related users.
To evaluate the main contribution of this work, which is a new approach that identifies specializedsoftware gurus on Twitter, we have considered four domains of interest (JavaScript, Android,Python, and Linux) and analyzed a collection of 5,517,878 tweets. These tweets were generatedby 86,824 Twitter users and were collected over a one month period. The evaluation results showthat our approach can differentiate between specialized software gurus and other domain-relatedusers with an F-measure score of 0.820 (for JavaScript gurus), 0.681 (for Android gurus), 0.602 (for
This article has been accepted for publication in a future issue of this journal. Content may differ from final publication. Citation information: DOI10.1145/3266426, ACM Transactions on Software Engineering and Methodology.
This article has been accepted for publication in a future issue of this journal. Content may differ from final publication. Citation information: DOI10.1145/3266426, ACM Transactions on Software Engineering and Methodology.
Python gurus), and 0.522 (for Linux gurus) respectively. Our approach outperforms the state-of-the-art domain-specific Twitter expert recommendation approaches by Pal and Counts [33], aswell as Klout [38], and achieves higher scores on metrics of precision, recall, and F-Measure. Theimprovement in F-Measure scores is by at least 7.63% (for Linux gurus). The effectiveness of ourapproach has been evaluated based on following research questions which have been discussed indetail in Section 6:• RQ1: How effective is our specialized software guru recommendation approach?• RQ2: Can our approach outperform existing Twitter expert recommendation approaches?• RQ3: What are important features that better differentiate specialized software gurus fromnon-gurus?• RQ4:Which feature values have the best predictive power across each domain?• RQ5:What is the cross domain performance of our approach?
The structure of the remainder of the paper is as follows. We discuss related work in Section 2. InSection 3, we present the design and results of our online survey to find out who developers wouldlike to follow on Twitter. In Section 4, we introduce the features that we use to characterize domain-related users on Twitter. In Section 5, we present our proposed approach that finds specializedsoftware gurus on Twitter. We describe the settings and results of the experiments that evaluateour proposed approach in Section 6. We discuss the results in Section 7. We conclude and mentionfuture work in Section 8.
2 RELATEDWORKSinger et al. surveyed 271 and interviewed 27 active developers on GitHub [45]. They foundthat many developers are using Twitter to “keep up with the fast-paced development landscape”.Specifically, developers used Twitter to get awareness of people and trends, extend their technicalknowledge, and build connections with other developers. Their paper also presents two majorchallenges affecting software developers using Twitter (i.e., maintaining a relevant network andconsuming content) which highlight the need to help developers to find suitable users to followfrom the massive number of Twitter users. Our study is motivated by this need.
Researchers have performed a number of empirical studies on microblogs posted in Twitter (akatweets) [5, 51, 52, 60]. Bougie et al. analyzed 11,679 tweets posted by 68 developers from threeopen source projects [5]. They observed that software engineers leverage Twitter to communicateand share information. Wang et al. analyzed 568 tweets posted by developers from the Drupalopen source project [60]. They found that Drupal developers use Twitter to coordinate efforts,share knowledge, encourage potential contributors to join, etc. Tian et al. manually categorized 300tweets that contained software related hashtags into ten groups which include commercial, news,tools and code, question and answer, events, personal, opinion, tips, job, and miscellaneous [51].Prasetyo et al. manually analyzed a sample of 300 tweets and labeled each of them as a software-related tweet or non software-related tweet. They then use Support Vector Machine (SVM) totrain a model from a set of labeled tweets and applied the model on another set of tweets toidentify each of them as software-related or not [37]. In a later work, Tian et al. analyzed softwaremicroblogger behaviours using a dataset which contains more than 13 million tweets posted by42 thousand microbloggers [52]. An analysis of popular topics in Twitter was performed in [43].In [16] the authors explored what Twitter users say about software applications. A technique toextract informative URLs related to software engineering was proposed in [44].Researchers have also built tools to support developers to better use Twitter for their day-to-
day work [1, 37, 42]. Achananuparp et al. build a tool that visualizes trends based on a numberof software related tweets [1]. Sharma et al. proposed NIRMAL which builds a language model
This article has been accepted for publication in a future issue of this journal. Content may differ from final publication. Citation information: DOI10.1145/3266426, ACM Transactions on Software Engineering and Methodology.
This article has been accepted for publication in a future issue of this journal. Content may differ from final publication. Citation information: DOI10.1145/3266426, ACM Transactions on Software Engineering and Methodology.
based on the publicly available Stack Overflow data and use it to compute a likelihood score of atweet being software related or not [42]. The usages of various other social media channels havealso been researched lately. Storey et al. surveyed software developers on how they use socialmedia channels to communicate and collaborate, and present insights into the challenges faced bydevelopers while using the channels [48, 49]. Macleod et al. explored how developers use YouTubefor documenting and sharing programming knowledge [28]. Ponzanelli et al. developed a tool thatextracts relevant fragments from software development video tutorials [35]. Lin et al. recentlystudied how developers use slack1 to help them in their software development activities [24]. Ourwork recommends specialized software gurus which is not considered in these prior works.
Past studies have explored the problem of recommending experts to certain tasks, e.g., bugtriaging [3, 4, 27, 62, 64], question answering [9, 10, 17], etc. Our approach is related but differentfrom these existing techniques. First, Twitter data contains a lot of noise since the topics ofinformation shared on Twitter may range from software engineering, politics, economy, idlechatter, and many more. Second, Twitter data has unique features; for example, Twitter datacontains information about people who follow a user or are followed by the user, how much ofa tweet is liked and/or shared (retweeted) by others, etc. Not utilizing these unique features is amissed opportunity.The closest work to ours is that by Pal and Counts [33] which proposes an approach to rank
Twitter users given a particular topic (represented by one or more keywords). They first extracta set of features from each Twitter user, i.e., the 10 content features that are considered in thiswork. Next, they generate a feature vector to represent each Twitter user that has posted tweetsthat contain the input keywords, and use them to cluster the Twitter users. The most likely clusteris selected and members in this cluster are deemed as experts. The members are also ranked tocreate a ranked list of domain experts. In this work, we extend the work by Pal and Counts byconsidering not only content features, but also network, profile and GitHub features. We alsoleverage a two-step classification algorithm to improve the accuracy of Pal and Counts’ clusteringapproach.There also exist systems such as Klout [38] which provide influence scores for Twitter users
with respect to a queried domain. These scores can be interpreted as a measure of expertise of aTwitter user over a given domain. In this work we compare our two-step classification algorithmwith Klout and find that it performs better than Klout (see Section 6).
3 WHO TO FOLLOW: DEVELOPERS’ PERSPECTIVETo guide and motivate the design of our automated recommendation system, we conducted anopen ended online survey with developers who have already made use of Twitter in their softwaredevelopment activities. We investigated the kinds of users they would like to follow on Twitter.The survey details are described below.
Survey Design and Analysis: The primary objective of our survey is to understand what categoriesof Twitter users do software developers like to follow. To understand this, we designed an openended survey. Our survey consisted of three key questions:
• The first question asks whether a respondent develops software systems and uses Twitter inhis/her software development activities. People who have not developed software systems ornot used Twitter in their software development activities may not have sufficient backgroundto respond to our survey. This question aims to validate the reliability of the answers that wereceive for the subsequent questions.
1https://slack.com/
This article has been accepted for publication in a future issue of this journal. Content may differ from final publication. Citation information: DOI10.1145/3266426, ACM Transactions on Software Engineering and Methodology.
This article has been accepted for publication in a future issue of this journal. Content may differ from final publication. Citation information: DOI10.1145/3266426, ACM Transactions on Software Engineering and Methodology.
• The second question asks a respondent for their years of experience as a software developer(less than 5 years, 5-10 years, or more than 10 years).
• The third question asks a respondent to indicate the types of Twitter accounts they like tofollow for the purpose of helping them in software development activities. This question wasopen ended and the respondent was asked to give a text description of accounts they followor would like to follow.
We then analyzed the responses provided by developers using grounded theory methodology [12,39]. Specifically, we used open card sort [18] in order to develop categories of Twitter accounts thatsoftware developers like to follow. The first two authors of the paper are involved in the open cardsort process. Our card sorting process has three phases. In the preparation phase, each response isread, and cards are created based on the user responses. Some users mentioned more than one typeof account they would like to follow; for such cases, we create multiple cards. Next, in the executionphase, all the cards are clustered into meaningful groups. Finally, in the analysis phase, based on theclusters we get from the last phase we formed higher level theme and categories to come up withthe final categories. In the card sort process, we ignore responses such as “I look for accounts thatare insightful or informative" as they are too general to be put into a specific category. Additionally,we merge categories that are mentioned by less than 3 respondents into a special category Others.The open card sort process was performed together by first two authors. Our process is similar tonegotiated agreement technique described in [8]. As the card sorting has been performed together,there is no inter-rater agreement number. Many previous studies involving card sorting have alsofollowed a similar process [2, 20, 21, 26, 46].
Survey Participants: We targeted software developers who are present on Twitter. Following [1,42, 43, 52], we collect a set of 161,067 Twitter users who are potentially interested in softwaredevelopment – see Section 6.1 for details. Next, we identify from this set, a subset of users whosatisfy two criteria: (1) they are recently active (i.e., those who had posted tweets after February2017), and (2) they allow anyone to send them Twitter direct messages2. Users who have not beenrecently active on Twitter may not respond to our survey requests – and thus the first criterion.The second criterion is there since we need to use Twitter direct messaging service to connect toour potential survey participants. This service allows us to send a detailed personalized message tousers, which would not have been possible if we had contacted the users by sending tweets as theyare limited to 140 characters. After creating this subset of users, we randomly select users from itto contact. The first author of the paper has send personalized Twitter direct messages to hundredsof these users, requesting them to fill the survey. In total we have contacted 213 developers, outof which 38 developers responded back by filling the survey. This translates to a response rateof 17.84%. We discarded the responses of two respondents since they did not use Twitter in theirsoftware development activities (i.e., they respond with a “No" for the first survey question). Weperformed an open card sort on the remaining 36 responses.After the card sort, in order to decide whether the survey responses are adequate, we checked
if the responses have reached saturation. According to Strauss and Corbin [50], sampling for asurvey can be terminated when collecting new data does not generate any new information. Duringthe survey we observed that after we got about 25 responses, new responses were not leadingto any new insights or information. This observation suggested that theoretical saturation hadbeen reached so we decided to stop the survey and perform card sort. We had already received 36responses by the time we stopped the survey, so we went on to perform the card sort on all the36 responses. To further validate and check for saturation, we used the following steps. We first
2https://support.twitter.com/articles/14606
This article has been accepted for publication in a future issue of this journal. Content may differ from final publication. Citation information: DOI10.1145/3266426, ACM Transactions on Software Engineering and Methodology.
This article has been accepted for publication in a future issue of this journal. Content may differ from final publication. Citation information: DOI10.1145/3266426, ACM Transactions on Software Engineering and Methodology.
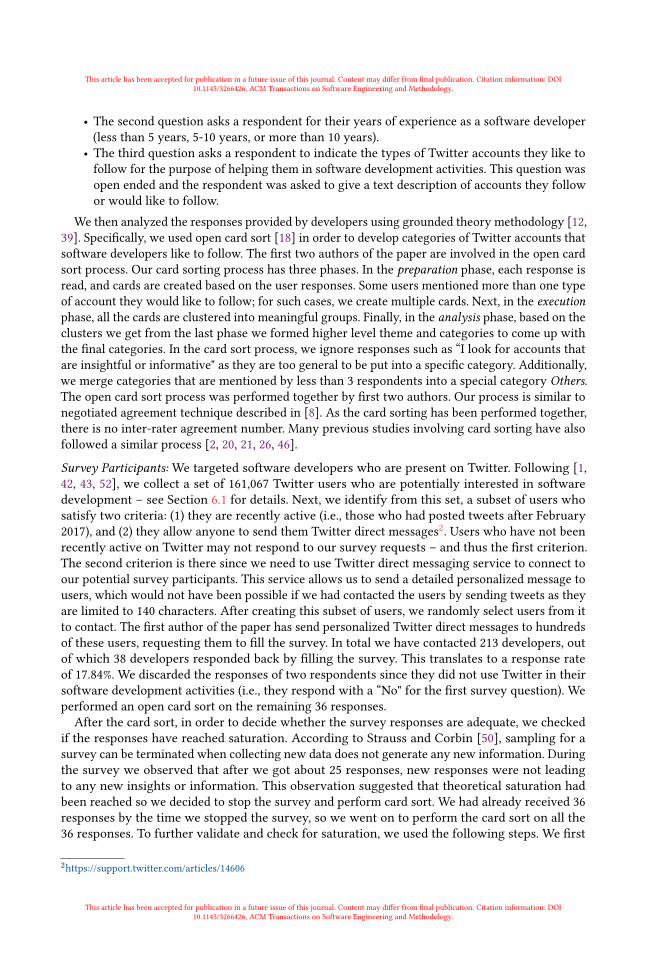
Fig. 1. Graph showing saturation of CosSimn score
represented the nth survey response as a vector Rn of size equal to the number of categories wedeveloped through card sort. Each element of Rn represents a category, with the default value of theelement being 0. The element corresponding to a category is assigned a value of 1 if the responsementioned the category. Then, for the nth response we calculated the average mean response forthe first n responses An as follows:
An =
∑ni=1 Rn
nThe intuition behind using the vector An is to validate if getting a new response helps us to get
any new information (category in our case). The An vector does not change much when the newresponse does not mention new information (or category). This can be captured by measuringcosine similarity between subsequent vectors An and An+1. After computing An for the 36 validresponses, we then compared pairs of vectors An and An+1 using cosine similarity [30]. The cosinesimilarity CosSimn between the nth and (n + 1)th responses is computed as:
CosSimn =An · An+1∥An ∥∥An+1∥
In the above equation, · is the dot operation between vectors and ∥Ai ∥ is the size of vector Ai .Saturation can be observed when the value of CosSimn stabilizes and does not change much whena new response is added. The value of CosSimn is shown in Figure 1. We can note that CosSimnstabilizes after the 23rd response. So based on this observation we decided not to send out anyfurther requests to developers for filling out our survey.
Survey Results: By analyzing the responses to the first question of the survey, we found that 94.73%of the respondents (i.e., 36) have developed software systems and use Twitter for their softwaredevelopment activities.
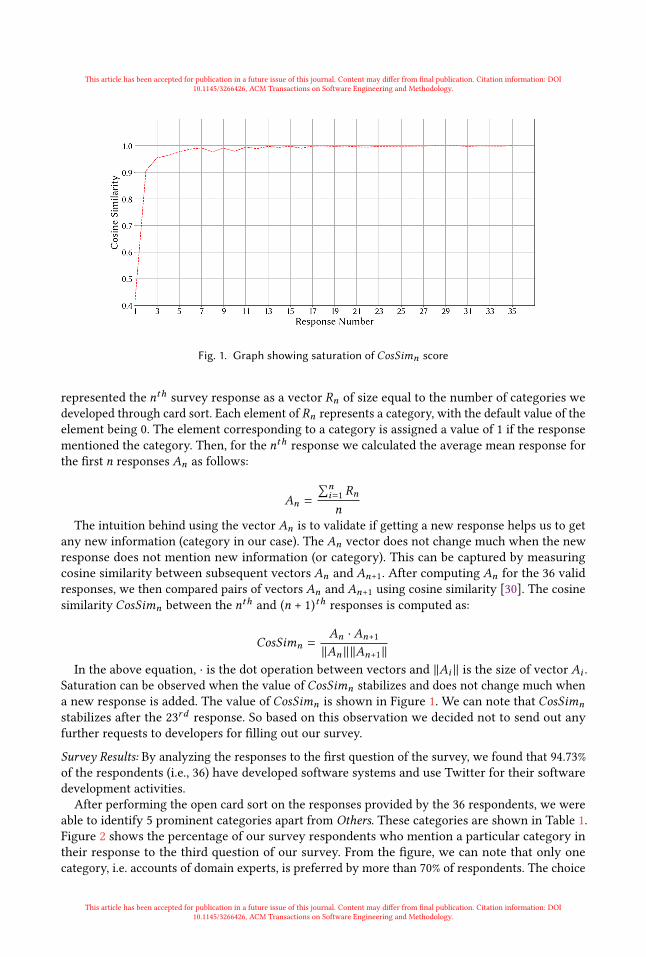
After performing the open card sort on the responses provided by the 36 respondents, we wereable to identify 5 prominent categories apart from Others. These categories are shown in Table 1.Figure 2 shows the percentage of our survey respondents who mention a particular category intheir response to the third question of our survey. From the figure, we can note that only onecategory, i.e. accounts of domain experts, is preferred by more than 70% of respondents. The choice
This article has been accepted for publication in a future issue of this journal. Content may differ from final publication. Citation information: DOI10.1145/3266426, ACM Transactions on Software Engineering and Methodology.
This article has been accepted for publication in a future issue of this journal. Content may differ from final publication. Citation information: DOI10.1145/3266426, ACM Transactions on Software Engineering and Methodology.
Table 1. Categories of Twitter Users/Accounts Developers like to Follow on Twitter
Code Category
I Accounts of domain experts (includes well-known developers, library &framework authors etc.)
II Accounts which provide technology related newsIII Accounts of software organizations/companies/firms related to a particular
domainIV Accounts of CTOs/CEOs of software/technology companies of a particular
domainV Accounts of software frameworks/tools/libraries related to a particular do-
mainVI Others
Fig. 2. Infograph displaying what types of Twitter accounts developers across different experience levelsprefer to follow. For descriptions of categories I-V, please refer to Table 1.
of this category is consistent among developers across all experience levels. Based on this result, inthe rest of this paper, we focus on building an automated tool to recommend domain experts whogenerate specialized domain contents that others can benefit from (i.e., specialized software gurus),and evaluate our results by asking people to label whether a recommended Twitter account belongsto such domain experts. We do not consider the other five categories as a substantial majority ofrespondents (62.50% to 100%) are not interested in following users belonging to them.
4 DOMAIN-SPECIFIC CHARACTERIZATION OF TWITTER ACCOUNTSIn this section, we describe the features that we use to characterize a Twitter user (i.e., a registeredaccount on Twitter) given a particular specialized domain of interest. In this work, a domaincorresponds to a software engineering concept of interest and is represented by a keyword. Inparticular, we consider two programming language keywords (i.e., JavaScript and Python) and twooperating system keywords (i.e., Android and Linux). We pick these keywords as they are popular,well represented in our dataset, and known well to participants we hired for labeling experts.
We consider four feature families Content,Network, Profile, andGitHub, each of which is describedin the following subsections.
This article has been accepted for publication in a future issue of this journal. Content may differ from final publication. Citation information: DOI10.1145/3266426, ACM Transactions on Software Engineering and Methodology.
This article has been accepted for publication in a future issue of this journal. Content may differ from final publication. Citation information: DOI10.1145/3266426, ACM Transactions on Software Engineering and Methodology.
4.1 Content FeaturesContent features characterize how often a Twitter user generates tweets about a specialized domainor topic of interest and the impact of his/her tweets on other users. Users who frequently post abouta domain are likely to have expertise in the given domain. Among such users those who interactfrequently with other domain-related users are more likely to be specialized software gurus.We reuse a set of features first proposed by Pal and Counts to recommend domain experts on
Twitter [33]. Before we present the features, we need to first introduce some feature componentsand terminology related to them. These feature components are then combined to arrive at scoresfor content features.
Terminology: Given a particular domain which is represented by a keyword, e.g., Python, wedefine the following concepts:• Domain-related tweets are tweets that contain the representative keyword.
• Domain-related hashtag is a word that starts with the # symbol and contains the representativekeyword, e.g., #Python for keyword Python.
• Domain-related Twitter users are Twitter users who have posted 10 or more domain-relatedtweets.
The tweets generated by a user can be categorized into following three categories:• Conversational tweets (CT) are tweets that mention at least one Twitter user.
• Retweeted tweets (RT) are tweets that are originally generated by someone else and the Twitteruser copies, or forwards them, in order to spread the information, to his/her followers.
• Original Tweet (OT) are the non RT and CT tweets that are produced by a Twitter user.
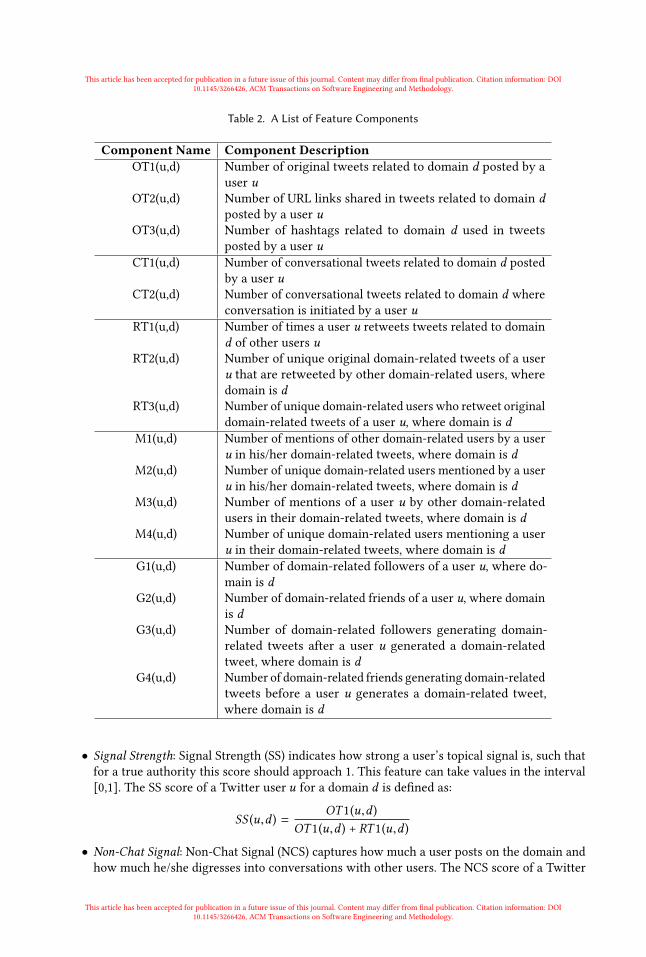
Based on the above concepts, Table 2 presents feature components that can be calculated foreach Twitter user. These feature components are used to construct more complex content featureslater. The concept of “friend” is used to calculate G2 and G4. A user A and user B are friends ofeach other, if both A and B follow each other, and thus get automatically subscribed to each other’stweets.
Features:We consider a total of 10 content features as proposed in [33]. These features are based on the
feature components introduced in Table 2. All of them are calculated for each user with respectto a particular domain. We further sub categorize the content features into categories of ContentStrength and Content Popularity. We describe the sub categories and their respective features below:
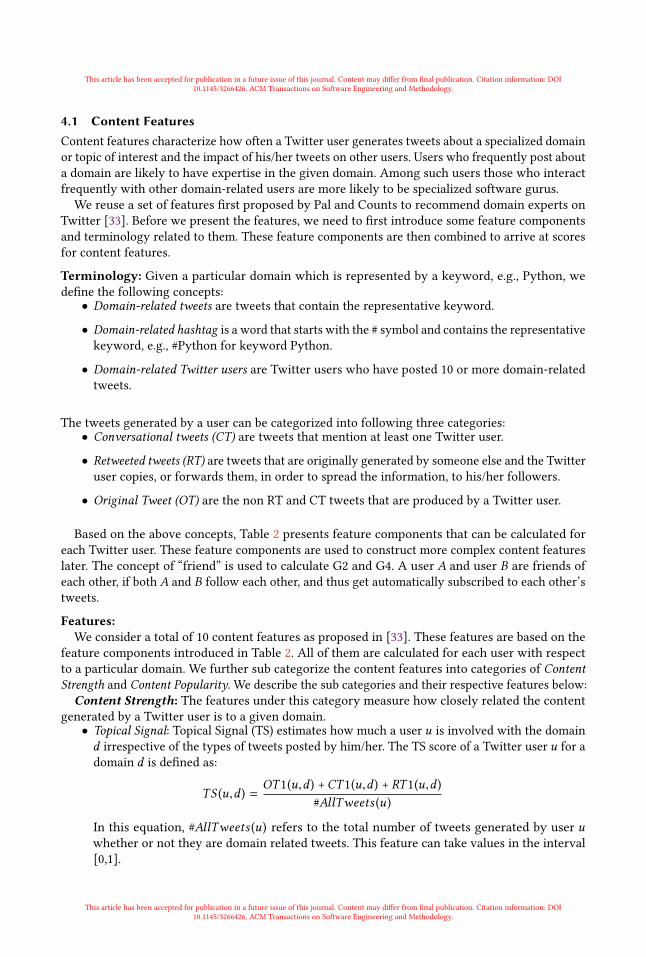
Content Strength: The features under this category measure how closely related the contentgenerated by a Twitter user is to a given domain.• Topical Signal: Topical Signal (TS) estimates how much a user u is involved with the domaind irrespective of the types of tweets posted by him/her. The TS score of a Twitter user u for adomain d is defined as:
TS (u,d ) =OT 1(u,d ) +CT 1(u,d ) + RT 1(u,d )
#AllTweets (u)
In this equation, #AllTweets (u) refers to the total number of tweets generated by user uwhether or not they are domain related tweets. This feature can take values in the interval[0,1].
This article has been accepted for publication in a future issue of this journal. Content may differ from final publication. Citation information: DOI10.1145/3266426, ACM Transactions on Software Engineering and Methodology.
This article has been accepted for publication in a future issue of this journal. Content may differ from final publication. Citation information: DOI10.1145/3266426, ACM Transactions on Software Engineering and Methodology.
Table 2. A List of Feature Components
Component Name Component DescriptionOT1(u,d) Number of original tweets related to domain d posted by a
user uOT2(u,d) Number of URL links shared in tweets related to domain d
posted by a user uOT3(u,d) Number of hashtags related to domain d used in tweets
posted by a user uCT1(u,d) Number of conversational tweets related to domain d posted
by a user uCT2(u,d) Number of conversational tweets related to domain d where
conversation is initiated by a user uRT1(u,d) Number of times a user u retweets tweets related to domain
d of other users uRT2(u,d) Number of unique original domain-related tweets of a user
u that are retweeted by other domain-related users, wheredomain is d
RT3(u,d) Number of unique domain-related users who retweet originaldomain-related tweets of a user u, where domain is d
M1(u,d) Number of mentions of other domain-related users by a useru in his/her domain-related tweets, where domain is d
M2(u,d) Number of unique domain-related users mentioned by a useru in his/her domain-related tweets, where domain is d
M3(u,d) Number of mentions of a user u by other domain-relatedusers in their domain-related tweets, where domain is d
M4(u,d) Number of unique domain-related users mentioning a useru in their domain-related tweets, where domain is d
G1(u,d) Number of domain-related followers of a user u, where do-main is d
G2(u,d) Number of domain-related friends of a user u, where domainis d
G3(u,d) Number of domain-related followers generating domain-related tweets after a user u generated a domain-relatedtweet, where domain is d
G4(u,d) Number of domain-related friends generating domain-relatedtweets before a user u generates a domain-related tweet,where domain is d
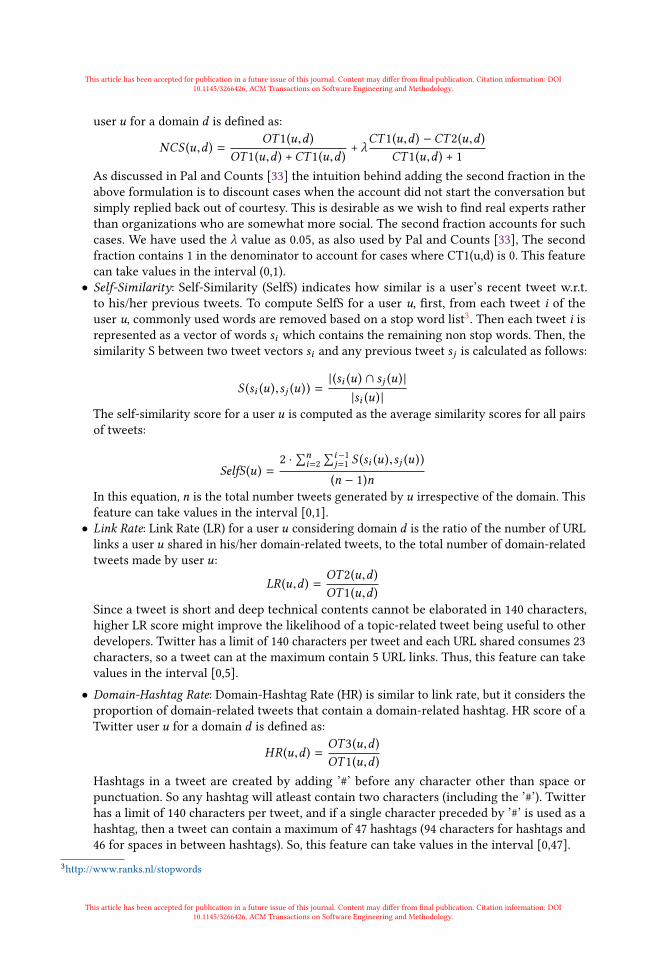
• Signal Strength: Signal Strength (SS) indicates how strong a user’s topical signal is, such thatfor a true authority this score should approach 1. This feature can take values in the interval[0,1]. The SS score of a Twitter user u for a domain d is defined as:
SS (u,d ) =OT 1(u,d )
OT 1(u,d ) + RT 1(u,d )
• Non-Chat Signal: Non-Chat Signal (NCS) captures how much a user posts on the domain andhow much he/she digresses into conversations with other users. The NCS score of a Twitter
This article has been accepted for publication in a future issue of this journal. Content may differ from final publication. Citation information: DOI10.1145/3266426, ACM Transactions on Software Engineering and Methodology.
This article has been accepted for publication in a future issue of this journal. Content may differ from final publication. Citation information: DOI10.1145/3266426, ACM Transactions on Software Engineering and Methodology.
user u for a domain d is defined as:
NCS (u,d ) =OT 1(u,d )
OT 1(u,d ) +CT 1(u,d ) + λCT 1(u,d ) −CT 2(u,d )
CT 1(u,d ) + 1As discussed in Pal and Counts [33] the intuition behind adding the second fraction in theabove formulation is to discount cases when the account did not start the conversation butsimply replied back out of courtesy. This is desirable as we wish to find real experts ratherthan organizations who are somewhat more social. The second fraction accounts for suchcases. We have used the λ value as 0.05, as also used by Pal and Counts [33], The secondfraction contains 1 in the denominator to account for cases where CT1(u,d) is 0. This featurecan take values in the interval (0,1).• Self-Similarity: Self-Similarity (SelfS) indicates how similar is a user’s recent tweet w.r.t.to his/her previous tweets. To compute SelfS for a user u, first, from each tweet i of theuser u, commonly used words are removed based on a stop word list3. Then each tweet i isrepresented as a vector of words si which contains the remaining non stop words. Then, thesimilarity S between two tweet vectors si and any previous tweet sj is calculated as follows:
S (si (u),sj (u)) =|(si (u) ∩ sj (u) |
|si (u) |
The self-similarity score for a user u is computed as the average similarity scores for all pairsof tweets:
SelfS(u) =2 ·∑n
i=2∑i−1
j=1 S (si (u),sj (u))
(n − 1)nIn this equation, n is the total number tweets generated by u irrespective of the domain. Thisfeature can take values in the interval [0,1].• Link Rate: Link Rate (LR) for a user u considering domain d is the ratio of the number of URLlinks a user u shared in his/her domain-related tweets, to the total number of domain-relatedtweets made by user u:
LR (u,d ) =OT 2(u,d )OT 1(u,d )
Since a tweet is short and deep technical contents cannot be elaborated in 140 characters,higher LR score might improve the likelihood of a topic-related tweet being useful to otherdevelopers. Twitter has a limit of 140 characters per tweet and each URL shared consumes 23characters, so a tweet can at the maximum contain 5 URL links. Thus, this feature can takevalues in the interval [0,5].• Domain-Hashtag Rate: Domain-Hashtag Rate (HR) is similar to link rate, but it considers theproportion of domain-related tweets that contain a domain-related hashtag. HR score of aTwitter user u for a domain d is defined as:
HR (u,d ) =OT 3(u,d )OT 1(u,d )
Hashtags in a tweet are created by adding ’#’ before any character other than space orpunctuation. So any hashtag will atleast contain two characters (including the ’#’). Twitterhas a limit of 140 characters per tweet, and if a single character preceded by ’#’ is used as ahashtag, then a tweet can contain a maximum of 47 hashtags (94 characters for hashtags and46 for spaces in between hashtags). So, this feature can take values in the interval [0,47].
3http://www.ranks.nl/stopwords
This article has been accepted for publication in a future issue of this journal. Content may differ from final publication. Citation information: DOI10.1145/3266426, ACM Transactions on Software Engineering and Methodology.
This article has been accepted for publication in a future issue of this journal. Content may differ from final publication. Citation information: DOI10.1145/3266426, ACM Transactions on Software Engineering and Methodology.
Content Popularity: The features under this category measure how popular and impactful isthe domain related information generated by a user.
• Retweet Impact: Retweet Impact (RI) indicates the impact of the contents generated by theuser. RI of a Twitter user u for a domain d is computed as:
RI (u,d ) = RT 2(u,d ) · loд(RT 3(u,d ))The retweet impact is primarily captured by RT2, which measures how many times a user uhas been retweeted. However, for some users the values of RT2 can be high just because someof their devoted followers always retweet the content. To dampen the impact of such usersthe multiplication by logarithm of RT3 is done, as RT3 only captures the unique followerswho retweet content of a user. This feature can take values in the interval [0,∞).• Mention Impact: Mention Impact (MI) indicates how much an account is mentioned withregards to the domain of interest. MI score of a Twitter user u for a domain d is defined as:
MI (u,d ) = M3(u,d ) · loд(M4(u,d )) −M1(u,d ) · loд(M2(u,d ))MI is measured as a difference of two components mentioned below:* The first component is a product of M3 and logarithm of M4. Mainly, M3 gives a goodestimate of this component. However in order to account for mentions being receivedfrom people known to a user, M3 is multiplied by logarithm of M4. As M4 consists of onlyunique users its logarithm helps to dampen the impact of M3.
* The second component is a product of M1 and logarithm of M2, which measures how mucha user is mentioning other users in Twitter. Again, logarithm of M2 is used to dampen theimpact of people frequently mentioned by the user. Sometimes a user may also receivementions back only because of the fact that they mention others. To account for this factorwe need to subtract the second component (which estimates how often the user mentionsothers) from first component.
The above steps ensure that the Mention Impact(MI) we calculate for a user is based onhis/her merit and not as a result of him/her mentioning other users. This feature can takevalues in the interval [0,∞).• Neighbor Score: Neighbor Score (NS) captures the raw number of domain-related users for adomain d around a user u. The network score of a user u for a domain d is computed as:
NS (u,d ) = loд(G1(u,d ) + 1) − loд(G2(u,d ) + 1)Instead of using the absolute values of G1 andG2 their logarithms have been used here to avoidissues with clustering as the distribution of G1 and G2 follows a long tail distribution [33].This feature can take values in the interval [0,∞).• Information Diffusion: Information Diffusion (ID) estimates how much influence is diffusedby the user in its network. We define the ID score of a Twitter user u for a domain d as:
ID (u,d ) = loд(G3(u,d ) + 1) − loд(G4(u,d ) + 1)Similar to NS, logarithms have been used here. This feature can take values in the interval[0,∞).
4.2 Network FeaturesIn Twitter, one user is connected to other users via the follow relationship. For each Twitter user,we can thus form a network of other users that are connected to it via this follow relationship(either directly or indirectly). In this network, we can estimate the importance of a user in thenetwork. A software guru who shares many gems of knowledge with others is likely to be followed
This article has been accepted for publication in a future issue of this journal. Content may differ from final publication. Citation information: DOI10.1145/3266426, ACM Transactions on Software Engineering and Methodology.
This article has been accepted for publication in a future issue of this journal. Content may differ from final publication. Citation information: DOI10.1145/3266426, ACM Transactions on Software Engineering and Methodology.
by many other developers that benefit from his/her microblogs and thus is expected to have a highimportance score among other users in the network.To capture the above-mentioned intuition we create a network for each domain where nodes
correspond to domain-specific users and edges correspond to the follow relationships among theseusers. The edges in our network are directed, e.g., an edge from userA to user B in our graph meansthat the user A follows user B on Twitter. We then evaluate the importance of each user in thisnetwork.To measure the importance of a user, we build upon various studies in web and social network
mining communities which have proposed various metrics [6, 13, 32, 61]. We use some of thecentrality indicators proposed in [6, 61], which are widely used in network analysis and graphtheory to identify the most important nodes and vertices in a graph or a network. We also usePageRank proposed by Page et al. which gives authority scores of important nodes in a network [32].Intuitively, software domain experts are typically known bymany people in the domain and expectedto interact with others. Thus, it is expected that the nodes representing experts would be importantand centrally located. The network features have been further categorized into of Centrality Scoresand Absolute Scores. We describe the sub categories and their respective features below. Using thefeatures mentioned below would help in identifying the experts.
Centrality Scores: Features in this category are metrics based on research in social and networkmining communities and they measure how central (important) a node (user) is in a network(Twitter).
• Betweenness: Betweenness is defined based on the number of shortest paths from all nodes toall others that pass through a node. A high score for this measure means that very often thisnode (equivalent to a user in Twitter network) serves as a bridge between other nodes. Webelieve that many software gurus act as knowledge brokers and help to facilitate informationflow between various parties. Singer et al. also observe that thought leaders also mentionand retweet contents generated by others [45]. Betweenness score helps us to identify suchbroker nodes in the Twitter network and thus we have used it as a network feature in thiswork.• Closeness: Closeness is defined as the reciprocal of the average shortest distance of a node toall the other nodes in a network. The intuition behind this feature is that gurus are expectedto be directly or indirectly connected to a large number of other users a few hops (edges)away, and hence on an average are closer and easily reachable by others. The closeness scoreshelp us to identify such potential gurus.• Degree Centrality: Degree Centrality for a user u is the ratio of users to which it is connected,to the total users in the network. The number of users connected to a user u includes theusers who follow u, and the users who are followed by u. A user who is a domain expert inTwitter generally has a large number of followers resulting in a relatively large value of thisfeature.• OutDegree Centrality: OutDegree Centrality for a user u is ratio of number of other usersit follows to the total number of users in the network. Intuitively experts on Twitter havelarge number of followers but do not follow a large number of accounts, so the value of theOutDegree Centrality feature is expected to be low for experts.• PageRank: PageRank (PR) is a node importance measurement method proposed by Page andBrin [32]. The PR algorithm computes a probability to represent the likelihood that a walkerarriving at a particular node by randomly traversing edges in a network. The PR algorithmruns iteratively. At iteration i , the PR score of a node u is defined as follows:
This article has been accepted for publication in a future issue of this journal. Content may differ from final publication. Citation information: DOI10.1145/3266426, ACM Transactions on Software Engineering and Methodology.
This article has been accepted for publication in a future issue of this journal. Content may differ from final publication. Citation information: DOI10.1145/3266426, ACM Transactions on Software Engineering and Methodology.
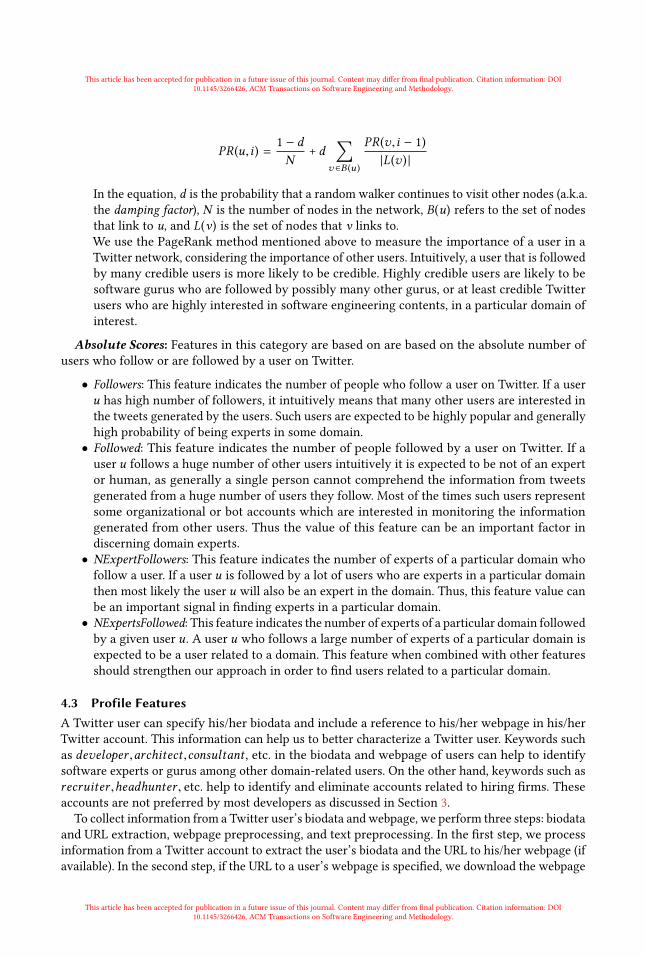
PR (u,i ) =1 − dN
+ d∑
v ∈B (u )
PR (v,i − 1)|L(v ) |
In the equation, d is the probability that a random walker continues to visit other nodes (a.k.a.the damping factor), N is the number of nodes in the network, B(u) refers to the set of nodesthat link to u, and L(v) is the set of nodes that v links to.We use the PageRank method mentioned above to measure the importance of a user in aTwitter network, considering the importance of other users. Intuitively, a user that is followedby many credible users is more likely to be credible. Highly credible users are likely to besoftware gurus who are followed by possibly many other gurus, or at least credible Twitterusers who are highly interested in software engineering contents, in a particular domain ofinterest.
Absolute Scores: Features in this category are based on are based on the absolute number ofusers who follow or are followed by a user on Twitter.
• Followers: This feature indicates the number of people who follow a user on Twitter. If a useru has high number of followers, it intuitively means that many other users are interested inthe tweets generated by the users. Such users are expected to be highly popular and generallyhigh probability of being experts in some domain.• Followed: This feature indicates the number of people followed by a user on Twitter. If auser u follows a huge number of other users intuitively it is expected to be not of an expertor human, as generally a single person cannot comprehend the information from tweetsgenerated from a huge number of users they follow. Most of the times such users representsome organizational or bot accounts which are interested in monitoring the informationgenerated from other users. Thus the value of this feature can be an important factor indiscerning domain experts.• NExpertFollowers: This feature indicates the number of experts of a particular domain whofollow a user. If a user u is followed by a lot of users who are experts in a particular domainthen most likely the user u will also be an expert in the domain. Thus, this feature value canbe an important signal in finding experts in a particular domain.• NExpertsFollowed: This feature indicates the number of experts of a particular domain followedby a given user u. A user u who follows a large number of experts of a particular domain isexpected to be a user related to a domain. This feature when combined with other featuresshould strengthen our approach in order to find users related to a particular domain.
4.3 Profile FeaturesA Twitter user can specify his/her biodata and include a reference to his/her webpage in his/herTwitter account. This information can help us to better characterize a Twitter user. Keywords suchas developer ,architect ,consultant , etc. in the biodata and webpage of users can help to identifysoftware experts or gurus among other domain-related users. On the other hand, keywords such asrecruiter ,headhunter , etc. help to identify and eliminate accounts related to hiring firms. Theseaccounts are not preferred by most developers as discussed in Section 3.
To collect information from a Twitter user’s biodata and webpage, we perform three steps: biodataand URL extraction, webpage preprocessing, and text preprocessing. In the first step, we processinformation from a Twitter account to extract the user’s biodata and the URL to his/her webpage (ifavailable). In the second step, if the URL to a user’s webpage is specified, we download the webpage
This article has been accepted for publication in a future issue of this journal. Content may differ from final publication. Citation information: DOI10.1145/3266426, ACM Transactions on Software Engineering and Methodology.
This article has been accepted for publication in a future issue of this journal. Content may differ from final publication. Citation information: DOI10.1145/3266426, ACM Transactions on Software Engineering and Methodology.
and extract textual contents from the webpage using a Python package called BeautifulSoup4. ThePython package will remove HTML related keywords and scripts that exist in the downloadedwebpage. In the third step, we perform standard text preprocessing on the biodata and the webpagetext which includes the following sub-steps:(1) Tokenization:We split the biodata/webpage text into tokens where each token corresponds
to a word that appears in the text.(2) Stop Word Removal: We remove common English stop words, such as “is”, “are”, etc, since
they appear very often and thus have little discriminative power. We use the list of Englishstop words provided on http://www.ranks.nl/stopwords.
(3) Stemming: We reduce a word to its root form (e.g., “reading” and “reads” are both reduced to“read”) using a popular stemming algorithm, i.e., Porter stemmer [36]
In the end, for each user, we construct two feature vectors; one to represent his/her biodata andthe other to represent his/her webpage. Each feature corresponds to a pre-processed word thatappears in the biodata (or webpage), and the value of the feature is the number of times the wordappears in the biodata (or webpage). We call the biodata feature vector as Biodata, and webpagefeature vector asWebpage. These feature vectors are converted into four probabilities that representthe likelihood of a Twitter user being a specialized guru and the process is discussed in detail inSection 5.2. We denote the four probabilities as PosBio, NegBio, PosWeb, and NegWeb. Apart fromthe above four probability scores there are a few more profile related features that are mentionedbelow• IsVerified: Verified accounts on Twitter represent accounts maintained by users who arepopular in key interest areas such as music, sports etc. and whose authenticity has beenconfirmed 5. A verified account related to a software domain and which is human also has avery high probability of being an expert in the domain.• AccountAge: This feature measures indicates from how long the user has been present onTwitter. A user who is present on Twitter for a long period of time and also generates domainrelated tweets is likely be an expert developer.• CosSimWeb: This feature measures the cosine similarity between the keyword representingthe domain of interest and the Webpage feature vector. Users who have more domain relatedtext on their webpage are expected to be more close to the domain.• CosSimTweetText: This feature measures the cosine similarity between the keyword repre-senting the domain of interest and the text of all the original tweets made by the user. Userswho tweet more on a particular domain have a higher probability of being an expert. Thisscore is expected to be higher for such users.
4.4 GitHub FeaturesSome Twitter users include links to their GitHub profiles in their webpages. GitHub is one of thepopular code and repository holding website having over 21.1 million repositories held by over 9million users [14]. The presence of a GitHub account and high activity in GitHub can be importantfactors in identifying software experts. In this work we use the following 5 basic GitHub features.• IsGhMentioned: This feature indicates whether a Twitter user includes a link to his/her GitHubprofile in his/her webpage. Intuitively a software expert will want to publish a link to his/herGitHub profile on his/her webpage to highlight his/her work and possibly to find interestedpeople to join the projects he/she is championing on GitHub. A newbie or a non-expertdeveloper is likely not to have a GitHub profile and even if he/she has one he/she may not
This article has been accepted for publication in a future issue of this journal. Content may differ from final publication. Citation information: DOI10.1145/3266426, ACM Transactions on Software Engineering and Methodology.
This article has been accepted for publication in a future issue of this journal. Content may differ from final publication. Citation information: DOI10.1145/3266426, ACM Transactions on Software Engineering and Methodology.
have any/many projects to display or promote. Thus, newbies are less likely to highlighttheir GitHub profiles on their webpages. We set the value of this feature to 1 if a valid GitHubprofile link is present in a Twitter user’s webpage, otherwise it is set to 0.• GhFollowers: This feature indicates the number of people who follow a user in GitHub. Themore the number of followers a user has, the more popular the user is, and thus the user hasa higher likelihood of being an expert. This feature is assigned a value of 0 if IsGhMentioned= 0.• GhRepos: This feature indicates the number of public repositories owned by a user in GitHub.More repositories implies that the user has worked on more projects, and thus this featurecan be a good way to measure the expertise of the user. This feature is assigned a value of 0if IsGhMentioned = 0.• GhGists: This feature indicates the number of public Gists shared by a user in GitHub. Gistsin GitHub are a way for developers to share useful code snippets or scripts. They are differentfrom a GitHub repositories which are generally entire projects in themselves. A user whohas a large number of public GitHub Gists, can be taken as an indicator of their experience increating reusable solutions for common tasks or problems. It also suggests their willingnessto share such information with other fellow developers. This feature can be a good wayto find experienced developers who are also willing to share their experience with otherdevelopers. This feature is assigned a value of 0 if IsGhMentioned = 0.• GhUserType: This feature indicates the type of GitHub Account. GitHub accounts can be ofvarious types such as individual accounts or those of organizations. This feature is assigned avalue of 1 if the values returned by account type is “User" else the feature is assigned a valueof 0.
5 SOFTWARE GURU RECOMMENDATIONIn this section, we first introduce the overall architecture of our prediction approach. We thendescribe in detail the key steps in the approach.
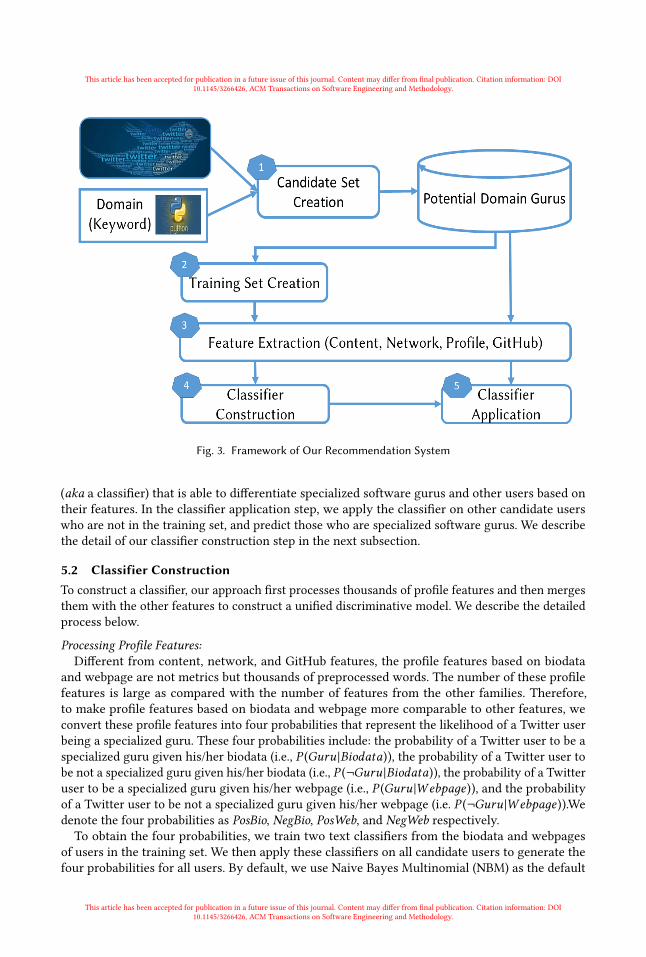
5.1 Approach OverviewFigure 3 shows the overview of our approach, which contains five major steps (candidate setcreation, training set creation, feature extraction, classifier construction, and classifier application).Our approach takes as input a keyword specifying a domain of interest and users in Twitter andeventually produces a set of specialized software gurus.
In the first step, we select Twitter users that are potentially interested in software developmentout from hundreds of millions of users. This helps us reduce the search space of finding specializedsoftware gurus. We follow the approach used in [1, 42, 52], wherein initially we create a seed list ofpopular Twitter users who are software developers, by collating developers who are mentionedon technical blogs. We then expand this list by using the follow links of users present in seed list.Next as we need to find users who are related to a domain, we filter Twitter users who post lessthan 10 domain-related tweets for the month of December, 2016. This gives us a candidate set ofspecialized software gurus related to a domain. The process is described in detail in Section 6.1.In the second step, among the candidates identified in the first set, we manually label some of
them as specialized software gurus or other users (details in Section 6.1), and this set of labeledusers forms the training set. In the third step, we extract various features (i.e., content, network,profile, and GitHub features) described in Section 4 for all users in the candidate set. In the classifierlearning step, the features of the users in the training set are used to learn a discriminative model
This article has been accepted for publication in a future issue of this journal. Content may differ from final publication. Citation information: DOI10.1145/3266426, ACM Transactions on Software Engineering and Methodology.
This article has been accepted for publication in a future issue of this journal. Content may differ from final publication. Citation information: DOI10.1145/3266426, ACM Transactions on Software Engineering and Methodology.
Fig. 3. Framework of Our Recommendation System
(aka a classifier) that is able to differentiate specialized software gurus and other users based ontheir features. In the classifier application step, we apply the classifier on other candidate userswho are not in the training set, and predict those who are specialized software gurus. We describethe detail of our classifier construction step in the next subsection.
5.2 Classifier ConstructionTo construct a classifier, our approach first processes thousands of profile features and then mergesthem with the other features to construct a unified discriminative model. We describe the detailedprocess below.
Processing Profile Features:Different from content, network, and GitHub features, the profile features based on biodata
and webpage are not metrics but thousands of preprocessed words. The number of these profilefeatures is large as compared with the number of features from the other families. Therefore,to make profile features based on biodata and webpage more comparable to other features, weconvert these profile features into four probabilities that represent the likelihood of a Twitter userbeing a specialized guru. These four probabilities include: the probability of a Twitter user to be aspecialized guru given his/her biodata (i.e., P (Guru |Biodata)), the probability of a Twitter user tobe not a specialized guru given his/her biodata (i.e., P (¬Guru |Biodata)), the probability of a Twitteruser to be a specialized guru given his/her webpage (i.e., P (Guru |Webpaдe )), and the probabilityof a Twitter user to be not a specialized guru given his/her webpage (i.e. P (¬Guru |Webpaдe )).Wedenote the four probabilities as PosBio, NegBio, PosWeb, and NegWeb respectively.To obtain the four probabilities, we train two text classifiers from the biodata and webpages
of users in the training set. We then apply these classifiers on all candidate users to generate thefour probabilities for all users. By default, we use Naive Bayes Multinomial (NBM) as the default
This article has been accepted for publication in a future issue of this journal. Content may differ from final publication. Citation information: DOI10.1145/3266426, ACM Transactions on Software Engineering and Methodology.
This article has been accepted for publication in a future issue of this journal. Content may differ from final publication. Citation information: DOI10.1145/3266426, ACM Transactions on Software Engineering and Methodology.
classifier to transfer profile features to the four probabilities. The NBM classifier is fast and hasshown its discriminative power in similar situations, e.g., [63].
Constructing a Unified Discriminative Model:After we have processed the profile features, we combine the 4 probabilities with the 10 content
features, 4 other profile features, 9 network features and the 5 GitHub features to characterize aTwitter user. We then take the features of users in the training data to learn a unified discriminativemodel (a classifier) that can differentiate specialized gurus from other users based on all of theirfeatures. After combining all the features we again apply the Naive Bayes Multinomial (NBM) onthe 32 features from the four families (i.e., content, network, profile and GitHub).
6 EXPERIMENTS AND RESULTSIn this section, we first describe our dataset and experiment settings. Next, we introduce ourresearch questions and present our experiment results that answer each of the research questions.At the end of this section, we present the threats to validity.
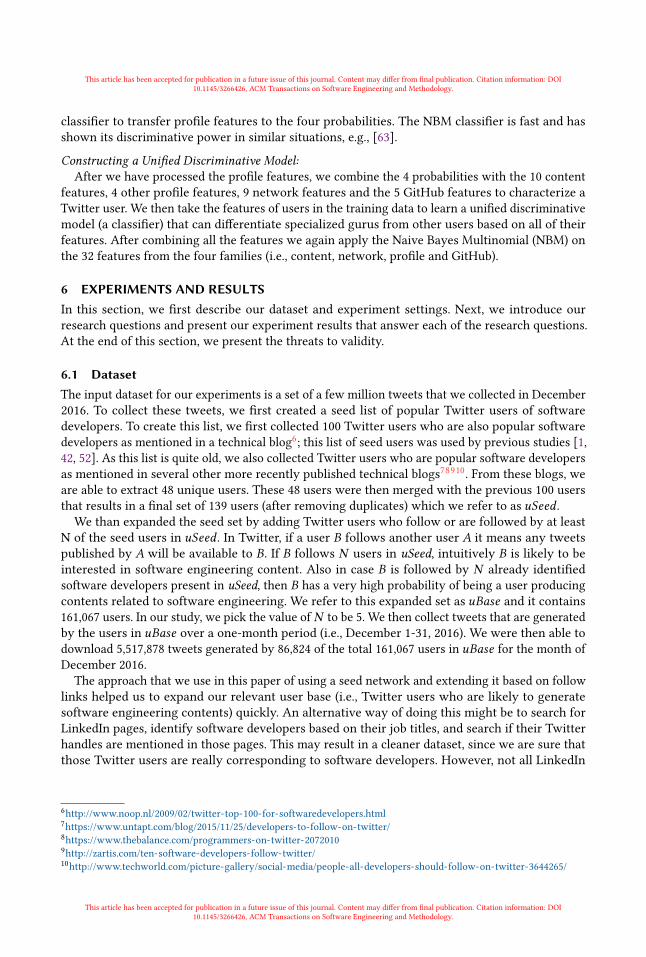
6.1 DatasetThe input dataset for our experiments is a set of a few million tweets that we collected in December2016. To collect these tweets, we first created a seed list of popular Twitter users of softwaredevelopers. To create this list, we first collected 100 Twitter users who are also popular softwaredevelopers as mentioned in a technical blog6; this list of seed users was used by previous studies [1,42, 52]. As this list is quite old, we also collected Twitter users who are popular software developersas mentioned in several other more recently published technical blogs78910. From these blogs, weare able to extract 48 unique users. These 48 users were then merged with the previous 100 usersthat results in a final set of 139 users (after removing duplicates) which we refer to as uSeed .We than expanded the seed set by adding Twitter users who follow or are followed by at least
N of the seed users in uSeed . In Twitter, if a user B follows another user A it means any tweetspublished by A will be available to B. If B follows N users in uSeed, intuitively B is likely to beinterested in software engineering content. Also in case B is followed by N already identifiedsoftware developers present in uSeed, then B has a very high probability of being a user producingcontents related to software engineering. We refer to this expanded set as uBase and it contains161,067 users. In our study, we pick the value of N to be 5. We then collect tweets that are generatedby the users in uBase over a one-month period (i.e., December 1-31, 2016). We were then able todownload 5,517,878 tweets generated by 86,824 of the total 161,067 users in uBase for the month ofDecember 2016.
The approach that we use in this paper of using a seed network and extending it based on followlinks helped us to expand our relevant user base (i.e., Twitter users who are likely to generatesoftware engineering contents) quickly. An alternative way of doing this might be to search forLinkedIn pages, identify software developers based on their job titles, and search if their Twitterhandles are mentioned in those pages. This may result in a cleaner dataset, since we are sure thatthose Twitter users are really corresponding to software developers. However, not all LinkedIn
This article has been accepted for publication in a future issue of this journal. Content may differ from final publication. Citation information: DOI10.1145/3266426, ACM Transactions on Software Engineering and Methodology.
This article has been accepted for publication in a future issue of this journal. Content may differ from final publication. Citation information: DOI10.1145/3266426, ACM Transactions on Software Engineering and Methodology.
Table 3. Dataset Statistics
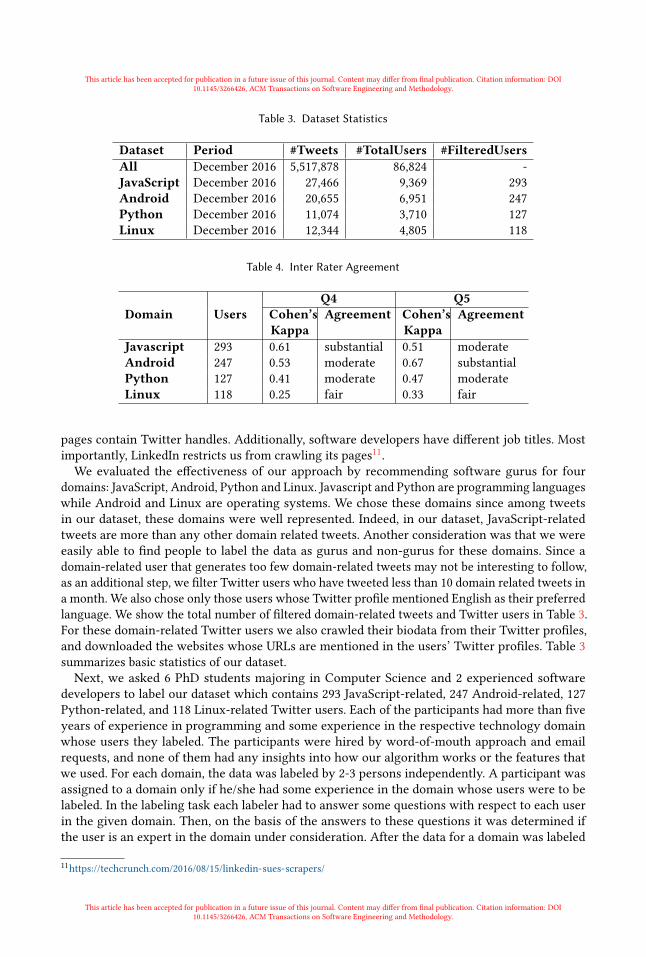
Dataset Period #Tweets #TotalUsers #FilteredUsersAll December 2016 5,517,878 86,824 -JavaScript December 2016 27,466 9,369 293Android December 2016 20,655 6,951 247Python December 2016 11,074 3,710 127Linux December 2016 12,344 4,805 118
pages contain Twitter handles. Additionally, software developers have different job titles. Mostimportantly, LinkedIn restricts us from crawling its pages11.We evaluated the effectiveness of our approach by recommending software gurus for four
domains: JavaScript, Android, Python and Linux. Javascript and Python are programming languageswhile Android and Linux are operating systems. We chose these domains since among tweetsin our dataset, these domains were well represented. Indeed, in our dataset, JavaScript-relatedtweets are more than any other domain related tweets. Another consideration was that we wereeasily able to find people to label the data as gurus and non-gurus for these domains. Since adomain-related user that generates too few domain-related tweets may not be interesting to follow,as an additional step, we filter Twitter users who have tweeted less than 10 domain related tweets ina month. We also chose only those users whose Twitter profile mentioned English as their preferredlanguage. We show the total number of filtered domain-related tweets and Twitter users in Table 3.For these domain-related Twitter users we also crawled their biodata from their Twitter profiles,and downloaded the websites whose URLs are mentioned in the users’ Twitter profiles. Table 3summarizes basic statistics of our dataset.Next, we asked 6 PhD students majoring in Computer Science and 2 experienced software
developers to label our dataset which contains 293 JavaScript-related, 247 Android-related, 127Python-related, and 118 Linux-related Twitter users. Each of the participants had more than fiveyears of experience in programming and some experience in the respective technology domainwhose users they labeled. The participants were hired by word-of-mouth approach and emailrequests, and none of them had any insights into how our algorithm works or the features thatwe used. For each domain, the data was labeled by 2-3 persons independently. A participant wasassigned to a domain only if he/she had some experience in the domain whose users were to belabeled. In the labeling task each labeler had to answer some questions with respect to each userin the given domain. Then, on the basis of the answers to these questions it was determined ifthe user is an expert in the domain under consideration. After the data for a domain was labeled
This article has been accepted for publication in a future issue of this journal. Content may differ from final publication. Citation information: DOI10.1145/3266426, ACM Transactions on Software Engineering and Methodology.
This article has been accepted for publication in a future issue of this journal. Content may differ from final publication. Citation information: DOI10.1145/3266426, ACM Transactions on Software Engineering and Methodology.
independently by the labelers, we computed the inter-rater agreement. For cases that they disagree,the labelers sat down together to discuss and decide final labels.
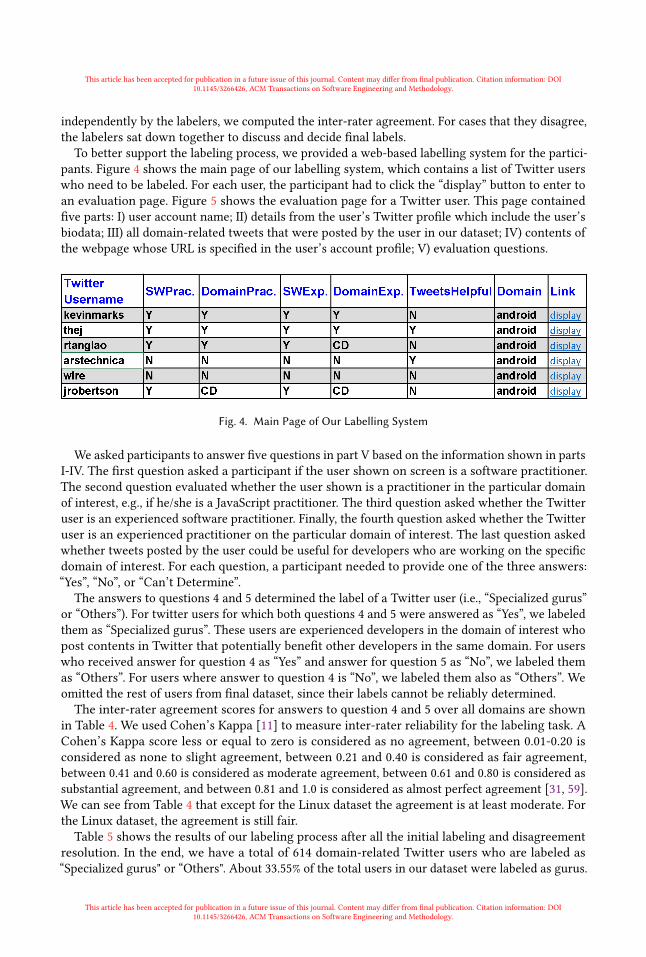
To better support the labeling process, we provided a web-based labelling system for the partici-pants. Figure 4 shows the main page of our labelling system, which contains a list of Twitter userswho need to be labeled. For each user, the participant had to click the “display” button to enter toan evaluation page. Figure 5 shows the evaluation page for a Twitter user. This page containedfive parts: I) user account name; II) details from the user’s Twitter profile which include the user’sbiodata; III) all domain-related tweets that were posted by the user in our dataset; IV) contents ofthe webpage whose URL is specified in the user’s account profile; V) evaluation questions.
Fig. 4. Main Page of Our Labelling System
We asked participants to answer five questions in part V based on the information shown in partsI-IV. The first question asked a participant if the user shown on screen is a software practitioner.The second question evaluated whether the user shown is a practitioner in the particular domainof interest, e.g., if he/she is a JavaScript practitioner. The third question asked whether the Twitteruser is an experienced software practitioner. Finally, the fourth question asked whether the Twitteruser is an experienced practitioner on the particular domain of interest. The last question askedwhether tweets posted by the user could be useful for developers who are working on the specificdomain of interest. For each question, a participant needed to provide one of the three answers:“Yes”, “No”, or “Can’t Determine”.
The answers to questions 4 and 5 determined the label of a Twitter user (i.e., “Specialized gurus”or “Others”). For twitter users for which both questions 4 and 5 were answered as “Yes”, we labeledthem as “Specialized gurus”. These users are experienced developers in the domain of interest whopost contents in Twitter that potentially benefit other developers in the same domain. For userswho received answer for question 4 as “Yes” and answer for question 5 as “No”, we labeled themas “Others”. For users where answer to question 4 is “No”, we labeled them also as “Others”. Weomitted the rest of users from final dataset, since their labels cannot be reliably determined.The inter-rater agreement scores for answers to question 4 and 5 over all domains are shown
in Table 4. We used Cohen’s Kappa [11] to measure inter-rater reliability for the labeling task. ACohen’s Kappa score less or equal to zero is considered as no agreement, between 0.01-0.20 isconsidered as none to slight agreement, between 0.21 and 0.40 is considered as fair agreement,between 0.41 and 0.60 is considered as moderate agreement, between 0.61 and 0.80 is considered assubstantial agreement, and between 0.81 and 1.0 is considered as almost perfect agreement [31, 59].We can see from Table 4 that except for the Linux dataset the agreement is at least moderate. Forthe Linux dataset, the agreement is still fair.Table 5 shows the results of our labeling process after all the initial labeling and disagreement
resolution. In the end, we have a total of 614 domain-related Twitter users who are labeled as“Specialized gurus" or “Others". About 33.55% of the total users in our dataset were labeled as gurus.
This article has been accepted for publication in a future issue of this journal. Content may differ from final publication. Citation information: DOI10.1145/3266426, ACM Transactions on Software Engineering and Methodology.
This article has been accepted for publication in a future issue of this journal. Content may differ from final publication. Citation information: DOI10.1145/3266426, ACM Transactions on Software Engineering and Methodology.
The proportion of gurus is not very small as they are identified among Twitter users who post atleast 10 domain-related tweets in a one month period, and whose labels can be reliably determined.For example, for “Python" domain, initially a total of 3,710 Twitter users had posted at least 1 tweethaving the keyword “Python". Out of these only 127 users had posted at least 10 domain-relatedtweets. Further, during annotation, labels were reliably determined only for 91 of these users, outof which 26 were labeled as “Specialized gurus”. Thus, the two steps of filtering and labeling, resultin an increased proportion of gurus in our final dataset. For “JavaScript" domain the number of“Specialized gurus” is more than 50% of the total users of that domain. This can be explained bythe fact that “JavaScript" is currently the most popular programming language12 so the number of“JavaScript" gurus on Twitter are also expected to be more. We use these 614 users to evaluate the12https://insights.stackoverflow.com/survey/2017#technology
This article has been accepted for publication in a future issue of this journal. Content may differ from final publication. Citation information: DOI10.1145/3266426, ACM Transactions on Software Engineering and Methodology.
This article has been accepted for publication in a future issue of this journal. Content may differ from final publication. Citation information: DOI10.1145/3266426, ACM Transactions on Software Engineering and Methodology.
effectiveness of our approach in differentiating specialized domain gurus from other domain-relatedusers.
6.2 Experiment Setting
Implementation-Details: We use the implementation of Multinomial Naive Bayes13 provided as partof sklearn [7].Evaluation Metrics: We use three standard metrics, namely precision, recall, and F-Measure, whichhave been used in many past studies, e.g., [53, 63]. They are calculated based on four possibleoutcomes of a Twitter user in an evaluation set: the user is a specialized software guru and he/sheis correctly predicted as such (true positive, TP); the user is not a specialized software guru,however he/she is wrongly predicted as a specialized software guru (false positive, FP); the user isa specialized software guru, however he/she is not predicted as such (false negative, FN); or theuser is not a specialized software guru, and he/she is correctly predicted as such (true negative,TN). Based on these possible outcomes, precision, recall and F-measure are defined as:
Precision is the proportion of correctly predicted specialized software gurus among those predictedas specialized software gurus, i.e., Precision = T P
T P+F PRecall is the proportion of specialized software gurus that are correctly predicted as specialized
software gurus, i.e., Recall = T PT P+FN .
F-Measure is the harmonic mean of precision and recall, and it is used as a summary measure toevaluate if an increase in precision (recall) outweighs a reduction in recall (precision), i.e., F-Measure= 2×Precision ×Recall
Precision+Recall .Evaluation Procedure: We apply 10-fold cross validation on each of the four datasets. In this way, adataset of size n will be partitioned into 10 folds each of size n/10. Nine folds are used for training aclassification model, which is then evaluated on the rest 1 fold data. The training and evaluationprocesses are repeated 10 times and a mean score is taken for precision, recall, and F-measure.Baseline Approaches: We consider the following two baselines approaches• Our first baseline is the approach proposed by Pal and Counts [33] as the baseline approach.Their approach uses only content features. They employ the Gaussian mixture model tocluster Twitter users into two groups, and then pick one of the two groups as experts. Theyalso rank Twitter users in this group based on their likelihood to be an expert. The Pythonpackage Gaussian Mixture14 [34] is used for clustering in our experiments. We consider thefollowing settings with respect to this baseline approach.* (PCEv ): In this setting we run Pal and Counts approach to cluster all users in the evaluationdata (the test data in our supervised approach) by ignoring the training data in the clusteringprocess.
* (PCT r+Ev ): In this setting we run Pal and Counts we run Pal and Counts to cluster all usersin the training and evaluation data (basically the complete dataset used in our supervisedapproach).
• Our second baseline is based on Klout15. Klout is a system which calculates influence scoreof social accounts across multiple social networks [38]. It uses a hierarchical combinationof various feature scores aggregated over multiple social networks to calculate an influencescore of a user, known as KloutScore. Klout offers a web API16 through which we can obtain
This article has been accepted for publication in a future issue of this journal. Content may differ from final publication. Citation information: DOI10.1145/3266426, ACM Transactions on Software Engineering and Methodology.
This article has been accepted for publication in a future issue of this journal. Content may differ from final publication. Citation information: DOI10.1145/3266426, ACM Transactions on Software Engineering and Methodology.
the KloutScore of a given Twitter user for a specific topic or domain. The score calculation isbased on the approach outlined in [38, 47] and is an estimate of the percentile rank of a user’sexpertise for a given topic or domain. In this work, we consider any user with a KloutScoregreater than 0.99 as an expert for that domain. These are users rated as those among the top1% Twitter users with expertise on the domain. We refer to this baseline as KL.
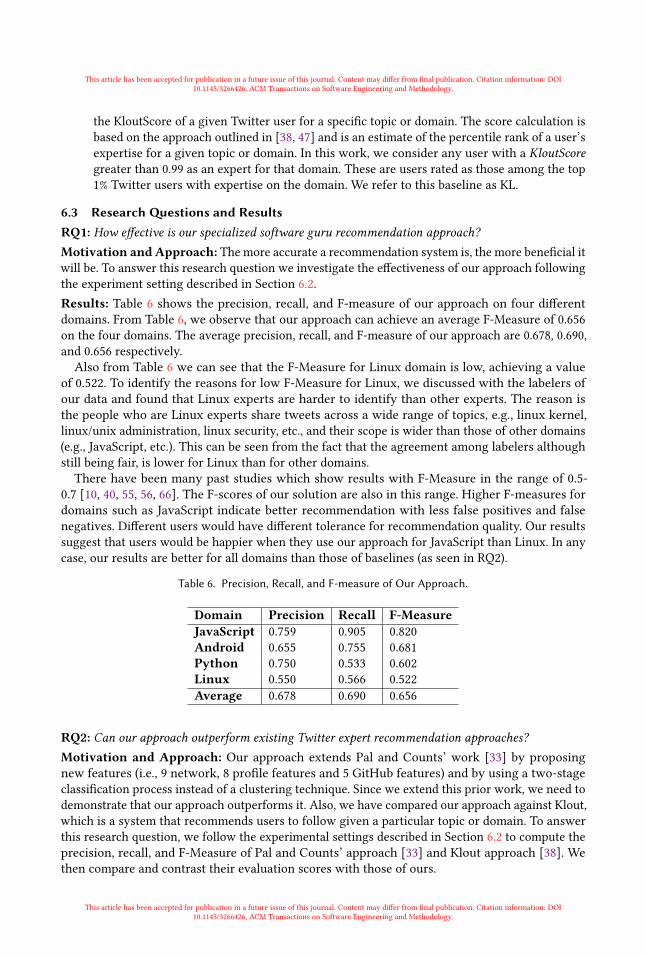
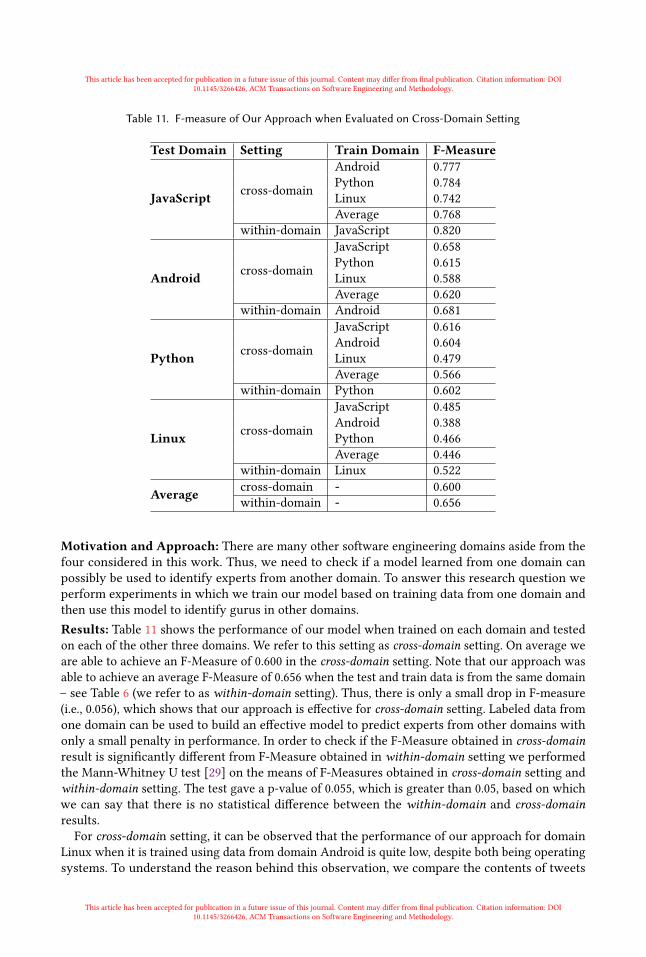
6.3 ResearchQuestions and ResultsRQ1: How effective is our specialized software guru recommendation approach?Motivation and Approach: The more accurate a recommendation system is, the more beneficial itwill be. To answer this research question we investigate the effectiveness of our approach followingthe experiment setting described in Section 6.2.Results: Table 6 shows the precision, recall, and F-measure of our approach on four differentdomains. From Table 6, we observe that our approach can achieve an average F-Measure of 0.656on the four domains. The average precision, recall, and F-measure of our approach are 0.678, 0.690,and 0.656 respectively.Also from Table 6 we can see that the F-Measure for Linux domain is low, achieving a value
of 0.522. To identify the reasons for low F-Measure for Linux, we discussed with the labelers ofour data and found that Linux experts are harder to identify than other experts. The reason isthe people who are Linux experts share tweets across a wide range of topics, e.g., linux kernel,linux/unix administration, linux security, etc., and their scope is wider than those of other domains(e.g., JavaScript, etc.). This can be seen from the fact that the agreement among labelers althoughstill being fair, is lower for Linux than for other domains.There have been many past studies which show results with F-Measure in the range of 0.5-
0.7 [10, 40, 55, 56, 66]. The F-scores of our solution are also in this range. Higher F-measures fordomains such as JavaScript indicate better recommendation with less false positives and falsenegatives. Different users would have different tolerance for recommendation quality. Our resultssuggest that users would be happier when they use our approach for JavaScript than Linux. In anycase, our results are better for all domains than those of baselines (as seen in RQ2).
Table 6. Precision, Recall, and F-measure of Our Approach.
RQ2: Can our approach outperform existing Twitter expert recommendation approaches?Motivation and Approach: Our approach extends Pal and Counts’ work [33] by proposingnew features (i.e., 9 network, 8 profile features and 5 GitHub features) and by using a two-stageclassification process instead of a clustering technique. Since we extend this prior work, we need todemonstrate that our approach outperforms it. Also, we have compared our approach against Klout,which is a system that recommends users to follow given a particular topic or domain. To answerthis research question, we follow the experimental settings described in Section 6.2 to compute theprecision, recall, and F-Measure of Pal and Counts’ approach [33] and Klout approach [38]. Wethen compare and contrast their evaluation scores with those of ours.
This article has been accepted for publication in a future issue of this journal. Content may differ from final publication. Citation information: DOI10.1145/3266426, ACM Transactions on Software Engineering and Methodology.
This article has been accepted for publication in a future issue of this journal. Content may differ from final publication. Citation information: DOI10.1145/3266426, ACM Transactions on Software Engineering and Methodology.
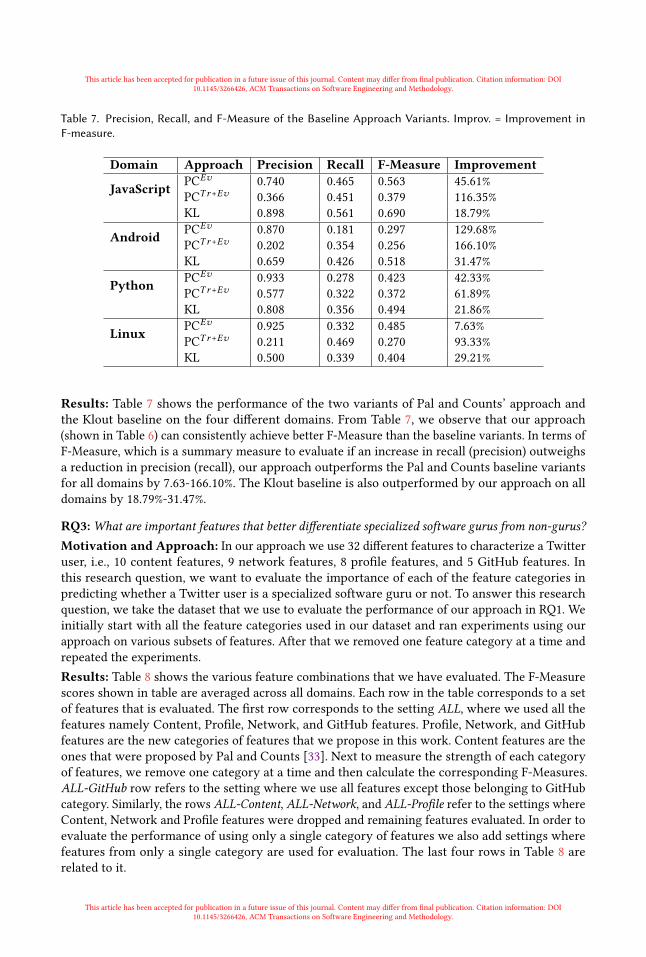
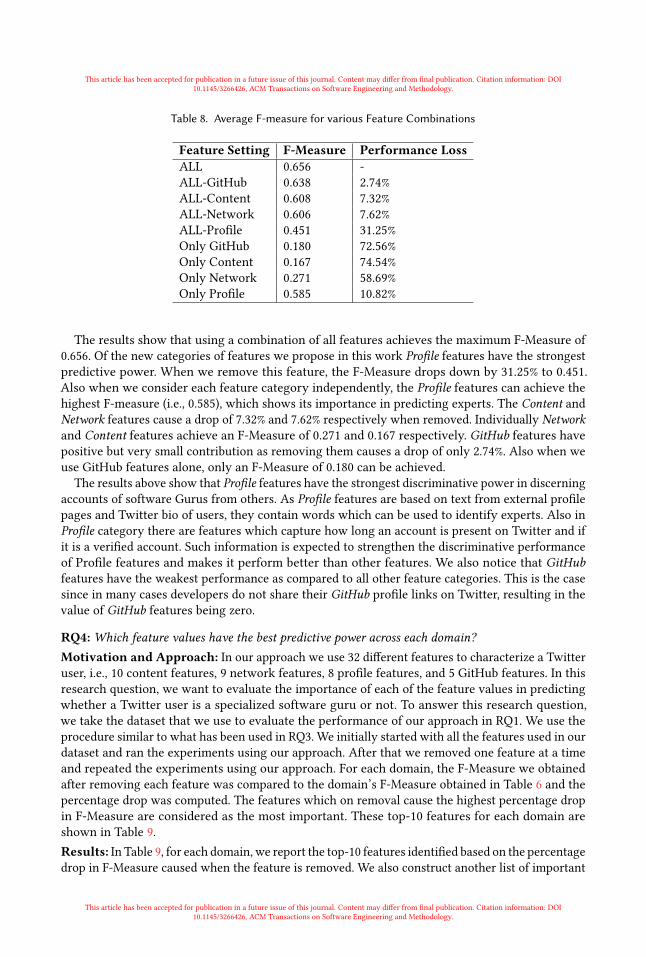
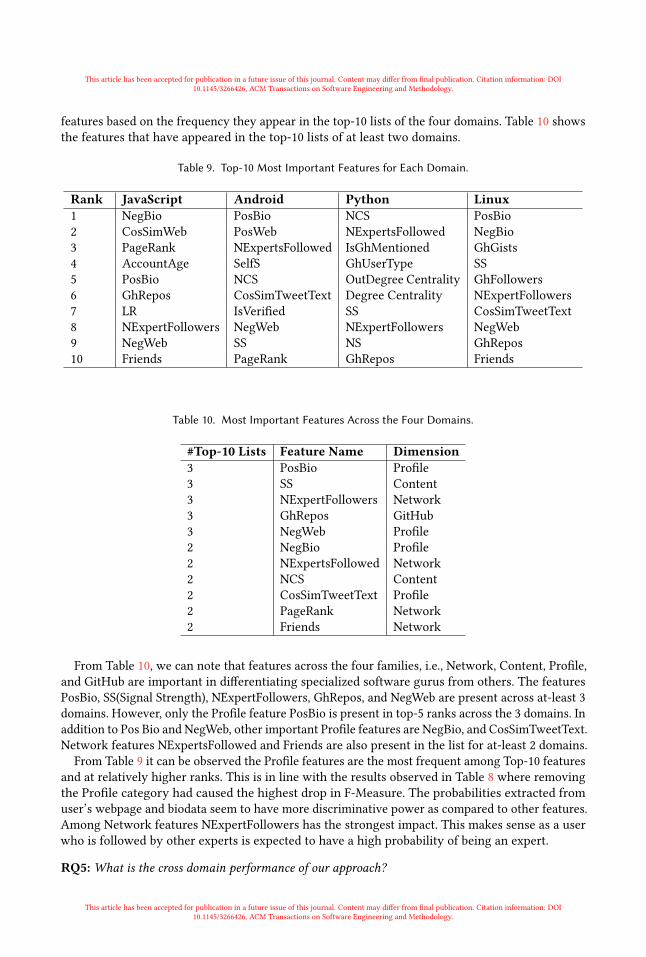
Table 7. Precision, Recall, and F-Measure of the Baseline Approach Variants. Improv. = Improvement inF-measure.
Results: Table 7 shows the performance of the two variants of Pal and Counts’ approach andthe Klout baseline on the four different domains. From Table 7, we observe that our approach(shown in Table 6) can consistently achieve better F-Measure than the baseline variants. In terms ofF-Measure, which is a summary measure to evaluate if an increase in recall (precision) outweighsa reduction in precision (recall), our approach outperforms the Pal and Counts baseline variantsfor all domains by 7.63-166.10%. The Klout baseline is also outperformed by our approach on alldomains by 18.79%-31.47%.
RQ3:What are important features that better differentiate specialized software gurus from non-gurus?Motivation and Approach: In our approach we use 32 different features to characterize a Twitteruser, i.e., 10 content features, 9 network features, 8 profile features, and 5 GitHub features. Inthis research question, we want to evaluate the importance of each of the feature categories inpredicting whether a Twitter user is a specialized software guru or not. To answer this researchquestion, we take the dataset that we use to evaluate the performance of our approach in RQ1. Weinitially start with all the feature categories used in our dataset and ran experiments using ourapproach on various subsets of features. After that we removed one feature category at a time andrepeated the experiments.Results: Table 8 shows the various feature combinations that we have evaluated. The F-Measurescores shown in table are averaged across all domains. Each row in the table corresponds to a setof features that is evaluated. The first row corresponds to the setting ALL, where we used all thefeatures namely Content, Profile, Network, and GitHub features. Profile, Network, and GitHubfeatures are the new categories of features that we propose in this work. Content features are theones that were proposed by Pal and Counts [33]. Next to measure the strength of each categoryof features, we remove one category at a time and then calculate the corresponding F-Measures.ALL-GitHub row refers to the setting where we use all features except those belonging to GitHubcategory. Similarly, the rows ALL-Content, ALL-Network, and ALL-Profile refer to the settings whereContent, Network and Profile features were dropped and remaining features evaluated. In order toevaluate the performance of using only a single category of features we also add settings wherefeatures from only a single category are used for evaluation. The last four rows in Table 8 arerelated to it.
This article has been accepted for publication in a future issue of this journal. Content may differ from final publication. Citation information: DOI10.1145/3266426, ACM Transactions on Software Engineering and Methodology.
This article has been accepted for publication in a future issue of this journal. Content may differ from final publication. Citation information: DOI10.1145/3266426, ACM Transactions on Software Engineering and Methodology.
Table 8. Average F-measure for various Feature Combinations
The results show that using a combination of all features achieves the maximum F-Measure of0.656. Of the new categories of features we propose in this work Profile features have the strongestpredictive power. When we remove this feature, the F-Measure drops down by 31.25% to 0.451.Also when we consider each feature category independently, the Profile features can achieve thehighest F-measure (i.e., 0.585), which shows its importance in predicting experts. The Content andNetwork features cause a drop of 7.32% and 7.62% respectively when removed. Individually Networkand Content features achieve an F-Measure of 0.271 and 0.167 respectively. GitHub features havepositive but very small contribution as removing them causes a drop of only 2.74%. Also when weuse GitHub features alone, only an F-Measure of 0.180 can be achieved.
The results above show that Profile features have the strongest discriminative power in discerningaccounts of software Gurus from others. As Profile features are based on text from external profilepages and Twitter bio of users, they contain words which can be used to identify experts. Also inProfile category there are features which capture how long an account is present on Twitter and ifit is a verified account. Such information is expected to strengthen the discriminative performanceof Profile features and makes it perform better than other features. We also notice that GitHubfeatures have the weakest performance as compared to all other feature categories. This is the casesince in many cases developers do not share their GitHub profile links on Twitter, resulting in thevalue of GitHub features being zero.
RQ4: Which feature values have the best predictive power across each domain?Motivation and Approach: In our approach we use 32 different features to characterize a Twitteruser, i.e., 10 content features, 9 network features, 8 profile features, and 5 GitHub features. In thisresearch question, we want to evaluate the importance of each of the feature values in predictingwhether a Twitter user is a specialized software guru or not. To answer this research question,we take the dataset that we use to evaluate the performance of our approach in RQ1. We use theprocedure similar to what has been used in RQ3. We initially started with all the features used in ourdataset and ran the experiments using our approach. After that we removed one feature at a timeand repeated the experiments using our approach. For each domain, the F-Measure we obtainedafter removing each feature was compared to the domain’s F-Measure obtained in Table 6 and thepercentage drop was computed. The features which on removal cause the highest percentage dropin F-Measure are considered as the most important. These top-10 features for each domain areshown in Table 9.Results: In Table 9, for each domain, we report the top-10 features identified based on the percentagedrop in F-Measure caused when the feature is removed. We also construct another list of important
This article has been accepted for publication in a future issue of this journal. Content may differ from final publication. Citation information: DOI10.1145/3266426, ACM Transactions on Software Engineering and Methodology.
This article has been accepted for publication in a future issue of this journal. Content may differ from final publication. Citation information: DOI10.1145/3266426, ACM Transactions on Software Engineering and Methodology.
features based on the frequency they appear in the top-10 lists of the four domains. Table 10 showsthe features that have appeared in the top-10 lists of at least two domains.
Table 9. Top-10 Most Important Features for Each Domain.
From Table 10, we can note that features across the four families, i.e., Network, Content, Profile,and GitHub are important in differentiating specialized software gurus from others. The featuresPosBio, SS(Signal Strength), NExpertFollowers, GhRepos, and NegWeb are present across at-least 3domains. However, only the Profile feature PosBio is present in top-5 ranks across the 3 domains. Inaddition to Pos Bio and NegWeb, other important Profile features are NegBio, and CosSimTweetText.Network features NExpertsFollowed and Friends are also present in the list for at-least 2 domains.
From Table 9 it can be observed the Profile features are the most frequent among Top-10 featuresand at relatively higher ranks. This is in line with the results observed in Table 8 where removingthe Profile category had caused the highest drop in F-Measure. The probabilities extracted fromuser’s webpage and biodata seem to have more discriminative power as compared to other features.Among Network features NExpertFollowers has the strongest impact. This makes sense as a userwho is followed by other experts is expected to have a high probability of being an expert.
RQ5: What is the cross domain performance of our approach?
This article has been accepted for publication in a future issue of this journal. Content may differ from final publication. Citation information: DOI10.1145/3266426, ACM Transactions on Software Engineering and Methodology.
This article has been accepted for publication in a future issue of this journal. Content may differ from final publication. Citation information: DOI10.1145/3266426, ACM Transactions on Software Engineering and Methodology.
Table 11. F-measure of Our Approach when Evaluated on Cross-Domain Setting
Motivation and Approach: There are many other software engineering domains aside from thefour considered in this work. Thus, we need to check if a model learned from one domain canpossibly be used to identify experts from another domain. To answer this research question weperform experiments in which we train our model based on training data from one domain andthen use this model to identify gurus in other domains.Results: Table 11 shows the performance of our model when trained on each domain and testedon each of the other three domains. We refer to this setting as cross-domain setting. On average weare able to achieve an F-Measure of 0.600 in the cross-domain setting. Note that our approach wasable to achieve an average F-Measure of 0.656 when the test and train data is from the same domain– see Table 6 (we refer to as within-domain setting). Thus, there is only a small drop in F-measure(i.e., 0.056), which shows that our approach is effective for cross-domain setting. Labeled data fromone domain can be used to build an effective model to predict experts from other domains withonly a small penalty in performance. In order to check if the F-Measure obtained in cross-domainresult is significantly different from F-Measure obtained in within-domain setting we performedthe Mann-Whitney U test [29] on the means of F-Measures obtained in cross-domain setting andwithin-domain setting. The test gave a p-value of 0.055, which is greater than 0.05, based on whichwe can say that there is no statistical difference between the within-domain and cross-domainresults.For cross-domain setting, it can be observed that the performance of our approach for domain
Linux when it is trained using data from domain Android is quite low, despite both being operatingsystems. To understand the reason behind this observation, we compare the contents of tweets
This article has been accepted for publication in a future issue of this journal. Content may differ from final publication. Citation information: DOI10.1145/3266426, ACM Transactions on Software Engineering and Methodology.
This article has been accepted for publication in a future issue of this journal. Content may differ from final publication. Citation information: DOI10.1145/3266426, ACM Transactions on Software Engineering and Methodology.
in our Linux and Android datasets. We find that the vocabulary used by Linux experts is ratherdifferent than that used by Android experts. Most Android tweets are at the application level (e.g.,how to validate Android in-app subscription purchase) while Linux tweets are at the system level(e.g., how to enable AES-NI advanced encryption on Linux system).
6.4 Threats to ValidityThreats to internal validity relate to errors in our experiments and our labeling. We have checkedour code multiple times, still there could have been errors that we did not notice. At times it ishard for our user study participants to decide whether someone is an experienced domain-specificpractitioner or whether a set of tweets is helpful for others or not. To deal with such cases, weallow participants to choose the “Can’t Determine” option and omit those cases from our dataset toimprove the quality of the ground truth labels. We also measure the agreement rate among theparticipants. To do this, we have computed inter-rater agreement for the labeling task using themeasure of Cohen’s Kappa [11]. As can be seen from Table 4, except for the Linux dataset, theagreement is at least moderate. For the Linux dataset, the agreement is still fair. These results showthat the raters in general agree with one another; thus, the threat introduced due to disagreementamong raters is minimal. Our strategy of omitting “Can’t Determine” cases may bias the evaluationto easier cases. To investigate this threat, we have relooked into these “Can’t Determine” cases.We found that many of these cases are less interesting ones, e.g., such users often only post a fewdomain-related tweets, include little information in their profile, etc. They are less likely to beinteresting domain-experts to be followed.
Threats to external validity relate to the generalizability of our approach. To mitigate this threat,in this paper, we have evaluated our approach on Twitter users belonging to two domain types,i.e., programming languages (which include JavaScript and Python domains), and operating systems(which include Android and Linux domains). We have also run experiments to check for crossdomain performance to evaluate the generalizability of our approach. In the future, to furtherreduce the threats to external validity, we plan to evaluate our approach on even more domainsand domain types.The generalizability of our results may also be impacted by the use of GitHub features. Some
developers may not be using GitHub and for them we will not have their GitHub features. For suchcases the performance of our approach may be slightly lower, as removing the GitHub featurescauses a drop of about 2.74% (see Table 8). It is possible to extract similar features from other codingwebsites such as BitBucket which we leave as future work. We focus on GitHub in our work as itis currently the most popular social coding platform and is also growing fast17. In our dataset ofTwitter users used for experiments, 18.89% (116/614) of them have GitHub links in their profiles.On the other hand, only 1.14% (7/614) users have BitBucket links in their profiles. Note that thecollection of users in our dataset is not biased in any way towards GitHub18. Many past studieshave also focused on GitHub due to its popularity [41, 45, 48, 49, 57, 58].Another factor that may impact the generalizability of our results may be the use of threshold
values that are used to determine domain experts. As mentioned in Section 6.1, in this work weidentify gurus among users who post more than 10 domain-related tweets. To check the impactof this number we evaluated the performance of our expert identification approach among userswho post more than 20 or 30 domain-related tweets. We find that there is only small change inthe F-Measure (an increase in F-Measure by 0.5-4.3% when we increase the threshold to a higher17https://octoverse.github.com/18The users in our dataset are collected by initially merging several seed lists of popular software developers present onTwitter. The resultant combined set is then expanded to include users who are followed or follow a certain number of usersin the combined set - c.f., Section 5
This article has been accepted for publication in a future issue of this journal. Content may differ from final publication. Citation information: DOI10.1145/3266426, ACM Transactions on Software Engineering and Methodology.
This article has been accepted for publication in a future issue of this journal. Content may differ from final publication. Citation information: DOI10.1145/3266426, ACM Transactions on Software Engineering and Methodology.
Table 12. Feature Strength vs Classification Approach
Classification Approach FeaturesAll Features Content Only
number) provided that the remaining number of data points left after filtering at higher thresholdlevels is at least 50. If we have few data points left after filtering, then the classifier is not ableto learn a good model -- which is as expected. Also, by default for Klout we use a KloutScorethreshold of 0.99. We checked for change in its performance if the threshold is decreased below0.99. We found little change in performance (a decrease in F-Measure by 0-1.21%) when we varythe threshold from 0.75 to 0.99 (using a step of 0.03).
Threats to construct validity relates to the suitability of our evaluation metric. In this paper, weuse precision, recall, and F-Measure. These metrics are well-known and have been used in manypast studies, e.g., [23, 63, 67]. To further investigate the effectiveness of our proposed approach, weperform a user study among some Android developers, to check if they accept the recommendationsgenerated by our approach and the baselines. The details of the study are discussed in Section 7.2.The study finds the recommendations provided by our approach are at least 25.93% more accuratethan the baselines.
7 DISCUSSION7.1 Benefits of Adding New Features and Employing Our New Classification MethodIn our work, we have proposed three new categories of features as well as a two-stage classificationapproach. Here, we perform experiments to evaluate the individual contribution of the set ofnew features and the new classification approach in achieving better performance over baselines.Specifically, we check the performance of our two-stage classification approach on only the Contentfeatures, and also the performance of baseline approach on all features combined.Table 12 shows the results of our experiments. From Table 12 we observe that a combination
of our two-stage classification approach and all the features can achieve an F-Measure of 0.656.However, when we run our two-stage classification approach on only Content features the F-Measure drops down to 0.167. This shows without the new category of features our two-stageclassification approach is not able to achieve good performance. Next, we evaluate the performanceof two variants of Pal and Counts [33] approach using features from all categories. Table 12 showsthat the F-Measure drops down to 0.497 for PCEv baseline variant and 0.403 for PCT r+Ev variant.This shows that our two-stage classification approach is able to achieve better performance overthe baseline approach of Pal and Counts [33] when all the features are used.
7.2 Do developers follow recommendations provided by our approach?We conduct a user study to compare the performance of our approach with the baseline approaches.For this purpose, we use a dataset of Twitter users belonging to “Android" domain that we havecollected earlier – see Table 5. We divide this dataset into 2 approximately equal-sized subsets. Werandomly choose one of them for training and the other one to generate recommendations from.We ran our proposed approach and the baselines, i.e., Klout , PCEv , and PCT r+Ev , on this dataset
After we have the results from all the 4 approaches, we chose the top-3 users returned by eachapproach and randomly mixed them together and removed duplicates. These users were then
This article has been accepted for publication in a future issue of this journal. Content may differ from final publication. Citation information: DOI10.1145/3266426, ACM Transactions on Software Engineering and Methodology.
This article has been accepted for publication in a future issue of this journal. Content may differ from final publication. Citation information: DOI10.1145/3266426, ACM Transactions on Software Engineering and Methodology.
shown to some Android developers. For each user, the user’s Twitter profile as well as latest tweetswere shown to the developers. A single question was asked about each user to each developer; thequestion being: “Are you interested in following the above Twitter account, so that following itmay help you in getting updated information related to Android programming?". As an answerto this question, each developer was asked to choose one out of the following three options: “(A)NO, I am not interested to follow the account shown above", “(B) YES, I am interested to followthe account shown above", and “(C) I already follow the account shown above". To get Androiddevelopers as participants of our user study, we randomly browsed for relevant accounts on Twitter.Next, the first author of the paper personally contacted each of them through Twitter messagingservice. This process is similar to the process used for contacting developers for the initial surveyas described in Section 3. We managed to attract 10 developers who agreed to participate in ouruser study.
Table 13. Converting Answers to Ratings
Answer Chosen RatingNO, I am not interested to follow the account shown above 0I already follow the account shown above 1YES, I am interested to follow the account shown above 1
The answers provided by each user were converted into binary ratings following the conversiontable shown in Table 13. To evaluate the results of our user study, we make use of NormalizedDiscounted Cumulative Gain (NDCG) [19]. NDCG is commonly used to measure the performanceof information retrieval and recommendation systems [25]. The value of the NDCG metric variesfrom 0 to 1, with 1 representing the ideal ordering. The following equation is used to computeNDCG, where reli is the rating assessment provided by a user at position i in the ranking:
NDCG@3 = 1IDCG
3∑i=1
reliloд(i + 1)
Table 14 shows the results of our user study for each of the four approaches (ours and the 3baselines). We can see from Table 14 that the NDCG score of our proposed approach is 0.68 whichis the highest when compared to baselines. In terms of NDCG, our approach outperforms Klout,PCT r+Ev , and PCEv by 58.14%, 25.93%, and 25.93% respectively. The results of the user study furtherhighlight the effectiveness of our proposed approach in recommending domain experts.
7.3 Lessons LearnedWe share some points below that may be helpful to researchers interested in exploring problemssimilar to what has been done in this work:
This article has been accepted for publication in a future issue of this journal. Content may differ from final publication. Citation information: DOI10.1145/3266426, ACM Transactions on Software Engineering and Methodology.
This article has been accepted for publication in a future issue of this journal. Content may differ from final publication. Citation information: DOI10.1145/3266426, ACM Transactions on Software Engineering and Methodology.
• Design effective and comprehensive features: Every dataset, platform, and problem is different.To recommend experts on Twitter, we designed a comprehensive set of features by analyzingthe nature of the problem and data that we have. This results in the construction of a moreeffective recommendation system. Based on this experience, we recommend future studies,especially those that build recommendation systems for a new dataset or problem, to look intounique characteristics of the data and problem. A good understanding of these characteristicsis needed to create new features that would be instrumental in construction of effectiverecommendation systems. Having effective features can be more important than deployingmore powerful machine learning algorithms in terms of their impact on recommendationquality.• Incorporate external resources: In our study, we find that features extracted from linkedexternal resources such as personal web pages of users and GitHub profiles help in improvingrecommendation quality. Thus, researchers interested in solving similar problems may wantto go beyond data coming from one source. Linked external resources can provide additionalinsights into the problem at hand.• Disseminate survey strategically: Researchers often email their surveys to developers presenton GitHub [45, 49, 65]. While this method may work well and can result in response ratesgreater than 15%, but sometimes in cases where the study focus is a specific software en-gineering community, the response rates may go down. This is the case of a recent studyfocusing on Slack [24] where the response rate was 7.84% (51/650). In our initial survey,we received a poor response rate of less than 10% when we contacted GitHub developersrandomly sampled from GHTorrent [15]. This may have happened as the sample chosenfrom GitHub may not have been representative of developers who use Twitter. Based on thisoutcome, we started a brand new survey and contacted developers who were actually presenton Twitter, using personalized Twitter messages. The procedure is described in Section 3.This time the response rate improved to 17.84%. Thus, one of the takeaways from our workis that if the research problem being addressed caters to a specific software engineeringcommunity, sampling should be done from a population of that specific community only.Additionally, instead of mass-mailing developers, personally contacting developers usingchannels often used by members of the target community, e.g., Twitter direct messaging inour case, also helps in achieving more responses.
8 CONCLUSION AND FUTUREWORKTwitter is becoming increasingly popular these years and has changed the way people share infor-mation and collaborate with one another. Singer et al. report that software developers use Twitterto get awareness of people and trends, extend their technical knowledge, and build connectionswith other developers. They also report that it is challenging for developers to find interesting usersto follow [45]. To better understand developers’ needs, we first conduct an online survey with 38developers. For those who use Twitter in their software development activities, we ask the kinds ofusers they would like to follow to help in their software development activities. The results of oursurvey show that most developers would like to follow specialized software gurus, e.g., experts inPython. Based on the survey result, we propose a new approach that can automatically recommendsoftware gurus of a specialized domain (e.g., Python).Our approach makes use of 32 features from four dimensions (i.e., Content, Network, Profile
and GitHub) to characterize a Twitter user. It then uses a two-stage classification technique whichanalyzes a set of labeled training data to create a discriminative model that can differentiatespecialized software gurus from other domain-related Twitter users. In our experiment, we haveevaluated our approach to classify domain-related Twitter users from four domains, i.e., JavaScript,
This article has been accepted for publication in a future issue of this journal. Content may differ from final publication. Citation information: DOI10.1145/3266426, ACM Transactions on Software Engineering and Methodology.
This article has been accepted for publication in a future issue of this journal. Content may differ from final publication. Citation information: DOI10.1145/3266426, ACM Transactions on Software Engineering and Methodology.
Android, Python, and Linux, into two categories (specialized gurus and others). The experimentresults show that our approach can achieve F-measure scores of 0.522-0.820 on the four domains.Our approach can improve the F-measures achieved by baseline approaches [33, 38] by at least7.63%.
As a future work, we plan to consider more tweets and domain-related users, and evaluate ourmodel on more domains in addition to the four considered in this work. We also plan to build anddeploy a live system (e.g., as a website or an Android app) that can continuously extract data fromTwitter and recommend domain-specific experts and promote this system to developers. We alsoplan to do studies to understand what kind of Twitter accounts developers tend to unfollow afterfollowing them for some time. Understanding characteristics of such accounts can help us build asystem to recommend potential accounts to unfollow and thus better help developers in carefullycurating the list of accounts they follow.
ACKNOWLEDGMENTSThis research is supported by the National Research Foundation, Prime Minister’s Office, Singaporeunder its International Research Centres in Singapore Funding Initiative.
REFERENCES[1] Palakorn Achananuparp, Ibrahim Nelman Lubis, Yuan Tian, David Lo, and Ee-Peng Lim. 2012. Observatory of trends
in software related microblogs. In Proceedings of the 27th IEEE/ACM International Conference on Automated SoftwareEngineering. ACM, 334–337.
[2] Maurício Aniche, Christoph Treude, Igor Steinmacher, IgorWiese, Gustavo Pinto, Margaret-Anne Storey, andMarco Au-rélio Gerosa. 2018. How Modern News Aggregators Help Development Communities Shape and Share Knowledge.(2018).
[3] John Anvik, Lyndon Hiew, and Gail C Murphy. 2006. Who should fix this bug?. In Proceedings of the 28th internationalconference on Software engineering. ACM, 361–370.
[4] John Anvik and Gail C Murphy. 2007. Determining implementation expertise from bug reports. In Proceedings of theFourth International Workshop on Mining Software Repositories. IEEE Computer Society, 2.
[5] Gargi Bougie, Jamie Starke, Margaret-Anne Storey, and Daniel M German. 2011. Towards understanding twitter usein software engineering: preliminary findings, ongoing challenges and future questions. In Proceedings of the 2ndinternational workshop on Web 2.0 for software engineering. 31–36.
[6] Ulrik Brandes. 2008. On variants of shortest-path betweenness centrality and their generic computation. SocialNetworks 30, 2 (2008), 136–145.
[7] Lars Buitinck, Gilles Louppe, Mathieu Blondel, Fabian Pedregosa, Andreas Mueller, Olivier Grisel, Vlad Niculae, PeterPrettenhofer, Alexandre Gramfort, Jaques Grobler, Robert Layton, Jake VanderPlas, Arnaud Joly, Brian Holt, and GaëlVaroquaux. 2013. API design for machine learning software: experiences from the scikit-learn project. In ECML PKDDWorkshop: Languages for Data Mining and Machine Learning. 108–122.
[8] John L Campbell, Charles Quincy, Jordan Osserman, and Ove K Pedersen. 2013. Coding in-depth semistructuredinterviews: Problems of unitization and intercoder reliability and agreement. Sociological Methods & Research 42, 3(2013), 294–320.
[9] Shuo Chang and Aditya Pal. 2013. Routing questions for collaborative answering in community question answering.In Proceedings of the 2013 IEEE/ACM International Conference on Advances in Social Networks Analysis and Mining.ACM, 494–501.
[10] Morakot Choetkiertikul, Daniel Avery, Hoa Khanh Dam, Truyen Tran, and Aditya Ghose. 2015. Who Will Answer MyQuestion on Stack Overflow?. In Software Engineering Conference (ASWEC), 2015 24th Australasian. IEEE, 155–164.
[11] Jacob Cohen. 1960. A coefficient of agreement for nominal scales. Educational and psychological measurement 20, 1(1960), 37–46.
[12] Juliet Corbin, Anselm Strauss, and Anselm L Strauss. 2014. Basics of qualitative research. Sage.[13] Linton C Freeman. 1979. Centrality in social networks conceptual clarification. Social networks 1, 3 (1979), 215–239.[14] GitHub. 2015. About GitHub Inc. https://github.com/about/press. (2015). [Online; accessed 27-Aug-2015].[15] Georgios Gousios. 2013. The GHTorrent dataset and tool suite. In Proceedings of the 10th Working Conference on Mining
Software Repositories (MSR ’13). IEEE Press, Piscataway, NJ, USA, 233–236.[16] Emitza Guzman, Rana Alkadhi, and Norbert Seyff. 2016. A needle in a haystack: What do twitter users say about
This article has been accepted for publication in a future issue of this journal. Content may differ from final publication. Citation information: DOI10.1145/3266426, ACM Transactions on Software Engineering and Methodology.
This article has been accepted for publication in a future issue of this journal. Content may differ from final publication. Citation information: DOI10.1145/3266426, ACM Transactions on Software Engineering and Methodology.
[17] Chaoran Huang, Lina Yao, Xianzhi Wang, Boualem Benatallah, and Quan Z Sheng. 2017. Expert as a Service: SoftwareExpert Recommendation via Knowledge Domain Embeddings in Stack Overflow. InWeb Services (ICWS), 2017 IEEEInternational Conference on. IEEE, 317–324.
[18] William Hudson. 2013. Card sorting. The Encyclopedia of Human-Computer Interaction, 2nd Ed. (2013).[19] Kalervo Järvelin and Jaana Kekäläinen. 2002. Cumulated gain-based evaluation of IR techniques. ACM Transactions on
Information Systems (TOIS) 20, 4 (2002), 422–446.[20] Miryung Kim, Thomas Zimmermann, Robert DeLine, and Andrew Begel. 2016. The emerging role of data scientists
on software development teams. In Proceedings of the 38th International Conference on Software Engineering. ACM,96–107.
[21] Miryung Kim, Thomas Zimmermann, Robert DeLine, and Andrew Begel. 2017. Data Scientists in Software Teams:State of the Art and Challenges. IEEE Transactions on Software Engineering (2017).
[22] Haewoon Kwak, Changhyun Lee, Hosung Park, and Sue B. Moon. 2010. What is Twitter, a social network or a newsmedia?. In Proceedings of the 19th International Conference on World Wide Web, WWW 2010, Raleigh, North Carolina,USA, April 26-30, 2010. 591–600.
[23] Alina Lazar, Sarah Ritchey, and Bonita Sharif. 2014. Improving the accuracy of duplicate bug report detection usingtextual similarity measures. In Proceedings of the 11th Working Conference on Mining Software Repositories. ACM,308–311.
[24] Bin Lin, Alexey Zagalsky, Margaret-Anne Storey, and Alexander Serebrenik. 2016. Why developers are slacking off:Understanding how software teams use slack. In Proceedings of the 19th ACM Conference on Computer SupportedCooperative Work and Social Computing Companion. ACM, 333–336.
[25] Tie-Yan Liu. 2011. Learning to rank for information retrieval. Springer Science & Business Media.[26] David Lo, Nachiappan Nagappan, and Thomas Zimmermann. 2015. How practitioners perceive the relevance of
software engineering research. In Proceedings of the 2015 10th Joint Meeting on Foundations of Software Engineering.ACM, 415–425.
[27] David Ma, David Schuler, Thomas Zimmermann, and Jonathan Sillito. 2009. Expert recommendation with usageexpertise. In Software Maintenance, 2009. ICSM 2009. IEEE International Conference on. IEEE, 535–538.
[28] Laura MacLeod, Margaret-Anne Storey, and Andreas Bergen. 2015. Code, camera, action: how software developersdocument and share program knowledge using YouTube. In Proceedings of the 2015 IEEE 23rd International Conferenceon Program Comprehension. IEEE Press, 104–114.
[29] Henry B Mann and Donald R Whitney. 1947. On a test of whether one of two random variables is stochastically largerthan the other. The annals of mathematical statistics (1947), 50–60.
[30] Christopher D. Manning, Prabhakar Raghavan, and Hinrich SchÃijtze. 2008. Introduction to Information Retrieval.Cambridge University Press.
[31] Mary L McHugh. 2012. Interrater reliability: the kappa statistic. Biochemia medica 22, 3 (2012), 276–282.[32] Lawrence Page, Sergey Brin, Rajeev Motwani, and Terry Winograd. 1999. The PageRank citation ranking: Bringing
order to the web. (1999).[33] Aditya Pal and Scott Counts. 2011. Identifying topical authorities in microblogs. In Proceedings of the fourth ACM
international conference on Web search and data mining. ACM, 45–54.[34] F. Pedregosa, G. Varoquaux, A. Gramfort, V. Michel, B. Thirion, O. Grisel, M. Blondel, P. Prettenhofer, R. Weiss, V.
Dubourg, J. Vanderplas, A. Passos, D. Cournapeau, M. Brucher, M. Perrot, and E. Duchesnay. 2011. Scikit-learn: MachineLearning in Python. Journal of Machine Learning Research 12 (2011), 2825–2830.
[35] Luca Ponzanelli, Gabriele Bavota, AndreaMocci, Massimiliano Di Penta, Rocco Oliveto, Mir Hasan, Barbara Russo, SoniaHaiduc, and Michele Lanza. 2016. Too long; didn’t watch!: extracting relevant fragments from software developmentvideo tutorials. In Proceedings of the 38th International Conference on Software Engineering. ACM, 261–272.
[36] Martin F Porter. 1980. An algorithm for suffix stripping. Program 14, 3 (1980), 130–137.[37] Philips Kokoh Prasetyo, David Lo, Palakorn Achananuparp, Yuan Tian, and Ee-Peng Lim. 2012. Automatic classification
of software related microblogs. In ICSM. 596–599.[38] Adithya Rao, Nemanja Spasojevic, Zhisheng Li, and Trevor DSouza. 2015. Klout score: Measuring influence across
multiple social networks. In Big Data (Big Data), 2015 IEEE International Conference on. IEEE, 2282–2289.[39] Johnny Saldaña. 2015. The coding manual for qualitative researchers. Sage.[40] Gustavo Santos, Klérisson VR Paixão, Nicolas Anquetil, Anne Etien, Marcelo de Almeida Maia, and Stéphane Ducasse.
2017. Recommending source code locations for system specific transformations. In Software Analysis, Evolution andReengineering (SANER), 2017 IEEE 24th International Conference on. IEEE, 160–170.
[41] Abhishek Sharma, Ferdian Thung, Pavneet Singh Kochhar, Agus Sulistya, and David Lo. 2017. Cataloging githubrepositories. In Proceedings of the 21st International Conference on Evaluation and Assessment in Software Engineering.ACM, 314–319.
This article has been accepted for publication in a future issue of this journal. Content may differ from final publication. Citation information: DOI10.1145/3266426, ACM Transactions on Software Engineering and Methodology.
This article has been accepted for publication in a future issue of this journal. Content may differ from final publication. Citation information: DOI10.1145/3266426, ACM Transactions on Software Engineering and Methodology.
[42] Abhishek Sharma, Yuan Tian, and David Lo. 2015. NIRMAL: Automatic identification of software relevant tweetsleveraging language model. In Software Analysis, Evolution and Reengineering (SANER), 2015 IEEE 22nd InternationalConference on. IEEE, 449–458.
[43] Abhishek Sharma, Yuan Tian, and David Lo. 2015. What’s hot in software engineering Twitter space?. In SoftwareMaintenance and Evolution (ICSME), 2015 IEEE International Conference on. IEEE, 541–545.
[44] Abhishek Sharma, Yuan Tian, Agus Sulistya, David Lo, and Aiko Fallas Yamashita. 2017. Harnessing Twitter tosupport serendipitous learning of developers. In Software Analysis, Evolution and Reengineering (SANER), 2017 IEEE24th International Conference on. IEEE, 387–391.
[45] Leif Singer, Fernando Marques Figueira Filho, and Margaret-Anne D. Storey. 2014. Software engineering at the speedof light: how developers stay current using twitter. In 36th International Conference on Software Engineering, ICSE ’14,Hyderabad, India - May 31 - June 07, 2014. 211–221.
[46] Edward K Smith, Christian Bird, and Thomas Zimmermann. 2015. Build it yourself!: homegrown tools in a largesoftware company. In Proceedings of the 37th International Conference on Software Engineering - Volume 1. IEEE Press,369–379.
[47] Nemanja Spasojevic, Jinyun Yan, Adithya Rao, and Prantik Bhattacharyya. 2014. Lasta: Large scale topic assignmenton multiple social networks. In Proceedings of the 20th ACM SIGKDD international conference on Knowledge discoveryand data mining. ACM, 1809–1818.
[48] Margaret-Anne Storey, Leif Singer, Brendan Cleary, Fernando Figueira Filho, and Alexey Zagalsky. 2014. The (r)evolution of social media in software engineering. In Proceedings of the on Future of Software Engineering. ACM,100–116.
[49] Margaret-Anne Storey, Alexey Zagalsky, Fernando Figueira Filho, Leif Singer, and Daniel M German. 2017. How socialand communication channels shape and challenge a participatory culture in software development. IEEE Transactionson Software Engineering 43, 2 (2017), 185–204.
[50] Anselm Strauss and Juliet M Corbin. 1997. Grounded theory in practice. Sage.[51] Yuan Tian, Palakorn Achananuparp, Ibrahim Nelman Lubis, David Lo, and Ee-Peng Lim. 2012. What does software
engineering community microblog about?. In MSR. 247–250.[52] Yuan Tian and David Lo. 2014. An Exploratory Study on Software Microblogger Behaviors. In MUD.[53] Yuan Tian, David Lo, and Julia Lawall. 2014. Automated construction of a software-specific word similarity database.
In Software Maintenance, Reengineering and Reverse Engineering (CSMR-WCRE), 2014 Software Evolution Week-IEEEConference on. IEEE, 44–53.
[54] Twitter. 2017. About Twitter Inc. https://about.twitter.com/company. [Online; accessed 26-July-2017].[55] Gias Uddin and Foutse Khomh. 2017. Automatic summarization of API reviews. In Automated Software Engineering
(ASE), 2017 32nd IEEE/ACM International Conference on. IEEE, 159–170.[56] Harold Valdivia Garcia and Emad Shihab. 2014. Characterizing and predicting blocking bugs in open source projects.
In Proceedings of the 11th Working Conference on Mining Software Repositories. ACM, 72–81.[57] Bogdan Vasilescu, Kelly Blincoe, Qi Xuan, Casey Casalnuovo, Daniela Damian, Premkumar Devanbu, and Vladimir
Filkov. 2016. The Sky is Not the Limit: Multitasking on GitHub Projects. In International Conference on SoftwareEngineering (ICSE). ACM, 994–1005. https://doi.org/10.1145/2884781.2884875
[58] Bogdan Vasilescu, Vladimir Filkov, and Alexander Serebrenik. 2013. StackOverflow and GitHub: Associations betweensoftware development and crowdsourced knowledge. In Social computing (SocialCom), 2013 international conference on.IEEE, 188–195.
[59] Anthony J Viera, Joanne M Garrett, et al. 2005. Understanding interobserver agreement: the kappa statistic. Fam Med37, 5 (2005), 360–363.
[60] Xiaofeng Wang, I. Kuzmickaja, K.-J. Stol, P. Abrahamsson, and B. Fitzgerald. 2013. Microblogging in Open SourceSoftware Development: The Case of Drupal and Twitter. Software, IEEE (2013).
[61] Scott White and Padhraic Smyth. 2003. Algorithms for estimating relative importance in networks. In Proceedings ofthe ninth ACM SIGKDD international conference on Knowledge discovery and data mining. ACM, 266–275.
[62] Xin Xia, David Lo, Ying Ding, Jafar M Al-Kofahi, Tien N Nguyen, and Xinyu Wang. 2017. Improving automated bugtriaging with specialized topic model. IEEE Transactions on Software Engineering 43, 3 (2017), 272–297.
[63] Xin Xia, David Lo, Emad Shihab, Xinyu Wang, and Xiaohu Yang. 2015. ELBlocker: Predicting Blocking Bugs WithEnsemble Imbalance Learning. Information and Software Technology (2015).
[64] Xin Xia, David Lo, Xinyu Wang, and Bo Zhou. 2015. Dual analysis for recommending developers to resolve bugs.Journal of Software: Evolution and Process 27, 3 (2015), 195–220.
[65] Yangyang Zhao, Alexander Serebrenik, Yuming Zhou, Vladimir Filkov, and Bogdan Vasilescu. 2017. The impact ofcontinuous integration on other software development practices: a large-scale empirical study. In Proceedings of the32nd IEEE/ACM International Conference on Automated Software Engineering. IEEE Press, 60–71.
This article has been accepted for publication in a future issue of this journal. Content may differ from final publication. Citation information: DOI10.1145/3266426, ACM Transactions on Software Engineering and Methodology.
This article has been accepted for publication in a future issue of this journal. Content may differ from final publication. Citation information: DOI10.1145/3266426, ACM Transactions on Software Engineering and Methodology.
[66] Pingyi Zhou, Jin Liu, Zijiang Yang, and Guangyou Zhou. 2017. Scalable tag recommendation for software informationsites. In Software Analysis, Evolution and Reengineering (SANER), 2017 IEEE 24th International Conference on. IEEE,272–282.
[67] Yu Zhou, Yanxiang Tong, Ruihang Gu, and Harald Gall. 2014. Combining Text Mining and Data Mining for Bug ReportClassification. In Software Maintenance and Evolution (ICSME), 2014 IEEE International Conference on. IEEE, 311–320.
Received June 2016; revised November 2017; revised March 2018; accepted July 2018
This article has been accepted for publication in a future issue of this journal. Content may differ from final publication. Citation information: DOI10.1145/3266426, ACM Transactions on Software Engineering and Methodology.