Reconnaissance Shallow Seismic Investiga tion of Depth-to-Bedrock and Possible Meth ane-bearing Coalbeds, Galena, Alaska by W. J. Stephenson, R. A. Williams, J. K. Odum, C. E. Barker, D. M. Worley, A. C. Clark, and J.G. Clough Open File Report 02-450 Galena from an airplane Yukon River at sunset Shotpoint “blowout” during seismic acquisition 2002 This report is preliminary and has not been reviewed for conformity with U.S. Geological Survey editorial standards nor with the North American Stratigraphic Code. Any use of trade names in this publication is for descriptive purposes only and does not imply endorsement by the U.S. Gov ernment U.S. DEPARTMENT OF THE INTERIOR U.S. GEOLOGICAL SURVEY
Transcript
Reconnaissance Shallow Seismic Investigation of Depth-to-Bedrock and Possible Methane-bearing Coalbeds, Galena, Alaska
by W. J. Stephenson, R. A. Williams, J. K. Odum, C. E. Barker, D. M. Worley, A. C. Clark, and J.G. Clough
Open File Report 02-450
Galena from an airplane
Yukon River at sunset
Shotpoint “blowout” during seismic acquisition2002
This report is preliminary and has not been reviewed for conformity with U.S. Geological Survey editorial standards nor with the North American Stratigraphic Code. Any use of trade names in this publication is for descriptive purposes only and does not imply endorsement by the U.S. Government
U.S. DEPARTMENT OF THE INTERIOR U.S. GEOLOGICAL SURVEY
RECONNAISSANCE SHALLOW SEISMIC INVESTIGATION OF DEPTH-TO-BEDROCK AND POSSIBLE METHANE-BEARING COALBEDS, GALENA,
ALASKA
by
W. J. Stephenson1, R. A. Williams1, J. K. Odum1, C. E. Barker2,
D. M. Worley1, A. C. Clark3, and J.G. Clough4
1U.S. Geological SurveyGeologic Hazards Team, Central Region
Box 25046, MS 966Denver, Colorado 80225-0046
2U.S. Geological SurveyEnergy Team, Central Region
Box 25046, MS 977Denver, Colorado 80225
3U.S. Geological SurveyWater Resources Discipline, Central Region
Box 25046Denver, Colorado 80225
4Alaska Division of Geological and Geophysical Surveys794 University Ave., Suite 200
Fairbanks, AK 99709-3645
This report is preliminary and has not been reviewed for conformity with U.S. Geological Survey editorial standards nor with the North American Stratigraphic Code. Any use of trade names in this publication is for descriptive purposes only and does not imply endorsement by the U.S. Government
ABSTRACT A reconnaissance shallow seismic reflection/refraction investigation in and around
the city of Galena, Alaska suggests that Tertiary and/or Cretaceous bedrock, and possible
coalbeds within the Cretaceous, is at least as deep as 550 feet in the immediate vicinity of
town. Rock could be deeper than 1000 feet under alternate interpretations. Reflections
recorded in these data are believed to be from the sediment/bedrock interface. Analysis
of these reflections and associated refractions indicates that this interface, interpreted at
most of the six profile locations, has a high seismic velocity, possibly indicating non-
sedimentary rock (e.g. volcanic or igneous).
INTRODUCTION The City of Galena, Alaska, has interest in obtaining a local methane gas supply to
supplement their heating and electrical needs. It has been proposed that Cretaceous
coalbeds, observed in outcrop at Hartnet Island, roughly 12 miles east of Galena and
roughly 20 to 30 miles west of Galena near Koyukuk and Nulato, might provide a source
of methane gas. However, the depth of these possible coalbeds beneath the city is critical
to determine their viability as an economic methane source. Without knowing the total
thickness of the late-Tertiary (?) to Quaternary section, the total depth to Cretaceous strata
and thus a drilling method cannot be determined. To help estimate the possible drilling
depth to Cretaceous and older rock, we acquired high-resolut ion seismic
reflection/refraction data at six sites in and near the city of Galena (Figure 1). These data
provide information on depths to reflecting geologic boundaries that may be the
sediment/bedrock boundary.
1
Pro
file
4
Pro
file
5
Pro
file
6
Pro
file
2 P
rofil
e 3
Pro
file1
Gal
ena
Red
line
s ar
e ap
prox
imat
e lo
catio
ns o
f 60
rec
eive
rs
Star
s ar
e lo
catio
ns o
f se
ism
ic s
hot p
oint
s of
f pr
ofile
1 m
ile
Map
bas
e is
USG
S 1:
63,3
60 N
ulat
o Q
uadr
angl
e.
Map
of
City
of
Gal
ena,
Ala
ska,
and
sei
smic
pro
file
loca
tions
. fo
r ea
ch o
f si
x pr
ofile
s (r
ecei
vers
spa
ced
10 m
apa
rt a
long
eac
h pr
ofile
).
ends
, whi
ch w
ere
need
ed f
or d
eepe
r co
vera
ge.
Figu
re 1
.
2
GEOLOGIC SETTING Based on published geologic information (Bradley, 1938; Pewe, 1948; Cass, 1959;
Patton and Hoare, 1968; Nakanishi and Dorava, 1994) and field evidence (C. Barker,
unpublished data), we make the following observations: 1) The Cretaceous section in the
Galena area, based on aeromagnetic response, is on the order of several thousand feet
thick; 2) Regionally, the Upper Cretaceous strata contain approximately 800 ft. of coal-
bearing strata. As this unit is poorly exposed in outcrop, the cumulative thickness of
coalbeds in this unit is unknown; 3) Much of the Cretaceous section is non-coal bearing
and significant erosion of the upper part of this section would likely remove the coal-
bearing unit; 4) Coal-bearing rocks are mapped as exposed in the banks of the Yukon
River on either side of Galena, at Hartnet Island some 12 miles east of Galena and some
20 to 30 miles west of Galena near Koyukuk and Nulato; 5) Coals in the Koyukuk and
Nulato areas exist as discontinuous pods rather than as laterally extensive seams; 6) The
coal bed exposed at Hartnet Island is approximately 9 feet thick and dips about 70° to the
southeast, away from the city of Galena; 7) There is also the possibility that coal deposited
in mid-Tertiary grabens is present beneath or near Galena.
From these observations, it is likely that Cretaceous or Tertiary rocks underlie
Galena beneath the near-surface late Tertiary(?) to Quaternary fluvial plain deposits of the
Yukon River. It is unknown whether the Cretaceous or Tertiary strata beneath Galena
contain coal. Because the coal-bearing section is in the uppermost Cretaceous section, it
is possible that it has been eroded away, possibly by the Yukon River in the late Tertiary(?)
to Quaternary. At least 360 feet of soft, water-saturated, fluvial and swamp-derived
sediments were penetrated without hitting the underlying Cretaceous unit in a water well
drilled by the City of Galena in 1998. No other deep drill hole information is known to
3
exist within the immediate area.
SEISMIC DATA ACQUISITION AND PROCESSING The signal we use in the seismic data to extract information, such as the depth of
the sediment/bedrock interface as well as general stratigraphic layering, is in the form of
reflected and refracted sound waves that are directly dependent on velocity (and density)
variations in the subsurface. The reflection amplitude is proportional to the velocity (and
density) contrast across the boundary. A diagram showing basic reflected and refracted
signal travel paths for a single seismic wave initiated at the surface is shown in Figure 2.
Depths are estimated by identifying the signal type and by analyzing signal travel times.
Inherent error in interpretation occurs because of our lack of knowledge of the velocity
structure and geometry of geologic layering. Noise recorded in the data from wind,
traffic, and electrical sources (60-Hz transformers, radio transmitters) also degrade data
quality and therefore the interpretation accuracy. Two types of seismic waves are
important for this study: compressional (or P)-waves, and shear (or S)-waves. S-waves
typically travel at 60% the velocity of P-waves. We designed our study to focus on P-
waves, and these are primarily what was recorded by our instrumentation. Unless
otherwise stated, all reference to seismic waves in the text will refer to P-waves.
The seismic reflection/refraction data were acquired at six sites over a five-day
acquisition period in September 2000 (Figure 1). The profiles are labeled from 1 to 6, and
were acquired at the following locations: 1) north of the Galena airport; 2) along the bike
path through the city of Galena; 3) roughly midway between Galena and the old Campion
air base; 4) old Campion air base; 5) north of the AM radio tower and south of Profile 4;
and 6) southwest of Profile 5 ending near the Yukon River. The general seismic
4
fShot point
evad w
aet
e r cDirect wave R
Reflected waves
ground surface
V1
V2
V3
V4
Figure 2. Simplified diagram of selected travel paths for a single seismic wave from a shot point at the ground surface. Velocities increase with depth (V4>V3>V2>V1) and no
refractions from the two deeper interfaces are shown. Seismic reflections are generated where velocity and material density changes across a boundary. Both P- and S-waves generate direct waves, reflections, and refractions
acquisition parameters for these profiles are listed in Table 1. Topographic survey data
were acquired by GPS. The accuracy of these survey data was poor, typically no better
than ± 15 ft, due to thick tree cover generally in the vicinity of the profiles (hence poor
satellite coverage).
Estimating the amount of Kinestik® seismic explosive used per source point in an
ad hoc manner was a primary acquisition difficulty. The farther from the receiver
locations, the more explosive was used, but sometimes the amount was underestimated
because of unknown local site conditions, making the seismic signal weak and therefore
5
difficult to analyze at farther receiver distances. Because of the reconnaissance nature of
the investigation and the limited budget, the explosives had to be carefully rationed and
therefore we rarely had the luxury of re-shooting a source point. Another major problem
we encountered was the source hole depth and diameter. The drilling rig provided by the
City of Galena drilled an excellent hole for charges of 1-pound and less. But for larger
charges, a smaller diameter hole and/or a deeper hole would have been advantageous
because the higher energy shots often “blew out” the recently excavated back-filled dirt.
The energy released during these blowouts dramatically decreased the energy sent into the
ground as seismic signal.
Table 1. Generalized Acquisition Parameters for Galena Seismic Data Parameter Description Source type Kinestik® seismic explosive Source size Single shot hole 6-8 feet deep with 1/3 to 4
pounds of explosives (dependent on distance to receivers)
Source point interval Relative to receiver spread: in the middle,16.4 ft off each end, 985 ft off each end, and 1970 ft off each end (when possible)
Receiver type 8-Hz resonant frequency, vertical component geophone
Receiver array Single geophone per station Shooting geometry 60 channels, deployed out as linearly as
possible. Sources as in-line as practical Station interval 32.8 ft Field filters 60 Hz notch Recording system Geometrics 60-channel StrataVisor Sampling rate 1 millisecond Recording time 2 seconds
Kinestik® is a registered trademark of Kinepak Corporation
Data processing was limited only to steps necessary to maximize coherent
reflection and refraction signals (Table 2). CDP stacking (i.e. to make a stacked seismic
section), a technique universally used in the oil industry, was unsuccessful at enhancing
6
these data. This was primarily because the very limited number of shot records obtained
did not yield adequate coverage for this technique. Some additional signal enhancement
was achieved by combining traces at similar source and receiver offsets from all shots at
each profile location (‘sort and stack’ step in Table 2). Shot records prior to this final
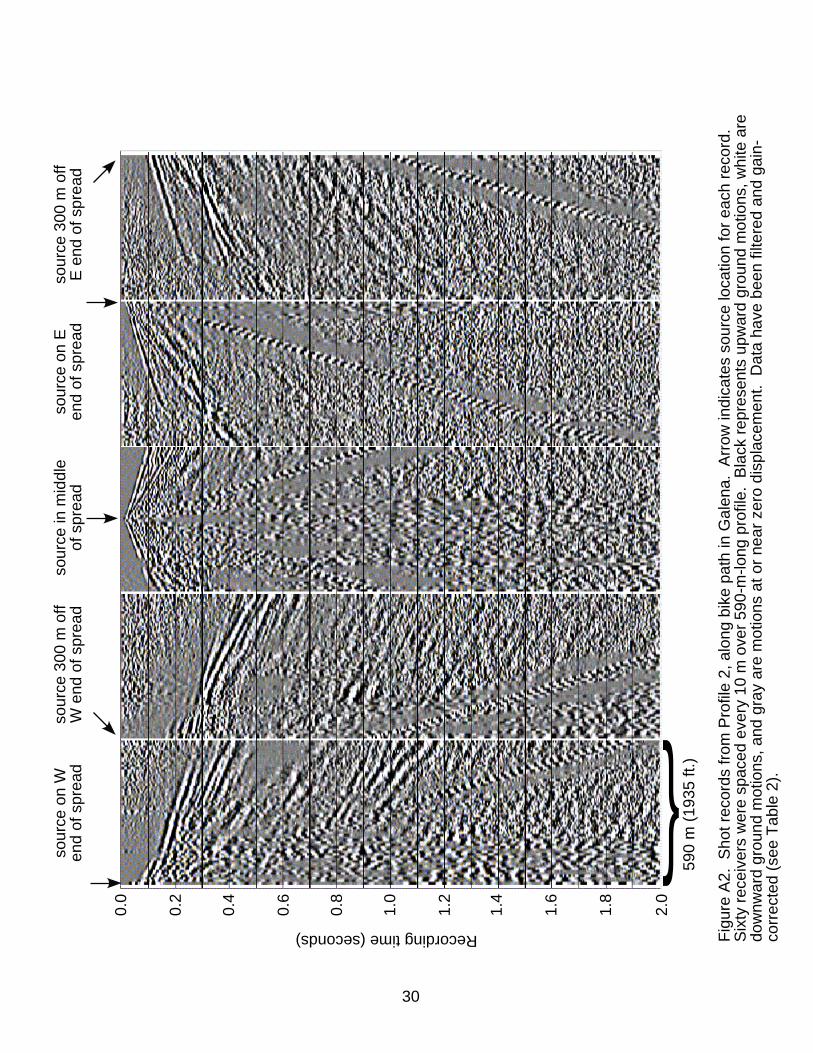
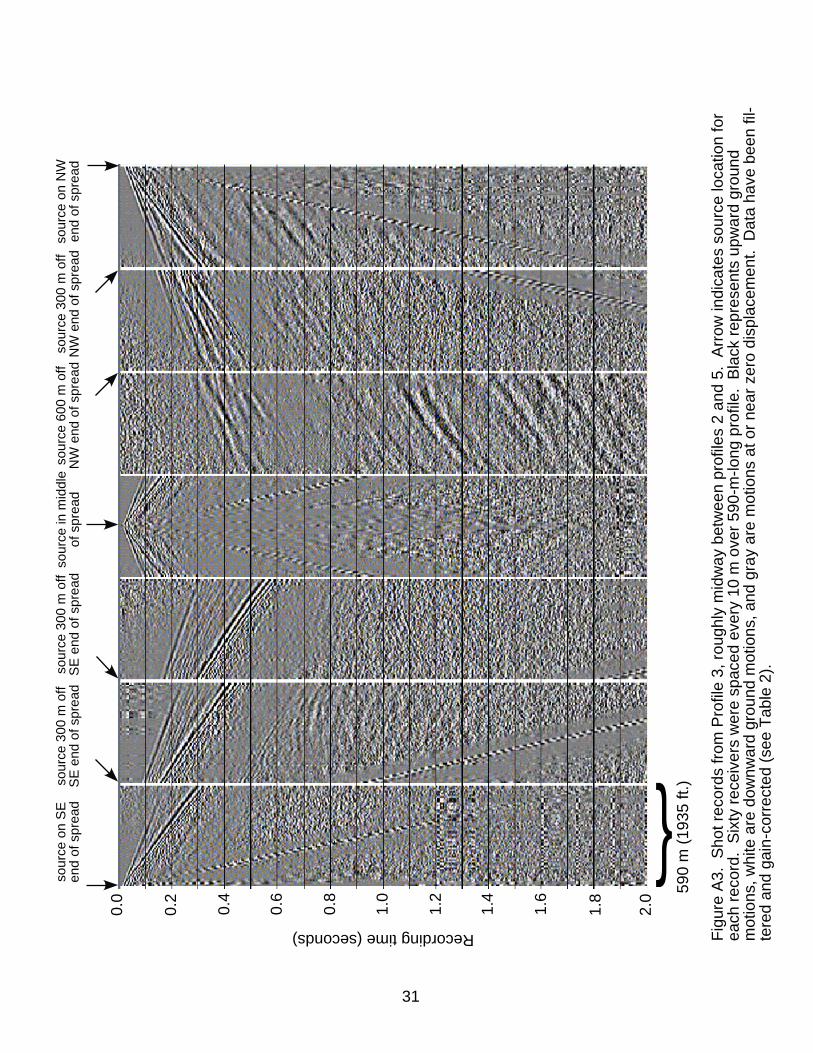
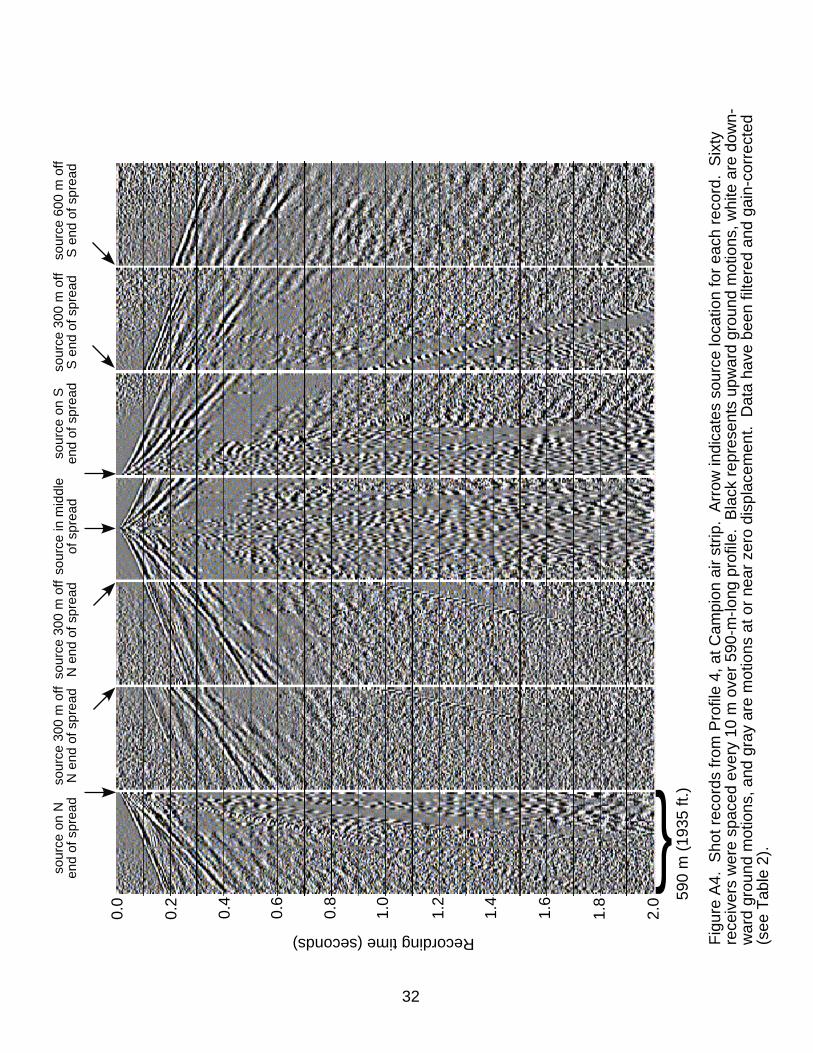
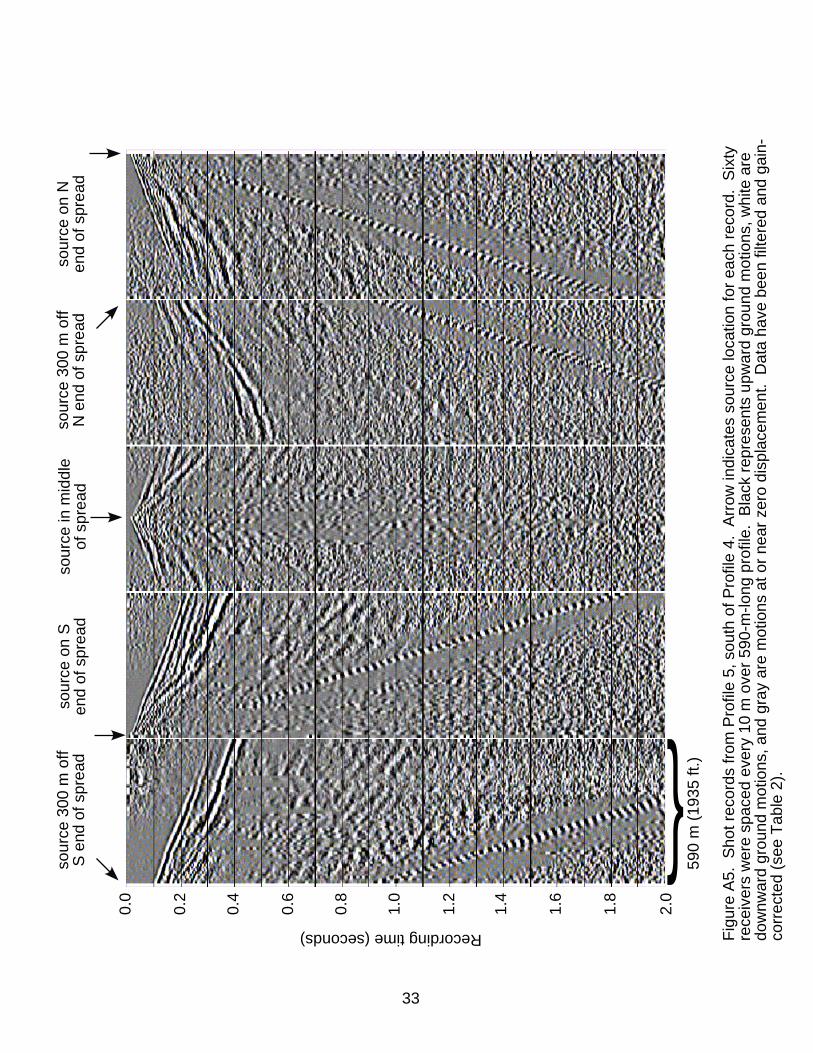
processing step are shown in the Appendix.
In the following section, the data are presented after all of the above steps have
been performed (Table 2). The data are shown as recording time versus distance from the
receiver spread midpoint. Interpretations are made using industry-standard algorithms for
estimating depths of reflecting and refracting boundaries (sometimes referred to herein as
interfaces; e.g. Telford et al., 1990). As will be noted, the earliest (in time) seismic events
are often difficult to differentiate and thus are often referred to as “direct
arrival/refraction,” indicating this ambiguity.
Table 2. Generalized Data Processing Steps for Galena Seismic Data Processing Step Comment Data ReformatGeometryTrace EditBandpass Filter (Hz)
Automatic Gain CorrectionDeconvolution
Elevation Statics
Sort and Stack
Convert field data to processing formatInstall topographic coordinate data into trace headersOmit bad traces and change incorrect trace polaritiesLimit frequency range to optimize signal(40-to-500 Hz pass band).Adjust amplitudes using 500 ms gain windowCompress wavelet and attenuate reverberation usingadaptive algorithm with 200 ms operator lengthTime-shift traces based on station elevationdifferences to better align recorded signal fromreceiver to receiverSort all traces at each profile location by offset(distance from source to receivers) and add thesecommon-offset traces together. Display as a singleensemble centered at the midpoint of the receiverstations
7
GEOLOGICAL INTERPRETATION
Based on limited knowledge of the depositional environment, it is believed that
the Yukon Valley basin sediments are relatively homogeneous in terms of their seismic
characteristics. Lateral variation in deposition and limited compaction time (few million
years) often make seismic reflection/refraction signal small across sedimentary layer
boundaries. It is reasonable to infer that one of the first continuous and observable
seismic contacts is between the Quaternary/Tertiary saturated sediments and
Tertiary/Cretaceous bedrock. In the following interpretations, we thus assume one of the
first continuous and observable reflections/refractions at farthest source-receiver offsets
on each profile are from this sediment/bedrock interface. It should be remembered,
however, that both observable reflections within the sediments will occur and that the
sediment/bedrock velocity (and density) contrast may not be high enough to detect.
Permafrost was present in almost every drilled shot hole. It appeared to be thick
(based on the seismic data, on the order of 100 feet or greater) and continuous at all of the
sites we investigated. It had been hoped that this high-velocity layer would be thin to
non-existent at some locations, allowing the use of seismic refraction modeling
techniques that utilize direct and first-refraction arrivals. However, the direct and
refraction arrivals in these data have traveled almost entirely from permafrost, as
suggested by their arrival velocities between 11400 and 13120 ft/s, which rendered this
part of the data unusable for refraction analysis of bedrock depth. Therefore, this left us
with the analysis of reflection events and later refraction events within the seismic data.
The disadvantages of analyzing these later events on data acquired in reconnaissance
mode such as these include: 1) it is more difficult to accurately define boundary depths;
8
and 2) layer dip is not easily resolvable. In general, all depths estimated from these data
have an accuracy of ± 100 ft.
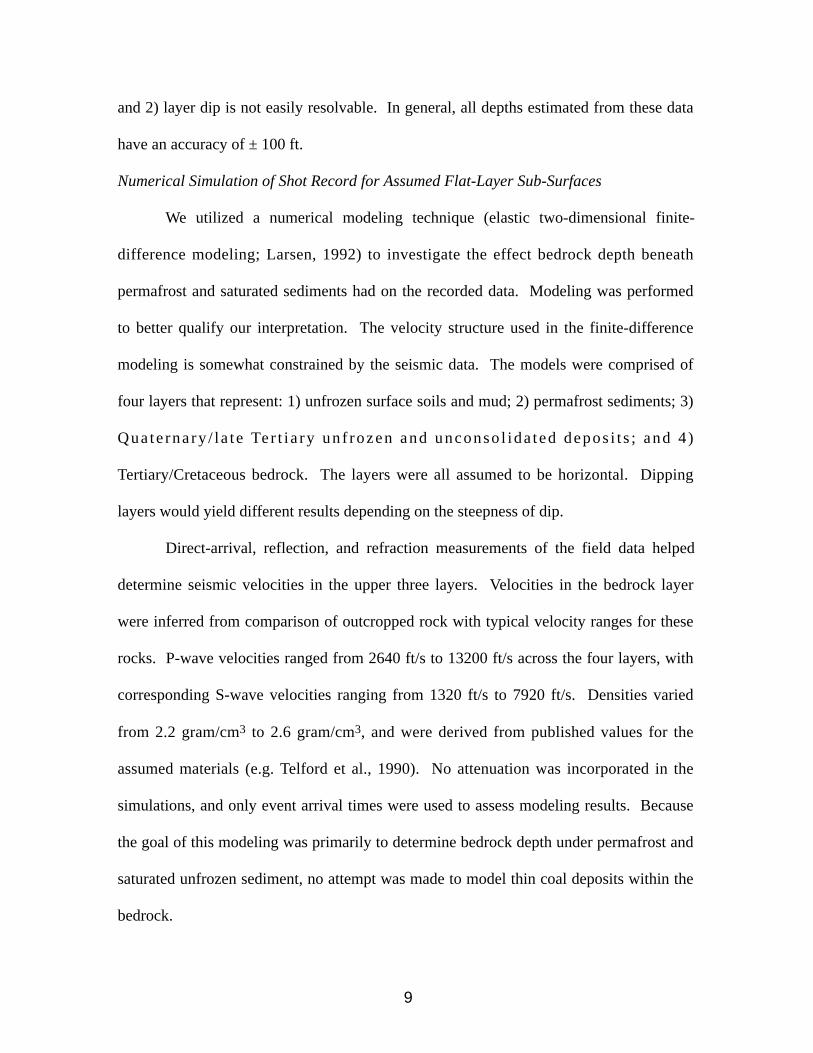
Numerical Simulation of Shot Record for Assumed Flat-Layer Sub-Surfaces
We utilized a numerical modeling technique (elastic two-dimensional finite-
difference modeling; Larsen, 1992) to investigate the effect bedrock depth beneath
permafrost and saturated sediments had on the recorded data. Modeling was performed
to better qualify our interpretation. The velocity structure used in the finite-difference
modeling is somewhat constrained by the seismic data. The models were comprised of
four layers that represent: 1) unfrozen surface soils and mud; 2) permafrost sediments; 3)
Qua te rna ry / l a t e Te r t i a ry unf rozen and unconso l ida ted depos i t s ; and 4 )
Tertiary/Cretaceous bedrock. The layers were all assumed to be horizontal. Dipping
layers would yield different results depending on the steepness of dip.
Direct-arrival, reflection, and refraction measurements of the field data helped
determine seismic velocities in the upper three layers. Velocities in the bedrock layer
were inferred from comparison of outcropped rock with typical velocity ranges for these
rocks. P-wave velocities ranged from 2640 ft/s to 13200 ft/s across the four layers, with
corresponding S-wave velocities ranging from 1320 ft/s to 7920 ft/s. Densities varied
from 2.2 gram/cm3 to 2.6 gram/cm3, and were derived from published values for the
assumed materials (e.g. Telford et al., 1990). No attenuation was incorporated in the
simulations, and only event arrival times were used to assess modeling results. Because
the goal of this modeling was primarily to determine bedrock depth under permafrost and
saturated unfrozen sediment, no attempt was made to model thin coal deposits within the
bedrock.
9
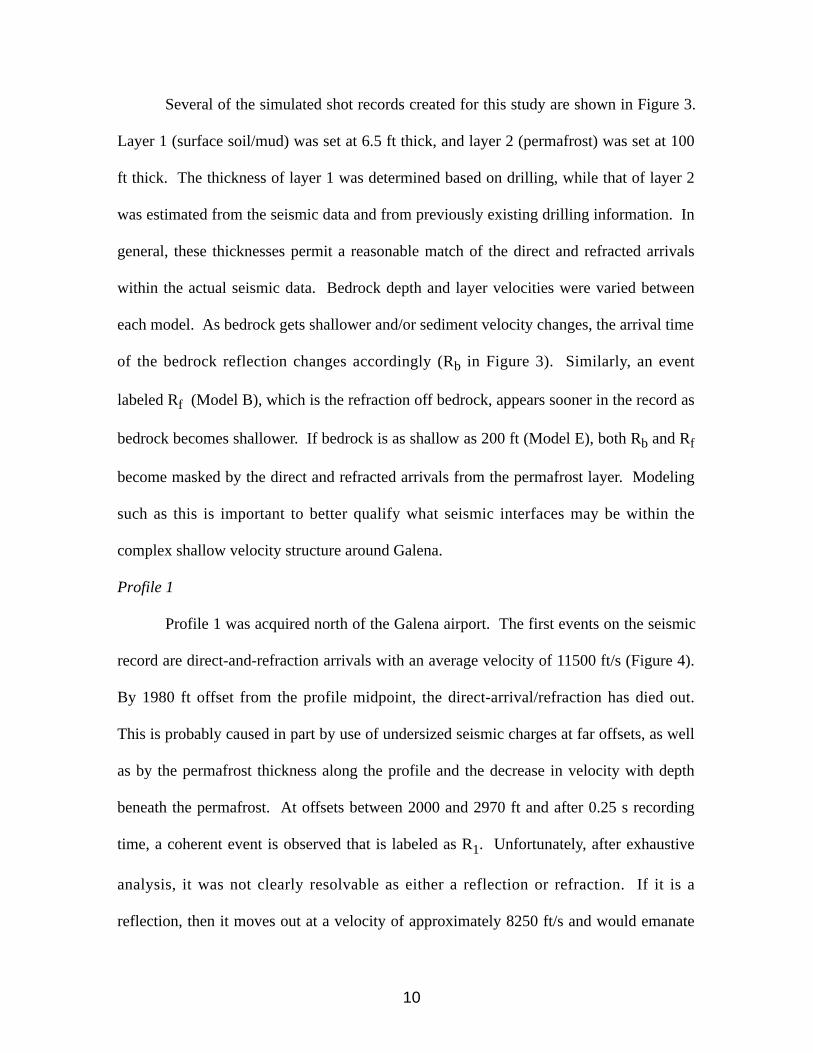
Several of the simulated shot records created for this study are shown in Figure 3.
Layer 1 (surface soil/mud) was set at 6.5 ft thick, and layer 2 (permafrost) was set at 100
ft thick. The thickness of layer 1 was determined based on drilling, while that of layer 2
was estimated from the seismic data and from previously existing drilling information. In
general, these thicknesses permit a reasonable match of the direct and refracted arrivals
within the actual seismic data. Bedrock depth and layer velocities were varied between
each model. As bedrock gets shallower and/or sediment velocity changes, the arrival time
of the bedrock reflection changes accordingly (Rb in Figure 3). Similarly, an event
labeled Rf (Model B), which is the refraction off bedrock, appears sooner in the record as
bedrock becomes shallower. If bedrock is as shallow as 200 ft (Model E), both Rb and Rf
become masked by the direct and refracted arrivals from the permafrost layer. Modeling
such as this is important to better qualify what seismic interfaces may be within the
complex shallow velocity structure around Galena.
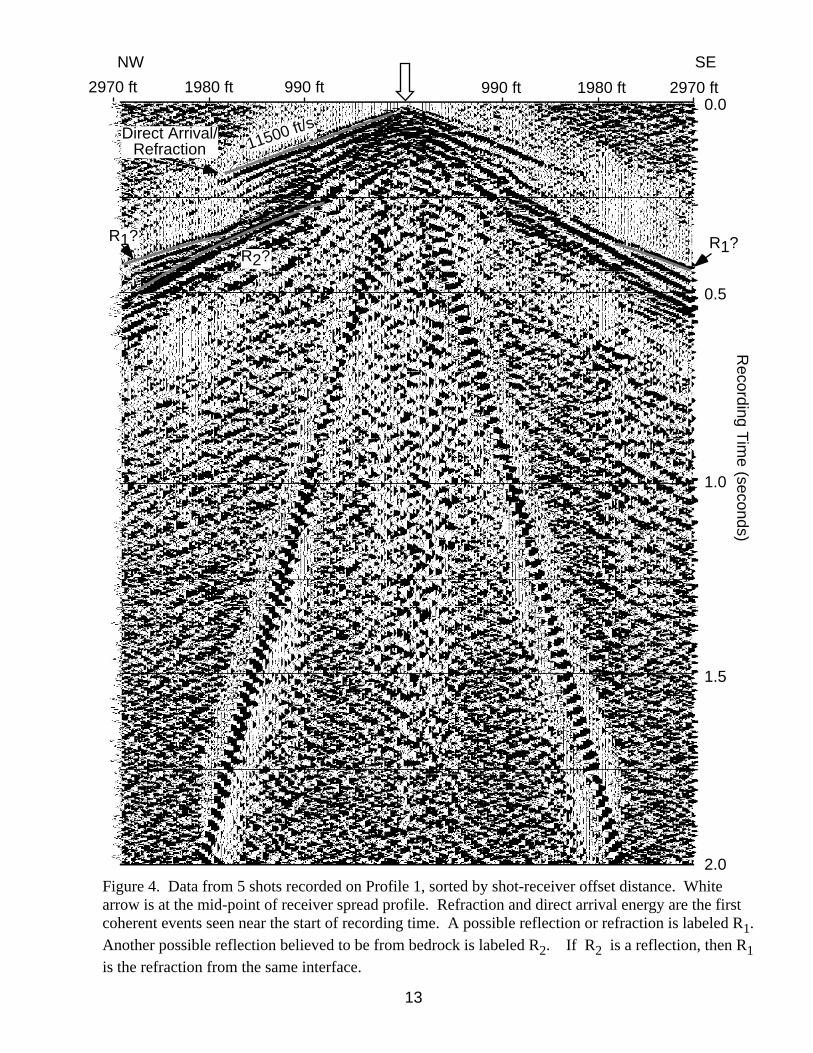
Profile 1
Profile 1 was acquired north of the Galena airport. The first events on the seismic
record are direct-and-refraction arrivals with an average velocity of 11500 ft/s (Figure 4).
By 1980 ft offset from the profile midpoint, the direct-arrival/refraction has died out.
This is probably caused in part by use of undersized seismic charges at far offsets, as well
as by the permafrost thickness along the profile and the decrease in velocity with depth
beneath the permafrost. At offsets between 2000 and 2970 ft and after 0.25 s recording
time, a coherent event is observed that is labeled as R1. Unfortunately, after exhaustive
analysis, it was not clearly resolvable as either a reflection or refraction. If it is a
reflection, then it moves out at a velocity of approximately 8250 ft/s and would emanate
10
Rec
ordi
ng T
ime
(sec
onds
)
A B C D E 0.0
0.2
0.4
0.6
Rb Rb Rb
Rb
Rb
P -wa ve
d irect arriv al/
refr a c tion
S-w
avedirect arrival
Rf
Rf Rf
Figure 3. Synthetic seismic shot records generated with finite-difference numerical mod-eling. All models consist of four layers, as discussed in text. Bedrock reflection is labeled Rb on each record. Refraction from bedrock is labeled as Rf. Model A has bed-
rock at 550 ft depth and has 100 ft of permafrost. Model B has bedrock at 550 ft depth and permafrost velocity at 92% of model A. Model C has bedrock at 550 ft depth and saturated sediment velocity at 110% of model A. Model D and E are also similar to model A but with bedrock at 1100 ft and 200 ft depths, respectively. As bedrock gets shallower and/or velocity of sediments increases, bedrock reflection arrives earlier in recording. Even in synthetic shots such as these, with simple flat layer geology, com-plexity of seismic wave field is apparent.
11
from a reflector estimated at about 1100 ft ± 100 ft depth. If event R1 is a refraction, then
it emanates from a seismic interface that dips to the southeast and ranges in depth from
550 ft to 800 ft, ± 100 ft, along the profile. The coherent event arriving just after R1 is
possibly another reflection, R2, moving at a velocity of about 6270 ft/s. If R2 is a
reflection, then it would be from a reflector at about 650 ft depth. Given the assumptions
discussed in the previous section, we believe that R2 is the reflection and R1 is the
refraction from bedrock beneath Profile 1, at an average depth of 650 ft. The bedrock
velocity of approximately 11150 ft/s is higher than one would anticipate for young
sedimentary rock, suggesting that the reflector may be a volcanic or igneous rock.
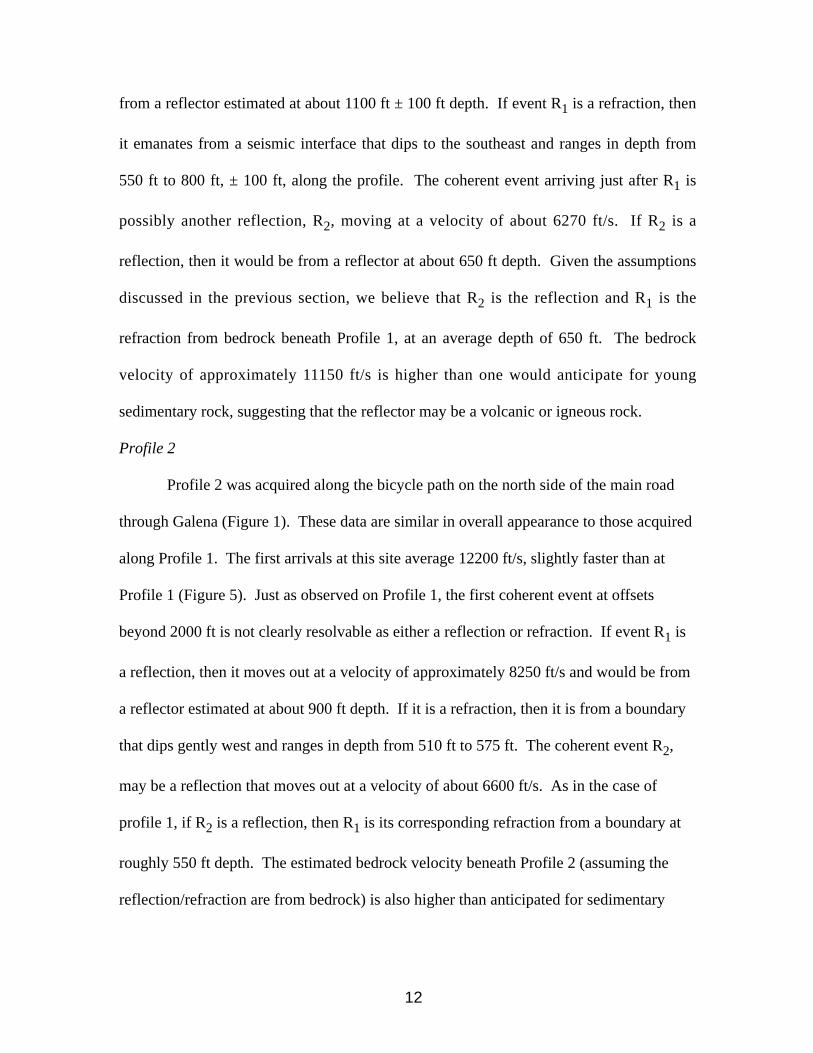
Profile 2
Profile 2 was acquired along the bicycle path on the north side of the main road
through Galena (Figure 1). These data are similar in overall appearance to those acquired
along Profile 1. The first arrivals at this site average 12200 ft/s, slightly faster than at
Profile 1 (Figure 5). Just as observed on Profile 1, the first coherent event at offsets
beyond 2000 ft is not clearly resolvable as either a reflection or refraction. If event R1 is
a reflection, then it moves out at a velocity of approximately 8250 ft/s and would be from
a reflector estimated at about 900 ft depth. If it is a refraction, then it is from a boundary
that dips gently west and ranges in depth from 510 ft to 575 ft. The coherent event R2,
may be a reflection that moves out at a velocity of about 6600 ft/s. As in the case of
profile 1, if R2 is a reflection, then R1 is its corresponding refraction from a boundary at
roughly 550 ft depth. The estimated bedrock velocity beneath Profile 2 (assuming the
reflection/refraction are from bedrock) is also higher than anticipated for sedimentary
12
0.0
0.5
NW SE
R1? R1?
Direct Arrival/ Refraction 11500 ft/s
990 ft 1980 ft 2970 ft990 ft1980 ft2970 ft
R2?
1.0
1.5
2.0 Figure 4. Data from 5 shots recorded on Profile 1, sorted by shot-receiver offset distance. White arrow is at the mid-point of receiver spread profile. Refraction and direct arrival energy are the first coherent events seen near the start of recording time. A possible reflection or refraction is labeled R1. Another possible reflection believed to be from bedrock is labeled R2. If R2 is a reflection, then R1 is the refraction from the same interface.
13
Recording T
ime (seconds)
rocks, at 10560 ft/s.
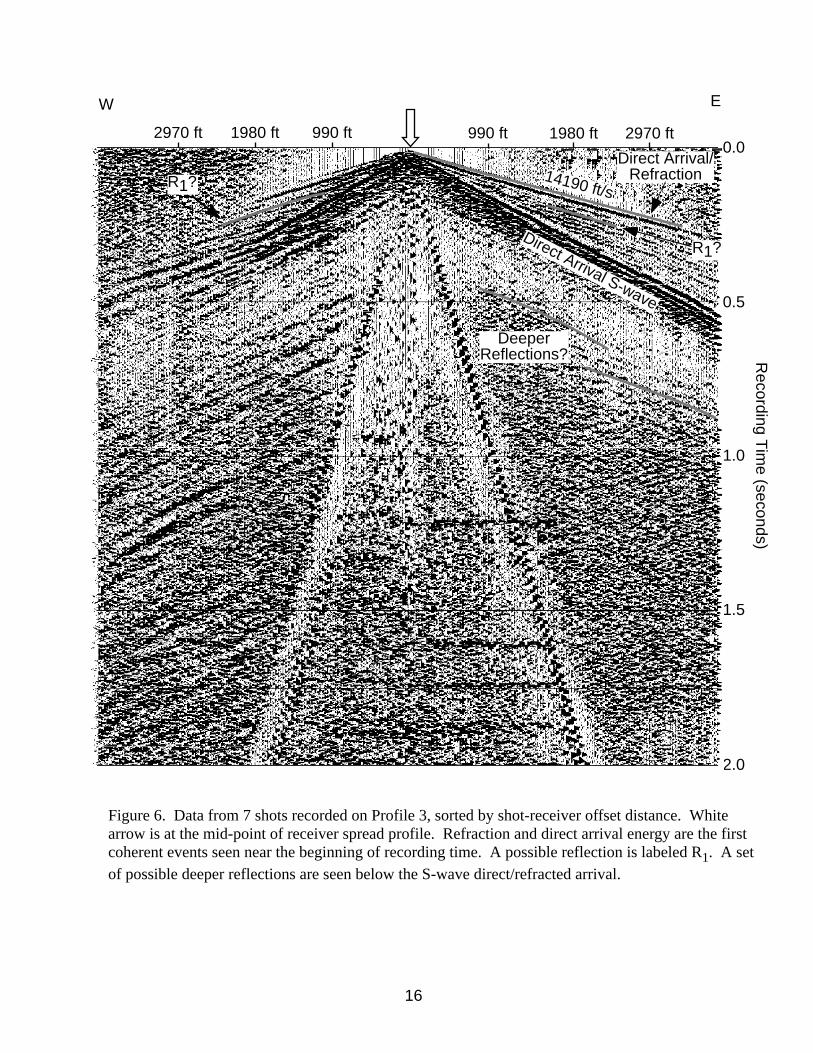
Profile 3
Profile 3 was acquired about 3 miles east of Profile 2 along the main road between
Galena and the old Campion air base. These data have the most prominent and fastest P-
and S-wave direct and refracted arrivals of all the profiles, as observed on the eastern side
of the receiver array midpoint (Figure 6). These data are also unique among the profiles
because of deeper apparent reflections and a series of high-velocity apparent reflections
seen at less than 0.5 seconds recording time at far offsets on the eastern side of the profile
(below R1). Analysis of the east-side direct arrival/refraction suggests a change in
lithology at about 300 ft depth, and this probably indicates a change in frozen material or
thicker permafrost at this location. The direct and refraction arrivals on the western side
of the midpoint are similar to those observed on Profiles 1 and 2. However, estimated
reflection velocities indicate the reflectors are quite deep, over 1100 ft. The event labeled
R1 is the best-guess bedrock interface; its depth is approximately 750 ft. Overall, the data
on profile 3 are complex and may be indicative of thick permafrost coupled with geologic
structure and rapid lateral change in rock type.
Profile 4
Profile 4 was acquired along the abandoned landing strip at the old Campion air
base. Although over 6 miles from Galena, this site was selected to determine if bedrock
might be shallower underneath the topographic high at the old base (Figure 1) and
therefore more economic to drill. These data show two events believed to be reflections
(Figure 7). The velocity of the shallow event R1 travels at roughly 10230 ft/s, sufficiently
fast to have traveled through a significant section of frozen sediment or bedrock. We
14
0.0
0.5
E W
R1? R1?
Direct Arrival/ Refraction 12200 ft/s
990 ft 1980 ft 2970 ft990 ft1980 ft2970 ft
R2?
1.0
1.5
2.0 Figure 5. Data from 5 shots recorded on Profile 2, sorted by shot-receiver offset distance. White arrow is at the mid-point of receiver spread profile. Refraction and direct arrival energy are the first coherent events seen near the beginning of recording time. A possible reflection or refraction is labeled R1. Another possible reflection believed to be from bedrock is labeled R2. If R2 is a reflec-tion, then R1 is the refraction from the same interface.
15
Recording T
ime (seconds)
E
0.0
0.5
1.0
1.5
2.0
W
R1?
R1?
Direct Arrival/Refraction 14190 ft/s
990 ft 1980 ft 2970 ft 990 ft 1980 ft 2970 ft
Deeper Reflections?
Direct Arrival S-wave
Figure 6. Data from 7 shots recorded on Profile 3, sorted by shot-receiver offset distance. White arrow is at the mid-point of receiver spread profile. Refraction and direct arrival energy are the first coherent events seen near the beginning of recording time. A possible reflection is labeled R1. A set of possible deeper reflections are seen below the S-wave direct/refracted arrival.
Recording T
ime (seconds)
16
interpret this event to be from a bedrock interface at approximately 720 ft depth. The
deeper possible reflection event, R2, arrives much slower at 6940 ft/s. Analysis suggests
it would be from a reflector at roughly 900 ft depth.
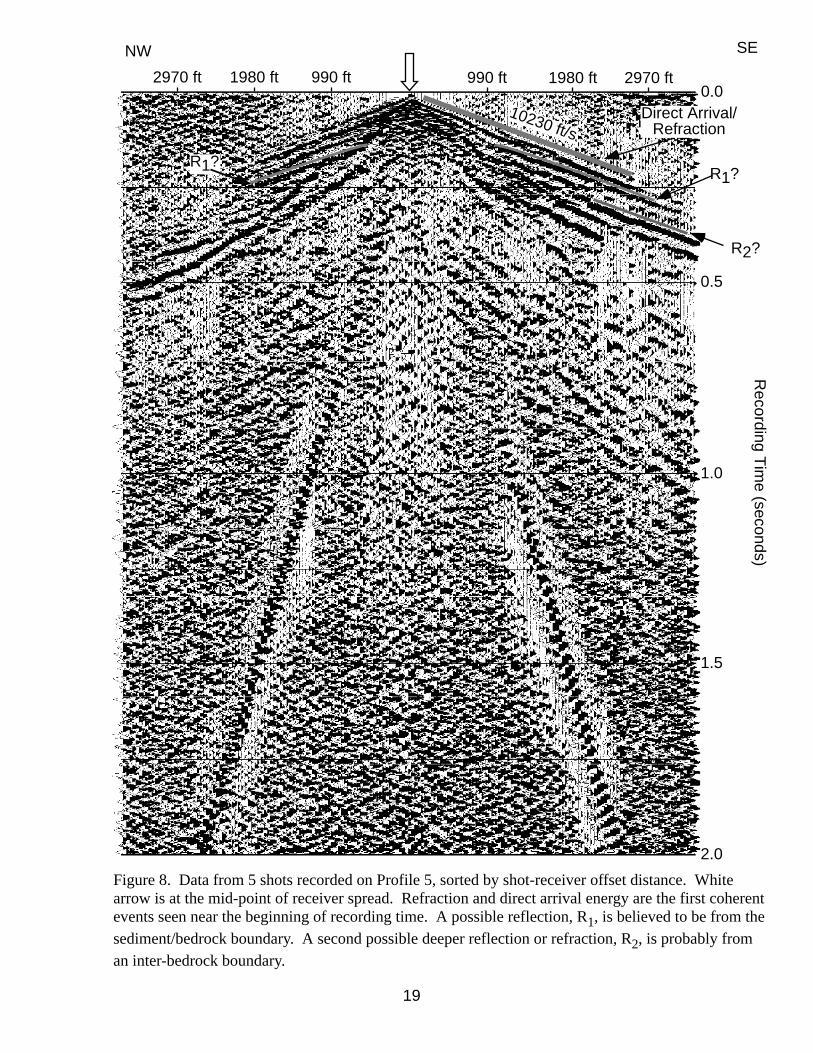
Profile 5
Profile 5 was acquired southeast of Profile 4, still within the perimeter of the old
Campion air force station. The data suggest a thinner layer of permafrost than at Profile 4
and reveal several apparent reflections (Figure 8). Both the direct and first refracted
arrivals, traveling at about 10230 ft/s, are slower than those observed along Profile 4.
Event R1 is most likely a reflection that travels at a velocity of approximately 7425 ft/s.
Event R2 is believed to be either a reflection or refraction from a deeper event. If a
refraction, the seismic event is from an boundary at a depth of about 600 ft. A weak
possible reflection correlates roughly with this depth. Event R1 is interpreted as evidence
of bedrock at about 415 ft, while event R2 is believed to be from an inter-bedrock
boundary.
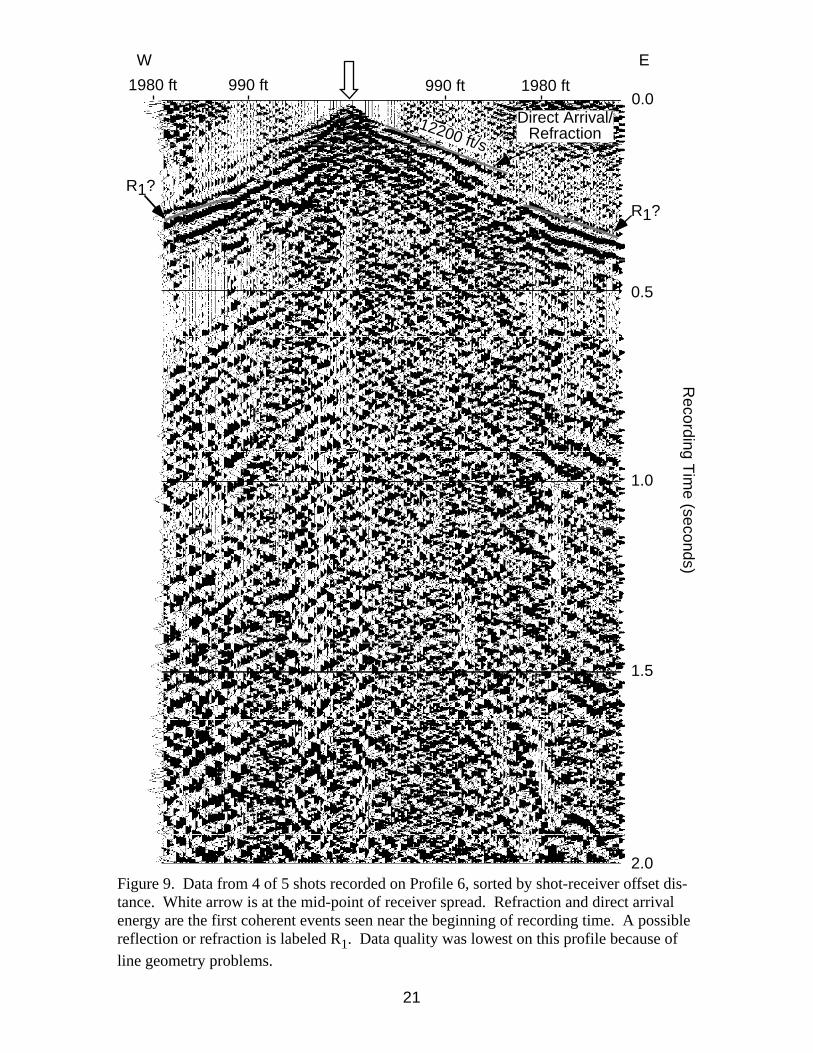
Profile 6
Profile 6 was acquired along the last accessible stretch of road southwest of
Campion air base. These data were acquired to image any shallow rock layers near the
river and off the topographic high of Profiles 4 and 5. Unfortunately, this profile located
on the most crooked road, had the most topographic variation, and had the poorest
elevation control of any acquired in this study. These factors contributed to low-quality
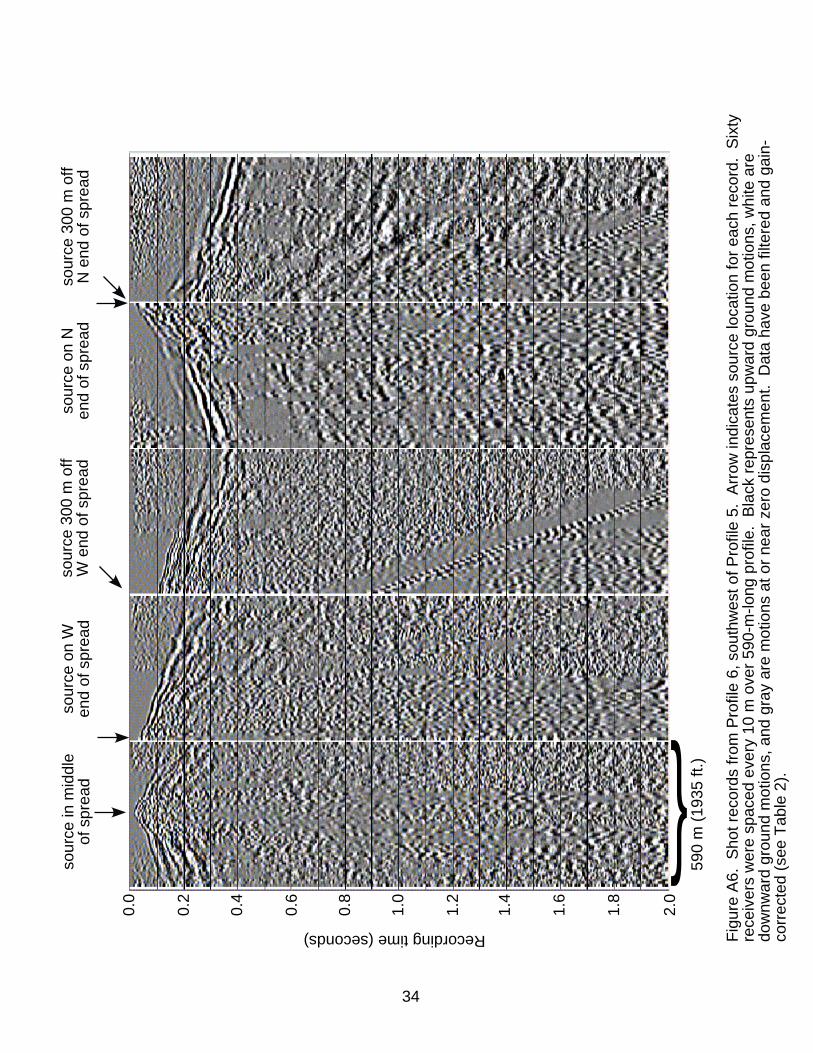
processed data that required the omission of the westernmost shot data (Figure 9; see
Figure A6 for unsorted shot records). Even after extensive processing, the data are
difficult to interpret because of the noise introduced by line geometry errors. The non-
17
SW
0.0
0.5
1.0
1.5
2.0
NE
R1?
R1?
Direct Arrival/ Refraction
13200 ft/s
990 ft 1980 ft 2970 ft 990 ft 1980 ft 2970 ft
R2?
S-wav e
dir ect/
refracte
d arri va l
Recording T
ime (seconds)
Figure 7. Data from 7 shots recorded on Profile 4, sorted by shot-receiver offset distance. White arrow is at the mid-point of receiver spread profile. Refraction and direct arrival energy are the first coherent events seen near the beginning of recording time. A possible reflection is labeled R1. A sec-ond possible deeper reflection or refraction is seen above the S-wave direct/refracted arrival.
18
0.0
0.5
1.0
SENW
R1? R1?
Direct Arrival/ Refraction
10230 ft/s
990 ft 1980 ft 2970 ft990 ft1980 ft2970 ft
R2?
1.5
2.0
Figure 8. Data from 5 shots recorded on Profile 5, sorted by shot-receiver offset distance. White arrow is at the mid-point of receiver spread. Refraction and direct arrival energy are the first coherent events seen near the beginning of recording time. A possible reflection, R1, is believed to be from the sediment/bedrock boundary. A second possible deeper reflection or refraction, R2, is probably from an inter-bedrock boundary.
Recording T
ime (seconds)
19
continuous, rough appearance of the direct/refraction arrival is indicative of this problem.
Nonetheless, a possible reflection is interpreted at offsets beyond 1000 ft. This event,
again labeled R1, arrives at significantly different times on the western and eastern ends
of the profile. Even though elevation timing corrections were made (Table 2), much of
this difference may be due to poor topographic data. This event averages out to be from a
boundary at roughly 800 ft depth. We do not have much confidence in the accuracy of
this value.
DISCUSSION AND CONCLUSIONS
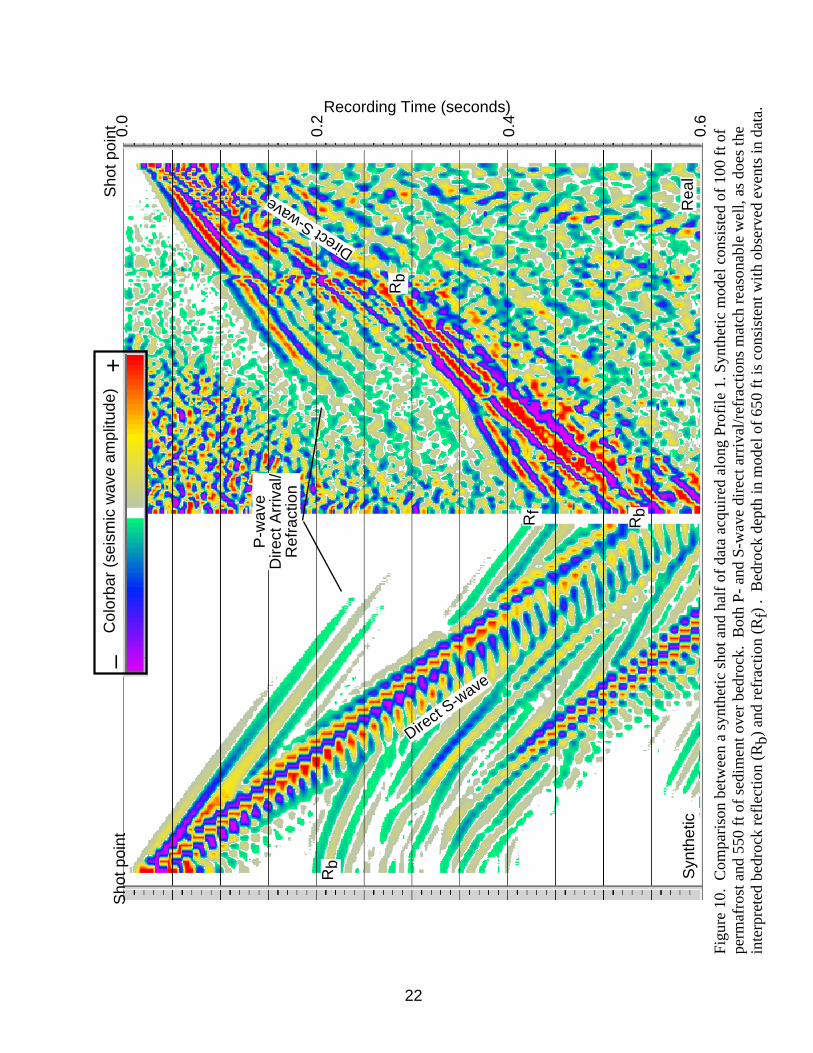
A direct comparison between the data from the northwestern half of profile 1 and
a best-fit synthetic model are shown in Figure 10. The model consisted of a combined
650 ft of soil, permafrost, and sediment over bedrock. The bedrock reflection beneath the
shot on the synthetic record is clearly visible. On the real data it is not, primarily because
of coherent and random noise in the real world that is not predicted by the numerical
simulation. In general, seismic events such as the direct/refracted P- and S- waves match
up fairly well between the real and synthetic data. Events labeled Rb and Rf on the
synthetic data are known to be from the bedrock interface from the model. These events
align with similar events in the real data. We therefore believe these events in the real
data are from bedrock, as interpreted.
In the case of Profile 4, at the Campion air strip, synthetic modeling corroborates
the assumption that permafrost is thicker than at the previous sites (Figure 11). Profile 4
was selected for this comparison because it is in an area where the seismic events are
different than at Profiles 1 and 2. The model consists of 450 ft of permafrost compared
20
0.0
W E
990 ft 1980 ft990 ft1980 ft
R1?
R1?
Direct Arrival/ Refraction
12200 ft/s
0.5
1.0
1.5
2.0 Figure 9. Data from 4 of 5 shots recorded on Profile 6, sorted by shot-receiver offset dis-tance. White arrow is at the mid-point of receiver spread. Refraction and direct arrival energy are the first coherent events seen near the beginning of recording time. A possible reflection or refraction is labeled R1. Data quality was lowest on this profile because of line geometry problems.
Recording T
ime (seconds)
21
Recording Time (seconds) 0.
0
0.2
0.4
0.6
Figu
re 1
0. C
ompa
riso
n be
twee
n a
synt
hetic
sho
t and
hal
f of
dat
a ac
quir
ed a
long
Pro
file
1. S
ynth
etic
mod
el c
onsi
sted
of
100
ft o
f pe
rmaf
rost
and
550
ft o
f se
dim
ent o
ver
bedr
ock.
Bot
h P-
and
S-w
ave
dire
ct a
rriv
al/r
efra
ctio
ns m
atch
rea
sona
ble
wel
l, as
doe
s th
e in
terp
rete
d be
droc
k re
flec
tion
(Rb)
and
ref
ract
ion
(Rf)
. B
edro
ck d
epth
in m
odel
of
650
ft is
con
sist
ent w
ith o
bser
ved
even
ts in
dat
a.
Col
orba
r (s
eism
ic w
ave
ampl
itude
) +
–
P-w
ave
Dire
ct A
rriv
al/
Ref
ract
ion
Rb
Direct
S-wave
DirectS-wave
Rf
Rb
Rb
Sho
t poi
nt
Sho
t poi
nt
Syn
thet
ic
Rea
l
22
with 100 ft in the model of Figure 10. Unfrozen sediment thickness is 150 ft below
permafrost and overlying bedrock. As seen in Figure 11, the general pattern of arrival
times in the real data matches up with arrivals in the synthetic data. The thicker
permafrost causes the bedrock reflection Rb to arrive much sooner in time while any
possible bedrock refraction is masked by the direct and refracted P- and S- waves
travelling through the permafrost and sediments.
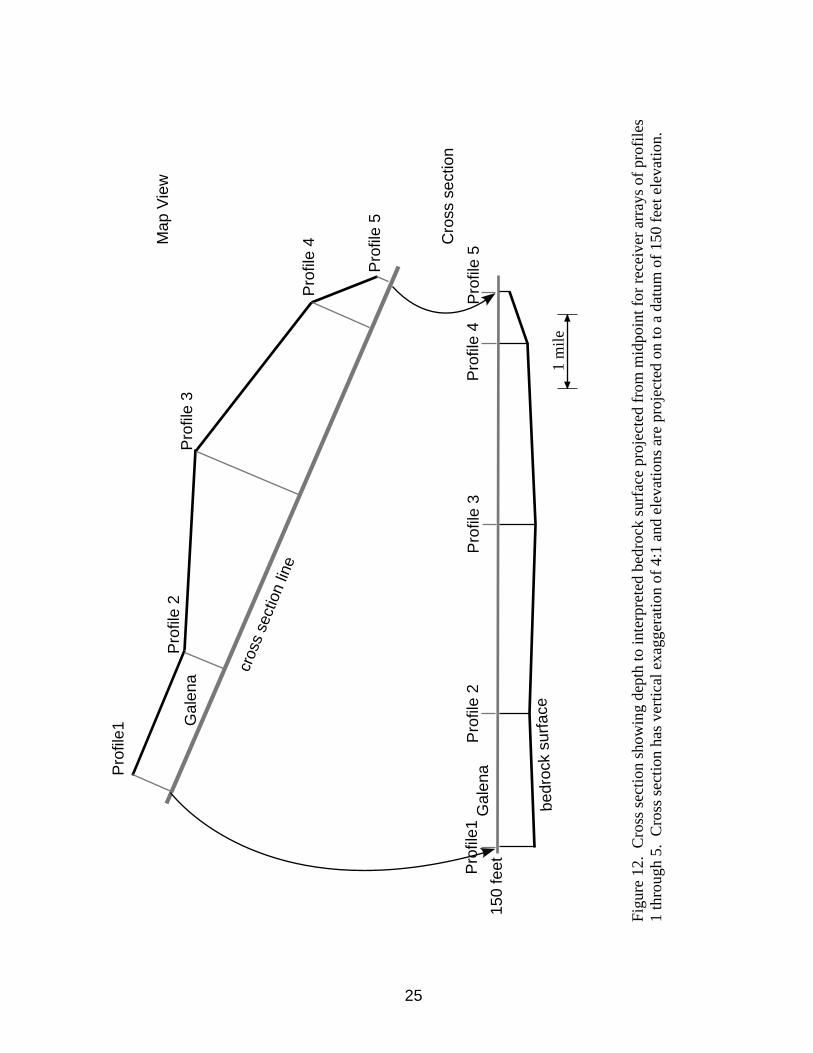
A cross section of interpreted bedrock depth is presented in Figure 12. The
interpreted depth is projected on to a cross section line from the midpoint of each receiver
array for Profiles 1 through 5. Datum for the cross section is set at 150 feet, roughly the
mean elevation at Profile 1. Bedrock does not appear to get shallower than approximately
550 feet in the immediate vicinity of Galena, beneath Profiles 1, 2, or 3. It appears to
shallow somewhat toward the southeast of Galena, beneath profile 5, but the evidence for
this is not strongly compelling given the complexity of this data set. Even vertically
exaggerated 4:1, the interpreted surface is quite flat overall. It is important to remember
that what has been interpreted as bedrock may be simply a high-velocity unit within the
sediment package or within a sequence of rock. Further, the velocity contrast at the late-
Tertiary (?)/Quaternary sediment and rock boundary may not generate an interpretable
reflection or refraction large enough to image. Of potential interest, the bedrock
velocities appear to be sufficiently high to suggest the existence of a non-sedimentary unit
such as a volcanic or igneous rock. Both rock types have been mapped regionally along
the Yukon River (about 12 miles both west and northeast of Galena), so their existence in
the vicinity of Galena may not be surprising (Bradley, 1938; Cass, 1959).
Because of the complexity of the near-surface velocity structure (from the
23
Recording Time (seconds)
0.0
0.2
0.4
0.6
perm
afro
st o
ver
150
ft o
f se
dim
ent u
nder
lain
by
bedr
ock.
Bot
h P-
and
S-w
ave
dire
ct a
rriv
al/r
efra
ctio
ns m
atch
rea
sona
ble
wel
l, as
doe
s a
bedr
ock
refl
ectio
n (R
b).
Thi
s gi
ve u
s so
me
conf
iden
ce th
at p
erm
afro
st is
thic
ker
at th
is s
ite a
nd m
odel
bed
rock
dep
th is
rea
sona
ble.
Com
pari
son
betw
een
a sy
nthe
tic s
hot a
nd h
alf
of d
ata
acqu
ired
at P
rofi
le 4
loca
tion.
Syn
thet
ic m
odel
con
sist
ed o
f 45
0 ft
of
Col
orba
r (s
eism
ic w
ave
ampl
itude
) +
–
P-w
ave
Dire
ct A
rriv
al/
Ref
ract
ion
Rb
Direct
S-wave
Direct
S-wave
Sho
t poi
nt
Sho
t poi
nt
Syn
thet
ic
Rea
l
Figu
re 1
1.
24
Cro
ss s
ectio
n sh
owin
g de
pth
to in
terp
rete
d be
droc
k su
rfac
e pr
ojec
ted
from
mid
poin
t for
rec
eive
r ar
rays
of
prof
iles
Cro
ss s
ectio
n ha
s ve
rtic
al e
xagg
erat
ion
of 4
:1 a
nd e
leva
tions
are
pro
ject
ed o
n to
a d
atum
of
150
feet
ele
vatio
n.
Cro
ss s
ectio
n
Map
Vie
w
150
feet
Pro
file
4
Pro
file
5
Pro
file
2
Pro
file
3G
alen
a
bedr
ock
surf
ace
Gal
ena
cros
sse
ctio
n lin
e
Pro
file1
Pro
file
2
Pro
file
3 P
rofil
e 4
Pro
file
5
1 m
ile
Pro
file1
1 th
roug
h 5.
Fi
gure
12.
25
permafrost and saturated sediment layers), as well as the unknown contrast between the
sediments and the Tertiary or Cretaceous bedrock, we believe an oil-industry-style
seismic reflection survey would be an appropriate method to image the necessary targets
to answer the problem. However, its cost might be prohibitive given that several 1000-
foot holes could probably be drilled for the cost of an industry reflection survey.
Acknowledgments
We thank Todd Dallegge (University of Alaska, Fairbanks) and Valerie Webb
(student intern with the Alaska Division of Geological and Geophysical Surveys) for their
help in data acquisition. We gratefully acknowledge Doyon Native Corp. for permission
to do the survey and for access to their lands. Thanks very much to the City of Galena for
supplying vehicles, equipment, and personnel for this project. We greatly appreciate the
efforts of Marvin Yoder in making this investigation come together. Special thanks also
to Gordie Cruger for his hospitality during our stay in Galena. This work was performed
in cooperation with the Alaska Division of Geological and Geophysical Surveys.
REFERENCES
Bradley, A.J., 1938, Unconsolidated sediments and topographic features of the lower
Yukon valley: Geol. Soc. of America Bull. v. 49, no. 2, p303-341.
Cass, J.T., 1959, Reconnaissance geologic map of the Nulato quadrangle. alaska: U.S.