22
Reconsidering the Role of Food Prices in Inflation James P. Walsh WP/11/71
Reconsidering the Role of Food Prices in Inflation
James P. Walsh
WP/11/71
© 2011 International Monetary Fund WP/11/71
IMF Working Paper
Asia and Pacific Department
Reconsidering the Role of Food Prices in Inflation 1
Prepared by James P. Walsh
Authorized for distribution by Laura Papi
April 2011
Abstract
Food prices are generally excluded from measures of inflation most closely watched bypolicymakers due either to their transitory nature or their higher volatility. However, in lowerincome countries, food price inflation is not only more volatile but also on average higherthan nonfood inflation. Food inflation is also in many cases more persistent than nonfoodinflation, and shocks in many countries are propagated strongly into nonfood inflation. Underthese conditions, and particularly given high global commodity price inflation in recent years, a policy focus on measures of core inflation that exclude food prices can misspecifyinflation, leading to higher inflationary expectations, a downward bias to forecasts of futureinflation and lags in policy responses. In constructing measures of core inflation, policymakers should therefore not assume that excluding food price inflation will provide aclearer picture of underlying inflation trends than headline inflation.
JEL Classification Numbers: E31, E52, E58, O23
Keywords: inflation, core inflation, commodity prices food prices, persistence, inflation expectations
Author’s E-Mail Address: [email protected]
1 I have benefited from comments by Nicoletta Batini, Luis Catão, Elliott Harris, Laura Papi, Masahiko Takeda, participants in the RES Surveillance Meeting and the India Policy Research Forum at the IMF and seminar participants at the Indian Ministry of Finance. In addition, I am grateful to Agnes Isnawangsih and Fritz Pierre-Louis for research assistance. Any remaining errors are my own.
This Working Paper should not be reported as representing the views of the IMF. The views expressed in this Working Paper are those of the author(s) and do not necessarily represent those of the IMF or IMF policy. Working Papers describe research in progress by the author(s) and are published to elicit comments and to further debate.
2
I. Introduction and Background
This paper analyzes the dynamics of food and nonfood inflation with a view toward assessing the appropriateness of minimizing or excluding food inflation in measures of core inflation, particularly in developing countries. While core inflation indices can be derived in many ways, the end result in most advanced economies is to minimize or eliminate volatile categories, which often translates into excluding food and energy. While the greater role of food prices in emerging economies is acknowledged by all central bankers, core inflation measures excluding food price changes are also widely cited and can inform policy decisions. It is not clear, however, that the characteristics of both food and nonfood prices that justify the minimization of food price inflation in advanced-economy core measures apply in developing economies. This is not only a question of the greater weight of food in the consumer basket, but also differences in the statistical properties and relationships between food and nonfood prices.
This question is particularly important given the rising volatility and importance of food prices changes. During 2003-2007, when global commodity prices rose suddenly and rapidly, nonfood inflation rose quickly in many countries as well, underscoring the importance of looking at the relationship between food prices and headline inflation and questioning whether a focus on core measures of inflation might lead policymakers to underestimate the medium-term impact of changes in food prices. As the effects of the global financial crisis have receded, food prices have seemingly resumed this upward climb, and policymakers are again facing the issue of to what extent food price inflation should be accommodated.
Of course, policymakers look at various measures of inflation and no central bank ignores developments in an important and volatile subcomponent of inflation, but as is discussed below, discounting food price developments relative to nonfood price developments due to their greater volatility can lead policymakers not only to underestimate the headline level of inflation that affects inflation expectations, but can also lead to underestimating the level of inflation in the nonfood basket in countries where the transmission of food price shocks to nonfood prices is a significant factor.
Policymakers derive core measures of inflation in a variety of ways. These measures are generally designed to address a primary challenge for central bankers: how to set policies consistent with medium-term goals, while data measure only current developments. This difficulty is particularly pronounced with inflation, where monthly developments are highly volatile and central banks must infer whether sudden changes are reflective of a transitory shock or evidence of a change in trends. In developing economies, where inflation is generally higher and more volatile, the signal to noise ratio is even lower, and there is even greater uncertainty about underlying developments. Thus while most central banks target headline inflation, policy decisions are often partially informed by other measures of inflation designed to provide a clearer image of underlying price developments than the headline price index.
3
The desirable characteristics of such a core measure of inflation are difficult to pin down and different practitioners arrive at different conclusions. In a seminal paper, Bryan and Cecchetti (1993) focus on determining a measure of inflation that maximizes the signal to noise ratio, and suggest measuring inflation based on a truncated distribution of the changes of its components. The goal of such a procedure is to eliminate transitory developments in inflation to focus on persistent trends which are of primary interest to monetary policy practitioners. By eliminating those components whose changes are the most extreme, the measure adjusts for the skewed distribution of component price changes and provides an estimate of the underlying longer-run trend. In an analysis of how their index differs from headline inflation, they calculate the probability that a given component will be at the center of the distribution of price changes, that is, the probability at any given time that one component of the index will be representative of inflation overall. Relative to their weight in the overall price index, shelter and medical care, which are relatively stable, are very likely to display the median price change, while energy and food consumed at home, which are relatively volatile, are among the least likely components. Thus, while the index is not explicitly constructed as a CPI less food and energy, food and energy ex post assume less importance in this measure than in headline inflation due to their higher volatility and skewness.
On the other hand, Cutler (2001) builds on a slightly different concept of core measure of inflation by emphasizing persistence. Noting that policymakers are interested in developments to inflation that are likely to have important medium-term effects, she estimates the persistence of inflation across the components of the UK retail price index, and weighs components by their relative persistence2. This measure places a low weight on energy and seasonal food items, but a high weight on nonseasonal food items, which in the UK display relatively persistent prices. In this case, the relatively low persistence of food inflation justifies its lower weight in a core index. On the other hand, Bilke and Stracca (2008) construct a similar index for the Euro Area, but they find that food prices are relatively persistent, resulting in a higher weight in their index than in the headline CPI.
While these measures effectively reduce the importance of food inflation developments in measures aimed at measuring medium-term inflation from noisy contemporaneous data, Cecchetti (2007) cautions against going too far. He suggests that a core inflation measure that excludes food and energy can be a less effective focus for the attention of policymakers than headline inflation. Setting aside the volatility or persistence of the two components, he notes that means are also important: if non-core inflation rises faster than core inflation over a sustained period of time, then stripping out faster-moving components of inflation cannot be said to provide a more accurate picture of overall inflation, and that the estimates of current inflation provided by a core measure will be biased significantly downward.
2 Except for goods with estimated autocorrelations below zero, which are weighted at zero.
4
Rich and Steindel (2007) go beyond this to assess whether some measures of inflation in the U.S. can be thought of as “core” measures at all. They posit as the important characteristics of a core measure of inflation its transparency, displaying dynamics (including both a short-term “close coherence” and a long-run mean) similar to the headline series, and an ability to provide information about past and future developments of the broader series. In assessing four different models for U.S. inflation, including the widely-cited aggregate inflation series excluding food and energy, as well as some methodological improvements posited in the past literature, they find that the core measure excluding food and energy does not perform particularly well as a core inflation series. While its dynamics are roughly similar (though not as close as might be expected) to headline inflation, its predictive value is weak. This result is particularly important given that food inflation in the U.S. is far more transitory and less significant in the creation of overall inflation expectations than it is in some other economies. Alvarez et al. (2005) look at the persistence of inflation across components in the Eurozone, and compare these results to similar studies done for the United States. As with earlier studies, they find that in both regions, food prices are less persistent than nonfood prices (particularly services), but that across all categories, prices in Europe are markedly more persistent than prices in the U.S. Given this heterogeneity across developed economies where food dynamics can be expected to be of relatively little importance in overall inflation dynamics, it is reasonable to question whether it is justifiable to discount food price inflation as transitory in developing economies.
Moreover, the mechanism transmitting food price shocks to nonfood inflation can be important, as well. Cecchetti and Moessner (2008) assess how the rise in commodity prices since 2003 has fed into overall inflation and find that in many countries headline inflation is not reverting to core to the same degree it did in earlier periods, implying that a secular increase in commodity prices, including prices for food, around the world may now be affecting nonfood prices. These effects are likely to be even more pronounced in countries where food is an important component of the overall consumption basket3.
The runup in food prices preceding the 2008 global financial crisis sparked a literature on the implications of food price inflation for the conduct of monetary policy more generally. Catão and Chang (2010) point out that a distinctive role for food in household utility and the presence of high food-price volatility can have important implications for the welfare effects of different monetary policy regimes. They find that these factors strengthen the case for targeting a broad CPI instead of an ad hoc core inflation, and that policies that offset at least some changes in food prices, even those imported from abroad, can be welfare-enhancing. Anand and Prasad (2010) also conclude that in an environment of credit-constrained consumers, a narrow policy focus on nonfood inflation can lead to suboptimal outcomes.
3 This is particularly true given that administered prices, particularly of fuels, which are set by the government rather than the market also generally account for a larger share of the consumption basket in poor countries than in rich countries, and that administered prices are far more prevalent in developing economies.
5
Both of these assumptions are more likely to approximate reality in developing economies than in rich ones.
In fact, both the theoretical and empirical literature on core inflation is focused on rich countries, where the dynamics of food inflation are likely to be substantially different from developing economies or emerging markets. Reducing the weight of food prices in core inflation or setting it to zero can be justified if food prices are less volatile than nonfood prices, their persistence is relatively low, or their impact on headline inflation is small or fleeting. However, if these assumptions do not hold, then headline inflation could be a better guide or even, as Bilke and Stracca find, a core measure which overweights food inflation could be better.
Using a novel dataset that allows the distinction between food and nonfood inflation to be drawn for a very wide sample of countries, the analysis below looks at to what extent these assumptions of transitory and volatile food prices with little long-run effect on nonfood prices hold, not only in developed economies but also in developing ones. The rest of the paper is organized as follows. Section II discusses the data used in the analysis. Section III looks at the persistence across rich and poor countries of both series, while Section IV analyzes the transmission mechanism between the two types of inflation. Section V concludes.
II. Data
The data used in this sample are consumer price indices (CPI) for 91 countries4. The headline CPI index is used, along with the widest definition of food used in the country, excluding alcoholic beverages where this distinction is made. That is, when there is a subindex for “Food” this is the one used; when the subindex is for “Food and Beverages”, this is also used. Nonfood CPI is calculated from total CPI, the weight of food in the CPI, and the food CPI. Inflation is calculated on a month-over-month basis. Other macroeconomic data used in the analysis come from the IMF’s World Economic Outlook database.
It is quite possible that the dynamics discussed below for food prices apply equally strongly to energy prices. However, energy prices are excluded from this analysis for a number of reasons. First, constructing comparable energy price indices across countries is less straightforward than constructing one for food prices. All countries in this analysis have a category for food, but not every country has a category for energy, and some important items, such as gasoline, are classified differently in different countries. Second, and perhaps more important, government administration of energy prices is more widespread than that of food prices. This is particularly important in many developing economies. While the effects of
4 For India, WPI data are used as this is the only national price index with a monthly frequency available and it is the headline index most commonly cited by the central bank and in the press.
6
changes in administered energy prices are as significant as the changes in market-determined prices, including them here would be problematic: energy price shocks in rich countries tend not to be persistent, a commonly cited reason for their exclusion from core indices. But in countries with administered prices they are extremely persistent. If persistence is the only measure for inclusion in a core index, this would argue for including administered energy prices in a core index, even when changes to administered prices lead to sudden large increases in prices. These difficulties argue for treating energy prices outside a cross-country framework5.
Finally, there is a tradeoff between using seasonally adjusted (SA) and nonseasonally adjusted data (NSA). The analysis below uses non-seasonally adjusted data. Not all countries publish seasonally adjusted CPI data, particularly for components, and including SA and NSA data would tend to reduce the volatility of one group of countries relative to the other. In theory, all CPI data could be seasonally adjusted for the analysis, but with a heterogeneous sample of countries this is highly problematic. Given the wide variety of important seasonal factors in many countries that do not fall in the same month each year (e.g., Ramadan or Lunar New Year), applying a blanket seasonal adjustment measure such as X12 which looks only at monthly factors across the entire sample would be inappropriate for many countries.
III. Food Inflation and Nonfood Inflation
There are two important points where differences in distribution of food and nonfood shocks can be significant. First, as Cecchetti (2007) points out, excluding food from a core measure of inflation is only justified when the long-run mean of food inflation is equal to the long run mean of nonfood inflation: if this is not the case, then core inflation will systematically underestimate headline inflation. That is, if policymakers are interested in the overall price level, ignoring food price dynamics only makes sense if these do not impact the long-run price level; if they do, then they have to be taken into account.
Second, it is also important to look at the volatility of food price shocks. If food price shocks are more volatile than nonfood price shocks, they add to the noise to signal ratio that policymakers contend with in assessing inflation. The larger and more frequent these shocks to food inflation are, the likelier it is that they not only lead to erroneous diagnoses of the level of underlying inflation, but also the likelier it is that those shocks can affect nonfood prices as well. This propagation mechanism may not exist everywhere, and this possibility is discussed below. If food shocks tend to be small, then even the long-run effect is likely to be minimal. However, if food shocks are larger and more volatile than nonfood shocks, then
5 It is true that food subsidies and price controls in both rich and poor countries establish floors or ceilings for many commodities. But even in countries with heavily regulated food markets, prices for most consumers and most products vary over time to a greater degree due to market forces than, for example, administered gasoline or heating-oil prices.
7
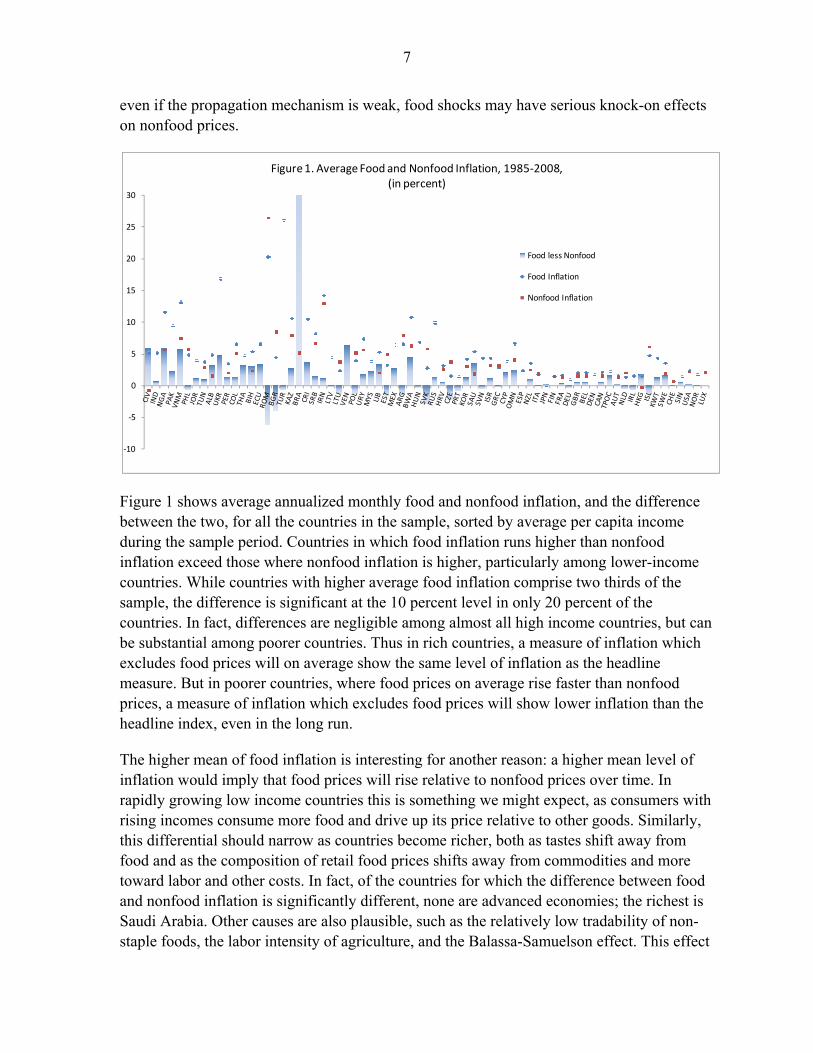
even if the propagation mechanism is weak, food shocks may have serious knock-on effects on nonfood prices.
Figure 1 shows average annualized monthly food and nonfood inflation, and the difference between the two, for all the countries in the sample, sorted by average per capita income during the sample period. Countries in which food inflation runs higher than nonfood inflation exceed those where nonfood inflation is higher, particularly among lower-income countries. While countries with higher average food inflation comprise two thirds of the sample, the difference is significant at the 10 percent level in only 20 percent of the countries. In fact, differences are negligible among almost all high income countries, but can be substantial among poorer countries. Thus in rich countries, a measure of inflation which excludes food prices will on average show the same level of inflation as the headline measure. But in poorer countries, where food prices on average rise faster than nonfood prices, a measure of inflation which excludes food prices will show lower inflation than the headline index, even in the long run.
The higher mean of food inflation is interesting for another reason: a higher mean level of inflation would imply that food prices will rise relative to nonfood prices over time. In rapidly growing low income countries this is something we might expect, as consumers with rising incomes consume more food and drive up its price relative to other goods. Similarly, this differential should narrow as countries become richer, both as tastes shift away from food and as the composition of retail food prices shifts away from commodities and more toward labor and other costs. In fact, of the countries for which the difference between food and nonfood inflation is significantly different, none are advanced economies; the richest is Saudi Arabia. Other causes are also plausible, such as the relatively low tradability of non-staple foods, the labor intensity of agriculture, and the Balassa-Samuelson effect. This effect
‐10
-5
0
5
10
15
20
25
30
Food less Nonfood
Food Inflation
Nonfood Inflation
Figure 1. Average Food and Nonfood Inflation, 1985-2008,(in percent)
8
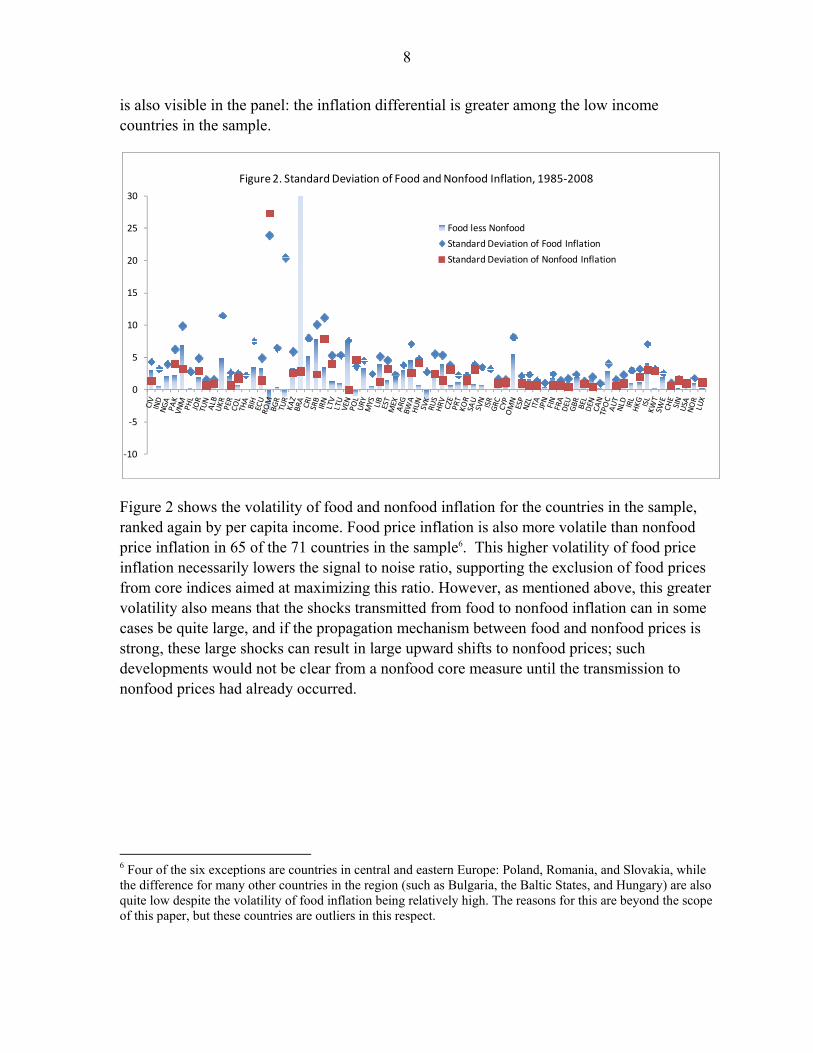
is also visible in the panel: the inflation differential is greater among the low income countries in the sample.
Figure 2 shows the volatility of food and nonfood inflation for the countries in the sample, ranked again by per capita income. Food price inflation is also more volatile than nonfood price inflation in 65 of the 71 countries in the sample6. This higher volatility of food price inflation necessarily lowers the signal to noise ratio, supporting the exclusion of food prices from core indices aimed at maximizing this ratio. However, as mentioned above, this greater volatility also means that the shocks transmitted from food to nonfood inflation can in some cases be quite large, and if the propagation mechanism between food and nonfood prices is strong, these large shocks can result in large upward shifts to nonfood prices; such developments would not be clear from a nonfood core measure until the transmission to nonfood prices had already occurred.
6 Four of the six exceptions are countries in central and eastern Europe: Poland, Romania, and Slovakia, while the difference for many other countries in the region (such as Bulgaria, the Baltic States, and Hungary) are also quite low despite the volatility of food inflation being relatively high. The reasons for this are beyond the scope of this paper, but these countries are outliers in this respect.
-10
-5
0
5
10
15
20
25
30
Food less Nonfood
Standard Deviation of Food Inflation
Standard Deviation of Nonfood Inflation
Figure 2. Standard Deviation of Food and Nonfood Inflation, 1985-2008
9
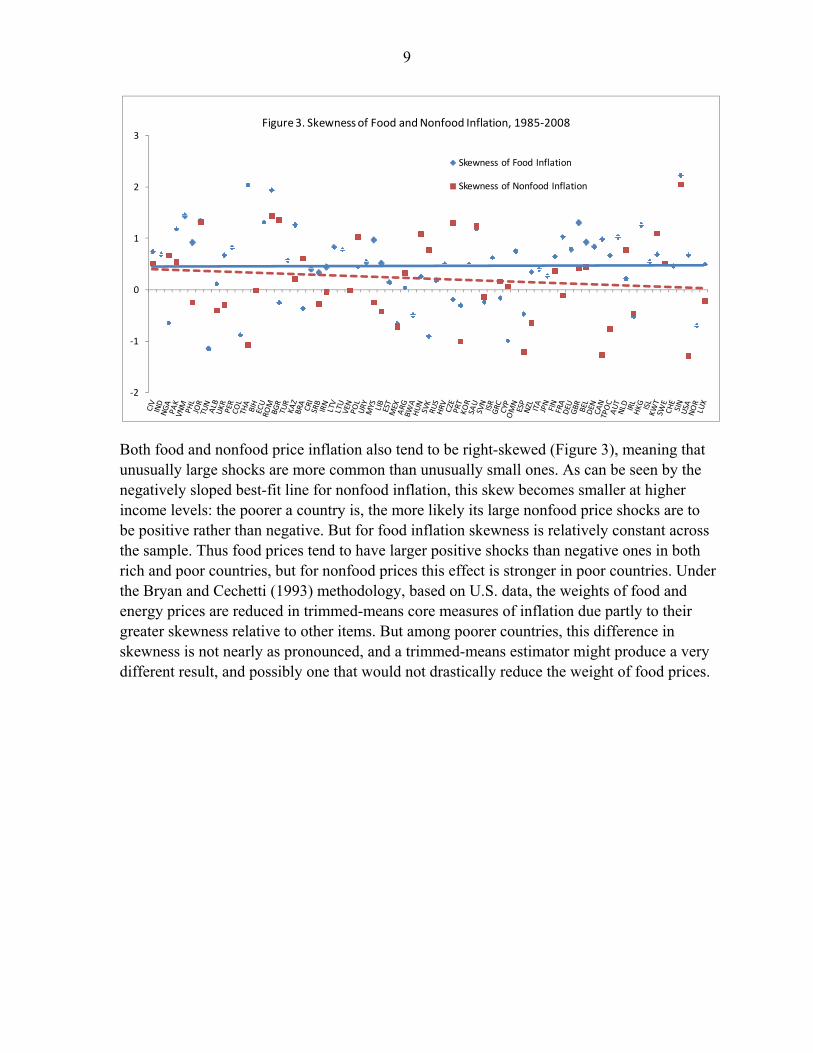
Both food and nonfood price inflation also tend to be right-skewed (Figure 3), meaning that unusually large shocks are more common than unusually small ones. As can be seen by the negatively sloped best-fit line for nonfood inflation, this skew becomes smaller at higher income levels: the poorer a country is, the more likely its large nonfood price shocks are to be positive rather than negative. But for food inflation skewness is relatively constant across the sample. Thus food prices tend to have larger positive shocks than negative ones in both rich and poor countries, but for nonfood prices this effect is stronger in poor countries. Under the Bryan and Cechetti (1993) methodology, based on U.S. data, the weights of food and energy prices are reduced in trimmed-means core measures of inflation due partly to their greater skewness relative to other items. But among poorer countries, this difference in skewness is not nearly as pronounced, and a trimmed-means estimator might produce a very different result, and possibly one that would not drastically reduce the weight of food prices.
-2
-1
0
1
2
3
Skewness of Food Inflation
Skewness of Nonfood Inflation
Figure 3. Skewness of Food and Nonfood Inflation, 1985-2008
10
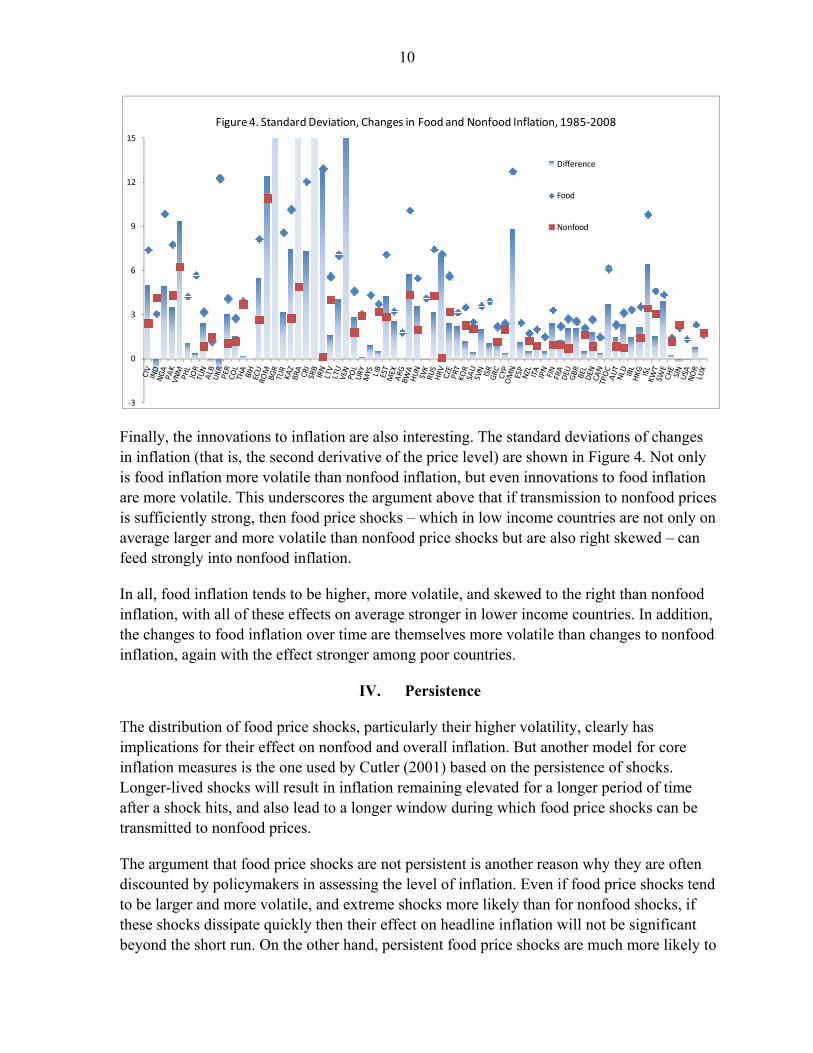
Finally, the innovations to inflation are also interesting. The standard deviations of changes in inflation (that is, the second derivative of the price level) are shown in Figure 4. Not only is food inflation more volatile than nonfood inflation, but even innovations to food inflation are more volatile. This underscores the argument above that if transmission to nonfood prices is sufficiently strong, then food price shocks – which in low income countries are not only on average larger and more volatile than nonfood price shocks but are also right skewed – can feed strongly into nonfood inflation.
In all, food inflation tends to be higher, more volatile, and skewed to the right than nonfood inflation, with all of these effects on average stronger in lower income countries. In addition, the changes to food inflation over time are themselves more volatile than changes to nonfood inflation, again with the effect stronger among poor countries.
IV. Persistence
The distribution of food price shocks, particularly their higher volatility, clearly has implications for their effect on nonfood and overall inflation. But another model for core inflation measures is the one used by Cutler (2001) based on the persistence of shocks. Longer-lived shocks will result in inflation remaining elevated for a longer period of time after a shock hits, and also lead to a longer window during which food price shocks can be transmitted to nonfood prices.
The argument that food price shocks are not persistent is another reason why they are often discounted by policymakers in assessing the level of inflation. Even if food price shocks tend to be larger and more volatile, and extreme shocks more likely than for nonfood shocks, if these shocks dissipate quickly then their effect on headline inflation will not be significant beyond the short run. On the other hand, persistent food price shocks are much more likely to
-3
0
3
6
9
12
15
Difference
Food
Nonfood
Figure 4. Standard Deviation, Changes in Food and Nonfood Inflation, 1985-2008
11
feed into inflationary expectations, necessitating earlier action by policymakers to keep expectations from rising on the basis of what could still prove to be a transitory but nevertheless persistent, rather than permanent, shock.
Measuring persistence is not straightforward. In a summary of the literature, Pivetta and Reis (2007) discuss a variety of methods for estimating inflation persistence, all of which have advantages and disadvantages. They posit three methods of inflation persistence, each of which will overestimate persistence in some cases and underestimate in others. Each of these three methods is discussed in turn below.
The basis for each of these persistence measures is the estimation of a baseline autoregressive equation of the form
1
Where represents inflation for X, a basket either of food or nonfood items, as time t. This equation can also be written as a lag polynomial:
2
Where L(q) is a polynomial with the same number of lags appearing in (1).
For each country in the sample, equation (1) was estimated for food and nonfood inflation, nine times, with q ranging between 1 and 9. The model chosen for the calculations below was the model with the highest Akaike Information Criterion (AIC) among the 9 estimated models for each price index. The AR(q) models were estimated using the standard maximum likelihood ARIMA technique.
SARC: Sum of Autoregressive Coefficients
The first persistence measure is the sum of autoregressive coefficients, or SARC. For this measure, the AR(q) measure chosen above for each of the inflation indices is estimated, and the ρ coefficients in the equation are summed.
The SARC is a widely used method for assessing persistence, first proposed with some modifications in Andrews and Chen (1994), who present it at as a better single-number estimate of long-run dynamics than unit root tests. However, it also has shortcomings, particularly as relates to oscillating dynamics. If some of the ρ coefficients are positive and others are negative, the sum will be close to zero despite what could be near-infinite dynamics.
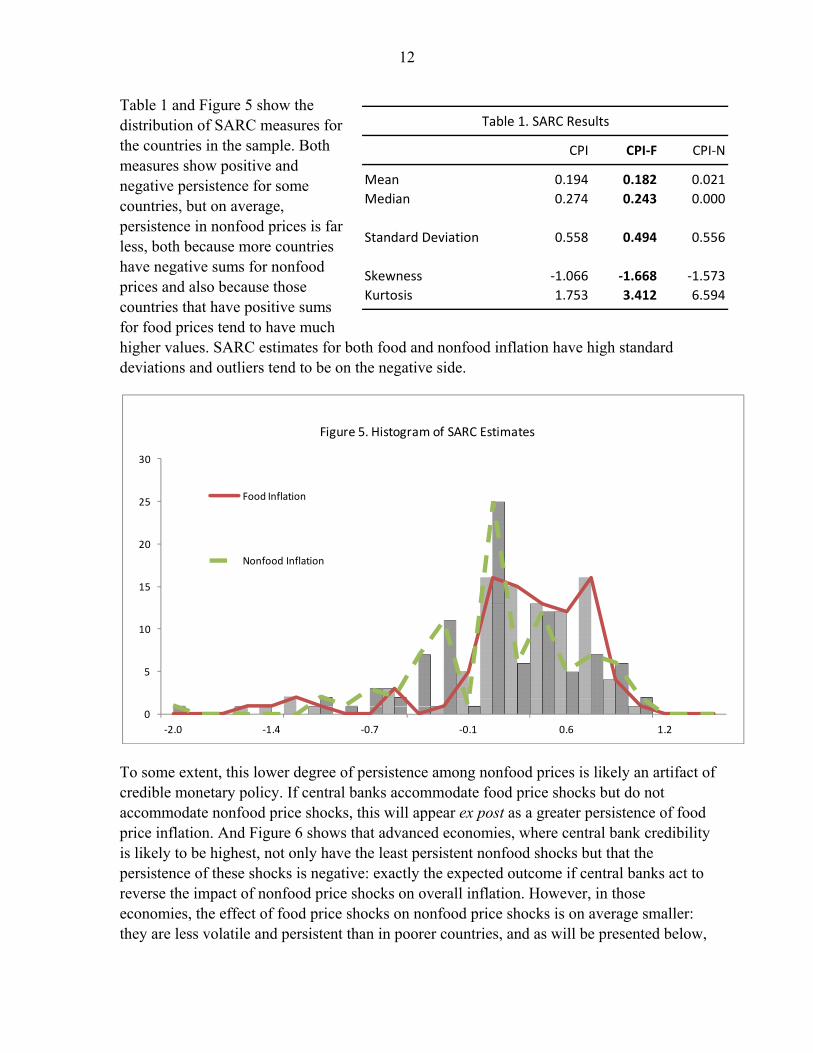
12
Table 1 and Figure 5 show the distribution of SARC measures for the countries in the sample. Both measures show positive and negative persistence for some countries, but on average, persistence in nonfood prices is far less, both because more countries have negative sums for nonfood prices and also because those countries that have positive sums for food prices tend to have much higher values. SARC estimates for both food and nonfood inflation have high standard deviations and outliers tend to be on the negative side.
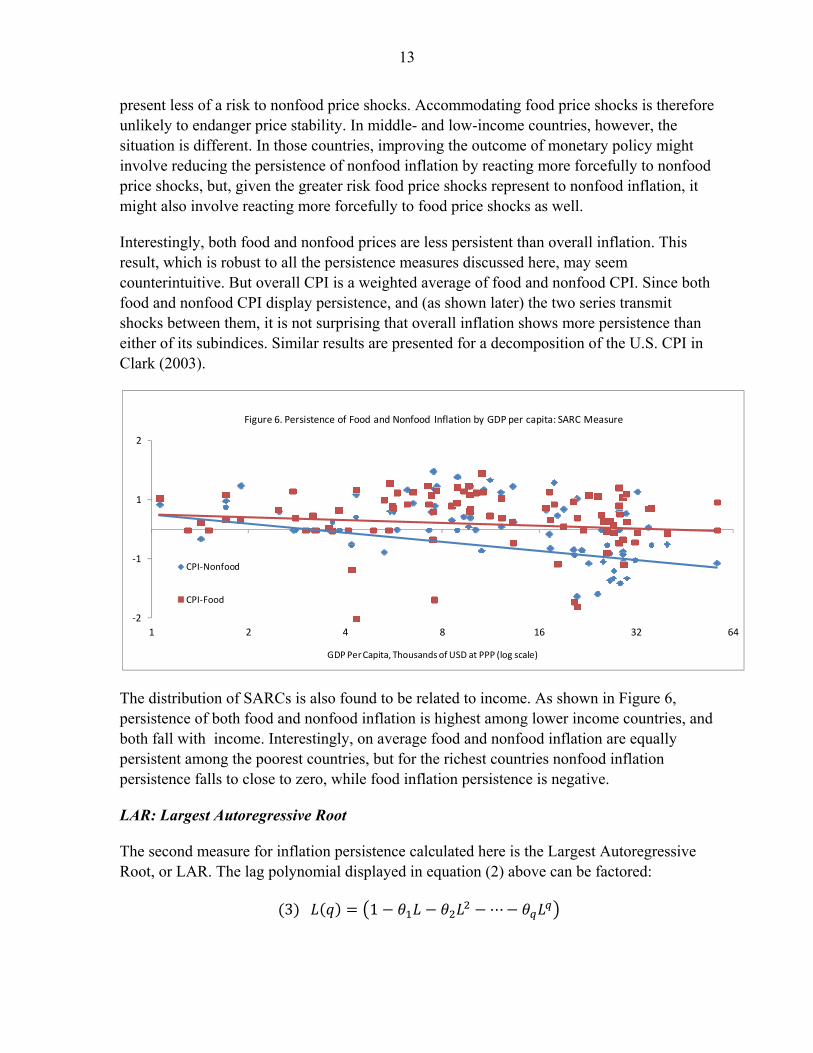
To some extent, this lower degree of persistence among nonfood prices is likely an artifact of credible monetary policy. If central banks accommodate food price shocks but do not accommodate nonfood price shocks, this will appear ex post as a greater persistence of food price inflation. And Figure 6 shows that advanced economies, where central bank credibility is likely to be highest, not only have the least persistent nonfood shocks but that the persistence of these shocks is negative: exactly the expected outcome if central banks act to reverse the impact of nonfood price shocks on overall inflation. However, in those economies, the effect of food price shocks on nonfood price shocks is on average smaller: they are less volatile and persistent than in poorer countries, and as will be presented below,
0
5
10
15
20
25
30
-2.0 -1.4 -0.7 -0.1 0.6 1.2
Food Inflation
Nonfood Inflation
Figure 5. Histogram of SARC Estimates
CPI CPI-F CPI-N
Mean 0.194 0.182 0.021
Median 0.274 0.243 0.000
Standard Deviation 0.558 0.494 0.556
Skewness -1.066 -1.668 -1.573
Kurtosis 1.753 3.412 6.594
Table 1. SARC Results
13
present less of a risk to nonfood price shocks. Accommodating food price shocks is therefore unlikely to endanger price stability. In middle- and low-income countries, however, the situation is different. In those countries, improving the outcome of monetary policy might involve reducing the persistence of nonfood inflation by reacting more forcefully to nonfood price shocks, but, given the greater risk food price shocks represent to nonfood inflation, it might also involve reacting more forcefully to food price shocks as well.
Interestingly, both food and nonfood prices are less persistent than overall inflation. This result, which is robust to all the persistence measures discussed here, may seem counterintuitive. But overall CPI is a weighted average of food and nonfood CPI. Since both food and nonfood CPI display persistence, and (as shown later) the two series transmit shocks between them, it is not surprising that overall inflation shows more persistence than either of its subindices. Similar results are presented for a decomposition of the U.S. CPI in Clark (2003).
The distribution of SARCs is also found to be related to income. As shown in Figure 6, persistence of both food and nonfood inflation is highest among lower income countries, and both fall with income. Interestingly, on average food and nonfood inflation are equally persistent among the poorest countries, but for the richest countries nonfood inflation persistence falls to close to zero, while food inflation persistence is negative.
LAR: Largest Autoregressive Root
The second measure for inflation persistence calculated here is the Largest Autoregressive Root, or LAR. The lag polynomial displayed in equation (2) above can be factored:
3 1
-2
-1
1
2
1 2 4 8 16 32 64
GDP Per Capita, Thousands of USD at PPP (log scale)
CPI-Nonfood
CPI-Food
Figure 6. Persistence of Food and Nonfood Inflation by GDP per capita: SARC Measure
14
4 1 … 1
Where the coefficients are ordered according to their size, with the largest. In the long run, the effect of a shock on inflation will be dominated by this largest root: in the case where ρ is one, the series has a unit root, and all shocks are permanent. The advantage to the LAR measure is that it effectively measures how close a given inflation series is to having a unit root, that is, how close to permanent a given shock will be. A disadvantage, however, is that the other roots beyond the unit root are ignored, while they matter too in practice, for example, a series with a of coefficient of 0.8 will display more persistence than one with 0.2.
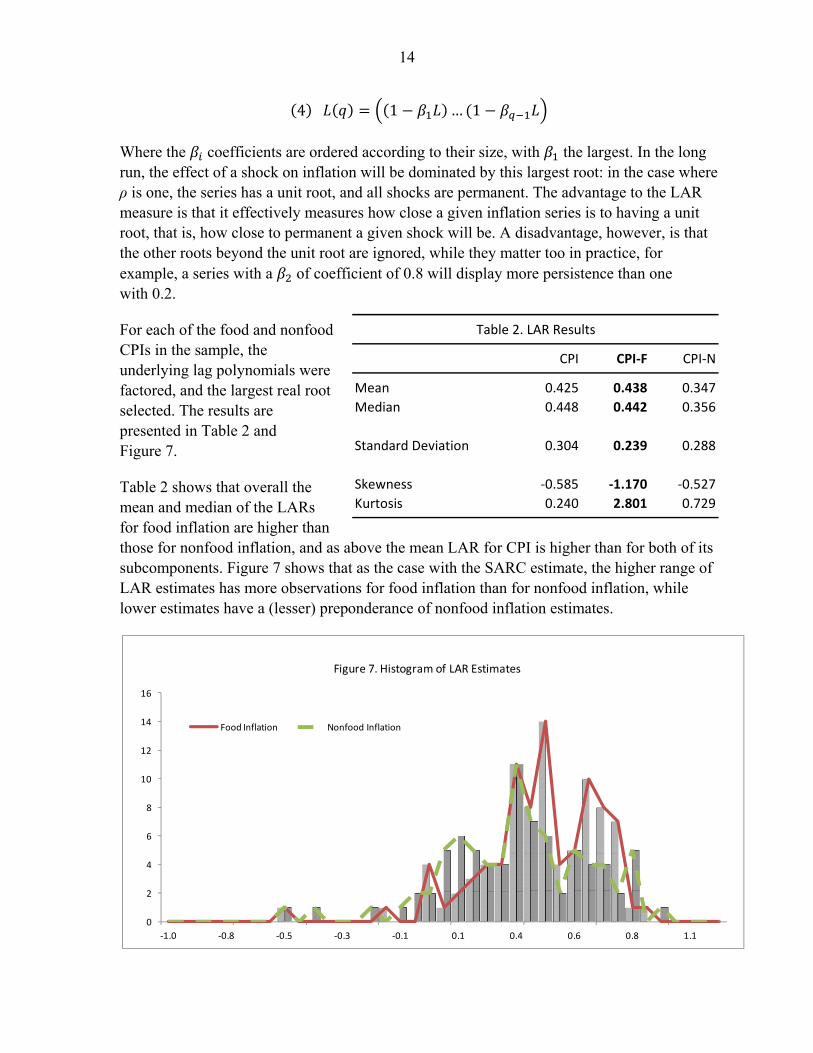
For each of the food and nonfood CPIs in the sample, the underlying lag polynomials were factored, and the largest real root selected. The results are presented in Table 2 and Figure 7.
Table 2 shows that overall the mean and median of the LARs for food inflation are higher than those for nonfood inflation, and as above the mean LAR for CPI is higher than for both of its subcomponents. Figure 7 shows that as the case with the SARC estimate, the higher range of LAR estimates has more observations for food inflation than for nonfood inflation, while lower estimates have a (lesser) preponderance of nonfood inflation estimates.
0
2
4
6
8
10
12
14
16
-1.0 -0.8 -0.5 -0.3 -0.1 0.1 0.4 0.6 0.8 1.1
Food Inflation Nonfood Inflation
Figure 7. Histogram of LAR Estimates
CPI CPI-F CPI-N
Mean 0.425 0.438 0.347
Median 0.448 0.442 0.356
Standard Deviation 0.304 0.239 0.288
Skewness -0.585 -1.170 -0.527
Kurtosis 0.240 2.801 0.729
Table 2. LAR Results
15
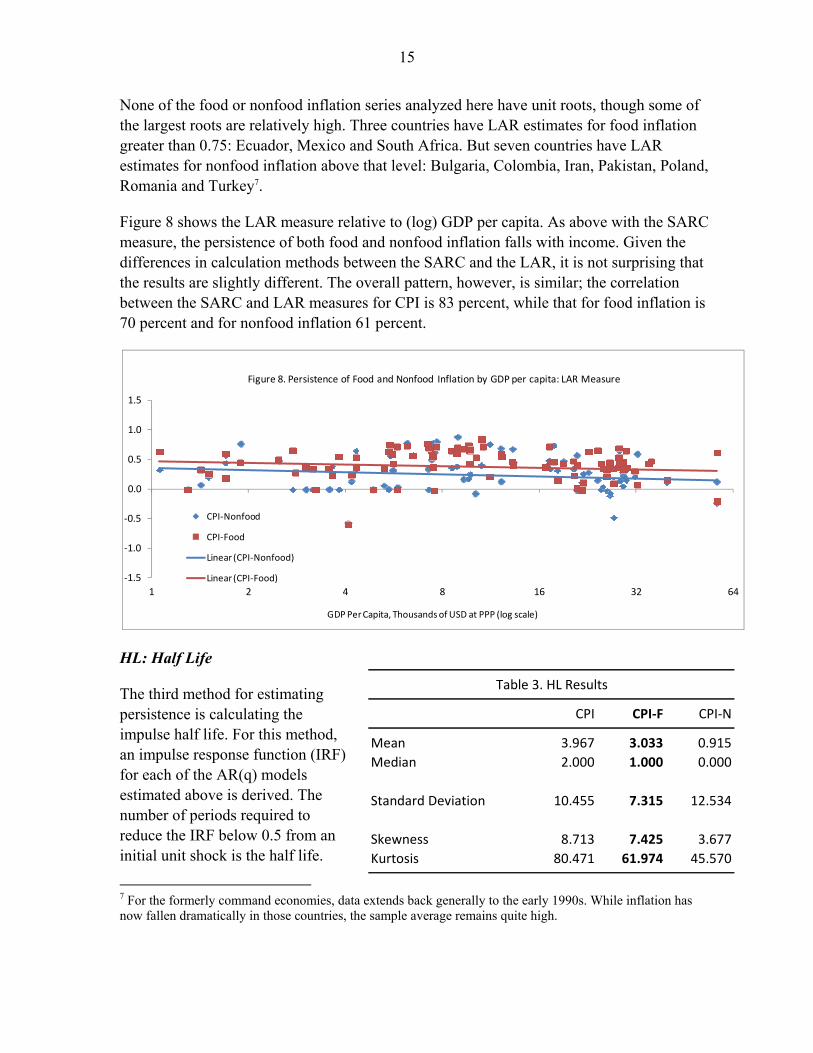
None of the food or nonfood inflation series analyzed here have unit roots, though some of the largest roots are relatively high. Three countries have LAR estimates for food inflation greater than 0.75: Ecuador, Mexico and South Africa. But seven countries have LAR estimates for nonfood inflation above that level: Bulgaria, Colombia, Iran, Pakistan, Poland, Romania and Turkey7.
Figure 8 shows the LAR measure relative to (log) GDP per capita. As above with the SARC measure, the persistence of both food and nonfood inflation falls with income. Given the differences in calculation methods between the SARC and the LAR, it is not surprising that the results are slightly different. The overall pattern, however, is similar; the correlation between the SARC and LAR measures for CPI is 83 percent, while that for food inflation is 70 percent and for nonfood inflation 61 percent.
HL: Half Life
The third method for estimating persistence is calculating the impulse half life. For this method, an impulse response function (IRF) for each of the AR(q) models estimated above is derived. The number of periods required to reduce the IRF below 0.5 from an initial unit shock is the half life.
7 For the formerly command economies, data extends back generally to the early 1990s. While inflation has now fallen dramatically in those countries, the sample average remains quite high.
-1.5
-1.0
-0.5
0.0
0.5
1.0
1.5
1 2 4 8 16 32 64
GDP Per Capita, Thousands of USD at PPP (log scale)
CPI-Nonfood
CPI-Food
Linear (CPI-Nonfood)
Linear (CPI-Food)
Figure 8. Persistence of Food and Nonfood Inflation by GDP per capita: LAR Measure
CPI CPI-F CPI-N
Mean 3.967 3.033 0.915
Median 2.000 1.000 0.000
Standard Deviation 10.455 7.315 12.534
Skewness 8.713 7.425 3.677
Kurtosis 80.471 61.974 45.570
Table 3. HL Results
16
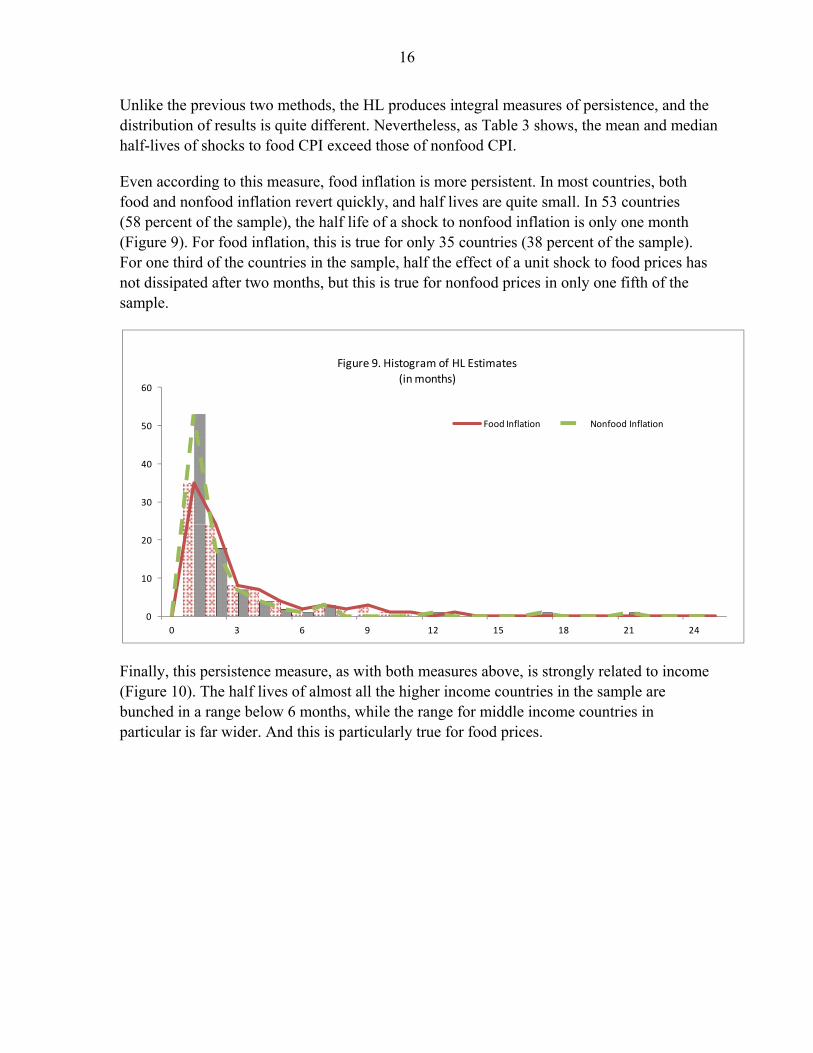
Unlike the previous two methods, the HL produces integral measures of persistence, and the distribution of results is quite different. Nevertheless, as Table 3 shows, the mean and median half-lives of shocks to food CPI exceed those of nonfood CPI.
Even according to this measure, food inflation is more persistent. In most countries, both food and nonfood inflation revert quickly, and half lives are quite small. In 53 countries (58 percent of the sample), the half life of a shock to nonfood inflation is only one month (Figure 9). For food inflation, this is true for only 35 countries (38 percent of the sample). For one third of the countries in the sample, half the effect of a unit shock to food prices has not dissipated after two months, but this is true for nonfood prices in only one fifth of the sample.
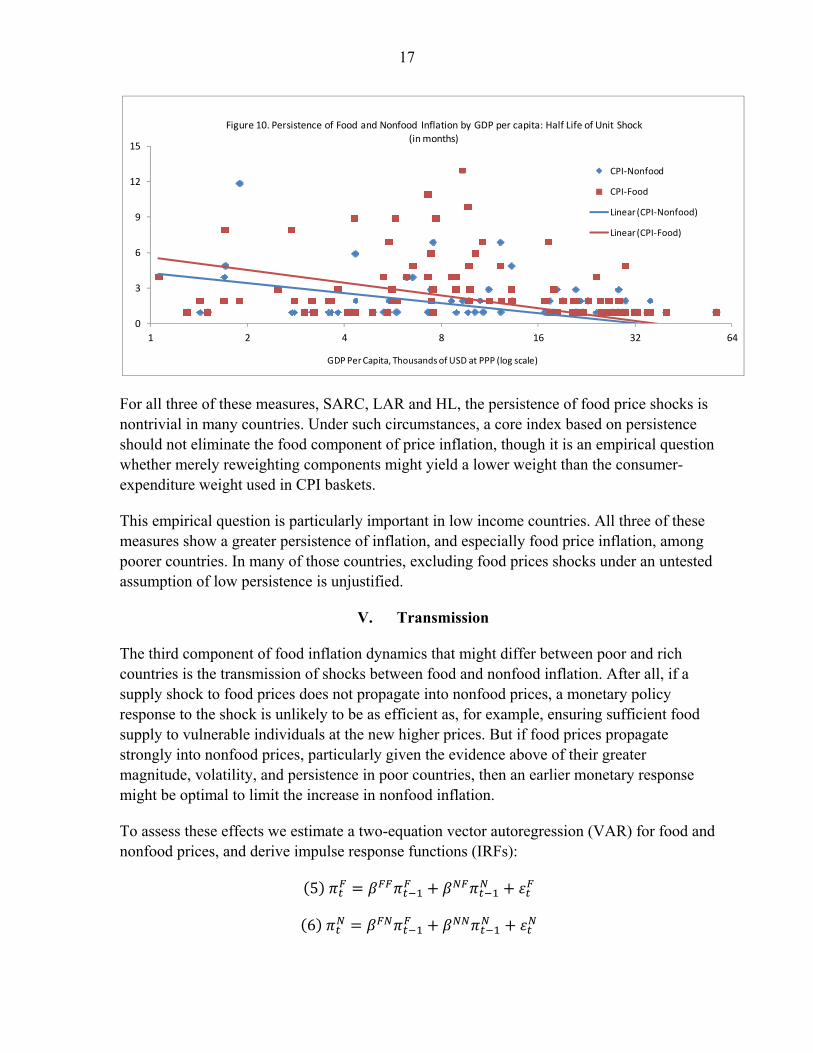
Finally, this persistence measure, as with both measures above, is strongly related to income (Figure 10). The half lives of almost all the higher income countries in the sample are bunched in a range below 6 months, while the range for middle income countries in particular is far wider. And this is particularly true for food prices.
0
10
20
30
40
50
60
0 3 6 9 12 15 18 21 24
Food Inflation Nonfood Inflation
Figure 9. Histogram of HL Estimates(in months)
17
For all three of these measures, SARC, LAR and HL, the persistence of food price shocks is nontrivial in many countries. Under such circumstances, a core index based on persistence should not eliminate the food component of price inflation, though it is an empirical question whether merely reweighting components might yield a lower weight than the consumer-expenditure weight used in CPI baskets.
This empirical question is particularly important in low income countries. All three of these measures show a greater persistence of inflation, and especially food price inflation, among poorer countries. In many of those countries, excluding food prices shocks under an untested assumption of low persistence is unjustified.
V. Transmission
The third component of food inflation dynamics that might differ between poor and rich countries is the transmission of shocks between food and nonfood inflation. After all, if a supply shock to food prices does not propagate into nonfood prices, a monetary policy response to the shock is unlikely to be as efficient as, for example, ensuring sufficient food supply to vulnerable individuals at the new higher prices. But if food prices propagate strongly into nonfood prices, particularly given the evidence above of their greater magnitude, volatility, and persistence in poor countries, then an earlier monetary response might be optimal to limit the increase in nonfood inflation.
To assess these effects we estimate a two-equation vector autoregression (VAR) for food and nonfood prices, and derive impulse response functions (IRFs):
5
6
0
3
6
9
12
15
1 2 4 8 16 32 64
GDP Per Capita, Thousands of USD at PPP (log scale)
CPI-Nonfood
CPI-Food
Linear (CPI-Nonfood)
Linear (CPI-Food)
Figure 10. Persistence of Food and Nonfood Inflation by GDP per capita: Half Life of Unit Shock(in months)
18
where is food inflation and is nonfood inflation. The equations are estimated jointly, using standard maximum likelihood techniques for seemingly unrelated equations.
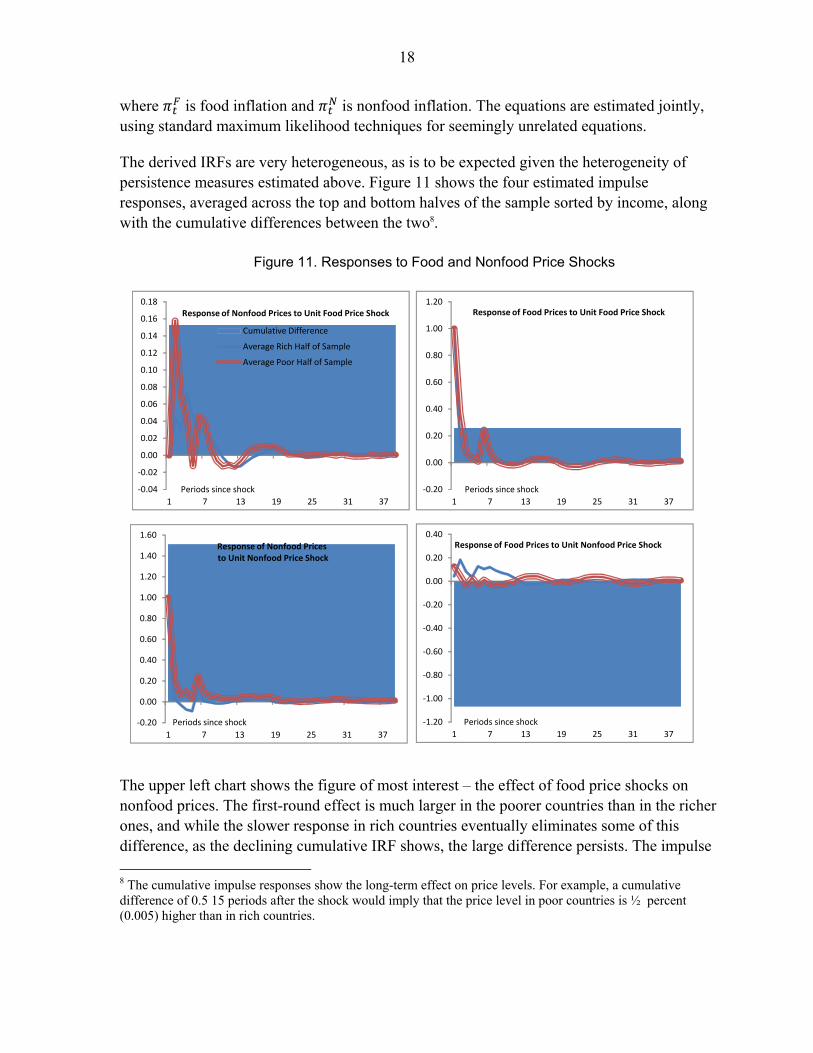
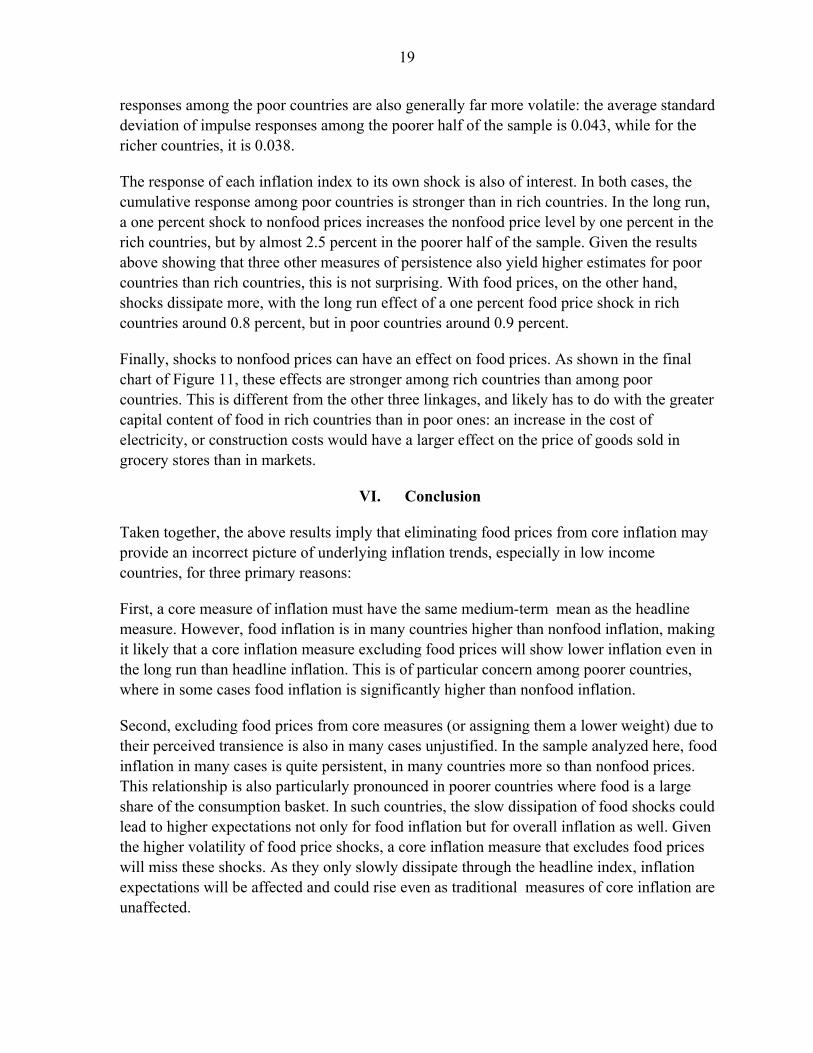
The derived IRFs are very heterogeneous, as is to be expected given the heterogeneity of persistence measures estimated above. Figure 11 shows the four estimated impulse responses, averaged across the top and bottom halves of the sample sorted by income, along with the cumulative differences between the two8.
The upper left chart shows the figure of most interest – the effect of food price shocks on nonfood prices. The first-round effect is much larger in the poorer countries than in the richer ones, and while the slower response in rich countries eventually eliminates some of this difference, as the declining cumulative IRF shows, the large difference persists. The impulse
8 The cumulative impulse responses show the long-term effect on price levels. For example, a cumulative difference of 0.5 15 periods after the shock would imply that the price level in poor countries is ½ percent (0.005) higher than in rich countries.
Figure 11. Responses to Food and Nonfood Price Shocks
-0.04
-0.02
0.00
0.02
0.04
0.06
0.08
0.10
0.12
0.14
0.16
0.18
1 7 13 19 25 31 37
Cumulative Difference
Average Rich Half of Sample
Average Poor Half of Sample
Response of Nonfood Prices to Unit Food Price Shock
Periods since shock -0.20
0.00
0.20
0.40
0.60
0.80
1.00
1.20
1 7 13 19 25 31 37
Response of Food Prices to Unit Food Price Shock
Periods since shock
-0.20
0.00
0.20
0.40
0.60
0.80
1.00
1.20
1.40
1.60
1 7 13 19 25 31 37
Response of Nonfood Pricesto Unit Nonfood Price Shock
Periods since shock -1.20
-1.00
-0.80
-0.60
-0.40
-0.20
0.00
0.20
0.40
1 7 13 19 25 31 37
Response of Food Prices to Unit Nonfood Price Shock
Periods since shock
19
responses among the poor countries are also generally far more volatile: the average standard deviation of impulse responses among the poorer half of the sample is 0.043, while for the richer countries, it is 0.038.
The response of each inflation index to its own shock is also of interest. In both cases, the cumulative response among poor countries is stronger than in rich countries. In the long run, a one percent shock to nonfood prices increases the nonfood price level by one percent in the rich countries, but by almost 2.5 percent in the poorer half of the sample. Given the results above showing that three other measures of persistence also yield higher estimates for poor countries than rich countries, this is not surprising. With food prices, on the other hand, shocks dissipate more, with the long run effect of a one percent food price shock in rich countries around 0.8 percent, but in poor countries around 0.9 percent.
Finally, shocks to nonfood prices can have an effect on food prices. As shown in the final chart of Figure 11, these effects are stronger among rich countries than among poor countries. This is different from the other three linkages, and likely has to do with the greater capital content of food in rich countries than in poor ones: an increase in the cost of electricity, or construction costs would have a larger effect on the price of goods sold in grocery stores than in markets.
VI. Conclusion
Taken together, the above results imply that eliminating food prices from core inflation may provide an incorrect picture of underlying inflation trends, especially in low income countries, for three primary reasons:
First, a core measure of inflation must have the same medium-term mean as the headline measure. However, food inflation is in many countries higher than nonfood inflation, making it likely that a core inflation measure excluding food prices will show lower inflation even in the long run than headline inflation. This is of particular concern among poorer countries, where in some cases food inflation is significantly higher than nonfood inflation.
Second, excluding food prices from core measures (or assigning them a lower weight) due to their perceived transience is also in many cases unjustified. In the sample analyzed here, food inflation in many cases is quite persistent, in many countries more so than nonfood prices. This relationship is also particularly pronounced in poorer countries where food is a large share of the consumption basket. In such countries, the slow dissipation of food shocks could lead to higher expectations not only for food inflation but for overall inflation as well. Given the higher volatility of food price shocks, a core inflation measure that excludes food prices will miss these shocks. As they only slowly dissipate through the headline index, inflation expectations will be affected and could rise even as traditional measures of core inflation are unaffected.
20
Third, food inflation in many countries is transmitted into nonfood inflation in a significant and important way, and again, this is particularly so in developing economies. In both rich and poor countries, large upward food price shocks are propagated into nonfood prices relatively quickly. However, this effect is much more pronounced in poor countries than in rich countries: in rich countries, a one percent shock to food prices on average results in a 0.15 percent increase in nonfood prices, but in poor countries the average is around 0.3 percent.
This effect is aggravated by the high volatility of and right skew to food prices. With large price shocks more likely to occur among food prices than among nonfood prices, discounting food price developments in countries where food price shocks are transmitted strongly or quickly to nonfood prices can lead to an underestimate of the medium-term effect of those shocks.
Given these effects, core inflation indices which minimize or even eliminate food prices from a headline index are likely to be misspecified in many developing economies. Policymakers should thus return to first principles in constructing core price indices for assessing medium-term developments. Whether these are based on reducing the weight of the more volatile components of the price index or that of the more transient components, it is not clear that such a calculation will result in the construction of a core price index that underweights food price inflation.
For policymakers in many countries, food inflation is therefore not something that can be broadly disregarded as a phenomenon only tenuously linked to underlying medium-term inflation developments. While this issue assumed some salience before the global financial crisis, as food prices increased dramatically during 2003-2007, the rapid disinflation brought on by the crisis caused these concerns to recede. Now as food prices have begun to rise again globally, policymakers are again faced with the question of to what extent a divergence between headline inflation and measures of inflation excluding food prices represents a development calling for an active response.
The evidence in this paper implies that, if the transmission of food price shocks into nonfood prices is strong, as it is in many low income countries, then central banks should be aware of the impact that food prices may have on the broader price index. In some cases this may mean that stronger policy action is warranted earlier in a tightening cycle, though this will depend on circumstances: food inflation is indeed quite volatile, and central banks, particularly in countries with weak mechanisms for monetary transmission, should not overreact to transitory shocks by tightening policy prematurely. This will also depend on the central bank’s broader exchange rate and monetary policy regimes, and analyzing how the dynamics summarized above are influenced by varying policy regimes is itself an important area for further research. But in all cases, looking at how rapidly food price shocks impact nonfood inflation can help central banks be vigilant about stemming an incipient rise in nonfood inflation that could be spilling over from food prices.
21
References
Alvarez, Luis J. et al., 2005. “Sticky Prices in the Euro Area: A Summary of New Micro Evidence.” European Central Bank Working Paper No. 563.
Anand, Rahul and Prasad, Eswar S., 2010. “Optimal Price Indices for Targeting Inflation Under Incomplete Markets,” NBER Working Paper Series, Vol. w16290.
Andrews, Donald W.K. and Hong-Yuan Chen, 1994. “Approximately Median-Unbiased Estimation of Autoregressive Models,” Journal of Business and Economic Statistics, Vol. 12, No. 2.
Bilke, Laurent and Stracca, Livio, 2008. “A Persistence-Weighted Measure of Core Inflation in the Euro Area,” ECB Working Paper No. 905.
Bryan, Michael F. and Cecchetti, Stephen G., 1993. “Measuring Core Inflation,” Chapter 6 in N. G. Mankiw, ed., “Monetary Policy,” Univ. of Chicago Press, pp. 195-215.
Catão, Luis A.V. and Roberto Chang, 2010. “World Food Prices and Monetary Policy,” IMF Working Paper 10/161.
Cecchetti, Stephen G., 2007. “Core Inflation is an Unreliable Guide”, VoxEU, March 1, 2007.
Cecchetti, Stephen G. and Moessner, Richhild, 2008. “Commodity Prices and Inflation Dynamics,” BIS Quarterly Review, pp. 55-66, December 2008.
Clark, Todd E., 2003. “Disaggregate Evidence on the Persistence of Consumer Price Inflation”, Federal Reserve Bank of Kansas City Working Paper RWP 03-11.
Cutler, Joanne, 2001. “Core Inflation in the UK”, External MPC Unit Discussion Paper No. 3, Bank of England.
Pivetta, Frederic, and Ricardo Reis, 2007. “The Persistence of Inflation in the United States”, Journal of Economic Dynamics and Control, Volume 31, Issue 4, April 2007, Pages 1326-1358
Rich, Robert W. and Steindel, Charles, 2007. “A Comparison of Measures of Core Inflation,” Economic Policy Review, Vol. 13, No. 3.
Stock, James H.,1991. “Confidence Intervals for the Largest Autoregressive Root in U.S. Macroeconomic Time Series”, NBER Technical Working Paper No. 105, Cambridge MA.


