90
EPA/ROD/R04-95/232 1995 EPA Superfund Record of Decision: HOMESTEAD AIR FORCE BASE EPA ID: FL7570024037 OU 04 HOMESTEAD AIR FORCE BASE, FL 06/22/1995

EPA/ROD/R04-95/2321995
EPA Superfund
Record of Decision:
HOMESTEAD AIR FORCE BASEEPA ID: FL7570024037OU 04HOMESTEAD AIR FORCE BASE, FL06/22/1995
FINAL RECORD OF DECISION FOR OPERABLE UNIT 4SITE SS-8, MOTOR POOL OIL LEAK AREA HOMESTEAD AIR RESERVE BASE, FLORIDA January 1995 Prepared for: U. S. Army Corps of EngineersMissouri River DivisionOmaha DistrictOmaha, Nebraska Prepared by: Montgomery Watson3501 North Causeway Boulevard, Suite 300Metairie, Louisiana 70002
RECORD OF DECISION Operable Unit 4Site SS-8, Motor Pool Oil Leak AreaHomestead Air Reserve BaseHomestead, FloridaFDEP Facility No. 138521996 January 1995 Montgomery Watson appreciates the opportunity to work for the U.S. Army Corps of Engineers, at the HomesteadAir Reserve Base facility in Homestead, Florida. If you have any questions or comments concerning thisreport, please contact one of the individuals listed below. Respectfully submitted, MONTGOMERY WATSON Randall S. Luwe, P.G.Project Manager
Jerry D. Gaccetta, P.G.Project Engineer

Homestead Air Reserve Base, FloridaOperable Unit 4Site SS-8, Motor Pool Oil Leak Area Declaration for the Record of Decision
DECLARATION STATEMENTFOR THERECORD OF DECISION FOR OPERABLE UNIT NO. 4HOMESTEAD AIR FORCE BASE SUPERFUND SITE SITE NAME AND LOCATION Homestead Air Reserve BaseHomestead, Dade County, FloridaOperable Unit No. 4 - Site SS-8Motor Pool Oil Leak Area (former Site SP-2) STATEMENT OF BASIS AND PURPOSE The decision document presents the selected remedial action for the Motor Pool Oil Leak Area (Site SS-8)Operable Unit No. 4, at Homestead Air Reserve Base, in Homestead, Florida. The selected remedial action ischosen in accordance with CERCLA, as amended by SARA, and, to the extent practicable, the National Oil andHazardous Substances Pollution Contingency Plan (NCP). This decision document explains the basis forselecting the remedial alternative for this Site. The information that forms the basis for this remedialaction is contained in the administrative record for this site. The selected alternative for Site SS-8 is institutional controls and groundwater monitoring. The State ofFlorida, the U.S. Environmental Protection Agency (USEPA), and the U.S Air Force (USAF) concur with theselected remedy presented in this Record of Decision (ROD). ASSESSMENT OF THE SITE Actual or threatened releases of hazardous substances from this site, if not addressed by implementing theresponse actions selected in this ROD may present a current or potential threat to public health, welfare, orthe environment.
DESCRIPTION OF THE SELECTED REMEDY The response action selected in the document addresses, through institutional controls, the health andenvironmental threats at this site, exposure to soil contamination. It also requires groundwater monitoring. The major components of the selected remedy include: ! Implementation of deed restrictions covenants to limit usage of Site SS-8 to the Base worker
and to limit construction activities to only those where workers are appropriately protectedand erosion and silt control implemented.
! Site fencing and signage indicating use of the site. ! Groundwater monitoring program to assess potential release of contaminants from the identified
source. ! Five year review to determine whether the site remains protective of human health and the
environment. STATUTORY DETERMINATIONS

The selected remedy is protective of human health and the environment, complies with Federal and Staterequirements that are legally applicable or relevant and appropriate to remedial action, and is costeffective. This remedy utilizes permanent solutions and alternative treatment technologies to the maximumextent practicable for this site. However, because treatment of the principal threats at the site were notfound to be practicable, this remedy does not satisfy the statuary preference for treatment as a principalelement of the remedy. The nature of the risk to human health is minimal. Manganese is the only chemical ofconcern to current and future Base workers and polynuclear aromatic hydrocarbons (PAHs) are the onlychemicals of concern for future child residents. Under the current conditions, the only significant exposureis to surface soils which is minimal due to the presence of the asphalt cover over much of the site. Withinstitutional controls these risks do not present a threat to human health or the environmental, therefore,the most cost effective remedial action is being implemented based on evaluation of this risk and potentialsite usage. Because this remedy will result in hazardous substances, pollutants, or contaminants remaining on-site abovehealth-based levels, a review will be concluded within five (5) years after commencement of remedial actionto ensure that the remedy continues to provide adequate protection of human health and the environment. Thereview will be performed every five (5) years thereafter. UNITED STATES AIR FORCEHOMESTEAD AIR FORCE BASE By: ___________________ Date: ___________________ ALAN K. OLSEN Director Air Force Base Conversion Agency

Homestead Air Reserve Base, FloridaOperable Unit 4Site SS-8, Motor Pool Oil Leak Area Decision Summary for the Record of Decision
TABLE OF CONTENTS Page
1.0 SITE NAME, LOCATION, AND DESCRIPTION................................. 1 1.1 Operable Unit No. 4 Description................................ 2 1.2 Regional Land Use.............................................. 3 1.3 Regional Surface Hydrology..................................... 3 1.3.1 Regional Hydrogeologic Setting........................... 4 1.4 Regional Site Geology And Hydrogeology ........................ 5 2.0 HISTORY AND ENFORCEMENT ACTIVITIES................................... 6 2.1 Site SS-8 History.............................................. 6 2.1.2 Past Site Usage ......................................... 6 2.2 Base Enforcement History ...................................... 7 2.2.1 CERCLA Regulatory History............................... 7 2.3 Investigation History.......................................... 8 2.3.1 IRP Phase I - Record Search.............................. 8 2.3.2 IRP Phase II - Confirmation/Quantifications.............. 9 2.3.3 IRP Phase III - Technology Base Development.............. 10 2.3.4 IRP Phase IV - Additional Investigations................. 10 2.3.4.1. Phase IV-A Groundwater Investigations.......... 11 2.3.4.2 Phase IV-A Sediment Investigation............... 11 2.3.4.3 Phase IV-A Surface Water Investigation ......... 12 2.3.5 1991 Remedial Investigation of Site SS-8................. 12 2.3.6 1993 Remedial Investigation of Site SS-8 ................ 12 2.4 Community Participation History ............................... 13 2.5 Scope And Role Of Responsible Action........................... 13 2.6 Summary Of Site Characteristics................................ 14 2.6.1 Nature and Extent Contamination............................ 14 2.6.2 Groundwater Investigations............................ 14 2.6.2.1 Initial Investigations (1988)................. 14 2.6.2.2 1991 Investigation............................ 15 2.6.2.3 1993 Investigation............................ 16 2.6.3 Soil Sample Analytical Results.......................... 16

TABLE OF CONTENTS (continued) Page 2.6.3.1 Initial Investigations (1988)................. 16 2.6.3.2 1993 Investigation............................ 17 2.6.4 Sediment Sample Analytical Results ................... 18 2.6.4.1 Initial Investigations (1986-1991)............ 18 2.6.4.2 1993 Investigation............................ 18 2.6.5 Surface Water Sample Analytical Results............... 19 2.6.5.1 Initial Investigations (1991)................. 19 2.6.5.2 1993 Investigation............................ 19 2.7 Summary of Site Risks .......................................... 19 2.7.1 Selection of Chemicals of Potential Concern ............. 20 2.7.2 Exposure Assessment...................................... 21 2.7.2.1 Exposure Point Concentrations.................. 21 2.7.2.2 Land Use....................................... 21 2.7.2.3 Exposure Scenarios............................. 22 2.7.3 Toxicity Assessment ..................................... 22 2.7.4 Risk Characterization.................................... 23 2.7.4.1 Carcinogenic Risk.............................. 23 2.7.4.2 Hazards Due to Non-Carcinogenic Chemicals...... 24 2.7.4.3 Total Risk..................................... 25 2.7.4.4 Risk from Lead Exposure........................ 25 2.7.5 Chemicals of Concern and Remedial Goal Options........... 25 2.7.6. Ecological Risk Assessment.............................. 26 2.8 Uncertainties in the Risk Assessment............................ 26 2.9 Description of the Alternative.................................. 27 2.9.1 Alternative Number 1 - No Action with Groundwater Monitoring.............................................. 27 2.9.1.1 Description.................................... 27 2.9.2 Alternative Number 2 - Institutional Controls and Groundwater Monitoring.................................. 28 2.9.3 Alternative Number 3 - Soil Excavation and Disposal with Groundwater Monitoring.................................. 29 2.10 Summary Of Comparative Analysis Of Alternatives................. 29 2.10.1 Overall Protection of Human Health and Environment...... 30
TABLE OF CONTENTS (continued) Page
2.10.2 Compliance with Federal/State Standard .............. 30 2.10.3 Long-term Effectiveness and Permanence............... 30 2.10.4 Treatment to Reduce Toxicity, Mobility, or Volume.... 31 2.10.5 Short-Term Effectiveness............................. 31 2.10.6 Implementability..................................... 31 2.10.7 Cost ................................................ 31 2.11 Selected Remedy .............................................. 31 2.12 Statutory Determinations...................................... 32 2.13 Documentation of Significant Changes.......................... 33
LIST OF FIGURES Figure Title Follows No. ____________________________________________________________________ Page 1-1 Locaiton of Homestead Air Force Base................................ 1 1-2 Base Location Map................................................... 2 1-3 Site SS-8, Study Area .............................................. 2 2-1 1991 & 1993 Field Investigations Surface water, sediment, soil, and Groundwater Sampling Locations, Site SS-8, Motor Pool Leak Area..... 14

LIST OF TABLES Table Title Follows No _____________________________________________________________________ Page 2-1 Groundwater Analytical Results, Geraghty & Miller Phase IV-A (1988) Investigation ...................................... 11 2-2 Sediment Analytical Results, Geraghty & Miller Phase IV-A (1988) Investigation ...................................... 11 2-3 Sediment Analytical Results, Geraghty & Miller Phase IV-A (1988) Investigation....................................... 11 2-4 Summary of Groundwater Analytical Results, Geraghty & Miller (1991).............................................. 15 2-5 Summary of Constituents Detected in Groundwater Samples, Montgomery Watson, 1993 .............................................. 16 2-6 Summary of Constituents Detected in Soil Samples, Montgomery Watson, 1993 .............................................. 17 2-7 Summary of Constituents Detected in Sediment Samples, Geraghty & Miller, 1991 .............................................. 18 2-8 Summary of Constituents Detected in Sediment Samples, Montgomery Watson, 1993 .............................................. 19 2-9 Summary of Surface Water Analytical Results, Geraghty & Miller, 1991 .............................................. 19 2-10 Summary of Constituents Detected in Surface Water Samples, Montgomery Watson, 1993............................................... 20 2-11 Compounds of Potential Concern in Environmental Media................. 20 2-12 Exposure Point Concentrations for Groundwater......................... 21 2-13 Exposure Point Concentrations for Surface Water ...................... 21 2-14 Exposure Point Concentrations for Subsurface Soil .................... 21 2-15 Equation and Sample Calculation for Hypothetical Future Potable Groundwater Exposure.................................................. 22 2-16 Equation and Sample Calculation for Surface Soil Exposure............. 22 2-17 Equation and Sample Calculation for Hypothetical Future Construction Work for Soil Exposure................................... 22 2-18 Adjusted Toxicity Values Used to Assess Dermal Exposure............... 22
LIST OF TABLES (continued) Table Title Follows No. ________________________________________________________________________ Page 2-19 Risk-Based Remedial Goal Options - Hypothetical Future Adult Resident (Soil).................................................... 26 2-20 Risk-Based Site Specific Remedial Goal Options and FDEP Soil Target Levels, Hypothetical Current Base Worker (Soil)................... 26 2-21 Risk-Based Site Specific Remedial Goal Options and FDEP Soil Target Levels, Hypothetical Future Adult Resident (Soil) ........... 26 2-22 Risk-Based Site Specific Remedial Goal Options and FDEP Soil Target Levels, Hypothetical Future Child Resident (Soil)................. 26 2-23 Risk-Based Site Specific Remedial Goal Options and FDEP Soil Target Levels, Hypothetical Future Construction Worker (Surface Soil).................................................................... 26 2-24 Risk-Based Site Specific Remedial Goal Options and FDEP Soil Target Levels, Hypothetical Future Construction Worker (Subsurface Soil).................................................................... 26 2-25 Identification of Alternatives........................................... 29 2-26 Comparative Cost Analysis of Remedial Alternatives....................... 29 2-27 Comparative Analysis of Remedial Alternatives............................ 29

DECISION SUMMARY FOR THE RECORD OF DECISION 1.0 SITE NAME, LOCATION, AND HISTORICAL DESCRIPTION Homestead Air Reserve Base (ARB) is located approximately 25 miles southwest of Miami and 7 miles east ofHomestead in Dade County, Florida (Figure 1-1). The main Installation covers approximately 2,916 acres whilethe surrounding areas is semi-rural. The majority of the Base is surrounded by agricultural land. The landsurface at Homestead ARB is relatively flat, with elevations ranging from approximately 5 to 10 feet (ft)above mean sea level (msl). The Base is surrounded by a canal that discharges to Outfall Canal andultimately into Biscayne Bay approximately 2 miles east. The Biscayne Aquifer underlies the Base and is the sole source aquifer for potable water in Dade County. Within 3 miles of Homestead ARB an estimated 1,600 people obtain driaking water from the Biscayne Aquiferwhile 18,000 acres of farmland are irrigated from aquifer wells (United States Environmental ProtectionAgency [USEPA], 1990). All recharge to the aquifer is through rainfall. Homestead Army Air Field, a predecessor of Homestead ARB, was activated in September 1942, when the CaribbeanWing Headquarters took over the air field previously used by Pan American Air Ferries, Inc. The airline haddeveloped the site a few years earlier and used it primarily for pilot training. Prior to that time, thesite was undeveloped. Initially operated as a staging facility, the field mission was changed in 1943 totraining transport pilots and crews. In September 1945, a severe hurricane caused extensive damage to the air field. The Base property was thenturned over to Dade County and was managed by the Dade County Port Authority for the next eight years. During this period, the runways were used by crop dusters and the buildings housed a few small industrial andcommercial operations.
<IMG SRC 0495232><IMG SRC 0495232A>
In 1953, the federal government again acquired the airfield, together with some surrounding property, andrebuilt the Site as a Strategic Air Command (SAC) Base. The Base operated under SAC until July 1968, when itwas changed to the Tactical Air Command (TAC) and the 4531st Tactical Fighter Wing became the new host. TheBase was transferred to Headquarters Air Combat Command on June 1, 1992. In August 1992, Hurricane Andrew struck south Florida causing extensive damage to the Base. The Base wasplaced on the 1993 Base Realignment and Closure (BRAC) list and slated for realignment with a reducedmission. Air Combat Command departed the Base on March 31, 1994, with Air Force Reservists activated at theBase on Aril 1, 1994. The 482nd Reserve Fighter Wing now occupies approximately 1/3 of the Base with theremaining 2/3 slated for use and oversight by Dade County. 1.1 OPERABLE UNIT NO. 4 DESCRIPTION Operable Unit (OU) No. 4 is the Motor Pool Oil Leak Area, Site SS-8 (former Site SP-2). The Motor Pool hasbeen in operation since the Base was reactivated in the 1950's. Site SS-8 is located in the west centralportion of Homestead ARB (formerly Homestead Air Force Base [AFB]) (Figure 1-2), just south of the West Gateon Bougainville Boulevard. Site SS-8 (Figure 1-3) is an asphalt lot that is surrounded on all four sides bya drainage ditch system. The 3 foot wide ditch lies between the site and Elmendorf Street to the north andbetween the site and grassy fields to the south and west, an asphalt parking lot is located east of the site. Building 312, the main motor pool shop, is centrally located within Site SS-8. Additional buildings(Buildings 310, 307, 313, and 308) within the site boundary provide vehicle maintenance, equipment storage,tire repair and storage, and administrative functions.

The ditch surrounding Site SS-8 is a man-made feature which is approximately 3 ft wide by 3 ft deep. Theditch has been cut into the underlying Miami oolite and contains varying thicknesses of sediment. Water inthe ditch is intermittent based solely on rainfall and the area along and within the ditch is moderatelyvegetated with weeds and grasses.
Prior to Hurricane Andrew, the site housed several buildings and numerous roofed concrete slabs used asloading bays and washracks. Due to damage experienced during the hurricane, the cover and frames of thewashracks no longer exist. Site SS-8 is currently the active motor pool for Homestead ARB. The site isprimarily used for cleaning, servicing and repairing the Facility's utility vehicles. There are twomonitoring wells on-site that were installed during the Phase II and Phase IV-A Installation RestorationProgram (IRP) investigations. The ground surface at Site SS-8 is almost entirely covered with asphalt. The asphalt paving ends 2 ft fromthe edge of the drainage ditch along the north and northwest perimeter of the site. A 75 foot wide patch ofsparse grass lies between the asphalt paving and the ditch along the southwestern portion of the boundarybehind Building 307. Along the east edge of the site the asphalt ends approximately 10 ft from the drainageditch with a thin grassy area between the ditch and the asphalt. Building 308, at the northeast end of thesite, is centrally located where the grassy area widens abruptly into a 150 foot by 200 foot square. On a larger scale, Site SS-8 is located southwest of Site SS-2, the POL Bulk Fuel Storage Area (formerly SiteSP-4). Directly north and south of Site SS-8 are vacant fields of sparse grasses overlying a weatheredlimestone surface. The Facility boundary, marked by the Boundary Canal, is adjacent to Site SS-8 to thewest. The drainage canal surrounding Site SS-8 discharges into the Boundary Canal at two points west of SiteSS-8. 1.2 REGIONAL LAND USE The area adjacent to Homestead ARB including Site SS-8, to the west, east, and south within a half-mileradius is primarily composed of farmland and plant nurseries. Residential areas are located within ahalf-mile to the north and southwest of the Base. Woodlands are located approximately one-half-mile east ofthe facility and mangroves and marsh occur adjacent to Biscayne Bay. The Biscayne National Park is locatedtwo miles east of Homestead ARB; the Everglades National park is located 8 miles west-southwest of the Base;and the Atlantic Ocean is approximately eight miles east of the Base. Site SS-8/OU-4 lies within the portionof the Base retained by the Air Force Reserve and will likely continue operating as the facility Motor Pool. Development of the site for other than non-military purposes is not likely in the foreseeable future. 1.3 REGIONAL SURFACE HYDROLOGY Surface hydrology at Homestead ARB, including Site SS-8 is controlled by five main factors: 1) relativelyimpermeable areas covered by runways, buildings and roads; 2) generally high infiltration rates through therelatively thin layer of soil cover; 3) flat topography; 4) generally high infiltration rates through theoutcrop locations of the Miami Oolite Formation; and 5) relatively high precipitation rate compared toevapotranspiration rate. Infiltration is considered to be rapid through surfaces of oolite outcrop and areaswith a thin soil layer. Infiltration rates are accelerated by fractures within the oolite, as well asnaturally occurring solution channels. Precipitation percolates through the relatively thin vadose zone tolocally recharge the unconfined aquifer. Natural drainage is limited because the water table occurs at or near land surface. The construction ofnumerous drainage canals on Homestead ARB has improved surface water drainage and lowered the water table insome areas. Rainfall runoff from within Homestead ARB boundaries is drained via diversion canals to theBoundary Canal. A drainage divide occurs within the Homestead ARB facility property, running from the northern end of thefacility, toward the center. Water in the Boundary Canal flows generally south and east along the westernboundary of the property, and south along the eastern boundary, converging at a storm-water reservoir locatedat the southeastern corner of the Base. Flow out of the stormwater reservoir flows into Outfall Canal,which, in turn, flows east into Biscayne Bay, approximately two miles east of the Base. Water movement is

typically not visible in the canals in dry weather due to the lowered water table and the very low surfacegradient (0.3 ft per mile) that exists at the Base. <IMG SRC 0495232B>
1.3.1 Regional Hydrogeologic Setting The regional hydrogeology in the southeast Florida area consists of two distinct aquifers: the surficialaquifer system, which consists of the Biscayne Aquifer and the Grey Limestone Aquifer, and the lower aquifer,the Floridan Aquifer. Biscayne Aquifer. The Biscayne Aquifer at Homestead ARB consists of the Miami Oolite, Fort ThompsonFormation, and the uppermost part of the Tamiami Formation. In general, the most permeable parts of theaquifer lie within the Miami Oolite and the Fort Thompson Formation. The Biscayne Aquifer underlies all of Dade, Broward, and southeastern Palm Beach Counties. The BiscayneAquifer is the sole source of potable water in Dade County and is a federally-designated sole-source aquiferpursuant to Section 1425 of the Safe Drinking Water Act (SDWA). The Biscayne Aquifer supplies drinking waterto approximately 2.5 million people within local communities. All recharge to the aquifer is derived fromlocal rainfall, part of which is lost to evaporation, transpiration, and runoff. The Biscayne Aquifer has reported transmissivities ranging from approximately 4 to 8 million gallons per dayper foot (mgd/ft) (Allman et al., 1979). Water-table contours indicate that under natural conditions, groundwater flows southeasterly toward BiscayneBay. The hydraulic gradient is approximately 0.3 ft/mile. The water table at Homestead ARB generally isencountered within 5 to 6 ft of land surface, but may occur at or near land surface during the wet season(May to October). Fluctuations of groundwater levels and local variations in the direction of groundwaterflow are due to several factors: 1) differences in infiltration potential; 2) runoff from paved areas; 3)water-level drawdown near pumping wells; 4) significant but localized differences in lithology (e.g.,silt-filled cavities); and 5) drainage effects of canals and water-level control structures. Floridan Aquifer. Underlying the low-permeability sediments of the Tamiami Formation and Hawthorn Group arethe formations which constitute the Floridan Aquifer. The Floridan Aquifer is made up of limestones and dolomites. It is under artesian pressure and water levelsin deep wells may rise 30 to 40 ft above ground surface. Groundwater within these Miocene and Eocene ageformations tends to contain dissolved constituents at levels significantly above those recommended fordrinking water. In view of the poor water quality and the depth of water yielding zones (800 to 900 ft belowground surface [bgs}), the Floridan Aquifer is of limited usefulness as a source of potable water supply inthe study area. 1.4 REGIONAL SITE GEOLOGY AND HYDROGEOLOGY The stratigraphy of the shallow aquifer system as determined from soil borings performed during siteinvestigations by Geraghty & Miller (G&M) and Montgomery Watson, consists of a surficial weathered MiamiOolite ranging in depth from 2 to 6 ft bgs. The weathered limestone consists of a white to brownsemi-consolidated oolitic limestone. This strata is underlain by consolidated to semi-consolidated ooliticand coral limestone interbedded with coarse to fine sand and clayey sand layers and lenses down to the totaldepth of borings (approximately 40 ft bags). Approximately 80% of Site SS-8 is covered with asphalt. The Biscayne Aquifer is one of the most transmissive aquifers in the world. It underlies Homestead ARB. Athin vadose zone, nominally less than 5 ft deep, overlays the groundwater table at the site. As previouslystated, the aquifer structure is a calcium carbonate matrix. This lithology is known to have naturalconcentrations of target analyte list (TAL) metals. In descending order by concentration, calcium, aluminum,iron magnesium, manganese, sodium, and potassium can be considered the primary metals of carbonate rock. Theother TAL metals occur in trace concentrations, less than 50 milligrams per kilogram (mg/kg). The range and
the standard deviations are not provided at this time. It should be expected that, as precipitationinfiltrates and recharge takes place, leaching of metal ions from the weathered vadose zone and shallowunsaturated zone occurs. Regional data collected suggest that concentrations of trace metals can be expectedto be the greatest in the shallow portion of the aquifer because of the proximity to the source (i.e., theweathering vadose structure) and the decreasing retention time with decreasing depth of the saturated zone. These observations support a hydrogeologic model in which the shallow portion of the aquifer has a greaterhorizontal transmissivity than the vertical component during recharge events. However, it is not possiblefrom the available data at the site to quatitatively differentiate horizontal and vertical components of theaquifer's hydrologic conductivity. The possible presence of vertical solution zones is well documented inliterature. The site-specific effects have not been fully investigated. Nevertheless, the available datadoes not lead to the immediate conclusion that this is a necessary task. The conceptual model that theshallow groundwater is discharging to ditches provided sufficient detail to arrive at the remedial decisionfor Site SS-8. 2.0 HISTORY AND ENFORCEMENT ACTIVITIES 2.1 SITE SS-8 HISTORY 2.1.2 Past Site Usage The Motor Pool area has been in operation since the facility was reactivated in the 1950's. Waste oils fromthe Facility's motor pool were collected and stored in two 500 gallon above-ground tanks northeast ofBuilding 307, prior to disposal. Leaks in the tanks have occurred at various times since 1960, resulting inoil spills on the surrounding ground surface. In addition to waste oils, spills from used batteries thatwere stored at the site were also reported. Partly because of the site's proximity to a Base well field, the initial evaluation of Site SS-8 informationresulted in a moderately high score in relation to potential environmental impact. 2.2 BASE ENFORCEMENT HISTORY 2.2.1 CERCLA Regulatory History The Comprehensive Environmental Response, Compensation and Liability Act of 1980 (CERCLA) established anational program for responding to releases of hazardous substances into the environment. In anticipation ofCERCLA, the Department of Defense (DOD) developed the Installation Restoration Program (IRP) for responseactions for potential releases of toxic or hazardous substances at DOD facilities. Like the USEPA SuperfundProgram, the IRP follows the procedures of the National Oil and Hazardous Substances Pollution ContingencyPlan (NCP). Homestead ARB was already engaged in tne IRP Program when it was placed on the NationalPriorities List (NPL) on August 30, 1990. Cleanup of DOD facilities is paid for by the Defense EnvironmentalRestoration Account (DERA), which is DOD's version of Superfund. The Superfund Amendment and Reauthorization Act (SARA), enacted in 1986, requires federal facilities tofollow NCP guidelines. The NCP was amended in 1990 (see 40 CFR 300 et seq.) to implement CERCLA under SARA. In addition, SARA requires greater USEPA involvement and oversight of Federal Facility Cleanups. On March1,1991, a Federal Facility Agreement (FFA) was signed by Homestead ARB (formerly Homestead AFB), the USEPA,and the Florida Department of Environmental Protection (FDEP). The FFA guides the remedial design/ remedialaction (RD/RA) process. The purpose of the FFA was to establish a procedural framework and schedule for developing, implementing, andmonitoring appropriate response actions at Homestead ARB in accordance with existing regulations. The FFArequires the submittal of several primary and secondary documents for each of the OUs at Homestead ARB. ThisRecord of Decision (ROD) concludes all of the Remedial Investigation/Feasibility Study (RI/FS) requirementsfor Site SS-8 and selects a remedy for OU-No. 4. As part of the RI/FS process, Homestead ARB has been actively involved in the Installation RestorationProgram (IRP) since 1983, and has identified 27 Potential Sources of Contamination (PSCs). Nine sites are in

various stages of reporting under the RI/FS stage of CERCLA; ten sites are being investigated in thePreliminary Assessment/Site Investigation (PA/SI) stage of CERCLA with three of these sites warranting nofurther investigation; one site has been closed under the Resource Conservation and Recovery Act (RCRA)guidelines; and seven sites are being investigated under the FDEP petroleum contaminated sites criteria(Florida Administrative Code 17-770). Additionally, an RCRA Facility Investigations (RFI) is underway toevaluate numerous solid waste management units (SWMU) identified during a RCRA Facility Assessment (RFA). The following PSCs are currently being investigated according to the CERCLA RI/FS guidelines: OU-1 - Fire Protection Training Area 2 (FT-5)OU-2 - Residual Pesticide Disposal Area (OT-11)OU-3 - PCB Spill C.E. Storage Compound (SS-13)OU-4 - Oil Leakage Behind the Motor Pool (SS-8)OU-5 - Electroplating Waste Disposal Area (WP-1)OU-6 - Aircraft Washrack Area (SS-3)OU-7 - Entomology Storage Area (SS-7)OU-8 - Fire Protection Training Area 3 (FT-4)OU-9 - Boundary Canal/Military Canal (SD-27) OU-3, PCB Spill C.E. Storage Compounds, has been closed out with the No Further Action ROD in June 1994. Allother CERCLA sites at Homestead ARB are currently in various phases of the RI/FS process. 2.3 INVESTIGATION HISTORY 2.3.1 IRP Phase I - Record Search An IRP Phase I - Records Search was performed by Engineering Science, and is summarized in their report,dated August 1983 (Engineering Science, 1983). During the Phase I study, sites with the potential forenvironmental contamination resulting from past waste disposal practices were identified. 13 sites ofpotential concern were identified by reviewing available installation records, interviewing past and presentHomestead ARB employees, inventorying wastes generated and handling practices, conducting field inspections,and reviewing geologic and hydrogeologic data. The 13 sites identified were ranked using the Hazard Assessment Rating Methodology (HARM) developed by JRBAssociates of McLean, Virginia, for the USEPA. HARM was later modified for application to the Air Force IRP. The following factors are considered in HARM: 1) the possible receptors of the contaminants; 2) thecharacteristics of the waste; 3) potential pathways for contaminant migration; and 4) waste managementpractices. HARM scores for the sites ranked at Homestead ARB ranged from a high of 72 to a low of 7 out of100. Eight of the 13 sites were determined to have a moderate to high contamination potential, one of whichwas the Motor Pool Oil Leak Area. These eight sites were recommended for further investigation. Theremaining five sites were determined to have low potential to exhibit environmental contamination. The IRP Phase I Report evaluated the Motor Pool Leak Area (Site SS-8) and assigned a moderate to high HARMscore of 59, due to the moderate quantity of liquid wastes used and the high potential for contaminantmigration in surface and groundwaters of the site. Site SS-8 scored high as a potential migration pathwaybecause of the extremely permeable nature of the weathered bedrock that is exposed at the surface and theproximity of the drainage canal bordering the site. 2.3.2 IRP Phase II - Confirmation/Quantification An IRP Phase II study was performed by Science Applications International Corporation (SAIC), and a reportwas submitted in March 1986 (SAIC, 1986). The objectives of the Phase II study were to confirm the presenceor absence of contamination, to quantify the extent and degree of contamination, and to determine if remedialactions were necessary. The Motor Pool Oil Leak Area was included in the Phase II investigation. One shallow monitoring well (I-17), approximately 19 ft deep, was installed immediately south of Building 307within the Motor Pool boundary during Phase II investigations. The groundwater was analyzed for oil andgrease and total lead. Oil and grease were not detected above the analytical procedure detection limit and

the lead detected (7.74 micrograms per liter [:g/L] ) was below federal and state drinking water standards(50 :/L in 1986). Two sediment samples (SD-3 and SD-4) were collected from the drainage ditch immediatelyeast of the Motor Pool fenceline. Four soil samples were collected from the strip of ground between thefenceline and the drainage canal. All the soil and sediment samples had reported concentrations of oil andgrease above Ambient Soil Quality Criteria (ASQC) (ten parts per million [ppm]). Two of the soil samples(SL-5 and SL-6) and both of the sediment samples had lead levels above the ASQC (0.37 ppm) but below thenormal level in soils (NLS) (100 ppm). The relative magnitude of these constituents migrating from the site via surface water (ditches) could not beassessed because the nearby drainage ditches were dry. A complete discussion of the methods and results ofthe study is found in the Phase II-Confirmation/Quantification Report (SAIC, 1986). The Phase II report contained the following alternatives for additional investigation at this site: 1)install and sample a minimum of two additional monitoring wells southeast and east of the site; these newwells could be analyzed for the Stage 1 scan parameters, followed by a more complete analysis ifcontamination is confirmed; 2) collect a minimum of four surface water and four sediment samples to determinethe possibility of surface water as a contamination pathway; surface water sampling was recommended becauseof the close relationship between groundwater and surface water in this region; and 3) make a more completecharacterization of local groundwater quality around Well Field No. 2 due to its close proximity to the MotorPool Area. 2.3.3 IRP Phase III - Technology Base Development The IRP Phase III is a research phase and involves technology development for an assessment of environmentalimpacts. There have been no Phase III tasks conducted at the Base to date. 2.3.4 IRP Phase IV - Additional Investigations
An IRP Phase IV-A investigation was performed at Site SS-8 by G&M during two separate field programs, thefirst in 1988 and the second in 1989. The IRP Phase IV investigations consist of two areas of work activity. Phase IV-A involves additional site investigations necessary to meet the Phase II objectives, review of allmanagement methods and technologies that could possibly remedy site problems, and preparation of a baselinerisk assessment (BRA) to address the potential hazards to human health and the environment associated withthe constituents detected at the site. Detailed alternatives are developed and evaluated, and a preferredalternative is selected. The preferred alternative is then described in sufficient detail to serve as abaseline document for initiation of Phase IV-B. 2.3.4.1 Phase IV-A Groundwater Investigation. An additional monitoring well (HS-9) was installed at SiteSS-8 during the 1988 Phase IV-A Investigation. Groundwater samples from the two monitoring wells, I-17 andHS-9, were collected and analyzed for volatile organic compounds (VOCs) (including xylenes), base/neutralextractable organic compounds (BNAs), total recoverable petroleum hydrocarbons (TRPH) and total RCRA metalsplus sodium. All the metals detected in the groundwater were either below the analytical detection limit, orwere below the federal drinking water maximum contaminant level (MCL). All the metals detected in thegroundwater were either below the analytical detection limit or were below the federal drinking water maximumcontaminant level (MCL). Di (2-ethylhexyl) phthalate (DEHP) was the only organic compound detected in thegroundwater at a concentration of 66 and 7.9 micrograms per liter (:g/L). DEHP, also known as bis (2-ethylhexyl) phthalate, is a known laboratory contaminant; however, this compoundwas not detected in any of the associated blanks (field or laboratory). TRPH was not detected above theanalytical detection limit. A summary of the 1988 Groundwater analytical results are presented in Table 2-1. The Phase IV-A investigation indicated that groundwater had not been impacted by activities at Site SS-8. 2.3.4.2 Phase IV-A Sediment Investigation. In 1988, two sediment samples (SED01 and SED02) were collectedfrom the drainage ditch east of the site and analyzed for VOCs, BNAs, and total RCRA metals. Several BNAs(mostly polynuclear aromatic hydrocarbons [PAHs]) were detected in the sediment; however, the number ofsampling locations were insufficient to determine the extent of contamination around the site. Concentrationsof BNAs reported in sediment sample SED01 were above health base levels when compared to the "site specific

remedial goal options" and the FDEP "Soil Target Levels" for both current and future risk scenarios. Asummary of the 1988 sediment analytical results is presented in Table 2-2. In 1989, eight additional sediment samples were collected from the perimeter drainage ditch to delineate thehorizontal extent of contamination within the ditch sediments. Constituents detected in the sediment at SiteSS-8 include BNAs and several metals, including lead. The highest concentrations were detected in thenortheast corner of the drainage ditch which surrounds the site. In general, BNA concentrations were anorder of magnitude below the concentrations in the 1988 sediment sample SED01; however, 1989 BNA sedimentconcentrations were above the healtn based levels for both current and future risks.
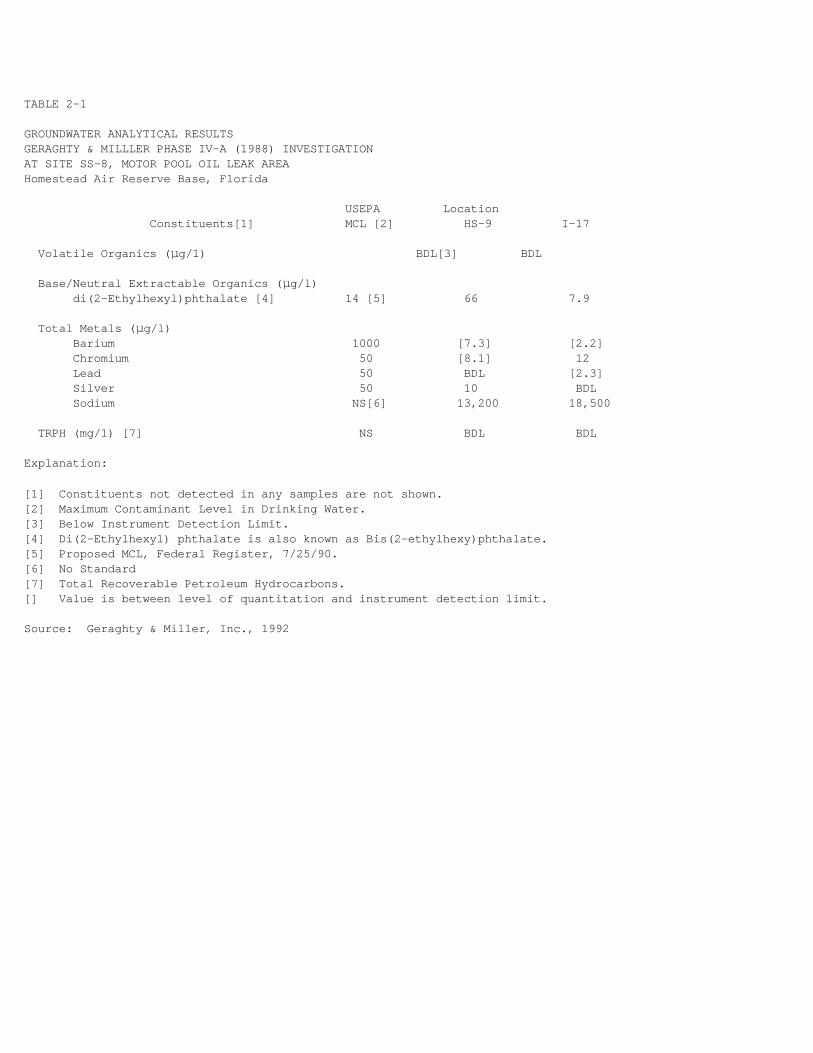
TABLE 2-1 GROUNDWATER ANALYTICAL RESULTSGERAGHTY & MILLLER PHASE IV-A (1988) INVESTIGATIONAT SITE SS-8, MOTOR POOL OIL LEAK AREAHomestead Air Reserve Base, Florida USEPA Location Constituents[1] MCL [2] HS-9 I-17 Volatile Organics (:g/1) BDL[3] BDL Base/Neutral Extractable Organics (:g/l) di(2-Ethylhexyl)phthalate [4] 14 [5] 66 7.9 Total Metals (:g/l) Barium 1000 [7.3] [2.2] Chromium 50 [8.1] 12 Lead 50 BDL [2.3] Silver 50 10 BDL Sodium NS[6] 13,200 18,500 TRPH (mg/1) [7] NS BDL BDL Explanation: [1] Constituents not detected in any samples are not shown.[2] Maximum Contaminant Level in Drinking Water.[3] Below Instrument Detection Limit.[4] Di(2-Ethylhexyl) phthalate is also known as Bis(2-ethylhexy)phthalate.[5] Proposed MCL, Federal Register, 7/25/90.[6] No Standard[7] Total Recoverable Petroleum Hydrocarbons.[] Value is between level of quantitation and instrument detection limit. Source: Geraghty & Miller, Inc., 1992

TABLE 2-2 SEDIMENT ANALYTICAL RESULTSG&M PHASE IV-A (1988) INVESTIGATIONAT SITE SS-8, MOTOR POOL OIL LEAK AREAHomestead Air Reserve Base, Florida Location Constituents [a] SED01 SED02 Volatile Organics (:g/kg) BDL[b] BDL Base/Neutral Extractable Organics (:g/kg) Acenaphthene 4,540 BDL Anthracene [3,810] BDL Benzo(a)anthracene 70,200 BDL Benzo(a)pyrene 74,900 BDL Benzo(b)fluoranthene 134,000 BDL Benzo(k)fluoranthene 138,000 BDL Chrysene 73,200 [843] Di(2-ethylhexyl)phthalate BDL 18,900 Fluoranthene 67,200 [1,150] Fluorene [1,910] BDL Indeno (1,2,3-cd)pyrene 7,700 BDL N-nitrosodiphenylamine(1) [1,860] BDL Naphthalene [3,090] BDL Phenanthrene 15,500 [863] Pyrene 61,100 [902] Total Metals (:g/kg) Arsenic BDL 36000 Barium [8,900] 54000 Cadmium BDL [600] Chromium 11,000 69000 Lead 30,000 2,650,000 Mercury 44 180 Source: Geraghty & Miller, Inc., 1992 [a] Constituents not detected in any samples are not shown.[b] Below Instrument Detection Limit. [] Value is between level of quantitation and instrument detection limit.

TABLE 2-3 SEDIMENT ANALYTICAL RESULTSG&M - 1989 PHASE IV-A INVESTIGATIONAT SITE SS-8, MOTOR POOL OIL LEAK AREAHomestead Air Reserve Base, Florida Constituents Sample Location [1] SP2-SED1 SP2-SED2 SP2-SED3 SP2-SED4 SP2-SED5 SP2-SED6 SP2-SED7 SP2-SED8 Base/Neutral Extractable Organics (:g/kg) Benzo(a)anthracene BDL[2] BDL 5,930 2,060 BDL BDL BDL BDL Benzo(a)pyrene BDL BDL 7,070 2,530 BDL BDL BDL BDL Benzo(b)fluoranthene BDL BDL 8,320 3,250 BDL BDL BDL BDL Benzo(g,h,i)perylene BDL BDL BDL 2,870 BDL BDL BDL BDL Benzo(k)fluoranthene BDL BDL 7,390 2,470 BDL BDL BDL BDL Butylbenzylphthalate BDL BDL BDL BDL BDL 10,300 BDL BDL Chrysene BDL BDL 7,910 2,700 BDL BDL BDL BDL Di-n-butylphthalate BDL BDL BDL 1,060 1,890 [4,820] BDL [3,500] Dibenzo(a,h)anthracene BDL 9,140 BDL 1,140 BDL BDL BDL BDL Di(2-ethylhexyl)phthalate 10,800 BDL BDL 2,080 [844] [3,760] BDL 8,630 Fluoranthene BDL BDL 7,280 2,110 BDL BDL BDL BDL Indeno (1,2,3-cd)pyrene BDL BDL 6,260 2,450 BDL BDL BDL BDL Phenanthrene BDL BDL BDL [642] BDL BDL BDL BDL Pyrene BDL BDL 6,610 2,000 BDL BDL BDL BDL Total Lead (:g/kg) 2,740,000 420,000 289,000 43,000 170,000 271,000 557,000 66,000 EP Tox Metals (:g/kg) Barium NA[3] NA NA [160] NA NA NA NA Source: Geraghty & Miller, Inc., 1992 [1] Constituents not detected in any samples are not shown.[2] Below Instrument Detection Limit.[3] Not Analyzed.[] Value is between level of quantitation and instrument detection limit.

The contamination associated with the ditch sediments are presently being evaluated in the Boundary andOutfall Canal (OU-9), Remedial Investigation. Further investigation was necessary to delineate the arealextent of contamination. A summary of the analytical results from the 1989 sediment sampling event areprovided in Table 2-3. 2.3.4.3 Phase IV-A Surface Water Investigation. In both the 1988 and 1989 investigations, surface watersamples could not be collected because the drainage ditches were dry. 2.3.5 1991 Remedial Investigation of Site SS-8 In 1991, an RI was conducted at Site SS-8 by G&M. The 1991 investigation included the collection of 25sediment samples, ten surface water samples, and two groundwater samples. Results of the 1991 RI arepresented in G&M reported titled Remedial Investigation Report for Site SS-8, Motor Pool Oil Leak Area(Former Site SP-2), May 1992. 2.3.6 1993 Remedial Investigation of Site SS-8 In 1993, Montgomery Watson Americas, Inc. performed an additional RI to evaluate the current soil andgroundwater quality with respect to the USEPA target compound list (TCL)/TAL utilizing USEPA ContractLaboratory Program (CLP) protocols and to fill data gaps from the previous field investigations, as well asevaluate any impacts due to Hurricane Andrew. Five soil borings were drilled and advanced to the water tableat Site SS-8 during the 1993 investigation. Two samples were collected from each borehole at the surficial(0-1 ft bls) interval and from directly above the water table. Two monitoring wells (I-17 and HS-9) weresampled. Additionally, 13 sediment samples and five surface water samples were collected from the areacanals and drainage ditches.
2.4 COMMUNITY PARTICIPATION HISTORY The RI/BRA report and the Proposed Plan (PP) for Homestead ARB, Site SS-8, were released to the public inJune and September of 1994, respectively. These documents were made available to the public in both theadministrative record and an information repository maintained at the Miami-Dade Community College Library. A public comment period was held from September 8, 1994, to October 22, 1994, as part of the communityrelations plan for OU-4. Additionally, a public meeting was held on Thursday, September 29, 1994 at 7:00 pmat South Dade High School. A public notice was published in the Miami Herald on September 9, 1994. At thismeeting, the United States Air Force (USAF), in coordination with USEPA Region IV, FDEP, and Dade CountyEnvironmental Resource Management (DERM), was prepared to discuss the RI results, the BRA, FS, and theProposed Alternative of institutional controls with groundwater monitoring, as described in the PP. Aresponse to the comments received during this period is included in the Responsiveness Summary, which is partof this ROD. This ROD document presents the selected remedial action for OU-4 at Homestead ARB, chosen in accordance withCERCLA, as amended by SARA and, to the extent practicable, the NCP. The decision on the selected remedy forthis site is based on the administrative record. 2.5 SCOPE AND ROLE OF RESPONSIBLE ACTION
Currently, many areas within the boundaries of Homestead ARB are under investigation as part of thedesignated NPL status of the Base. Each of the nine CERCLA investigation areas has been designated as anindividual OU. The U.S. Air Force with concurrence from the State of Florida and the USEPA, has elected to define OU-4 asthe Motor Pool Oil Leak Area. The remedial actions planned at each of the Operable Units at Homestead ARBare, to the extent practicable, independent of one another. This response action addresses soil contamination at OU-4. Soil contamination at OU-4 poses a threat tohuman health and the environment, based on soil exposure to the future construction worker through dermal
contact or inhalation of dust associated with construction activities. In the unlikely event that the siteis developed for residential use, the conservative evaluation indicated that the child resident scenario alsoresults in soil exposure presenting a risk. Site risk is minimal, as the calculated risk using extremelyconservative models only slightly exceeds USEPA target ranges. This response action will be the final actionat Site SS-8. Neither the groundwater nor surface water was found to pose a threat to human health or theenvironment at OU-4. 2.6 SUMMARY OF SITE CHARACTERISTICS The Motor Pool has been in operation since the Base was re-activated in the 1950's. Waste oil from the MotorPool vehicular maintenance activities was collected and stored in 500 gallon above-ground storage tanks. Leaks in the tanks have resulted in spills to the environment. Additionally, old batteries were stored inthe Motor Pool Area. The majority of the Motor Pool Site is covered by asphalt. The following subsections summarize the nature and extent of contamination identified at Site SS-8 duringinvestigations conducted from 1988 through 1993. The investigations in 1991 and 1993 were conducted inaccordance with the approved Facility Remedial Investigations Work Plans (G&M, 1991) and Work Plan Addendum(MW, 1993). It should be noted that "soil" at Site SS-8 is limestone or weathered limestone not typicalsand, clay, or sandy clay. 2.6.1 Nature and Extent of Contamination RIs have been performed at Site SS-8 to evaluate the nature and extent of contamination in 1991 and 1993. Adetailed evaluation of the nature and extent of contamination is presented in the RI Report Addendum preparedby Montgomery Watson in 1993. A brief summary of findings is presented below. In general, the results ofthe sampling and analysis presented in the RI Addendum Report reveal that contamination at the site islimited to the surrounding canal system and the subsurface soil/bedrock. Contamination associated with thecanal system is being evaluated separately under the OU-9, Boundary Canal investigation. Althoughgroundwater sampling in 1991 indicated the presence of elevated metals, resampling of the wells in 1993indicated that the 1991 samples were turbid and that the 1993 sample results indicated no metalscontamination in the site wells. Figure 2-1 depicts the 1991 and 1994 surface water, sediment, soil andgroundwater sampling locations for Site SS-8.
<IMGSRC0495232C>
2.6.2 Groundwater Investigations 2.6.2.1 Initial Investigations (1988). Groundwater samples at Site SS-8 were analyzed for VOCs, BNAs, TRPHand total RCRA metals, plus sodium. All the metals detected in the groundwater were either below theanalytical detection limit or were below the federal drinking water maximum contaminant level (MCL). Di(2-ethylhexyl) phthalate (DEHP) was the only organic compound detected in the groundwater at a concentrationof 66 and 7.9 :g/L. DEHP, also known as bis (2-ethylhexyl) phthalate, is a known laboratory contaminant; however, this compoundwas not detected in any of the associated blanks (field or laboratory). TRPH was not detected above theanalytical detection limit. A summary of the 1988 Groundwater analytical results are presented in Table 2-1. The Phase IV-A investigation indicated that groundwater had not been impacted by activities at Site SS-8. The 1988 investigation indicated that groundwater had not been impacted by activities at Site SS-8. 2.6.2.2 1991 Investigation. The following metals were detected in the groundwater at Site SS-8: aluminum,barium, calcium, chromium, cobalt, iron, magnesium, manganese, nickel, potassium, sodium, vanadium, andmercury. Groundwater samples contained very high concentrations of total calcium 8,400,000; 71,000; and70,000 :g/L, respectively, in addition to significant concentrations of other TAL metals. Lead was detectedin one sample at a concentration of 20 :g/L, which is above both the Florida Groundwater GuidanceConcentration (FGWGC) of 5 :g/L and the Federal action level of 15 :g/L. Chromium was also detected in onesample at a concentration of 249 :/L, above the FGWGC of 50 :g/L and above the Federal Drinking WaterStandard of 100 :g/L. The sampling log for one of the wells indicated that the sample was extremely turbid

when collected. Metals tend to sorb to aquifer substrates and the presence of fines in groundwater samplestends to increase the amount of metals present. It is possible that the high metal concentrations are aresult of suspended sediments as artifacts of well construction, and thereby, overstate the actualconcentrations of the analytes at the site. A summary of the 1991 groundwater analytical results ispresented as Table 2-4. All remaining metals detected were below the FGWGC except for aluminum, iron, and manganese. FederalSecondary Drinking Water Regulations establish recommended limits and deal with the aesthetic quality ofdrinking water; however, the FDEP has adopted these standards as the Florida Secondary Drinking WaterStandards and requires that the potable groundwater shall meet these recommended limits. Iron and manganeseare both regulated in terms of secondary drinking water standards. There is no FGWGC standard for aluminum,however, the Federal Secondary Drinking Water Standard for aluminum is 50 to 200 :g/L which is significantlylower than the 25,000 :g/L of aluminum that was detected in one well. Chromium was the only metal detectedabove the USEPA maximum contaminant level (MCL). As mentioned above, the turbidity of the groundwatersamples may have contributed to the high inorganic concentrations detected which are not believed to be siterelated contamination.

TABLE 2-4SUMMARY OF GROUNDWATER ANALYTICAL RESULTSSITE SS-8 MOTOR POOL OIL LEAK AREAHOMESTEAD AIR RESERVE BASE, FLORIDAGERAGHTY AND MILLER, INC., 1991 Florida G&M Sample I.D. Trip Blank SP2-EB-0003 SP2-EB-0003 SP2-I-0017 SP2-HS-0009 Analyte Ground Water Savannah I.D. S135369*15 S135369*2 S135369*1 S135369*3 S13569*4 Guidance USEPA Sampling Date 22-Aug-91 22-Aug-91 22-Aug-91 22-Aug-91 Concentrations MCL 1/ VOLATILE ORGANIC COMPOUND 2/ BDL BDL 3/ BDL BDL BDL BASE/NEUTRAL AND ACID EXTRACTAIlLE COMPOUNDS: (:g/L) bis(2-Ethylhexyl)phthalate 14 NS 3/ NA 5/ [0.89] J <10 [1.2] U [1.3] U INORGANIC CONSTITUENTS: (:g/L) Aluminum NS NS NA <200 25000 <200 <200 Barium 1000 2000 NA <10 130 <10 <10 Calcium NS NS NA <50 8400000 71000 70000 Chromium 50 100 NA <10 240 <10 <10 Cobalt NS NS NA <10 11 <10 <10 Iron 300 NS NA <50 23000 62 63 Magnesium NS NS NA <50 24000 1100 1100 Manganese 50 NS NA <10 320 <10 <10 Nickel 150 100 NA <40 80 <40 <40 Potassium NS NS NA <1000 6700 1700 1600 Sodium 160,000 NS NA <500 84000 9900 9800 Vanadium NS NS NA <10 120 <10 <10 Mercury 2 2 NA <0.20 0.32 <0.20 <0.20 Lead 50 50 NA <5.0 20 <5.0 <5.0 Total Dissolved Solids: (mg/L) 500 NS NA NA 370 NA NA Source: Geraghty & Miller, Inc., 1992 1/ Maximum Contaminant Level in Drinking Water.2/ Constituents not detected above the practical quantitation limit are not listed.3/ All constitiuents in analyte group were below the practical quantitation limit.4/ No Standard5/ Not Analyzed[] Value is betewen instrument detection limit and practical quantitation limit.U Result has been classified as undetected because of analyte detection in the QA sample.

2.6.2.3 1993 Investigation. Groundwater samples collected from the two monitoring wells in 1993, did notindicate the presence of VOCs or organochloride pesticides/PCBs. Only groundwater from the monitoring wellwhich produced turbid samples in 1991 was analyzed for TAL metals. Both total and dissolved metals analyseswere performed. Metals detected in the total fraction include aluminum, barium, calcium, chromium, iron,magnesium, manganese, nickel, potassium, sodium, vanadium, and zinc. Lead which was identified as a possiblecontaminant in 1991, was not detected in the a federallyesignated sole-source aquifer pursuant to Section1425 of the Safe Drinking groundwater sample collected in the 1993 investigation. Chromium, which wasdetected at elevated levels (maximum concentration 240 :g/L) in 1991, was reported at only 3.6 :g/L in the1993 sample. Dissolved lead and dissolved chromium analyses in 1993 indicated no detectable presence ofeither analyte. This decrease in lead and chromium concentrations is likely related to the much highersample turbidity observed in 1991; the total calcium concentrations of the turbid 1991 samples were overthirty times higher than those of the 1993 samples. Aluminum is the only metal in the total fraction which exceeded state and federal standards. In general,groundwater metals were an order of magnitude lower in the 1993 sample when compared to the 1991 samples. This is likely due to the reduction in the turbidity prior to sampling. A summary of constituents detectedin the 1993 groundwater samples is presented in Table 2-5. 2.6.3 Soil Sample Analytical Results 2.6.3.1 Initial Investigations ( 1988). During the IRP Phase II Investigation, four soil samples werecollected from the strip of ground between the fenceline and the drainage canal east of the site. 1988 soilsamples were only analyzed for oil and grease and total lead. All four of the soil samples were found tocontain concentrations of oil and grease above ASQC (10 ppm) and two of the soil samples had lead levelsabove the ASQC (0.37 ppm) but below the NLS (100 ppm).

TABLE 2-5 SUMMARY OF CONSTITUENTS DETECTED IN GROUNDWATER SAMPLESSITE SS-8 MOTOR POOL OIL LEAK AREAMONTGOMERY WATSON, 1993 INVESTIGATION Analyte Florida EPA Drinking EPA Maximum Sample ID SP2-I-17 SP2-I-917 SP2-I-17 F SP2-I-917 F Date Sampled Groundwater Water Contaminant Date Collected 3/8/93 3/8/93 3/8/93 3/8/93 Guidance Standard Level Duplicate Filtered Filtered Concentration m Goal Duplicate VOA TCL Compounds (:/l) 2-Butanone NS NS NS <10 <10 NA NA 1,2-Dichloropropane NS NS NS <10 <10 NA NA cis-1,3-Dichloropropene NS NS NS <10 <10 NA NA Pesticide/PCB TCL Compounds (:g/l) ND ND ND ND ND ND ND BNA TCL Compounds (:g/l) Di-n-Butyl Phthalate NS NS NS 0.4 J 0.5 J NA NA Dissolved Metals (:g/l) Barium 1000 2000g 2000 NA NA NA 8.8 B Calcium NS NS NS NA NA NA 83,300 Iron 300 300h NS NA NA NA <7.0 Magnesium NS NS NS NA NA NA 3090 B Manganese 50 50h NS NA NA NA 1.9 B Potassium NS NS NS NA NA NA 6460 Sodium 160000 NS NS NA NA NA 35400 Zinc 5000 5000h NS NA NA NA 13.8 B

Total Metals (:g/l) Aluminum NS 50-200h NS 1550 1370 <20.0 <20.0 Barium 1000 2000g 2000 26.6B 27.7 B 8.8B 8.8B Calcium NS NS NS 270000 301000 82600 83300 Chromium, Total 50 100 g 100 3.6B <3.0 <3.0 <3.0 Copper 100 130 130 <2.0 <2.0 <2.0 <2.0 Iron 300 300h NS 1100 1180 <7.0 <7.0 Magnesium NS NS NS 3800B 3940 B 3080 B 3090 B Manganese 50 50h NS 20.7 22.2 1.8 B 1.9 B Nickel 6.4B <6.0 <6.0 <6.0 Potassium NS NS NS 6730 7200 6230 6460 Silver <2.0 <2.0 <2.0 <2.0 Sodium 160000 NS NS 36300 37100 36700 35400 Vanadium NS NS NS 7.0B 7.6 B <3.0 <3.0 Zinc 5000 5000h NS 33.4 39.3 14.8 B 13.8 B All samples analyzed by Savannah Laboratories Tallahassee Florida. < - not detected at specified detection limitNS - no standardND - not detectedNA - not analyzed Data Qualifiers for Organic CompoundsJ - Estimated Value <CRQL or TIC Data Qualifiers for Inorganic CompoundsB - Reading is less than CRQL but greater than IDL
Notes:F Fitered samples for metalsg Numbers represent EPA's Primary MCL for Inorganics.h Numbers represent EPA's Secondary MCL for Inorganics which are non-enforceable taste, odor or appearance guidelines.m Florida Ground-Water Guldance Concentrations for Minimum Criteria Requirement. (Rule 17-3.402 FAC) Florida Department of Environmentd Regulation February 1989.
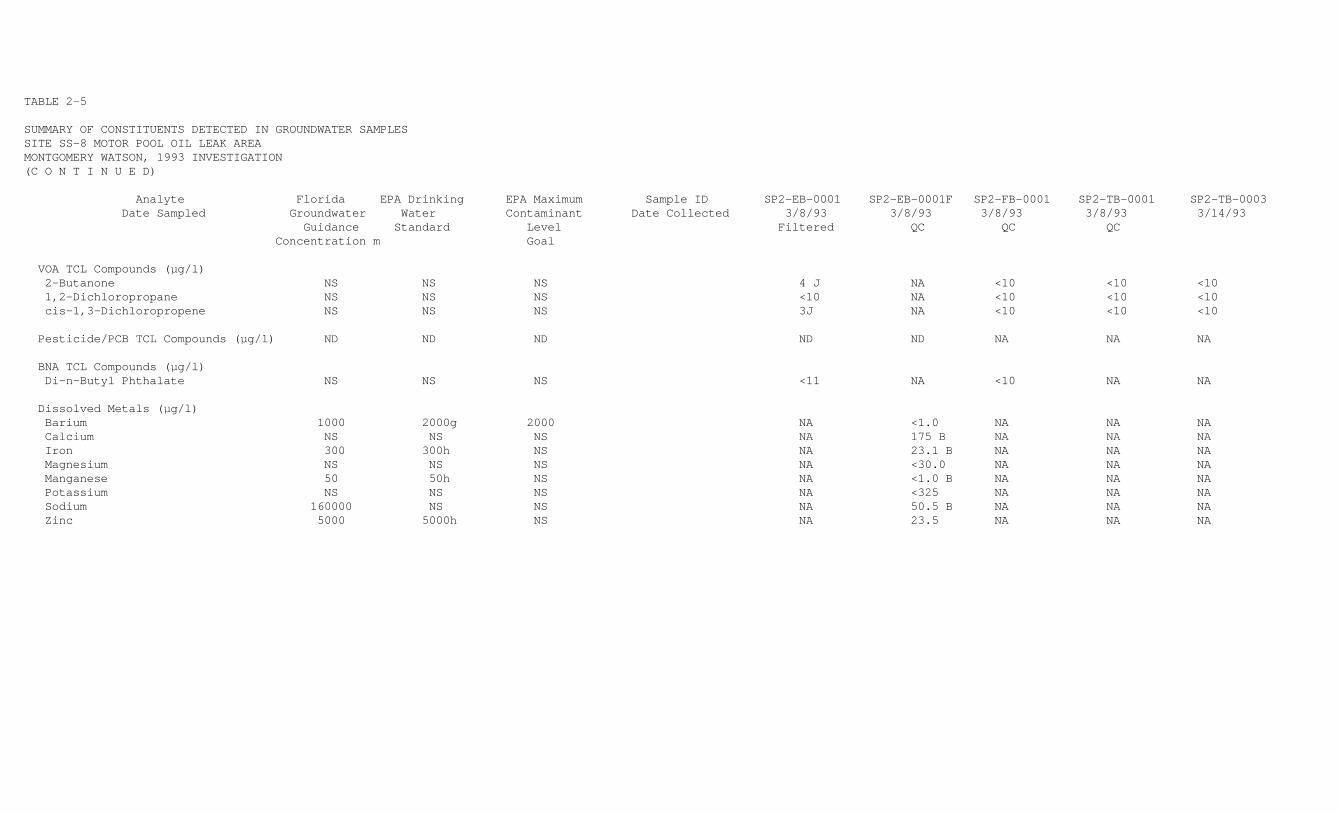
TABLE 2-5 SUMMARY OF CONSTITUENTS DETECTED IN GROUNDWATER SAMPLESSITE SS-8 MOTOR POOL OIL LEAK AREAMONTGOMERY WATSON, 1993 INVESTIGATION(C O N T I N U E D) Analyte Florida EPA Drinking EPA Maximum Sample ID SP2-EB-0001 SP2-EB-0001F SP2-FB-0001 SP2-TB-0001 SP2-TB-0003 Date Sampled Groundwater Water Contaminant Date Collected 3/8/93 3/8/93 3/8/93 3/8/93 3/14/93 Guidance Standard Level Filtered QC QC QC Concentration m Goal VOA TCL Compounds (:g/l) 2-Butanone NS NS NS 4 J NA <10 <10 <10 1,2-Dichloropropane NS NS NS <10 NA <10 <10 <10 cis-1,3-Dichloropropene NS NS NS 3J NA <10 <10 <10
Pesticide/PCB TCL Compounds (:g/l) ND ND ND ND ND NA NA NA BNA TCL Compounds (:g/l) Di-n-Butyl Phthalate NS NS NS <11 NA <10 NA NA Dissolved Metals (:g/l) Barium 1000 2000g 2000 NA <1.0 NA NA NA Calcium NS NS NS NA 175 B NA NA NA Iron 300 300h NS NA 23.1 B NA NA NA Magnesium NS NS NS NA <30.0 NA NA NA Manganese 50 50h NS NA <1.0 B NA NA NA Potassium NS NS NS NA <325 NA NA NA Sodium 160000 NS NS NA 50.5 B NA NA NA Zinc 5000 5000h NS NA 23.5 NA NA NA
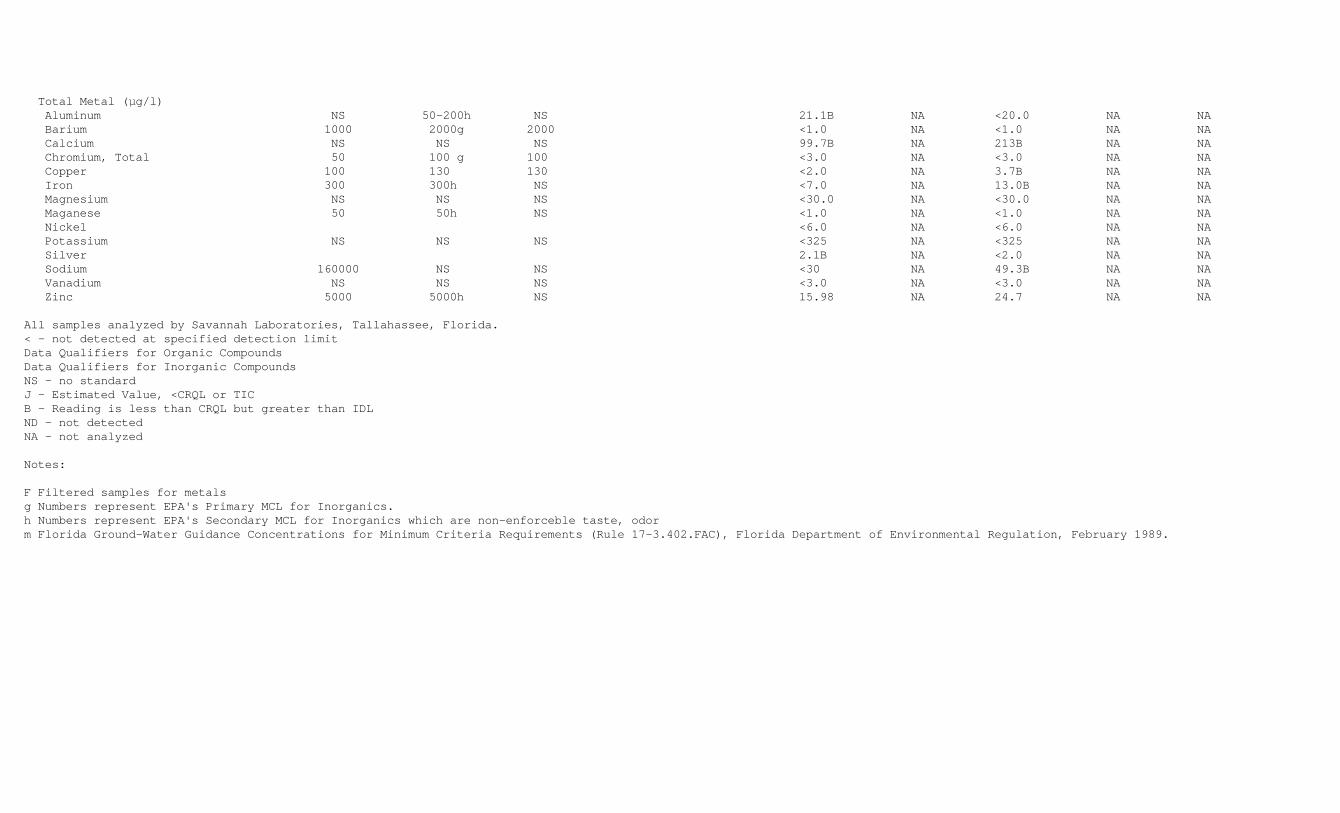
Total Metal (:g/l) Aluminum NS 50-200h NS 21.1B NA <20.0 NA NA Barium 1000 2000g 2000 <1.0 NA <1.0 NA NA Calcium NS NS NS 99.7B NA 213B NA NA Chromium, Total 50 100 g 100 <3.0 NA <3.0 NA NA Copper 100 130 130 <2.0 NA 3.7B NA NA Iron 300 300h NS <7.0 NA 13.0B NA NA Magnesium NS NS NS <30.0 NA <30.0 NA NA Maganese 50 50h NS <1.0 NA <1.0 NA NA Nickel <6.0 NA <6.0 NA NA Potassium NS NS NS <325 NA <325 NA NA Silver 2.1B NA <2.0 NA NA Sodium 160000 NS NS <30 NA 49.3B NA NA Vanadium NS NS NS <3.0 NA <3.0 NA NA Zinc 5000 5000h NS 15.98 NA 24.7 NA NA All samples analyzed by Savannah Laboratories, Tallahassee, Florida.< - not detected at specified detection limit Data Qualifiers for Organic Compounds Data Qualifiers for Inorganic CompoundsNS - no standard J - Estimated Value, <CRQL or TIC B - Reading is less than CRQL but greater than IDLND - not detectedNA - not analyzed Notes: F Filtered samples for metalsg Numbers represent EPA's Primary MCL for Inorganics.h Numbers represent EPA's Secondary MCL for Inorganics which are non-enforceble taste, odorm Florida Ground-Water Guidance Concentrations for Minimum Criteria Requirements (Rule 17-3.402.FAC), Florida Department of Environmental Regulation, February 1989.

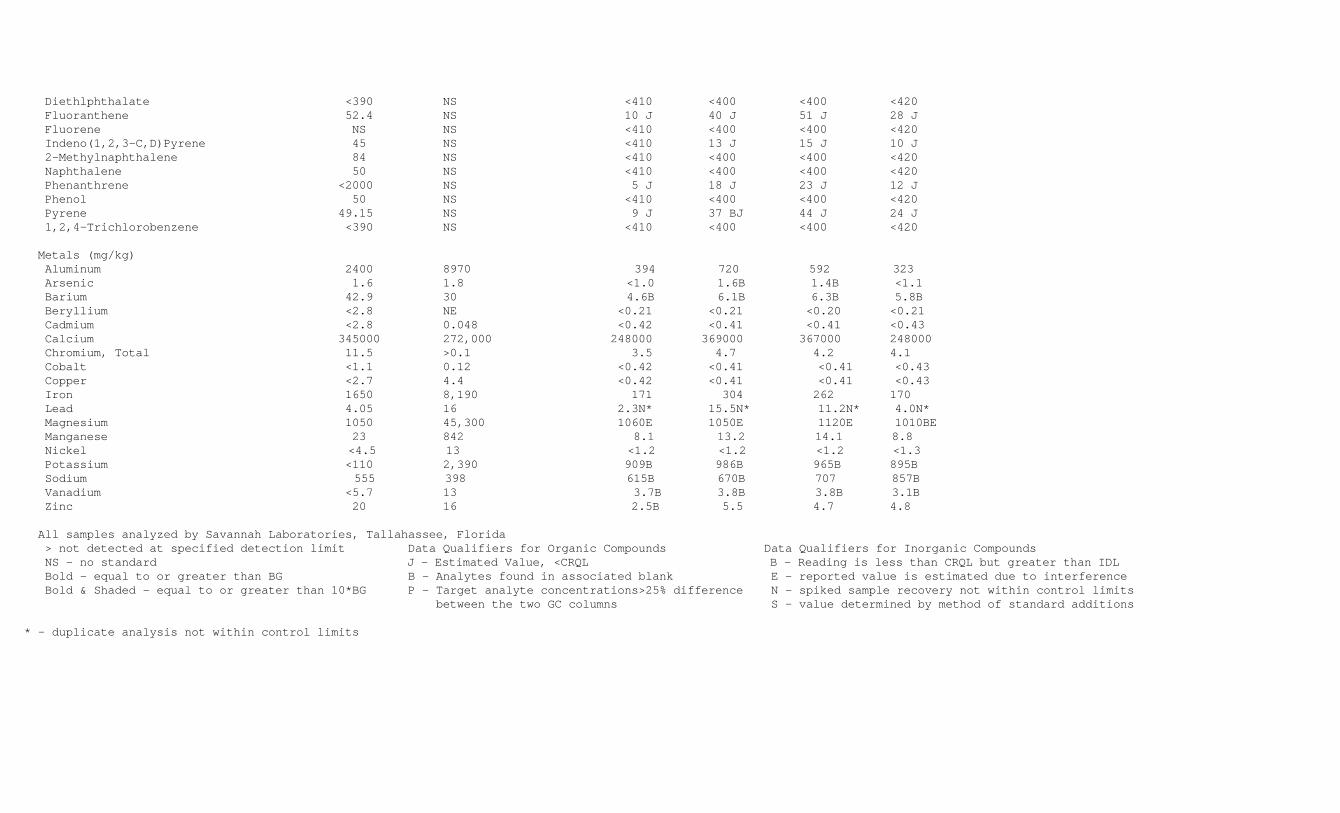
2.6.3.2 1993 Investigation. In the 1993 soil investigation at Site SS-8, Montgomery Watson collected soilsamples from five soil boring locations. Two soil samples were collected from each of the five soil boringlocations from the 0 to 1 foot bls interval and the 3 to 4 ft bls interval. Soil samples were analyzed forthe following chemical compounds: TCL VOCs, TCL/BNAs, TCL Organochlorine (OC) Pesticide/PCBs, and TAL metalsand cyanide. Contaminants detected in Site SS-8 soils include VOCs, BNAs and metals. The VOC detected (toluene) can be acommon laboratory contaminant and was detected in only one sample. BNAs, primarily PAHs, were detected inthe soils at Site SS-8. Because PAHs are commonly found in asphalt, the elevated PAH concentrations may bedue to sampling either directly adjacent to or directly below asphalt. Additionally, these PAHconcentrations are within the typical range found for areas affected by anthropogenic influences. Low levelsof pesticides were also detected in four soil samples. Cyanide and PCBs were not detected in any of the soilsamples. Concentrations of barium, cobalt, magnesium, and nickel were all reported below the Homestead ARB averagebackground soil concentration from the 0-2 ft interval. Aluminum was detected in all of the samples atconcentrations above the Homestead ARB background concentrations in three samples. Concentrations of copper,manganese, sodium potassium and zinc do not exceed the average natural levels for soils. The concentrationsfor calcium and iron do exceed the natural levels for soils. Lead was detected in all the soil samples. Concentrations of lead in three samples were above the maximumdetected concentration of lead in the Homestead ARB background soils and the average carbonate bedrockconcentration, but within the common range of soils found in the eastern U.S. A summary of constituentsdetected in soil samples from the 1993 investigation are presented in Table 2-6.

TABLE 2-6 SUMMARY OF CONSTITUENTS DETECTED IN SOIL SAMPLESSITE SS-8, MOTOR POOL OIL LEAK AREAMONTGOMERY WATSON, 1993 Homestead AFB AVERAGE Sample ID. SP2SL0001 SP2SL0001 SP2L0002 Analyte Background CARBONATE Sample Interval 0-1 3-4 0-1 0-2 ft bls COMPOSITION Date Collected 5/27/93 5/27/93 5/27/93
VOA TCL Compounds (:g/kg) Acetone 119.2 NS 1400 E 730 2200 Toluene NS NS 5 J <12 18
Pesticide/PCB TCL Compounds (:g/kg) Alpha-Chlordane <2.9 NS <2.1 <2.2 <2.0 Beta Endosulfan <2.9 NS <4.1 <4.2 1.3 J Beta-Chlordane <2.9 NS <2.1 <2.2 <2.0 Endrin <2.9 NS 0.89 JP 2.5 JP 0.98 J Heptachlor <2.9 NS <2.1 <2.2 <2.0 p,p'-DDD <4.7 NS <4.1 1.2 JP <4.0 p,p'-DDE <4.7 NS <4.1 0.97 JP <4.0 p,p'-DDT <12 NS <4.1 <4.2 <4.0
BNA TCL Compounds (:g/kg) Acenaphthene <390 NS 160 J 170 J 170 J Anthracene <390 NS 310 J 270 J 190 J Benzo(a)Anthracene 67 NS 3200 3200 3700 J Benzo(a)Pyrene 66 NS 5200 5500 5300 Benzo(b)Fluoranthene 69 NS 3900 7000 5800 Benzo(g,h,i)Perylene 44 NS 3000 4300 3800 J Benzo(k)Fluoranthene 66 NS 2200 2800 4500 Benzyl Butyl Phthalate 16 NS 11 J 29 J <4000 Bis(2-Ethylhexyl) Phthalate 100 NS 58 BJ 230 BJ 76 BJ Carbazole NS NS 320 J 310 J 170 J 4-Chlorophenyl Pheny Ether <390 NS <410 <420 <4000 Chrysene 79 NS 5200 5600 4900 2-,4-Dichlorophenol <390 NS <410 <420 <4000 Di-n-Butyl Phthalate <390 NS 29 BJ 10 BJ 15 BJ Di-n-Octyl Phthalate(Bis-Ethylhexyl)Phthalate 10 NS <410 <420 20 J Dibenz(A,H)Anthracene 17 NS 1000 1200 <4000 Dibenzofuran <390 NS 28 J 30 J 49 J Diethylphthalate <390 NS 5 J 3 J <4000 Fluoranthene 52.4 NS 5100 3200 3700 J

Fluorene NS NS 57 J 63 J 80 J Indeno(1,2,3-C,D)Pyrene 45 NS 2500 3300 3200 J 2-Methylnaphthalene 84 NS 16 J 15 J 38 J Naphthalene 50 NS 78 J 75 J 240 J Phenanthrene <2000 NS 1300 1200 860 J Phenol 50 NS <410 40 J <4000 Pyrene 49.15 NS 5800 6500 3900 J 1,2,4-Trichlorobenzene <390 NS <410 <420 <4000
Metal (mg/kg) Aluminum 2400 8970 4560 613 4260 Arsenic 1.6 1.8 2.4S <1.1 <1.0 Barium 42.9 30 11.2B 15.7B 10.9B Beryllium <2.8 NE 0.26B <0.21 <0.29B Cadmium <2.8 0.048 <0.41 0.55B <0.40 Calcium 345000 272,000 383000 372000 321000 Chromium, Total 11.5 >0.1 13.4 7.7 15.9 Cobalt <1.1 0.12 0.93B 0.76B 0.77B Copper <2.7 4.4 0.84B 8.6 2.1B Iron 1650 8,190 2450 890 3240 Lead 4.0 16 15.9N* 120N* 92.4N* Magnesium 1050 45,300 1390E 1200E 1450E Manganese 23 842 27.0 8.8 42.9 Nickel <4.5 13 2.9B 2.6B 3.9B Potassium <110 2,390 1070 993B 900B Sodium 555 398 513B 730B 462B Vanadium <5.7 13 8.9B 5.0B 9.8B Zinc 20 16 5.5 24.6 18.1
All samples analyzed by Savannah Laboratories, Tallahassee, Florida.< not detected at specified detection limit Data Qualifiers for Organic Compounds Data Qualifiers forInorganic Compounds NS - no standard J - Estimated Value, <CRQL B - Reading is less than CRQL but greater than IDL Bold - equal to or greater than BG B - Analytes found in associated blank E - reported value is estimated due to interference Bold & Shaded - equal to or greater than 10*BG P - Target analyte concentrations>25% difference N - spiked sample recovery not within control limits between the two GC columns S - value determined by method of standard additions * - duplicate analysis not within control limits
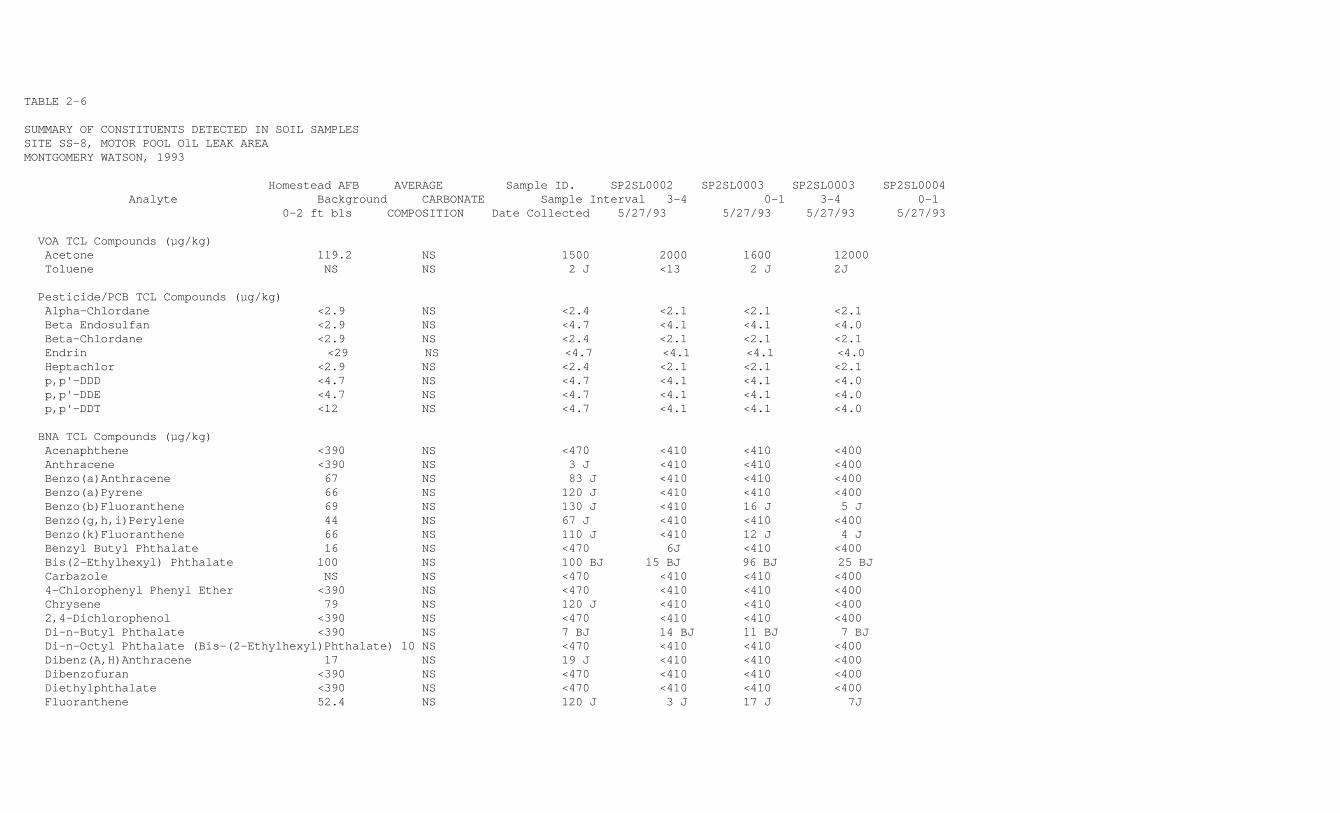
TABLE 2-6 SUMMARY OF CONSTITUENTS DETECTED IN SOIL SAMPLESSITE SS-8, MOTOR POOL OlL LEAK AREAMONTGOMERY WATSON, 1993 Homestead AFB AVERAGE Sample ID. SP2SL0002 SP2SL0003 SP2SL0003 SP2SL0004 Analyte Background CARBONATE Sample Interval 3-4 0-1 3-4 0-1 0-2 ft bls COMPOSITION Date Collected 5/27/93 5/27/93 5/27/93 5/27/93
VOA TCL Compounds (:g/kg) Acetone 119.2 NS 1500 2000 1600 12000 Toluene NS NS 2 J <13 2 J 2J
Pesticide/PCB TCL Compounds (:g/kg) Alpha-Chlordane <2.9 NS <2.4 <2.1 <2.1 <2.1 Beta Endosulfan <2.9 NS <4.7 <4.1 <4.1 <4.0 Beta-Chlordane <2.9 NS <2.4 <2.1 <2.1 <2.1 Endrin <29 NS <4.7 <4.1 <4.1 <4.0 Heptachlor <2.9 NS <2.4 <2.1 <2.1 <2.1 p,p'-DDD <4.7 NS <4.7 <4.1 <4.1 <4.0 p,p'-DDE <4.7 NS <4.7 <4.1 <4.1 <4.0 p,p'-DDT <12 NS <4.7 <4.1 <4.1 <4.0
BNA TCL Compounds (:g/kg) Acenaphthene <390 NS <470 <410 <410 <400 Anthracene <390 NS 3 J <410 <410 <400 Benzo(a)Anthracene 67 NS 83 J <410 <410 <400 Benzo(a)Pyrene 66 NS 120 J <410 <410 <400 Benzo(b)Fluoranthene 69 NS 130 J <410 16 J 5 J Benzo(g,h,i)Perylene 44 NS 67 J <410 <410 <400 Benzo(k)Fluoranthene 66 NS 110 J <410 12 J 4 J Benzyl Butyl Phthalate 16 NS <470 6J <410 <400 Bis(2-Ethylhexyl) Phthalate 100 NS 100 BJ 15 BJ 96 BJ 25 BJ Carbazole NS NS <470 <410 <410 <400 4-Chlorophenyl Phenyl Ether <390 NS <470 <410 <410 <400 Chrysene 79 NS 120 J <410 <410 <400 2,4-Dichlorophenol <390 NS <470 <410 <410 <400 Di-n-Butyl Phthalate <390 NS 7 BJ 14 BJ 11 BJ 7 BJ Di-n-Octyl Phthalate (Bis-(2-Ethylhexyl)Phthalate) 10 NS <470 <410 <410 <400 Dibenz(A,H)Anthracene 17 NS 19 J <410 <410 <400 Dibenzofuran <390 NS <470 <410 <410 <400 Diethylphthalate <390 NS <470 <410 <410 <400 Fluoranthene 52.4 NS 120 J 3 J 17 J 7J

Fluorene NS NS <470 <410 <410 <400 Indeno (,2,3-C,D)Pyrene 45 NS 70 J <410 <410 <400 2-Methylnaphthalene 84 NS <470 <410 <410 <400 Naphthalene 50 NS <470 <410 <410 <400 Phenanthrene <2000 NS 20 J <410 6 J <400 Phenol 50 NS <470 <410 <410 <400 Pyrene 49.15 NS 130 J <410 17 J 7 J 1,2,4-Trichlorobenzene <390 NS <470 <410 <400
Metals (mg/kg) Aluminum 2400 8970 4290 595 314 1220 Arsenic 1.6 1.8 3.0 <1.0S <1.0 1.8B Barium 42.9 30 11.1B 4.8B 5.3B 5.1B Berylium <2.8 NE 0.39B <0.21 <0.21 <0.20 Cadmium <2.8 0.048 <0.48 <0.42 <0.42 <0.41 Calcium 345000 272,000 325000 348000 325000 325000 Chromium, Total 11.5 >0.1 19.6 4.0 2.7 5.3 Cobalt <1.1 0.12 0.89B <0.42 <0.42 <0.41 Copper <2.7 4.4 <0.48 <0.42 <0.42 <0.41 Iron 1650 8,190 1620 205 171 466 Lead 4.05 16 5L4N* 7.5SN* 4.1SN* 3.6N* Magnesium 1050 45,300 1010BE 953BE 908BE 1020E Manganese 23 842 57.8 15.6 9.9 19.4 Nickel <4.5 13 2.3B <1.2 <1.2 <1.2 Potassium <110 2,390 835B 936B 787B 812B Sodium 555 398 466B 711B 776B 509B Vanadium <5.7 13 7.3B 3.5B 2.8B 4.1B Zinc 20 16 2.8B 5.9 23.7 2.0B
All samples analyzed by Savannah Laboratories, Tallahasee, Florida.< not detected at specified detection limit Data Qualifiers for Organic Compounds Data Qualifiers for Inorganic CompoundsNS - no standard J - Estimated Value, <CRQL B - Reading is less CRQL but greater than IDLBold - equal to or greater than BG B - Analytes found in associated blank E - reported balue is estimated due to interferenceBold & Shaded - equal to or greater than 10*BG P - Target analyte concentration>25% difference N - spiked sample recovery not within control limits between the two GC columns S - value determined by method of standard additions * - duplicate analysis not within control limits

TABLE 2-6 SUMMARY OF CONSTITUENTS DETECTED IN SOIL SAMPLES SITE SS-8, MOTOR POOL OIL LEAK AREA MONTGOMERY WATSON, 1993(CONTINUED) Homestead AFB AVERAGE Sample ID. SP2SL0004 SP2SL0005 SP2SL0005 SP2SL0005 Analyte Background CARBONATE Sample Interval 3-4 0-1 0-1 3-4 0-2 ft bls COMPOSITION Date Collected 5/27/93 5/27/93 5/27/93 5/27/93 Duplicate
VOA TCL Compounds (:g/kg) Acetone 119.2 NS 10000 3100 260 9200 Toluene NS NS <13 <12 <12 <13
Pesticide/PCB TCL Compounds (:g/kg) Alpha-Chlordane <2.9 NS <2.1 <2.1 0.56 JP <2.1 Beta Endosulfan <2.9 NS <4.1 <4.0 <4.2 <4.0 Beta-Chlordane <2.9 NS <2.1 <2.1 0.51J <2.1 Endrin 29 NS <4.1 <4.0 <4.2 <4.0 Heptachlor <2.9 NS <2.1 <2.1 0.54 J <2.1 p,p'-DDD <4.7 NS <4.1 <4.0 <4.2 <4.0 p,p'-DDE <4.7 NS <4.1 <4.0 <4.2 <4.0 p,p'-DDT <12 NS <4.1 <4.0 1.6 J <4.0
BNA TLC Compounds (:k/kg) Acenaphthene <390 NS <410 <400 <400 <420 Anthracene <390 NS 5 J <400 4 J <420 Benzo(a)Anthracene 67 NS <410 16 J 24 J <420 Benzo(a)Pyrene 66 NS <410 20 J 26 J 15 J Benzo(b)Fluoranthene 69 NS 3 J 26 J 31 J 18 J Bnezo(g,h,i)Perylene 44 NS <410 14 J 15 J 11 J Benzo(k)Fluoranthene 66 NS 4 J 19 J 24 J 12 J Benzyl Butyl Phthalate 16 NS 6 J 6 J 11 J 7 J Bis(2-Ethylhexyl) Phthalate 100 NS 120 J 23 BJ 47 BJ 93 BJ Carbazole NS NS <410 3 J 4 J <420 4-Chlorophenyl Phenyl Ether <390 NS <410 <400 <400 <420 Chrysene 79 NS <410 25 J 30 J <420 2,4-Dichlorophenol <390 NS <410 <400 <400 <420 Di-n-Butyl Phthalate <390 NS 11 BJ 20 BJ 12 BJ 19 BJ Di-n-Octyl Ph;thalate(Bis-(2-Ethylhexyl)Phthalate 10 NS <410 <400 <400 <420 Dibenz(A,H)Anthracene 17 NS <410 <400 <400 <420 Dibenzofuran <390 NS <410 <400 <400 <420
Diethlphthalate <390 NS <410 <400 <400 <420 Fluoranthene 52.4 NS 10 J 40 J 51 J 28 J Fluorene NS NS <410 <400 <400 <420 Indeno(1,2,3-C,D)Pyrene 45 NS <410 13 J 15 J 10 J 2-Methylnaphthalene 84 NS <410 <400 <400 <420 Naphthalene 50 NS <410 <400 <400 <420 Phenanthrene <2000 NS 5 J 18 J 23 J 12 J Phenol 50 NS <410 <400 <400 <420 Pyrene 49.15 NS 9 J 37 BJ 44 J 24 J 1,2,4-Trichlorobenzene <390 NS <410 <400 <400 <420
Metals (mg/kg) Aluminum 2400 8970 394 720 592 323 Arsenic 1.6 1.8 <1.0 1.6B 1.4B <1.1 Barium 42.9 30 4.6B 6.1B 6.3B 5.8B Beryllium <2.8 NE <0.21 <0.21 <0.20 <0.21 Cadmium <2.8 0.048 <0.42 <0.41 <0.41 <0.43 Calcium 345000 272,000 248000 369000 367000 248000 Chromium, Total 11.5 >0.1 3.5 4.7 4.2 4.1 Cobalt <1.1 0.12 <0.42 <0.41 <0.41 <0.43 Copper <2.7 4.4 <0.42 <0.41 <0.41 <0.43 Iron 1650 8,190 171 304 262 170 Lead 4.05 16 2.3N* 15.5N* 11.2N* 4.0N* Magnesium 1050 45,300 1060E 1050E 1120E 1010BE Manganese 23 842 8.1 13.2 14.1 8.8 Nickel <4.5 13 <1.2 <1.2 <1.2 <1.3 Potassium <110 2,390 909B 986B 965B 895B Sodium 555 398 615B 670B 707 857B Vanadium <5.7 13 3.7B 3.8B 3.8B 3.1B Zinc 20 16 2.5B 5.5 4.7 4.8
All samples analyzed by Savannah Laboratories, Tallahassee, Florida > not detected at specified detection limit Data Qualifiers for Organic Compounds Data Qualifiers for Inorganic Compounds NS - no standard J - Estimated Value, <CRQL B - Reading is less than CRQL but greater than IDL Bold - equal to or greater than BG B - Analytes found in associated blank E - reported value is estimated due to interference Bold & Shaded - equal to or greater than 10*BG P - Target analyte concentrations>25% difference N - spiked sample recovery not within control limits between the two GC columns S - value determined by method of standard additions * - duplicate analysis not within control limits

2.6.4 Sediment Sample Analytical Results 2.6.4.1 Initial Investigations (1986-1991). In 1986, two sedimentsamples were collected from the drainage ditch immdiately east of the Motor Pool fenceline. Both sedimentsamples had reported concentrations of oil and grease above ASQC (10 ppm). Both of the sediment samples hadlead levels above the ASQC (0.37 ppm) but below the NLS (100 ppm). In 1988, two sediment samples were collected from the drainage ditch east of the site and analyzed for VOCs,BNAs, and total RCRA concentrations of 30 mg/kg and 2,650 mg/kg. Several BNAs (mostly PAHs) were alsodetected in the sediment. In 1989, eight additional sediment samples were collected hom the perimeterdrainage ditch constituents detected in the sediment included BNAs, and several metals including lead. Thehighest concentrations were detected in the northeast corner of the drainage ditch which surrounds the site In 1991, 25 sediment samples were collected from the ditches surrounding Site SS-8. Five of the sedimentsamples collected in 1991 were analyzed for BNAs. Analytical results indicated BNA's, primarily PAHs,detected in all but one sample. Total PAH concentrations ranged from 2,400 :g/kg to 20,750 :g/kg. BNAconcentrations found in sediment samples are within the target risk range of 10-4 to 10-6, consideredprotective of human health by the USEPA; however, the state of Florida's target risk of 10-6 is exceeded.Lead was detected in all samples with reported concentrations ranging from 14 to 2,300 mg/kg. Additionalmetals detected included aluminum, barium, calcium, chromium, copper, iron, magnesium manganese, sodium,vanadium, zinc, mercury and arsenic. Sediment samples had reported arsenic and lead concentrations whichexceed soil target clean-up levels. Contaminants associated with the ditch sediments are presently beingevaluated in the Boundary and Outfall Canal (OU-9), Remedial Investigation. A summary of sediment analyticalresults is presented in Table 2-7 2.6.4.2 1993 Investigation. In 1993, 13 sediment samples were collected from the area canals and drainageditches. Each sediment sample was analyzed for TCL VOCs, TCL BNAs, TCL organochlorine pesticides/ PCBs, TALmetals, and cyanide. 23 BNAs, primarily PAHs were detected in the sediment samples collected during the 1993investigation. In general, lower total PAH levels were reported during the 1993 samples. However, BNAconcentrations were still observed above health based levels.

TABLE 2-7 SUMMARY OF CONSTITUENTS DETECTED IN SEDIMENT SAMPLESCOLLECTED AT SITE SS-8, MOTOR POOL OIL LEAK AREAHomested Air Reserve Base, FloridaGERAGHTY & MILLER, 1991 NOAA1/ NOAA2/ Interim SQC G&M Sample I.D. Trip Blank SP2-SD-0009 SP2-SD-0010 SP2-SD-0011 Analyte ER-L ER-M Ng/Kg OC 3/ Savannah I.D. 35283-11 35303-6 35303-7 35283-2 (:g/kg) (:g/kg) (1% OC) 4/ Sampling Date 8/20/91 8/20/91 8/19/91
VOLATILE ORGANIC COMPOUNDS: :g/Kg dw Acetone N N NS <10 NA NA 220 J 2-Butanone N N NS <10 NA NA <67
BASE/NEUTRAL EXTRACTABLE COMPOUNDS: :g/Kg dw Acenaphthene 150 560 7320 NA NA NA <2200 Anthracene 85 960 NS NA NA NA <2200 Benzo(a)anthracene 230 1600 13170 NA NA NA <2200 Benzo(a)pyrene 400 2500 10630 NA NA NA <2200 Benzo(b)fluoranthene N N NS NA NA NA <2200 Benzo(g,h,i)perylene N N NS NA NA NA <2200 Benzo(k)fluoranthene N N NS NA NA NA <2200 Benzoic acid N N NS NA NA NA [2400] bis(2-Ethylhexyl) phthalate N N NS NA NA NA [1600] Chrysene 400 2800 NS NA NA NA <2200 Dibenzo(a,h)anthracene 60 260 NS NA NA NA <2200 Fluoranthene 600 3600 18830 NA NA NA <2200 Fluorene 35 640 NS NA NA NA <2200 Indeno (1,2,3-cd)pyrene N N NS NA NA NA <2200 Phenanthrene 225 1380 1390 NA NA NA <2200 Pyrene 350 2200 13110 NA NA NA <2200
INORGANIC CONSTITUENTS: mg/Kg dw Aluminum N N NS NA NA NA 2400 Barium N N NS NA NA NA 12 Calcium 80 N NS NA NA NA 81 Chromium 70 145 NS NA NA NA <63 Copper N 390 NS NA NA NA 29 Iron N N NS NA NA NA 3000 Magnesium N N NS NA NA NA 700 Manganese N N NS NA NA NA 39 Sodium N N NS NA NA NA <330 Vanadium N N NS NA NA NA 33

Zinc 120 270 NS NA NA NA 54 Mercury 0.15 1.3 NS NA NA NA 0.091 Arsenic 33 85 NS NA NA NA <6.7 Lead 35 110 NS NA 150 27 160 J
METAL IN TCLP EXTRACT: mg/L Arsenic NA <2.0 <4.0 <0.20 Cadmium NA <0.10 <0.20 .070(.075) Lead NA <2.0 <4.0 <0.20

TABLE 2-7 SUMMARY OF CONSTITUENTS DETECTED IN SEDIMENT SAMPLESCOLLECTED AT SITE SS-8, MOTOR POOL OIL LEAK AREAHomestead Air Reserve Base, FloridaGERAGHTY & MILLER, 1991CONTINUED
NOAA1/ NOAA 2/ Interim SQC G&M Sample I.D. SP2-SD-0012 SP2-SD-9012 SP2-SD-0013 Analyte ER-L ER-M Ng/Kg OC 3/ Savannah I.D. 35283-3 35283-4 35283-5 (:g/kg) (:g/kg) (1% OC) 4/ Sampling Date 08/19/91 08/19/91 08/19/91
VOLATILE ORGANIC COMPOUNDS: :g/Kg dw Acetone N N NS 99 J 23 J NA 2-Butanone N N NS <16 UJ <14 NA
BASE/NEUTRAL EXTRACTABLE COMPOUNDS: :g/Kg dw Acenaphthene 150 650 7320 <530 <480 NA Anthracene 85 960 NS [31] [26] NA Benzo(a)anthracene 230 1600 13170 [170] [170] NA Benzo(a)pyrene 400 2500 10630 [250] [200] NA Benzo(b)fluoranthene N N NS [240] [200] NA Benzo(g,h,i)perylene N N NS <530 [140] NA Benzo(k)fluoranthene N N NS [240] [210] NA Benzoic acid N N NS [210] [120] NA bis(2-Ethylhexyl)phthalate N N NS [180] 840 NA Chrysene 400 2800 NS [240] [230] NA Dibenzo(a,h)anthracene 60 260 NS <530 <480 NA Fluoranthene 600 3600 18830 [310] [300] NA Fluorene 35 640 NS <530 <480 NA Indeno(1,2,3-cd)pyrene N N NS [150] [130] NA Phenanthrene 225 1380 1390 [120] [87] NA Pyrene 350 2200 13110 [290] [270] NA
INORGANIC CONSTITUENTS: mg/Kg dw Aluminum N N NS 1200 2500 NA Barium N N NS 23 5.3 NA Calcium 80 N NS 40 190 NA Chromium 70 145 NS <150 <140 NA Copper N 390 NS <3.0 3.7 NA Iron N N NS 980 1800 NA Magnesium N N NS 170 630 NA Manganese N N NS 10 21 NA Sodium N N NS 100 270 NA

Vanadium N N NS 31 13 NA Zinc 120 270 NS 14 36 NA Mercury 0.15 1.3 NS 0.023 0.041 NA Arsenic 33 85 NS <1.3 <1.4 NA Lead 35 110 NS 17 J 14 J 210 J
METAL IN TCLP EXTRACT: mg/L Arsenic <0.20 <0.20 <0.20 Cadmium <0.50 .076(.082) .090(.097) Lead <0.20 <0.20 <0.20
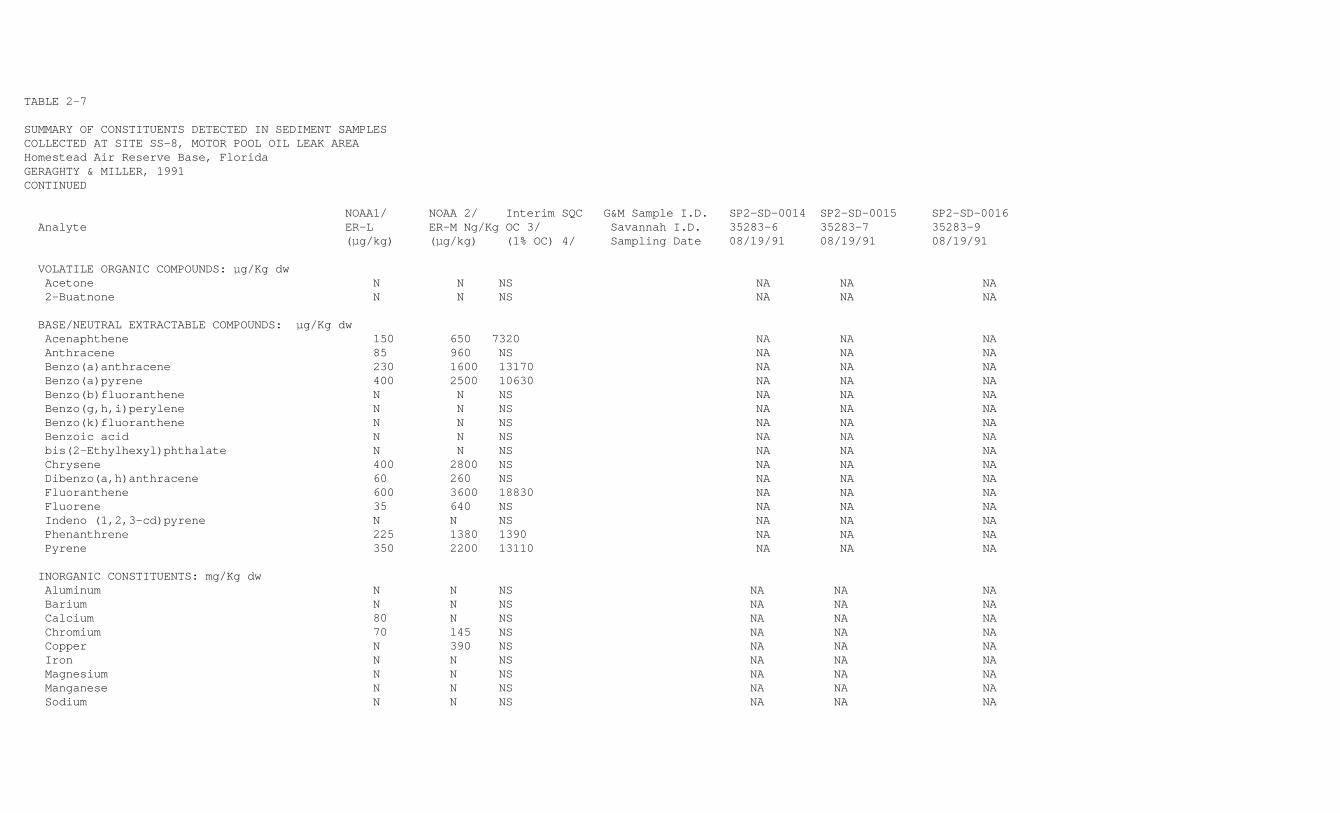
TABLE 2-7 SUMMARY OF CONSTITUENTS DETECTED IN SEDIMENT SAMPLESCOLLECTED AT SITE SS-8, MOTOR POOL OIL LEAK AREAHomestead Air Reserve Base, FloridaGERAGHTY & MILLER, 1991CONTINUED NOAA1/ NOAA 2/ Interim SQC G&M Sample I.D. SP2-SD-0014 SP2-SD-0015 SP2-SD-0016 Analyte ER-L ER-M Ng/Kg OC 3/ Savannah I.D. 35283-6 35283-7 35283-9 (:g/kg) (:g/kg) (1% OC) 4/ Sampling Date 08/19/91 08/19/91 08/19/91
VOLATILE ORGANIC COMPOUNDS: :g/Kg dw Acetone N N NS NA NA NA 2-Buatnone N N NS NA NA NA
BASE/NEUTRAL EXTRACTABLE COMPOUNDS: :g/Kg dw Acenaphthene 150 650 7320 NA NA NA Anthracene 85 960 NS NA NA NA Benzo(a)anthracene 230 1600 13170 NA NA NA Benzo(a)pyrene 400 2500 10630 NA NA NA Benzo(b)fluoranthene N N NS NA NA NA Benzo(g,h,i)perylene N N NS NA NA NA Benzo(k)fluoranthene N N NS NA NA NA Benzoic acid N N NS NA NA NA bis(2-Ethylhexyl)phthalate N N NS NA NA NA Chrysene 400 2800 NS NA NA NA Dibenzo(a,h)anthracene 60 260 NS NA NA NA Fluoranthene 600 3600 18830 NA NA NA Fluorene 35 640 NS NA NA NA Indeno (1,2,3-cd)pyrene N N NS NA NA NA Phenanthrene 225 1380 1390 NA NA NA Pyrene 350 2200 13110 NA NA NA
INORGANIC CONSTITUENTS: mg/Kg dw Aluminum N N NS NA NA NA Barium N N NS NA NA NA Calcium 80 N NS NA NA NA Chromium 70 145 NS NA NA NA Copper N 390 NS NA NA NA Iron N N NS NA NA NA Magnesium N N NS NA NA NA Manganese N N NS NA NA NA Sodium N N NS NA NA NA

Vanadium N N NS NA NA NA Zinc 120 270 NS NA NA NA Mercury 0.15 1.3 NS NA NA NA Arsenic 33 85 NS NA NA NA Lead 35 110 NS 2300J 96J 1400J
METAL IN TCLP EXTRACT: mg/L Arsenic <0.20 <0.20 <0.20 Cadmium .081(.087) .099(0.11) .091(.098) Lead 2.2(2.0) <0.20 2.5(2.2)

TABLE 2-7 SUMMARY OF CONSTITUENTS DETECTED IN SEDIMENTS SAMPLESCOLLECTED AT SITE SS-8, MOTOR POOL OIL LEAK AREAHomestead Air Reserve Base, FloridaGERAGHTY & MILLER, 1991CONTINUED NOAA1/ NOAA2/ Interim SQC G&M Sample I.D. SP2-SD-0017 SP2-SD-0018 SP2-SD-0019 SP-SD-0020 Analyte ER-L ER-M Ng/Kg OC 3/ Savannah I.D. 35283-10 35283-8* 35283-8 35417-9 (:g/kg) (:g/kg) (1% OC) 4/ Sampling Date 08/19/91 08/19/91 8/20/91 8/24/91
VOLATILE ORGANIC COMPOUNDS: :G/Kg dw Acetone N N NS NA NA NA NA 2-Butanone N N NS NA NA NA NA
BASE/NEUTRAL EXTRACTABLE COMPOUNDS: :g/Kg dw Acenaphthene 150 650 .7320 NA NA NA NA Anthracene 85 960 NS NA NA NA NA Benzo(a)anthracene 230 1600 13170 NA NA NA NA Benzo(a)pyrene 400 2500 10630 NA NA NA NA Benzo(b)fluoranthene N N NS NA NA NA NA Benzo(g,h,i)perylene N N NS NA NA NA NA Benzo(k)fluoranthene N N NS NA NA NA NA Benzo acid N N NS NA NA NA NA bis(2-Ethylhexyl)phthalate N N NS NA NA NA NA Chrysene 400 2800 NS NA NA NA NA Dibenzo(a)anthracene 60 260 NS NA NA NA NA Fluoranthene 600 3600 18830 NA NA NA NA Fluorene 35 640 NS NA NA NA NA Indeno (1,2,3-cd)pyrene N N NS NA NA NA NA Phenanthrene 225 1380 1390 NA NA NA NA Pyrene 350 2200 13110 NA NA NA NA
INORGANIC CONSTITUENTS: mg/Kg dw Aluminum N N NS NA NA NA NA Barium N N NS NA NA NA NA Calcium 80 N NS NA NA NA NA Chromium 70 145 NS NA NA NA NA Copper N 390 NS NA NA NA NA Iron N N NS NA NA NA NA Magnesium N N NS NA NA NA NA Manganese N N NS NA NA NA NA Sodium N N NS NA NA NA NA

Vanadium N N NS NA NA NA NA Zinc 120 270 NS NA NA NA NA Mercury 0.15 1.3 NS NA NA NA NA Arsenic 33 85 NS NA NA NA NA Lead 35 110 NS 1600 J 1600 J 500 1000
METAL IN TCLP EXTRACT: mg/L Arsenic <0.20 <0.20 <4.0 <2.0 Cadmium .076(.082) .035(.038) <0.20 <0.10 Lead 2.1(1.8) 4.7(4.1) 0.37(.36) <2.0

TABLE 2-7 SUMMARY OF CONSTITUENTS DETECTED IN SEDIMENTS SAMPLESCOLLECTED AT SITE SS-8, MOTOR POOL OIL LEAK AREAHomestead Air Reserve Base, FloridaGERAGHTY & MILLER, 1991CONTINUED NOAA1/ NOAA2/ Interim SQC G&M Sample I.D. SP2-SD-0021 SP2-SD-0022 SP2-SD-0022 SP2-SD-0023 SP2-SD-0024 SP2-SD-0026 SP2-SD-0025 Analyte ER-L ER-M Ng/Kg OC 3/ Savannah I.D. 35417-8 35303-10 35303-9 35417-10 35217-7 35417-5 35417-6 (:g/kg) (:g/kg) (1% OC) 4/ Sampling Date 8/24/91 08/20/91 8/20/91 8/24/91 8/24/91 8/24/91 8/24/91
VOLATILE ORGANIC COMPOUNDS: :G/Kg dw Acetone N N NS NA <96 <93 NA NA NA NA 2-Butanone N N NS NA <38 <37 UJ NA NA NA NA
BASE/NEUTRAL EXTRACTABLE COMPOUNDS: :g/Kg dw Acenaphthene 150 650 7320 NA <1300 <1200 NA NA NA NA Anthracene 85 960 NS NA <1300 <1200 NA NA NA NA Benzo(a)anthracene 230 1600 13170 NA [280] [280] NA NA NA NA Benzo(a)pyrene 400 2500 10630 NA [430] [430] NA NA NA NA Benzo(b)fluoranthene N N NS NA [660] [650] NA NA NA NA Benzo(g,h,i)perylene N N NS NA [400] <1200 NA NA NA NA Benzo(k)fluoranthene N N NS NA [500] [430] NA NA NA NA Benzo acid N N NS NA <6400 <6200 NA NA NA NA bis(2-Ethylhexyl)phthalate N N NS NA 2100 2700 NA NA NA NA Chrysene 400 2800 NS NA [680] [690] NA NA NA NA Dibenzo(a)anthracene 60 260 NS NA <1300 <1200 NA NA NA NA Fluoranthene 600 3600 18830 NA [740] [690] NA NA NA NA Fluorene 35 640 NS NA <1300 <1200 NA NA NA NA Indeno (1,2,3-cd)pyrene N N NS NA [310] <1200 NA NA NA NA Phenanthrene 225 1380 1390 NA [430] [400] NA NA NA NA Pyrene 350 2200 13110 NA [1300] 1300 NA NA NA NA
INORGANIC CONSTITUENTS: mg/Kg dw Aluminum N N NS NA 20000 19000 NA NA NA NA Barium N N NS NA 40 42 NA NA NA NA Calcium 80 N NS NA 230000 350000 NA NA NA NA Chromium 70 145 NS NA 53 50 NA NA NA NA Copper N 390 NS NA 30 26 NA NA NA NA Iron N N NS NA 13000 11000 NA NA NA NA Magnesium N N NS NA 1800 1800 NA NA NA NA Manganese N N NS NA 67 61 NA NA NA NA Sodium N N NS NA 340 750 NA NA NA NA

Vanadium N N NS NA 37 33 NA NA NA NA Zinc 120 270 NS NA 350 290 NA NA NA NA Mercury 0.15 1.3 NS NA 0.32 0.25 NA NA NA NA Arsenic 33 85 NS NA 36 33 NA NA NA NA Lead 35 110 NS 1200 J 520 520 320 200 49 110
METAL IN TCLP EXTRACT: mg/L Arsenic <2.0 <2.0 <1.0 <2.0 0.28(0.26) <2.0 <2.0 Cadmium <0.10 <0.10 <0.050 <0.10 <0.10 <0.10 <0.10 Lead 0.88(0.74) 0.31(.29) 0.30(.29) <2.0 <2.0 <2.0 <2.0

TABLE 2-7 SUMMARY OF CONSTITUENTS DETECTED IN SEDIMENTS SAMPLESCOLLECTED AT SITE SS-8, MOTOR POOL OIL LEAK AREAHomestead Air Reserve Base, FloridaGERAGHTY & MILLER, 1991CONTINUED NOAA1/ NOAA2/ Interim SQC G&M Sample I.D. SP2-SD-0027 SP2-SD-0028 SP2-SD-0029 SP-SD-0030 SP2-SD-0031 SP2-SD-0032 SP2-SD-0033 Analyte ER-L ER-M Ng/Kg OC 3/ Savannah I.D. 35417-4 35303-1 35303-2 35283-1 35303-3 35303-4 35303-5 (:g/kg) (:g/kg) (1% OC) 4/ Sampling Date 8/24/91 8/20/91 8/19/91 8/19/91 8/20/91 8/20/91 8/20/91
VOLATILE ORGANIC COMPOUNDS: :G/Kg dw Acetone N N NS 130 NA NA 320 NA NA NA 2-Butanone N N NS [19] NA NA <24 UJ NA NA NA
BASE/NEUTRAL EXTRACTABLE COMPOUNDS: :g/Kg dw Acenaphthene 150 650 7320 NA NA [280] NA NA NA Anthracene 85 960 NS <2400 NA NA [460] NA NA NA Benzo(a)anthracene 230 1600 13170 <2400 NA NA 1800 NA NA NA Benzo(a)pyrene 400 2500 10630 <2400 NA NA 2200 NA NA NA Benzo(b)fluoranthene N N NS <2400 NA NA 2100 NA NA NA Benzo(g,h,i)perylene N N NS <2400 NA NA 1200 NA NA NA Benzo(k)fluoranthene N N NS <2400 NA NA 1800 NA NA NA Benzo acid N N NS <12000 NA NA [460] NA NA NA bis(2-Ethylhexyl)phthalate N N NS [290] NA NA <800 NA NA NA Chrysene 400 2800 NS <2400 NA NA 1900 NA NA NA Dibenzo(a)anthracene 60 260 NS <2400 NA NA [300] NA NA NA Fluoranthene 600 3600 18830 <2400 NA NA 3000 NA NA NA Fluorene 35 640 NS <2400 NA NA [230] NA NA NA Indeno (1,2,3-cd)pyrene N N NS <2400 NA NA 1200 NA NA NA Phenanthrene 225 1380 1390 <2400 NA NA 1700 NA NA NA Pyrene 350 2200 13110 <2400 NA NA 2400 NA NA NA
INORGANIC CONSTITUENTS: mg/Kg dw Aluminum N N NS NA NA NA 3950 NA NA NA Barium N N NS NA NA NA 8.6 NA NA NA Calcium 80 N NS NA NA NA 351000 NA NA NA Chromium 70 145 NS NA NA NA <47 NA NA NA Copper N 390 NS NA NA NA <6.2 NA NA NA Iron N N NS NA NA NA 2610 NA NA NA Magnesium N N NS NA NA NA 1100 NA NA NA Manganese N N NS NA NA NA 26 NA NA NA Sodium N N NS NA NA NA 454 NA NA NA

Vanadium N N NS NA NA NA 7.7 NA NA NA Zinc 120 270 NS NA NA NA 28 NA NA NA Mercury 0.15 1.3 NS NA NA NA 0.12 NA NA NA Arsenic 33 85 NS NA NA NA <2.5 NA NA NA Lead 35 110 NS 27 J 450 690 37 J 130 120 95
METAL IN TCLP EXTRACT: mg/L Arsenic <2.0 <0.20 <2.0 <0.20 <2.0 <0.20 <2.0 Cadmium <0.10 .017(.014) <0.10 .091(.098) <0.10 <0.010 <0.10 Lead <2.0 <0.20 0.39(.39) <0.20 <2.0 <0.20 <2.0
Footnotes:
:g/Kg dw micrograms per kilogram dry weight mg/L milligram per liter NA not analyzed N Not Available NS No Standard [] Value is greater instrument detection limit but less than practical quantitation limit. J Positive result has been classified as qualitative. UJ Analyte was not detected. Classified as qualitative. U Classified as undetected. 1/ National Oceanic and Atmospheric Administration (NOAA) Technical. Memoradum NOS OMA, ER-L is effects Range - Low (10th percentile) 2/ Effect Range - Median (50th percentile) 3/ The sediment quality criteria (SQC) cannot be directly compared with the drainage swale. data because the SQC are presented as normalized to organic carbon. (i.e. presented on a per organic carbon weight basis.) To allow a direct comparison between the sediment data and SQC, the SQC for an organic carbon content of 1.0% OC were calculated. The SQC (:k/Kg) at 1% OC were derived by multiplying the SQC (:g/Kg OC) by an OC content of 1% (.01 Kg of OC/Kg of sediment.) 4/ Organic Carbon

TABLE 2-8
SUMMARY OF CONSTITUENTS DECTECTED IN SEDIMENT SAMPLESSITE SS-8, MOTOR POOL OIL LEAK AREAMONTGOMERY WATSON, 1993
Analyte NOAA 1/ NOAA 2/ Interim SQC BC-SC-0100** Sample ID SP2-SD-0034 SP2=SD-0035 SP2-SD-0036 SP2-SD-0037 SP2-SD-0038 ER-L ER-M :g/Kg OC 3/ Background Date Collected 3/15/93 3/15/93 3/15/93 3/15/93 3/15/93 (:g/kg) (:g/kg) (1% OC) 4/ 1991 VOA TCL Compounds (:g/kg) Acetone NS NS NS NA <120 220 <15 <13 <16 Methyl Ethyl Ketone (2-Butanone) NS NS NS NA <120 51 B <15 <13 <16
Pesticide/PCB TCL Compounds (:g/kg) Aldrin NS NS NS NA <12 <3.6 <2.5 <2.3 <2.7 Alpha Endosulfan NS NS NS NA <12 <3.6 <2.5 0.92 JP <2.7 Alpha-Chlordane 0.5(5) 6 NS NA <12 0.28 JP 0.67 J 0.44 JP 0.77 JP Beta-Endosulfan NS NS NS NA <12 <3.6 1.7 JP 1.5 JP <2.7 Beta-Chlordane 0.5(5) 6 NS NA 3.2 J 0.53 JP <2.5 1.1 JP 1.3 JP Endosulfan Sulfate NS NS NS NA 5.7 JP <7.0 2.4 JP 4.0 JP 1.8 JP Endrin 0.02 45 NS NA <24 <7.0 <4.9 <45 <5.3 Endrin Ketone NS NS NS NA <24 <7.0 2.1 JP 2.9 J <5.3 Heptachlor NS NS NS NA 2.6 J <3.6 <4.9 <4.5 1.3 J Heptachlor Epoxide NS NS NS NA <12 <3.6 <2.5 <2.3 <2.7 Methoxychlor NS NS NS NA <12 <3.6 8.4 J 7.9 JP <27 p,p'-DDD 2 20 NS NA 5.3 JP 1.4 J 1.0 JP 1.3 J 2.1 J p,p'-DDE 2 15 NS NA 4.7 JP 2.2 J 1.4 JP 0.99 J 1.2 J p,p'-DDT 1 7 NS NA 9.8 J 3.1 JP 2.1 JP 3.5 JP
BNA TCL Compounds (:g/kg) 2-4 Dimethylphenol NS NS NS <1400 <2400 <700 <490 <450 <530 2-Methylnaphthalene 65 670 NS <1400 <2400 <700 <490 15 J 13 J 4-Chloro-3-Methylphenol NS NS NS <1400 <2400 <700 <490 <450 <530 4-Methylphenol (P-Cresol) NS NS NS <1400 <2400 <700 <490 <450 <530 Acenaphthene 150 650 7320 <1400 <2400 <700 <490 <450 <530 Acenaphthylene NS NS NS <1400 <2400 <700 5 J <450 <530 Anthracene 85 960 NS <1400 <2400 20 J 18 J 16 J 20 J Benzo(a)Anthracene 230 1600 13,170 <1400 <2400 89 J 82 J 120 J 67 J Benzo(a)Pyrene 400 2500 10,630 <1400 110 J 120 J 130 J 130 J 81 J Benzo(b)Fluoranthene NS NS NS <1400 170 J 140 J 180 J 130 J 76 J Benzo(g,h,i)Perylene NS NS NS <1400 <2400 <700 160 J 36 J 110 J Benzo(k)Fluoranthene NS NS NS <1400 180 J 120 J 150 J 200 J 99 J Benzyl Butyl Phthalate NS NS NS <1400 100 J 36 J 14 J 10 J 13 J Bis(2-Ethylhexyl)Phthalate NS NS NS <1400 290 J 120 J 1,900 2,500 1,300
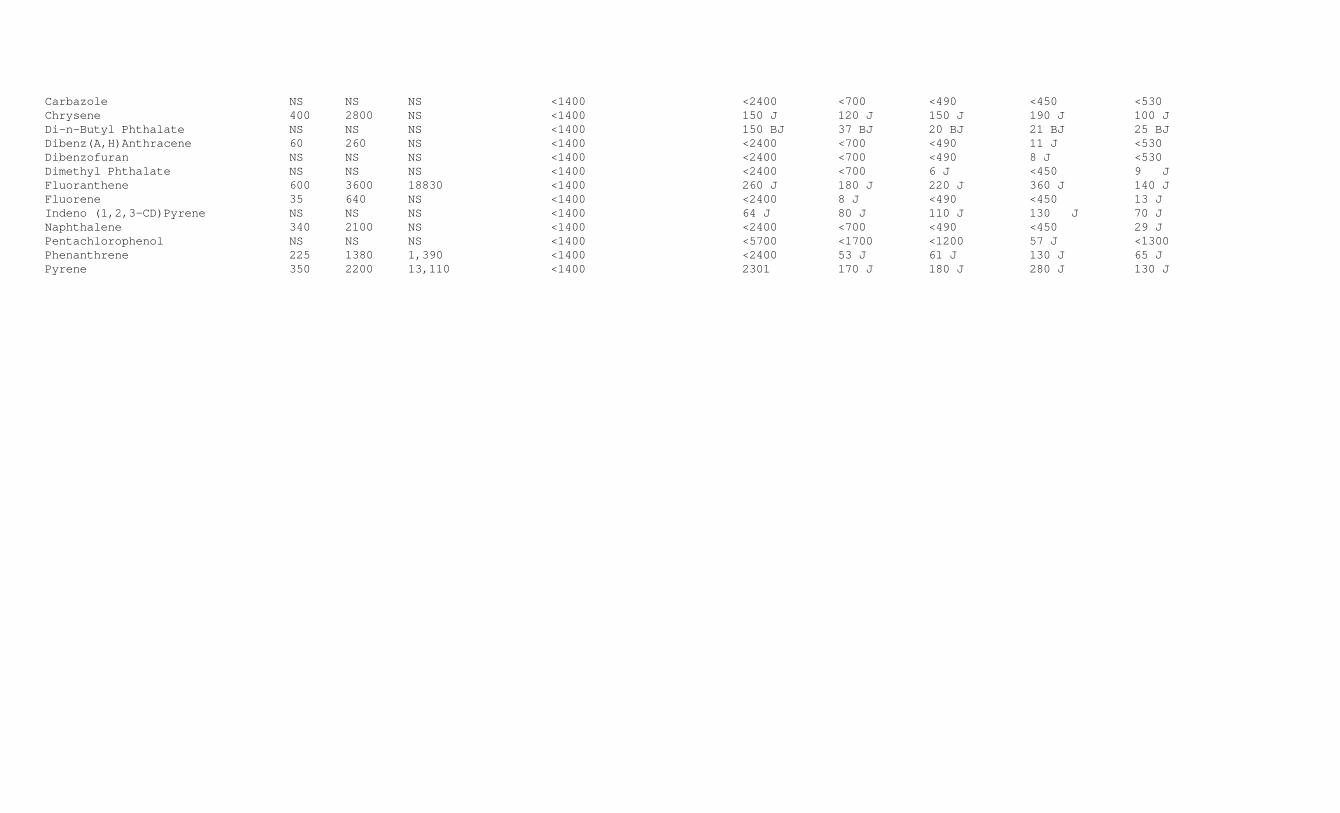
Carbazole NS NS NS <1400 <2400 <700 <490 <450 <530 Chrysene 400 2800 NS <1400 150 J 120 J 150 J 190 J 100 J Di-n-Butyl Phthalate NS NS NS <1400 150 BJ 37 BJ 20 BJ 21 BJ 25 BJ Dibenz(A,H)Anthracene 60 260 NS <1400 <2400 <700 <490 11 J <530 Dibenzofuran NS NS NS <1400 <2400 <700 <490 8 J <530 Dimethyl Phthalate NS NS NS <1400 <2400 <700 6 J <450 9 J Fluoranthene 600 3600 18830 <1400 260 J 180 J 220 J 360 J 140 J Fluorene 35 640 NS <1400 <2400 8 J <490 <450 13 J Indeno (1,2,3-CD)Pyrene NS NS NS <1400 64 J 80 J 110 J 130 J 70 J Naphthalene 340 2100 NS <1400 <2400 <700 <490 <450 29 J Pentachlorophenol NS NS NS <1400 <5700 <1700 <1200 57 J <1300 Phenanthrene 225 1380 1,390 <1400 <2400 53 J 61 J 130 J 65 J Pyrene 350 2200 13,110 <1400 2301 170 J 180 J 280 J 130 J
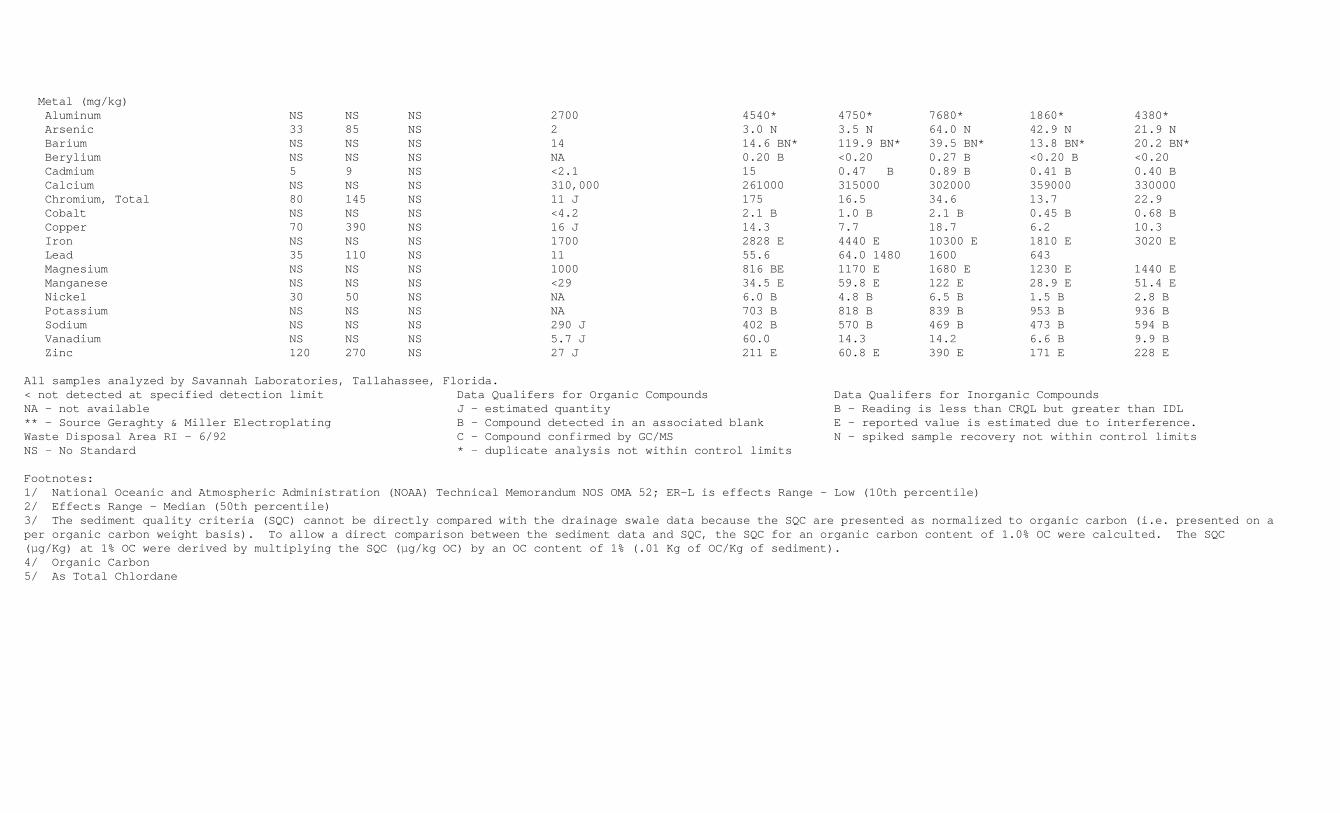
Metal (mg/kg) Aluminum NS NS NS 2700 4540* 4750* 7680* 1860* 4380* Arsenic 33 85 NS 2 3.0 N 3.5 N 64.0 N 42.9 N 21.9 N Barium NS NS NS 14 14.6 BN* 119.9 BN* 39.5 BN* 13.8 BN* 20.2 BN* Berylium NS NS NS NA 0.20 B <0.20 0.27 B <0.20 B <0.20 Cadmium 5 9 NS <2.1 15 0.47 B 0.89 B 0.41 B 0.40 B Calcium NS NS NS 310,000 261000 315000 302000 359000 330000 Chromium, Total 80 145 NS 11 J 175 16.5 34.6 13.7 22.9 Cobalt NS NS NS <4.2 2.1 B 1.0 B 2.1 B 0.45 B 0.68 B Copper 70 390 NS 16 J 14.3 7.7 18.7 6.2 10.3 Iron NS NS NS 1700 2828 E 4440 E 10300 E 1810 E 3020 E Lead 35 110 NS 11 55.6 64.0 1480 1600 643 Magnesium NS NS NS 1000 816 BE 1170 E 1680 E 1230 E 1440 E Manganese NS NS NS <29 34.5 E 59.8 E 122 E 28.9 E 51.4 E Nickel 30 50 NS NA 6.0 B 4.8 B 6.5 B 1.5 B 2.8 B Potassium NS NS NS NA 703 B 818 B 839 B 953 B 936 B Sodium NS NS NS 290 J 402 B 570 B 469 B 473 B 594 B Vanadium NS NS NS 5.7 J 60.0 14.3 14.2 6.6 B 9.9 B Zinc 120 270 NS 27 J 211 E 60.8 E 390 E 171 E 228 E
All samples analyzed by Savannah Laboratories, Tallahassee, Florida.< not detected at specified detection limit Data Qualifers for Organic Compounds Data Qualifers for Inorganic CompoundsNA - not available J - estimated quantity B - Reading is less than CRQL but greater than IDL** - Source Geraghty & Miller Electroplating B - Compound detected in an associated blank E - reported value is estimated due to interference.Waste Disposal Area RI - 6/92 C - Compound confirmed by GC/MS N - spiked sample recovery not within control limitsNS - No Standard * - duplicate analysis not within control limits
Footnotes:1/ National Oceanic and Atmospheric Administration (NOAA) Technical Memorandum NOS OMA 52; ER-L is effects Range - Low (10th percentile)2/ Effects Range - Median (50th percentile)3/ The sediment quality criteria (SQC) cannot be directly compared with the drainage swale data because the SQC are presented as normalized to organic carbon (i.e. presented on a per organic carbon weight basis). To allow a direct comparison between the sediment data and SQC, the SQC for an organic carbon content of 1.0% OC were calculted. The SQC (:g/Kg) at 1% OC were derived by multiplying the SQC (:g/kg OC) by an OC content of 1% (.01 Kg of OC/Kg of sediment).4/ Organic Carbon5/ As Total Chlordane

TABLE 2-8
SUMMARY OF CONSTITUENTS DECTECTED IN SEDIMENT SAMPLESSITE SS-8, MOTOR POOL OIL LEAK AREAMONTGOMERY WATSON, 1993 (CONTINUED)
Analyte NOAA 1/ NOAA 2/ Interim SQC BC-SC-0100** Sample ID SP2-SD-0039 SP2=SD-0040 SP2-SD-0041 SP2-SD-0042 SP2-SD-0043 ER-L ER-M :g/Kg OC 3/ Background Date Collected 3/15/93 3/15/93 3/15/93 3/15/93 3/15/93 (:g/kg) (:g/kg) (1% OC) 4/ 1991 VOA TCL Compounds (:g/kg) Acetone NS NS NS NA <16 <14 160 13 <45 Methyl Ethyl Ketone (2-Butanone) NS NS NS NA <16 <14 <21 <29 <45
Pesticide/PCB TCL Compounds (:g/kg) Aldrin NS NS NS NA <2.5 <2.2 <35 1.4 JP <5.5 Alpha Endosulfan NS NS NS NA <2.5 <2.2 <35 <2.8 <5.5 Alpha-Chlordane 0.5(5) 6 NS NA 2.9 P 3.0 <35 1.0 J 1.6 J Beta-Endosulfan NS NS NS NA <2.5 <2.2 <35 <2.8 <5.5 Beta-Chlordane 0.5(5) 6 NS NA 7.5 P 2.5 P <35 2.6 J 2.5 J Endosulfan Sulfate NS NS NS NA <4.9 14 P <69 <5.4 <11 Endrin 0.02 45 NS NA <4.9 <4.3 22 J <4.5 <11 Endrin Ketone NS NS NS NA 13 4.8 P <69 <5.4 <11 Heptachlor NS NS NS NA <2.5 <2.2 <35 0.76 JP <5.5 Heptachlor Epoxide NS NS NS NA <2.2 <2.2 <35 0.94 J <5.5 Methoxychlor NS NS NS NA 19 JP 16 JP <350 <28 <5.5 p,p'-DDD 2 20 NS NA 7.1 140 58 JPC 4.1 JP <11 p,p'-DDE 2 15 NS NA 6.2 42 11 JPC 31 6.7 JP p,p'-DDT 1 7 NS NA 7.3 P 31 60 JPC 3.3 J <11
BNA TCL Compounds (:g/kg) 2-4 Dimethylphenol NS NS NS <1400 <490 <430 21 J <540 <1100 2-Methylnaphthalene 65 670 NS <1400 360 J 57 J 560 J <540 <1100 4-Chloro-3-Methylphenol NS NS NS <1400 <490 <430 26 J <540 <1100 4-Methylphenol (P-Cresol) NS NS NS <1400 21 J <430 <690 <540 <1100 Acenaphthene 150 650 7320 <1400 1,400 250 J 2100 15 J <1100 Acenaphthylene NS NS NS <1400 15 J <430 23 J 4 J <1100 Anthracene 85 960 NS <1400 2000 420 J 4,300 63 J <1100 Benzo(a)Anthracene 230 1600 13,170 <1400 4000 970 16,000 290 J <1100 Benzo(a)Pyrene 400 2500 10,630 <1400 2,700 870 13,000 230 J 90 J Benzo(b)Fluoranthene NS NS NS <1400 3,400 990 14,000 320 J 170 J Benzo(g,h,i)Perylene NS NS NS <1400 2,200 690 9,400 110 J 97 J Benzo(k)Fluoranthene NS NS NS <1400 2,200 910 16,000 180 J 170 J

Benzyl Butyl Phthalate NS NS NS <1400 29 J 19 J 170 J 31 J 34 J Bis(2-Ethylhexyl)Phthalate NS NS NS <1400 580 J 310 J 2,000 160 BJ 220 J Carbazole NS NS NS <1400 2,000 390 J 4,000 <540 <1100 Chrysene 400 2800 NS <1400 3,900 1,100 J 19,000 310 J 90 J Di-n-Butyl Phthalate NS NS NS <1400 <490 <430 <690 50 BJ 59 BJ Dibenz(A,H)Anthracene 60 260 NS <1400 <490 <430 <690 <540 <1100 Dibenzofuran NS NS NS <1400 900 180 J 180 J 1,800 <540 Dimethyl Phthalate NS NS NS <1400 <490 <430 <690 <540 <1100 Fluoranthene 600 3600 18830 <1400 7,800 1,800 35,000 570 150 Fluorene 35 640 NS <1400 1,800 330 J 3,200 38 J <1100 Indeno (1,2,3-CD)Pyrene NS NS NS <1400 2,200 570 8,600 190 J 34 J Naphthalene 340 2100 NS <1400 640 110 J 1,200 <540 <1100 Pentachlorophenol NS NS NS <1400 <1200 <1100 <1700 <1300 <2600 Phenanthrene 225 1380 1,390 <1400 7,600 1,600 29,000 280 BJ <1100 Pyrene 350 2200 13,110 <1400 8,200 2,700 32,000 450 J 150 J
Metals (mg/kg) Aluminum NS NS NS 2700 4940* 432* 3650* 30600* 3320* Arsenic 33 85 NS 2 39.8 N 9.5 N 17.3 N 57.3 N 2.7 N Barium NS NS NS 14 22.6 BN* 114 BN* 291 N* 37.8 BN* 10.4 BN* Beryllium NS NS NS NA <0.20 <0.20 <0.20 0.77 B <0.20 Cadmium 5 9 NS <2.1 0.76B 1.3 1.1 0.76 B 0.57 B Calcium NS NS NS 310,000 239000 272000 343000 155000 272000 Chromium, Total 80 145 NS 11 J 21.9 14.6 20.8 67.1 12.0 Cobalt NS NS NS <4.2 1.00 B 0.41 B 0.84 B 2.5 B 0.69 B Copper 70 390 NS 16 J 9.4 6.9 16.8 8.4 7.4 Iron NS NS NS 1700 3160 E 656 E 2140 E 15600 E 2100 E Lead 35 110 NS 11 852 66.8 472 176 87.2 Magnesium NS NS NS 1000 1250 E 1030 E 1310 E 1770 E 778 BE Manganese NS NS NS <29 56.1 E 11.8 E 27.0 E 84.3 E 17.3 E Nickel 30 50 NS NA 3.9 B <1.2 5.8 15.5 4.7 B Potassium NS NS NS NA 684 B 685 B 986 B 707 B 667 B Sodium NS NS NS 290 J 343 B 530 B 693 B 407 B 420 B Vanadium NS NS NS 5.7 J 9.7 B 5.3 B 12.7 38.7 B 12.7 Zinc 120 270 NS 27 J 305 E 68.6 E 235 E 82.8 E 36.0 E
All samples analyzed by Savannah Laboratories, Tallahassee, Florida.< not detected at specified detection limit Data Qualifers for Organic Compounds Data Qualifers for Inorganic CompoundsNA - not available J - estimated quantity B - Reading is less than CRQL but greater than IDL** - Source Geraghty & Miller Electroplating B - Compound detected in an associated blank E - reported value is estimated due to interference.Waste Disposal Area RI - 6/92 C - Compound confirmed by GC/MS N - spiked sample recovery not within control limitsNS - No Standard * - duplicate analysis not within control limits

Footnotes:1/ National Oceanic and Atmospheric Administration (NOAA) Technical Memorandum NOS OMA 52; ER-L is effects Range - Low (10th percentile)2/ Effects Range - Median (50th percentile)3/ The sediment quality criteria (SQC) cannot be directly compared with the drainage swale data because the SQC are presented as normalized to organic carbon (i.e. presented on a per organic carbon weight basis). To allow a direct comparison between the sediment data and SQC, the SQC for an organic carbon content of 1.0% OC were calculted. The SQC (:g/Kg) at 1% OC were derived by multiplying the SQC (:g/kg OC) by an OC content of 1% (.01 Kg of OC/Kg of sediment).4/ Organic Carbon5/ As Total Chlordane

TABLE 2-8
SUMMARY OF CONSTITUENTS DECTECTED IN SEDIMENT SAMPLESSITE SS-8, MOTOR POOL OIL LEAK AREAMONTGOMERY WATSON, 1993 CONTINUED
Analyte NOAA 1/ NOAA 2/ Interim SQC BC-SD-0100** Sample ID SP2-SD-0044 SP2-SD-9044 SP2-SD-0045 SP2-SD-0046 ER-L ER-M :g/Kg OC 3/ Background Date Collected 3/15/93 3/15/93 3/15/93 3/15/93 (:g/kg) :g/kg) (1% OC) 4/ 1991 VOA TCL Compounds (:g/kg) Acetone NS NS NS NA <16 <16 <23 <19 Methyl Ethyl Ketone (2-Butanone) NS NS NS NA <16 <16 <23 <19
Pesticide/PCB TCL Compounds (:g/kg) Aldrin NS NS NS NA <2.6 <2.7 <3.7 <18 Alpha Endosulfan NS NS NS NA <2.6 <2.7 <3.7 <18 Alpha-Chlordane 0.5(5) 6 NS NA <2.6 <2.7 <3.7 18 Beta-Endosulfan NS NS NS NA <2.6 <2.7 <3.7 <18 Beta-Chlordane 0.5(5) 6 NS NA <2.6 0.93 JP <3.7 26 Endosulfan Sulfate NS NS NS NA <5.1 <5.2 <7.2 <35 Endrin 0.02 45 NS NA <5.1 <5.2 <7.2 <35 Endrin Ketone NS NS NS NA 1.41 J 3.0 J <7.2 <35 Heptachlor NS NS NS NA <2.6 <2.7 <3.7 <18 Heptachlor Epoxide NS NS NS NA <2.6 <2.7 <3.7 <18 Methoxychlor NS NS NS NA <2.6 <2.7 <3.7 <18 p,p'-DDD 2 20 NS NA <2.6 <2.7 <3.7 63 C p,p'-DDE 2 15 NS NA <5.1 0.94 J 1.81 220 C p,p'-DDT 1 7 NS NA <5.1 1.6 JP <7.2 19 CJ
BNA TCL Compounds (:g/kg) 2-4 Dimethylphenol NS NS NS <1400 <510 <520 <720 <700 2-Methylnaphthalene 65 670 NS <1400 <510 <520 <720 <700 4-Chloro-3-Methylphenol NS NS NS <1400 <510 <520 <720 <700 4-Methylphenol (P-Cresol) NS NS NS <1400 <510 <520 <720 <700 Acenaphthene 150 650 7320 <1400 14 J 12 J <720 <700 Acenaphthylene NS NS NS <1400 <510 <520 <720 <700 Anthracene 85 960 NS <1400 34 J 26 J 24 J 32 J Benzo(a)Anthracene 230 1600 13,170 <1400 440 J 340 J 170 J 150 J Benzo(a)Pyrene 400 2500 10,630 <1400 580 440 J 230 J 220 J Benzo(b)Fluoranthene NS NS NS <1400 640 530 290 J 400 J Benzo(g,h,i)Perylene NS NS NS <1400 620 380 J <720 <700 Benzo(k)Fluoranthene NS NS NS <1400 670 500 J 200 J 450 J

Benzyl Butyl Phthalate NS NS NS <1400 <510 <520 37 J 15 J Bis(2-Ethylhexyl)Phthalate NS NS NS <1400 <510 <520 110 J 79 J Carbazole NS NS NS <1400 <510 <520 <720 <700 Chrysene 400 2800 NS <1400 600 440 J 230 J 230 J Di-n-Butyl Phthalate NS NS NS <1400 51 BJ 29 BJ 66 BJ 61 BJ Dibenz(A,H)Anthracene 60 260 NS <1400 <510 <520 <720 <700 Dibenzofuran NS NS NS <1400 4 J <520 <720 <700 Dimethyl Phthalate NS NS NS <1400 <510 <520 <720 <700 Fluoranthene 600 3600 18830 <1400 650 520 J 330 J 490 J Fluorene 35 640 NS <1400 8 J 7 J <720 22 J Indeno (1,2,3-CD)Pyrene NS NS NS <1400 540 350 J <720 82 J Naphthalene 340 2100 NS <1400 <510 <520 <720 <720 Pentachlorophenol NS NS NS <1400 <1200 <1300 <1700 <1700 Phenanthrene 225 1380 1,390 <1400 170 BJ 130 J 110 J 120 J Pyrene 350 2200 13,110 <1400 790 710 310 J 580 J
Metal (mg/kg) Aluminum NS NS NS 2700 5050* 4670* 4160* 3450* Arsenic 33 85 NS 2 3.0 N 3.2 N 2.6 N 10.9 N Barium NS NS NS 14 12.2 BN* 12.3 BN* 10.2 BN* 24.5 BN* Beryllium NS NS NS NA <0.20 <0.20 <0.20 <0.20 Cadmium 5 9 NS <2.1 0.91 0.90 B <0.40 0.89 B Calcium NS NS NS 310,000 294000 309000 297000 286000 Chromium, Total 80 145 NS 11 J 23.5 21.1 12.2 17.6 Cobalt NS NS NS <4.2 0.73 B 0.41 B 0.56 B <0.40 Copper 70 390 NS 16 J 7.1 7.8 2.9 B 17.3 Iron NS NS NS 1700 2500 E 2440 E 2100 E 2140 E Lead 35 110 NS 11 82.5 68.6 75.7 42.1 Magnesium NS NS NS 1000 970 E 1060 BE 988 BE 1240 E Manganese NS NS NS <29 26.1 E 24.6E 22.5 E 74.5 E Nickel 30 50 NS NA 4.1 B 4.0 B 3.3 B 2.3 B Potassium NS NS NS NA 773 B 804 B 808 B 687 B Sodium NS NS NS 290 J 836 B 842 B 650 B 312 B Vanadium NS NS NS 5.7 J 8.4 B 8.2 B 10 B 7.5 B Zinc 120 270 NS 27 J 82.1 E 88.5E 32.6 E 49.6 E
All samples analyzed by Savannah Laboratories, Tallahassee, Florida. < not detected at specified detection limit Data Qualifers for Organic Compounds Data Qualifers for Inorganic CompoundsNA - not available J - estimated quantity B - Reading is less than CRQL but greater than IDL** - Source Geraghty & Miller Electroplating B - Compound detected in an associated blank E - reported value is estimated due to interference.Waste Disposal Area RI - 6/92 C - Compound confirmed by GC/MS N - spiked sample recovery not within control limitsNS - No Standard * - duplicate analysis not within control limits

Footnotes:1/ National Oceanic and Atmospheric Administration (NOAA) Technical Memorandum NOS OMA 52; ER-L is effects Range - Low (10th percentile)2/ Effects Range - Median (50th percentile)3/ The sediment quality criteria (SQC) cannot be directly compared with the drainage swale data because the SQC are presented as normalized to organic carbon (i.e. presented on a per organic carbon weight basis). To allow a direct comparison between the sediment data and SQC, the SQC for an organic carbon content of 1.0% OC were calculted. The SQC (:g/Kg) at 1% OC were derived by multiplying the SQC (:g/kg OC) by an OC content of 1% (.01 Kg of OC/Kg of sediment).4/ Organic Carbon5/ As Total Chlordane

The pesticides heptachlor, heptachlor epoxide, alpha and beta endosulfan, endosulfate, methoxychlor, endrinketone, alpha-chlordane, beta-chlordane, and the DDT metabolites p,p'-DDE and p,p'-DDD were detected insediment samples at Site SS-8. Concentrations of pesticides were below health based cleanup levels. No PCBswere detected in sediment samples obtained during the 1993 investigation. 18 TAL metals (aluminum, arsenic, barium, beryllium, cadmium, calcium chromium, cobalt, copper, iron, lead,magnesium, manganese, nickel, potassium, sodium, vanadium and zinc) were detected in sediment samples at SiteSS-8 during the 1993 investigation. Arsenic was detected in all sediment samples with concentrationsexceeding background soil levels and background sediment concentration in six samples. Lead was detected insediment samples ranging from 55.6 to 1600 mg/kg. Lead concentrations in the canal surrounding the MotorPool were lower in the 1993 samples when compared to 1991 levels. Sediment metals concentrations exceededhealth based cleanup levels for lead and arsenic. A summary of constituents detected in sediment samplesfrom the 1993 investigation are presented in Table 2-8. 2.6.5 Surface Water S6mple Analytical Results 2.6.5.1 Initial investigations (1991). In the samples collected in 1991, no VOCs were detected. Only oneBNA, DEHP, had a quantifiable concentration detected DEHP is a common laboratory contaminant and its presencemay be due to laboratory conditions and not representative of site conditions. A summary of the 1991 surfacewater analytical results is presented in Table 2-9. Mercury was detected in five of the seven samples (six sample locations plus one duplicate sample) that wereanalyzed for mercury. Mercury concentrations ranged from less than 0.10 to 0.22 :g/L. In three of thesamples where mercury was detected, the concentrations were above the Federal Water Ouality Criteria (FWQC)of 0.012 :g/L and the Florida Surface Water Guidance Criteria (FSWGC) of 0.012 :g/L. Other inorganicconstituents detected in the surface water included: aluminum, barium, calcium, copper, iron, magnesium,potassium, sodium, and zinc. Aluminum was the only constituent detected above the FSWGC or the FWQC. 2.6.5.2 1993 Investigation. Four surface water samples were collected at Site SS-8. No VOCs were detected,as were no BNAs and no organochlorine pesticides/PCB compounds. The metals barium, calcium, iron, magnesium,manganese, potassium, sodium, and zinc were detected in surface water samples. Metals results are belowstate and federal groundwater quality criteria and Florida surface water quality criteria. Cyanide was notdetected in any of the 1993 surface waster samples. A summary of constituents detected in surface watersamples collected in 1993 are presented in Table 2-10.
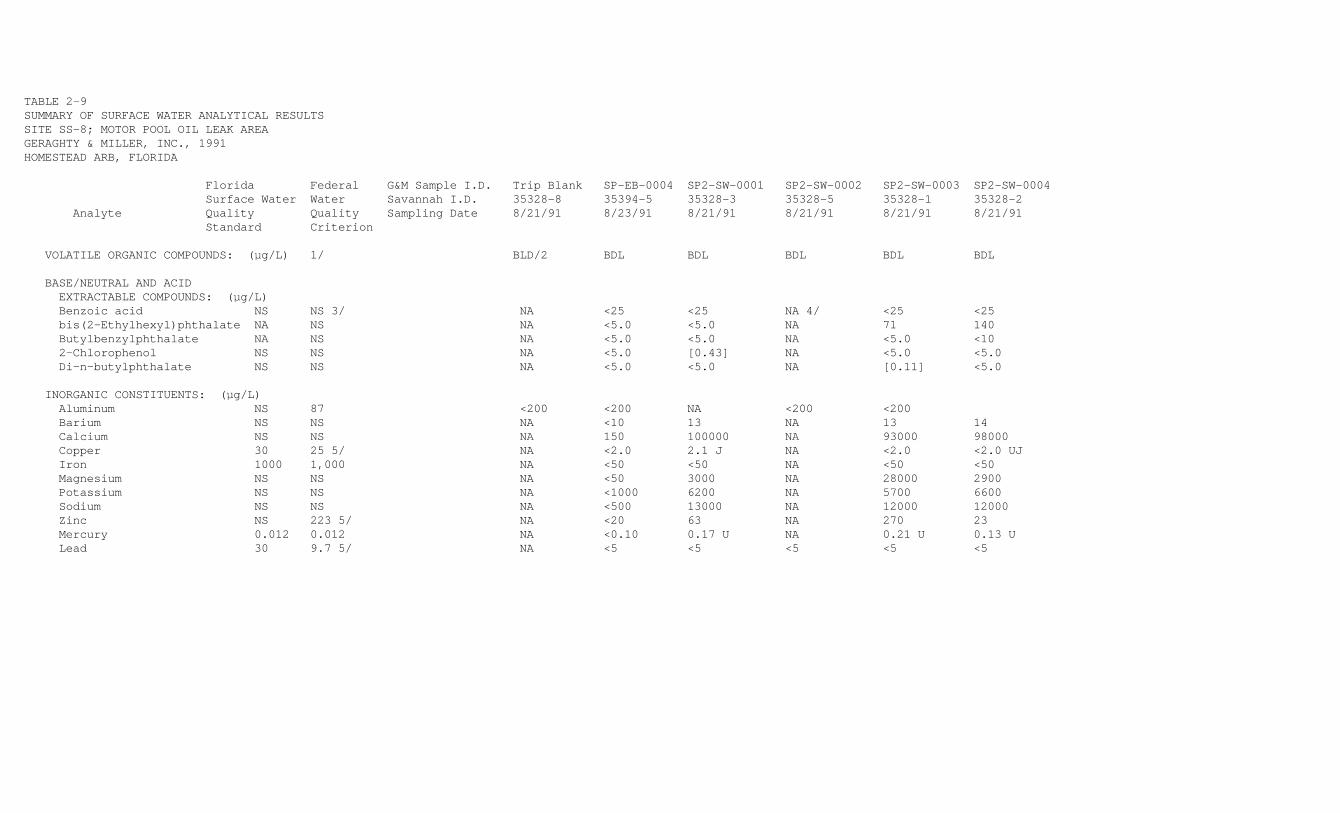
TABLE 2-9SUMMARY OF SURFACE WATER ANALYTICAL RESULTSSITE SS-8; MOTOR POOL OIL LEAK AREAGERAGHTY & MILLER, INC., 1991HOMESTEAD ARB, FLORIDA Florida Federal G&M Sample I.D. Trip Blank SP-EB-0004 SP2-SW-0001 SP2-SW-0002 SP2-SW-0003 SP2-SW-0004 Surface Water Water Savannah I.D. 35328-8 35394-5 35328-3 35328-5 35328-1 35328-2 Analyte Quality Quality Sampling Date 8/21/91 8/23/91 8/21/91 8/21/91 8/21/91 8/21/91 Standard Criterion
VOLATILE ORGANIC COMPOUNDS: (:g/L) 1/ BLD/2 BDL BDL BDL BDL BDL
BASE/NEUTRAL AND ACID EXTRACTABLE COMPOUNDS: (:g/L) Benzoic acid NS NS 3/ NA <25 <25 NA 4/ <25 <25 bis(2-Ethylhexyl)phthalate NA NS NA <5.0 <5.0 NA 71 140 Butylbenzylphthalate NA NS NA <5.0 <5.0 NA <5.0 <10 2-Chlorophenol NS NS NA <5.0 [0.43] NA <5.0 <5.0 Di-n-butylphthalate NS NS NA <5.0 <5.0 NA [0.11] <5.0
INORGANIC CONSTITUENTS: (:g/L) Aluminum NS 87 <200 <200 NA <200 <200 Barium NS NS NA <10 13 NA 13 14 Calcium NS NS NA 150 100000 NA 93000 98000 Copper 30 25 5/ NA <2.0 2.1 J NA <2.0 <2.0 UJ Iron 1000 1,000 NA <50 <50 NA <50 <50 Magnesium NS NS NA <50 3000 NA 28000 2900 Potassium NS NS NA <1000 6200 NA 5700 6600 Sodium NS NS NA <500 13000 NA 12000 12000 Zinc NS 223 5/ NA <20 63 NA 270 23 Mercury 0.012 0.012 NA <0.10 0.17 U NA 0.21 U 0.13 U Lead 30 9.7 5/ NA <5 <5 <5 <5 <5

TABLE 2-9SUMMARY OF SURFACE WATER ANALYTICAL RESULTSSITE SS-8; MOTOR POOL OIL LEAK AREAGERAGHTY & MILLER, INC., 1991HOMESTEAD ARB, FLORIDACONTINUED
Florida Federal G&M Sample I.D. S2P-SW-9004 SP2-SW-0005 SP2-SW-0006 SP2-SW-0007 SP2-SW-0008 SP2-SW-0009 SP2-SW-0010 Surface Water Water Savannah I.D. 35328-4 35328-7 35445-5 35328-6 35394-11 35394-6 3545-6 Analyte Quality Quality Sampling Date 8/21/91 8/21/91 8/27/91 8/21/91 8/23/91 8/23/91 8/27/91 Standard Criterion
VOLATILE ORGANIC COMPOUNDS: (:g/L) 1/ BLD BDL BDL BDL BDL BDL BDL
BASE/NEUTRAL AND ACID EXTRACTABLE COMPOUNDS: (:g/L) Benzoic acid NS NS 3/ [0.61] NA NA NA NA <25 <25 bis(2-Ethylhexyl)phthalate NA NS <5.0 NA NA NA NA <5.0 <5.0 Butylbenzylphthalate NA NS <5.0 NA NA NA NA <5.0 [1.6] 2-Chlorophenol NS NS [0.32] NA NA NA NA <5.0 <5.0 Di-n-butylphthalate NS NS <5.0 NA NA NA NA <5.0 <5.0
INORGANIC CONSTITUENTS: (:g/L) Aluminum NS 87 <200 NA NA NA NA 680 <200 Barium NS NS 13 NA NA NA NA <10 <10 Calcium NS NS 97000 NA NA NA NA 19000 14000 Copper 30 25 5/ <2.0 NA NA NA NA <2.0 UJ <2.0 UJ Iron 1000 1,000 <50 NA NA NA NA 720 J <50 Magnesium NS NS 2900 NA NA NA NA 450 410 Potassium NS NS 6400 NA NA NA NA <1000 <1000 UJ Sodium NS NS 1200 NA NA NA NA 2000 2400 Zinc NS 223 5/ 110 NA NA NA NA 27 <20 Mercury 0.012 0.012 0.22 U NA NA NA NA 0.22 <0.10 Lead 30 9.7 5/ <5 <5 UJ <5 <5 <5 UJ <5 <5 UJ
Source: Geraghty & Miller, Inc. 1992
1/ Constituents not detected above the practical quantitation limit are not listed.2/ All constitiuents in analyte group were below the practical quantiation limit.3/ NS: No Standard4/ NA: Not Analyzed5/ Federal Water Quality Criterion (FWQC) calculated using average hardness of 240 mg/L Boundary Canal[] Value is between instrument detection limit and practical quanitation limit.

TABLE 2-10
SUMMARY OF CONSTITUENTS DECTECTED IN SURFACE WATER SAMPLESCOLLECTED AT SITE SS-8 MOTOR OIL LEAK AREAMONTGOMERY WATSON, 1993
Florida Federal Sample I.D. SP2-SW-0011 SP2-SW-0012 SP2-SW-9013 SP2-SW-0013 SP2-SW-0014 Surface Water Water Date Collected 3/14/93 3/14/93 3/14/93 3/14/93 3/14/93 Analyte Quality Quality Standards Criterion** Duplicate
VOA TCL Compounds (:g/L) Chloroform NS 28900 <10 <10 1 J 1 J 1 J Pesticide/PCB TCL Compounds (:g/l) ND ND ND ND ND ND ND BNA TCL Compounds (:g/l)*** Bis(2-Ethylhexyl) Phthalate <3000 <3000 <10 0.2 J <11 <10 <11 Di-n-Butyl Phthalate <3000 <3000 0.5 BJ <10 <11 0.2 BJ <11 Diethlphthalate <300 <3000 0.1 J <10 <11 <10 <11
Metal (mg/kg) Barium NS NS 11.7B 3.5B 8.0B 9.9B 6.5B Calcium NS NS 99600 37300 89700 96800 91800 Copper 25* 18 <2.0 4.0B 5.1B 4.8B <2.0 Iron 1 1,000 23.8B 58.2B 16.5B 8.8B 17.0B Magnesium NS NS 2910B 1020B 2920B 3010B 3000B Manganese NS NS 3.4B 1.8B 1.6B <1.0 1.5B Potassium NS NS 6710 1730B 6820 7950 6850 Sodium NS NS 13300 4350B 13500 12700 14000 Zinc 223* 320 26.6 28.9 23.2 22.6 38.4
All samples analyzed by Savannah Laboratories, Tallahassee, Florida. < - not detected at specified detection limit Data Qualifiers for Organic Compounds Data Qualifers for Inorganic CompoundsNS - no standard J - estimated quantity B - Reading is less than CRQL but greater than IDLND - not detected B - compound detected in an associated blankNA - not analyzed
Notes:
* Florida WaterQuality Criterion (FWQC) calculated using average hardness of 240 mg/L Boundary Canal** Fresh water acute** Reported as Total Phthalate Esters

2.7 SUMMARY OF SITE RISKS In order to evaluate whether existing or future exposure to contaminated media at Site SS-8 could pose a riskto people or the environment, USAF completed a BRA in July 1994, with USEPA oversight of this process. Inestimating potential site risks, USAF assumed no further action would be taken to address contamination atthe site. This evaluation then served as a baseline for determining whether cleanup of each site media wasnecessary. In the BRA, USAF evaluated site risks for several environmental media. This ROD addresses therisks atttibutable to chemicals in the groundwater, soil and sediment at Site SS-8. Sediment and surfacewater will also be addressed as part of OU-9, the site-wide canal assessment. The risk assessment includedthe following major components: selection of chemicals of potential concern, exposure assessment, toxicityassessment, risk characterization, development of remedial goal options, ecological risk, and uncertainties. 2.7.1 Selection of Chemicals of Potential Concern Samples collected at Site SS-8 indicated that groundwater contains semi-volatile organic chemicals (SVOCs)and metals. Soils at the site contain VOCs, SVOCs, pesticides, and metals. Chemicals are included in the risk assessment as chemicals of potential concern (COPCs) if the results of aninitial screening indicate that the chemical might pose a current or future risk above levels deemedprotective of human health and the environment by the USEPA. COPCs at Site SS-8 included all detected organicchemicals and inorganic chemicals that are not human nutrients and are present at levels greater than twicethe average background concentrations. A concentration toxicity screen was performed to eliminate fromconsideration chemicals that contributed less than 1% of the total estimated risk in a given medium. COPC for groundwater and soil are shown in Table 2-11.
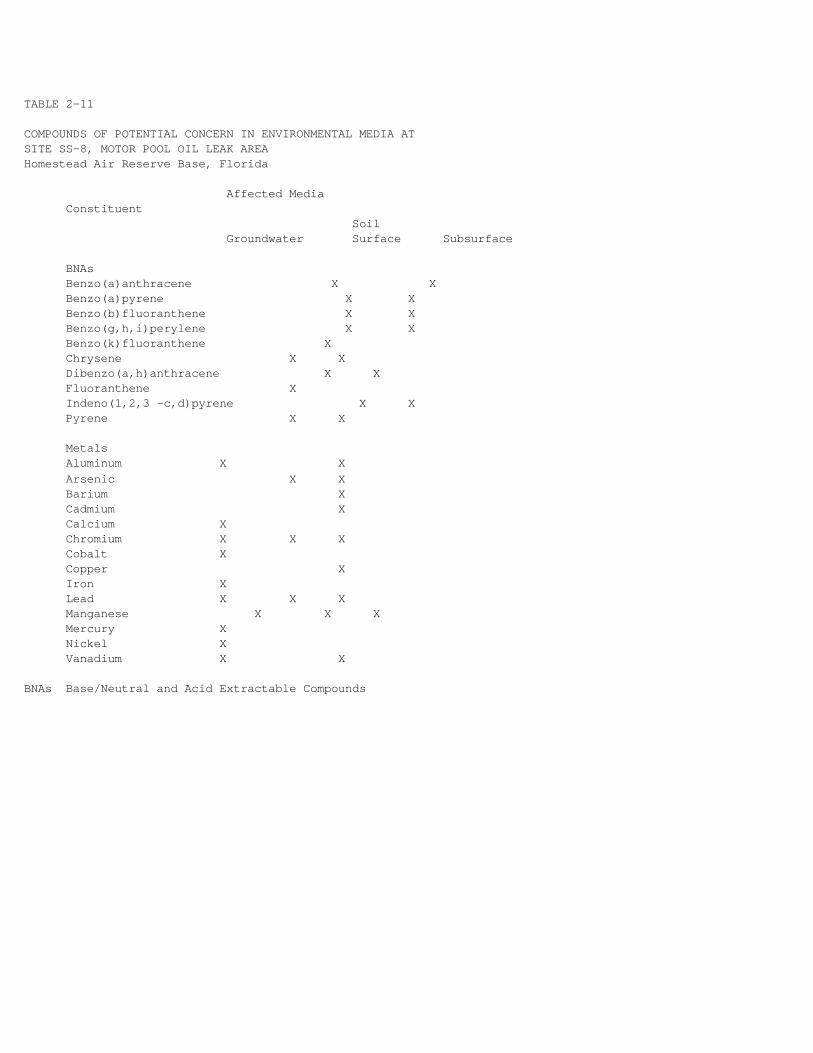
TABLE 2-11 COMPOUNDS OF POTENTIAL CONCERN IN ENVIRONMENTAL MEDIA ATSITE SS-8, MOTOR POOL OIL LEAK AREAHomestead Air Reserve Base, Florida Affected Media Constituent Soil Groundwater Surface Subsurface BNAs Benzo(a)anthracene X X Benzo(a)pyrene X X Benzo(b)fluoranthene X X Benzo(g,h,i)perylene X X Benzo(k)fluoranthene X Chrysene X X Dibenzo(a,h)anthracene X X Fluoranthene X Indeno(1,2,3 -c,d)pyrene X X Pyrene X X Metals Aluminum X X Arsenic X X Barium X Cadmium X Calcium X Chromium X X X Cobalt X Copper X Iron X Lead X X X Manganese X X X Mercury X Nickel X Vanadium X X BNAs Base/Neutral and Acid Extractable Compounds

2.7.2 Exposure Assessment In the exposure assessment, USAF considered ways in which people could come into contact with contaminatedmedia under both current and future conditions. A critical step in assessing the potential risk to publichealth is to identify the pathways through which exposure to chemicals could occur. A typical transportpathway consists of four necessary elements: 1) a source and mechanism of chemical release; 2) anenvironmental transport medium; 3) a point of potential contact with the contaminated medium; and 4) exposureroutes (inhalation of vapors, ingestion of groundwater, etc.). All four of these elements must be presentfor a pathway to be complete. 2.7.2.1 Exposure Point Concentrations. The exposure point concentration for each contaminant was derivedusing the 95 percent upper confidence limit (UCL95) on the arithrimetic mean as defined by the followingformula: (- [s2 sH ]) UCL95 =e (x + [2 + %n-1]) _where: x = arithmetic mean of the log-transformed data s = standard deviation of the log-transformed data H = statistical parameter UCL = Upper Confidence Limit Often, with limited data sets, the UCL95 is higher than the maximum detected concentration. If so, themaximum concentration detected was used as the exposure point concentration rather than the UCL95. Exposurepoint concentration for groundwater, surface soil, and subsurface soil are presented in Tables 2-12, 2-13,and 2-14, respectively. 2.7.2.2 Land Use. Hypothetical future use of the site for residential purposes in unlikely. However, forthe purposes of the baseline risk assessment, the hypothetical future risks were evaluated for thepossibility of future residential development of the site and installation of a potable well.

TABLE 2-12 EXPOSURE POINT CONCENTRATIONS FOR GROUNDWATERSITR SS-8 (FORMERLY SP-2) MOTOR POOL OIL LEAK AREAHOMESTEAD AIR RESERVE BASE Geraghty & Miller Montgomery Watson Samples Collected Samples Collected 1990-1991 1993 G&M MW Value Used Constituent No. Samples No. Samples Total No. Samples UCL,[1] Max[1] Max[1] in Calculation Collected & Avg. Collected Average 1990-93
METALS (:g/L) Chromium 2 1 3 4.52E+12 240 3.6 240 Manganese 2 1 3 2.13E+20 320 22.2 320 Mercury 2 1 3 11.64 0.32 0.1 0.32 Nickel 2 1 3 1.20E+08 80 6.4 80 Vanadium 2 1 3 7.16E+13 120 7.6 120 Lead 2 1 3 3.76E+08 20 1.5 20 Note: UCLs based on thc 95 percent UCL of the arithmetic average of the log-transformed data.UCL Upper Confidence Limit:f/L micrograms per Liter-- Not Detected[] UCLs are used as exposure point concentrations unless calculation produces a UCL greater than the maximum detected concentration, in which case the maximum detected concentration is used. This UCL value is for the combined sample sets.

TABLE 2-13 EXPOSURE POINT CONCENTRATIONS FOR GROUNDWATERSITR SS-8 (FORMERLY SP-2) MOTOR POOL OIL, LEAK AREAHOMESTEAD AIR RESERVE BASE Geraghty & Miller Montgomery Watson Samples Collected Samples Collected 1990-1991 1993 MW Value Used Constituent No. Samples No. Samples Total No. Samples UCL,[1] Max[1] in Calculation Collected & Avg Collected Average 1990-93
BNAS (:g/kg) Benzo(a)anthracene 5 5 1.62E+08 3,700 3,700 Benzo(a)pyrene 5 5 1.94E+09 5,300 5,300 Benzo(b)fluoranthene 5 5 6.01E+13 5,800 5,800 Benzo(g,h,i)perylene 5 5 9.57E+08 3,800 3,800 Benzo(k)fluoranthene 5 5 1.20E+13 4,500 4,500 Chrysene [No soil samples collected in 1990-1991] 5 5 8.74E+08 5,200 5,200 Dibenzo(a.h)anthracene 5 5 3.86E+03 1,000 1,000 Fluoranthene 5 5 6.94E+16 5,100 5,100 Ideno(1,2,3-c,d)pyrene 5 5 3.13E+08 3,200 3,200 Pyrene 5 5 4.32E+12 5,800 5,800 METTALS (ms/kg) Arsenic 5 5 6.24 2.4 2.4 Chromium 5 5 27.0 15.9 15.9 Lead 5 5 999.0 92.4 92.4 Manganese 5 5 45.5 42.9 42.9 Note: UCLs based on the 95 percent UCL of the arithmetic average of the log-transformed data.UCL Upper Confidence Limit:g/L micrograms per Liter-- Not Detected[] UCLs are used as exposure point concentrations unless calculation produces a UCL greater than thc maximum detected concentration, in which case the maximum detected concentration is used.

TABLE 2-14 EXPOSURE POINT CONCENTRATIONS FOR GROUNDWATERSITR SS-8 (FORMERLY SP-2) MOTOR POOL OIL, LEAK AREAHOMESTEAD AIR RESERVE BASE Geraghty & Miller Montgomery Watson Samples Collected Samples Collected 1990-1991 1993 MW Value Used Constituent No. Samples No. Samples Total No. Samples UCL,[1] Max[1] in Calculation Collected & Avg Collected Average 1990-93
BNAS (:g/kg) Benzo(a)anthracene 5 5 7.41E+04 3,200 3,200 Benzo(a)pyrene 5 5 7.36E+07 5,500 5,500 Benzo(b)fluoranthene 5 5 4.67E+12 7,000 7,000 Benzo(g,h,i)perylene 5 5 1.10E+08 4,300 4,300 Chrysene [No soil samples collected in 1990-1991] 5 5 3.62E+05 5,600 5,600 Dibenzo(a,h)anthracene 5 5 9.69E+04 1,200 1,200 Indeno(1,2,3-c,d)pyrene 5 5 4.43E+07 3,300 3,300 Pyrene 5 5 3.59E+10 6,500 6,500 METTALS (ms/kg) Arsenic 5 5 4.78 3 3 Barium 5 5 19.5 15.7 15.7 Cadmium 5 5 0.50 0.55 0.5 Chromium 5 5 38.3 19.6 19.6 Copper 5 5 1030 8.6 8.6 Lead 5 5 9.01E+04 120 120 Manganese 5 5 108.8 57.8 57.8 Vanadium 7.39E+00 7.3 7.3
Note: UCLs based on the 95 percent UCL of the arithmetic average of the log-transformed data.UCL Upper Confidence Limit:g/L micrograms per Liter-- Not Detected[1] UCLs are used as exposure point concentrations unless calculation produces a UCL greater than thc maximum detected concentration, in which case the maximum detected concentration is used.

TABLE 2-15 EQUATIONS AND SAMPLE CALCULATIONS FOR HYPOTHETICAL FUTURE POTABLE GROUNDWATER EXPOSURE ATSITE SS-8, MOTOR POOL OIL LEAK AREAHomestead Air Reserve Base, Florida Equation Definition: GWExD = CgwxIRxEF _________ BWxAP ELCR = GWExD x CSFo HQ = GWExD _____ RfDo
where: AP Averaging period (25,550 days/lifetime [365 days/yr for 70 years] for carcinogenic effects; 10,950 days/lifetime [365 days/yr for 30 years] for non- carcinogenic effects (USEPA, 1989a). BW Body weight (70 kg) (USEPA, 1991a). CSFo Cancer slope factor for oral exposure (mg/kg day)-1 (Table 3-3). Cgw Concentration in ground water (mg/L) (lesser of 95 percent upper confidence limit on the arithmetic mean or the maximum detected concentration) (Table 4-2). ELCR Excess lifetime cancer risk. EF Exposure frequency (10,500 days/lifetime [350 days/year for 30 years]) (USEPA, 1991a). GWExD Potable ground-water exposure dose (mg/kg-day). HQ Hazard quotient. IR Ingestion rate - drinking water (2 liters/day) (USEPA, 1991a). RfDo Reference dose for oral exposure (mg/kg-day) (Table 3-2). Sample Calculation - chromium, cancer effects GWExD = (0.24 mg/L) x (2 L/day) x (10.500 days/lifetime) (70 kg) x (25,550 days/lifetime) = 2.8E-03 mg/kg-day ELCR = Not calculated because chromium is carcinogenic through inhalation only TABLE 2-15 (continued) EQUATIONS AND SAMPLE CALCULATIONS FOR HYPOTHETICAL FUTURE POTABLE GROUNDWATER EXPOSURE ATSITE SS-8, MOTOR POOL OIL LEAK AREAHomestead Air Force Base, Florida Sample Calculation - chromium, non-cancer effects GWExD = (0.24 mg/L) x (2 L/day) x (10,500 days/lifetime) (70 kg) x (10,950 days/lifetime = 6.6E-03 mg/kg-day HQ = 6.6E-03 mg/kg-day 5E-03 mg/kg-day = 1.3E+00

TABLE 2-16 EQUATIONS AND SAMPLE CALCULATIONS FOR SURFACE SOIL EXPOSURE ATSITE SS-8, MOTOR POOL OIL LEAK AREA
Equation Definitions: SExDo = Cs( orCsTEF) x IR x EF x ED x UCL1(1) BW x AP SExDd = Cs x SSA x SAR x ABS x EF x ED x UCL(1) BW x AP
SExDi = Cs( or CsTEF) x BR x ET x EF x ED x RF x (1-G) x (W/Ut)3 x F(x) (particulates) BW x AP x Q/C x UC2 or Cs (or CsTEF) x BR x ET x H x EF x ED x 2 x Dei x Pa x UC5/Kd (vapors) (2) BW x AP x Q/C x (3.1416 x alpha x ED x UC3)1/2 x UC4 ELCR = (SExDo x CSFo) + (SExDd x CSFa) + (SExDi x CSFi) HQ = (SExDo/RfDo) + (SExDd/RfDa) + (SExDi/RfDi) where: ABS Dermal absorption efficiency, constituent-specific (from Table 3-1).AP Averaging period (equal to ED x 365 days/year for non-cancer effects; 25,550 days [70 years x 365 days/year] for cancer effects) (USEPA, 1989a).BR Breathing rate (0.83 m3/hour [20 m3/day] for residents [USEPA,1991a]; 2.5 m3/hour for base worker [USEPA, 1989b]).BW Body weight (70 kg for adults; 15 kg for a young child [aged 0 to 6 years]) (USEPA, 1991a).Cs Constituent concentration in the soil (mg/kg) (from Table 4-3).CSTEF Constituent concentration in the soil (mg/kg) (from Table 4-3) multiplied by toxicity equivalency factors(TEFS). TEFS have been applied to constituent concentrations based on each compounds relative potency to the potency of benzo(a)pyrene.CSfa Cancer slope factor for dermal exposure, adjusted for absorbed dose (mg/kg-day)-1 (Table 3-4).CSFi Cancer slope factor for inhalation exposure (mg/kg-day)-1 (Table 3-3).CSFo Cancer slope factor for oral exposure (mg/kg-day)-1 (Table 3-3).ED Exposure duration (25 years for base worker; 24 years for an adult resident; 6 years for a child resident [aged 0 to 6 years]) (USEPA, 1991a).EF Exposure frequency (350 days/year for residents [USEPA, 1991a]; 12 days/year [1 day/month for 12 months per year] for a base worker).ELCR Excess lifetime cancer risk (unitless).
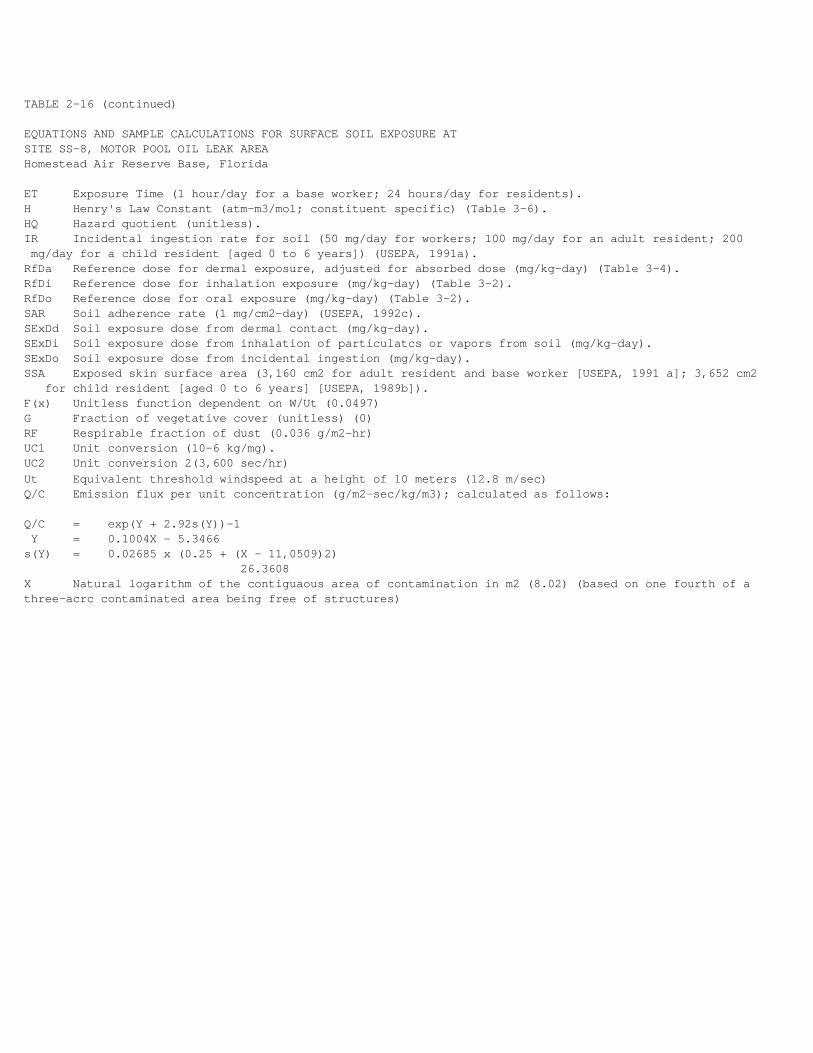
TABLE 2-16 (continued) EQUATIONS AND SAMPLE CALCULATIONS FOR SURFACE SOIL EXPOSURE ATSITE SS-8, MOTOR POOL OIL LEAK AREAHomestead Air Reserve Base, Florida ET Exposure Time (1 hour/day for a base worker; 24 hours/day for residents).H Henry's Law Constant (atm-m3/mol; constituent specific) (Table 3-6).HQ Hazard quotient (unitless).IR Incidental ingestion rate for soil (50 mg/day for workers; 100 mg/day for an adult resident; 200 mg/day for a child resident [aged 0 to 6 years]) (USEPA, 1991a).RfDa Reference dose for dermal exposure, adjusted for absorbed dose (mg/kg-day) (Table 3-4).RfDi Reference dose for inhalation exposure (mg/kg-day) (Table 3-2).RfDo Reference dose for oral exposure (mg/kg-day) (Table 3-2).SAR Soil adherence rate (1 mg/cm2-day) (USEPA, 1992c).SExDd Soil exposure dose from dermal contact (mg/kg-day).SExDi Soil exposure dose from inhalation of particulatcs or vapors from soil (mg/kg-day).SExDo Soil exposure dose from incidental ingestion (mg/kg-day).SSA Exposed skin surface area (3,160 cm2 for adult resident and base worker [USEPA, 1991 a]; 3,652 cm2 for child resident [aged 0 to 6 years] [USEPA, 1989b]).F(x) Unitless function dependent on W/Ut (0.0497)G Fraction of vegetative cover (unitless) (0)RF Respirable fraction of dust (0.036 g/m2-hr)UC1 Unit conversion (10-6 kg/mg).UC2 Unit conversion 2(3,600 sec/hr)Ut Equivalent threshold windspeed at a height of 10 meters (12.8 m/sec)Q/C Emission flux per unit concentration (g/m2-sec/kg/m3); calculated as follows: Q/C = exp(Y + 2.92s(Y))-1 Y = 0.1004X - 5.3466s(Y) = 0.02685 x (0.25 + (X - 11,0509)2) 26.3608X Natural logarithm of the contiguaous area of contamination in m2 (8.02) (based on one fourth of athree-acrc contaminated area being free of structures)

TABLE 2-16 (continued) EQUATIONS AND SAMPLE CALCULATIONS FOR SOIL EXPOSURE ATSITE SS-3 (FORMER SP-7), AIRCRAFT WASHRACK AREAHomestead Air Reserve Base, Florida alpha Convenient collection of variables (cm2/sec); calculated as follows: Dei x Pa alpha = Pa + [roe x (1-Pa)Kd/(UC5 x H)] beta Soil bulk density (1.5 g/cm3) Dei Effective diffusivity (cm2/sec); calculated as follows: Dei = Di(Pa3.33/Pt2) Di Chemical-specific diffusivity in air (cm2/sec) Pa Air-filled porosity (unitless); calculated as follows: Pa = Pt - (theta x beta) Pt Total soil porosity (unitless); calculated as follows: Pt = 1 - (beta/roe) roe Soil particulate density (2.65 g/cm3) theta Average soil mositure content (0.1 cm3 water/gram of soil) UC3 Unit conversion 3 (31,500,000 sec/yr) UC4 Unit conversion 4 (0.0001 m2/cm2) UC5 Unit conversion 5 (41 mol/atm-m3) (Hwang and Falco, 1986)
TABLE 2-16 (continued) EQUATIONS AND SAMPLE CALCULATIONS FOR SURFACE SOIL EXPOSURE ATSITE SS-8, MOTOR POOL OIL LEAK AREAHomestead Air Reserve Base, Florida Sample Calculation - benzo(a)pyrene, cancer effects, base worker (mowing scenario): SExDo = (5.3 mg/kg) x (50 mg/day) x (52 days/yr) x (25 Yrs) x (10-6 kg/mg) (70 kg) x (25,550 days) = 1.9 X 10⁻⁷ mg/kg-day SExDd = (5.3 mg/kg) x (3.160 cm2) x ( 1 mg/cm2-day) x (0.01 ) x (52 days/yr) x (25 yrs) x (10-6 kg/mg) (70 kg) x (25,550 days) = 1.2 X 10⁻⁷ mg/kg-day SExDi (3) 5.3mgx2.5m3x1hrsx52daysx25yrsx0.036 8 x (1-0)x(4 m /12.8 m)3x0.0497(Particulate) kg hr day yr m2 - hr sec sec g 70kgx25,500daysx89.5m2-sec x3,600 sec kg hr m3 = 1.6 x 10⁻¹² mg/kg-day ELCR = [(1.9 x 10⁻⁷ mg/kg-day) x (7.5 kg-day/mg)] + [(1.2 x 10⁻⁷ mg/kg-day) x (6.6 kg-day/mg)] + [(1.6 x 10⁻¹² mg/kg-day) x (7.5 kg-day/mg)] = 2.2 x 10⁻⁶

TABLE 2-16 (continued) EQUATIONS AND SAMPLE CALCULATIONS FOR SOIL EXPOSURE ATSITE SS-3 (FORMER SP-7), AIRCRAFT WASHRACK AREAHomestead Air Reserve Base, Florida Sample Calculation - manganese, noncancer effects, future child resident: SExDo = (42.9 mg/kg) x (200 mg/day) x (350 days/yr) x (6 yrs) x (10-6 kg/mg) (15 kg) x (2,190 days) = 5.5 x 10⁻⁴ mg/kg-day SExDd = (42.9 mg/kg) x (3,652 cm2) x (1 mg/cm2-day) x (0.001) x (350 days/yr) x (6 yrs) x (10-6 kg/mg) (15 kg) x (2,190 days)
= 1.0 x 10⁻⁵ mg/kg-day SexDi =
42.9mg x 0.83m3 x 24hrs x 350 days x 6yrs x 0.036 g x (1-0) x (4 m/ 12.8 m) 3 x 0.0497(Particulate) kg hr day yr m2 - hr sec sec g 15kgx2,190 daysx89.5m2 - sec x 3,600 sec kg hr m3 = 9.3 x 10⁻⁹ mg/kg-day HQ = 5.5 x 10⁻⁴ mg/kg-day + 1.0 x 10⁻⁵mg/kg-day + 9.3 10-9mg/kg-day 0.10 mg/kg-day 5.0 x 10⁻³ mg/kg-day 1.1 x 10⁻⁴ mg-4 mg/kg-day = 7.6 x 10⁻³ (1) This equation as presented in Risk Assessment Guidance Volume 1 (USEPA, 1989)
(2) This equation as presented in RAGs Volume I, modified to estimate air concentrations based on soil concentrations.
(3) Calculations not performed for vapors due to absence of volatile organic compounds (VOCs) at this site.

TABLE 2-17 EQUATIONS AND SAMPLE CALCULATIONS FOR HYPOTHETICAL FUTURE CONSTRUCTION WORKERFOR SOIL EXPOSURE ATSITE SS-8, MOTOR POOL OIL LEAK AREAHomestead Air Reserve Base, Florida Sample Calculation - arsenic, cancer effects, construction worker, subsurface soil: SExDo = (3 mg/kg) x (480 mg/day) x (250 days/yr) x (1 yr) x (10-6 kg/mg) (70 kg) x (25,550 days) = 2.0 x 10⁻⁷ mg/kg-day SExDi = (3 mg/kg) x (5 mg/m3) x (2.5 m3/hr) x (8 hr/day) x (250 days/yr) x (1 yr) x (10-6 kg/mg) (70 kg) x (25,550 days) = 4.2 x 10⁻⁸ mg/kg-day ELCR = [(2.0 x 10⁻⁷ mg/kg-day) x (1.75 kg-day/mg)] + [(4.2 x 10⁻⁸ mg/kg-day) x (5.0 x 10+1 kg-day/mg)] = 2.4x 10⁻⁶ Sample Calculation - benzo(g,h,i)perylene, noncancer effects, construction worker, surface soil: SExDo = (3.8 mg/kg) x (480 mg/day) x (250 days/yr) x (1 yr) x (10-6 kg/mg) (70 kg) x (365 days) = 1.8 x 10⁻⁵ mg/kg-day SExDi = (3.8 mg/kg) x (5.0 m3/hr) x 2.5 m3/hr) x (8 hrs/day) x (250 days/yr) x (1 yr) x (10-6cm3/m3) (70 kg) x (365 days) = 3.7 x 10⁻⁶ mg/kg-day HQ = 1.8 x 10⁻⁵mg/kg-day + 3.7 x 10⁻⁶mg/kg-day 3.0 x 10⁻² mg/kg-day 1.0 x 10⁻² mg/kg-day = 9.7 x 10⁻⁴

TABLE 2-17 EQUATIONS AND SAMPLE CALCULATIONS FOR HYPOTHETICAL FUTURE CONSTRUCTION WORKERFOR SOIL EXPOSURE ATSITE SS-8, MOTOR POOL OIL LEAK AREAHomestead Air Reserve Base, Florida Equation Definitions:
SExDo = Csx1RxEFxEDxUC1 BW x AP SExDi = CsxSPMxBRxETxEFxEDxUC1 BW x AP ELCR = (SExDo x CSFo) + (SExDi x CSFi) HQ = (SExDo/RfD) + (SExDi/RfDi) where: AP Averaging period (equal to ED x 365 days/year for non-cancer effects; 25,550 days [70 years x 365 days/year] for cancer effects) (USEPA, 1989a).BR Breathing rate (2.5 m3/hour [20 m3/day] for construction workers [USEPA, 1991a].BW Body weight (70 kg for adults (USEPA, 1991a).Cs Constituent concentration in the soil (mg/kg) (from Table 4-4).CSFi Cancer slope factor for inhalation exposure (mg/kg-day)-1 (Table 3-3).CSFo Cancer slope factor for oral exposure (mg/kg-day)-1 (Table 3-3).ED Exposure duration (1 year for a construction worker)(USEPA, 1991a).EF Exposure frequency (250 days/year for a construction worker).ELCR Excess lifetime cancer risk (unitless).ET Exposure time (8 hour/day for a construction worker;).HQ Hazard quotient (unitless).IR Incidental ingestion rate for soil (480 mg/day for construction workers) (USEPA, 1991a).Rfdi Reference dose for inhalation exposure (mg/kg-day) (Table 3-2); subchronic value used if available.Rfdo Reference dose for oral exposure (mg/kg-day) (Table 3-2); subchronic value used if available.SExDi Soil exposure dose from inhalation of particulates or vapors from soil (mg/kg-day).SExDo Soil exposure dose from incidental ingestion (mg/kg-day).SPM Suspended particulate matter (5 mg/m3) (OSHA).UC1 Unit conversion (10-6 kg/mg).UC3 Unit conversion 3 (106 cm3/m3).UC4 Unit conversion 4 (103 g/kg).

2.7.2.3 Exposure Scenarios. Potential current risks at the site were evaluate based on a base workeraccessing the site for job-related duties. Hypothetical future risks at the site were evaluated based uponthe following exposure scenarios: groundwater ingestion by a hypothetical future adult resident; soilexposure by hypothetical future adult and child residents; and, soil exposure by hypothetical futureconstruction workers. Risks were evaluated based on conservative use of Reasonable Maximum Exposure (RME)assumptions. The exposure assumptions for each pathway are provided in Tables 2-15, 2-16, and 2-17. Based on the exposurepoint concentrations derived from site data for the chemicals shown in Table 2-11 and using the exposureassumptions identified in Tables 2-15, 2-16, and 2-17, USEPA estimated the chronic daily intake (CDI)associated with each exposure pathway and population combination. The formulas used to calculate the CDI foreach pathway are provided in Tables 2-15, 2-16, and 2-17. 2.7.3 Toxicity Assessment The toxicity assessment evaluated possible harmful effects of exposure to each COPC. A number of chemicalsfound at the site, including polycyclic aromatic hydrocarbons (PAHs), arsenic, chromium and lead have thepotential to cause cancer (carcinogenic). Slope factors (SFs) have been developed by USEPAs CarcinogenicAssessment Group for estimating lifetime cancer risks associated with exposure to potentially carcinogeniccompounds. These SFs, which are expressed in units of (mg/kg/day)-1 are multiplied by the estimated CDI of apotential carcinogen to provide an upper bound estimate of the excess lifetime cancer risk associated withexposure at that intake level. The term "upper bound" reflects the conservative estimate of the riskscalculated from the SF. Use of this approach makes underestimation of the actual cancer risk highlyunlikely. Slope factors are derived from results of human epidemiological studies or chronic animalbioassays to which animal-to-human extrapolation and uncertainty factors have been applied. The Ses for thecarcinogenic contaminants of concern are contained in Table 2-18. As an interim procedure until more definitive Agency guidance is established. Region IV has adopted atoxicity equivalency factor (TEF) methodology for evaluating the carcinogenic risk from PAHs. Thismethodology relates the relative potency of each individual carcinogenic PAH to the potency ofbenzo(a)pyrene, the most carcinogenic PAH. The TEFs for the PAHs are also presented in Table 2-18.

TABLE 2-18
ADJUSTED TOXICITY VALUES USED TO ASSESS DERMAL EXPOSURE ATSITE SS-8, MOTOR POOL OIL LEAK AREAHomestead Air Resersve Base, Florida
Oral Toxicity Values Oral Dermal Toxicity Values Absorption (Adjusted Oral) Constituent RfDo Source CSFo Source Efficiency Source Rfda CSFa
BNAs Benzo(a)anthracene 1.0E-02 a 7.3E+00 d 0.90 e 9.0E-03 NAP Benzo(a)pyrene 1.0E-02 a 7.3E+00 c 0.90 e 9.0E-03 NAP Benzo(b)fluoranthene 1.0E-02 a 7.3E+00 d 0.90 e 9.0E-03 NAP Benzo(g,h,i)perylene 3.0E-02 b NA 0.90 e 2.7E-02 NA Benzo(k)fluoranthene 1.0E-02 a 7.3E+00 d 0.90 e 9.0E-03 NAP Chrysene 1.0E-02 a 7.3E+00 d 0.90 e 9.0E-03 NAP Dibenzo(a,h)anthracene 1.0E-02 a 7.3E+00 d 0.90 e 9.0E-03 NAP Fluoranthene 4.0E-02 c NA 0.90 e 3.6E-02 NA Indeno(1,2,3-c,d)pyrene 1.0E-02 a 7.3E+00 d 0.90 e 9.0E-03 NAP Pyrene 3.0E-02 c NA 0.90 e 2.7E-02 NA
METALS Aluminum NA c NA c 0.02 e NA NA Arsenic 3.0E-04 c 1.75E+00 c 0.95 e 2.9E-04 1.8E+00 Barium 7.0E-02 c NA c 0.05 e 3.5E-03 NA Cadmium (food)[b] 1.0E-03 c NAP c 0.06 e 6.0E-05 NA Cadmium (water) 5.0E-04 c NAP c 0.06 e 3.0E-05 NA Calcium NA NA NA NA NA Chromium 5.0E-03 c NAP c 0.05 e 2.5E-04 NA Cobalt NA NA 0.30 e NA NA Copper[c] 3.7E-02 c NA c 0.60 e 2.2E-02 NA Iron NA c NA c 0.15 e NA NA Lead NA c NA c 0.08 e NA NA Manganese 1.0E-01 c NA c 0.05 e 5.0E-03 NA Mercury 3.0E-04 c NA c 0.95 e 2.9E-04 NA Nickel 2.0E-02 NA 0.06 e 1.2E-03 NA Vanadium 7.0E-03 c NA c 0.01 e 7.0E-05 NA
[a] The RfD for food should be used for soil exposure.[b] Based on current drinking water standard.CSFa Adjusted cancer slope factor (mg/kg/day)^-1.CSFo Oral cancer slope factor (mg/kg/day)^-1.NA Not availableNAP Not applicable. Carcinogenic only by inhalation route.RfDa Adjusted reference dose (mg/kg/day).RfDo Oral reference does (mg/kg/day).a Environ, 1986.b Inferred from pyrene.c USEPA Intergrated Risk Information System (1993).d USEPA Region 4 TEF guidance (USEPA, 1982b) BaP (USPA, 1992b) See Table 3-1.

Other COPCs, including other PAHs and metals, may cause health problems other than cancer. Reference doses(RfDs) have been developed by USEPA for indicating the potential for adverse health effects from exposure tocontaminants of concern exhibiting noncarcinogenic effects. RfDs, which are expressed in units of mg/kg/day,are estimates of lifetime daily exposure levels for humans, including sensitive individuals, that arebelieved to be safe by USEPA. RfDs are derived from human epidemiological studies or animal studies to whichuncertainty factors have been applied (e.g., to account for the use of animal data to predict effects onhumans). Estimated intakes of COPCs from contaminated media can be compared to their respective RfDs. TheRfDs for the noncarcinogenic contaminants of concern are also provided in Table 2-18. 2.7.4 Risk Characterization The centerpiece of the BRA is the risk characterization, which combines the other components of theevaluation to estimate the overall risk from exposure to site contamination. In summary, the results of the BRA indicate that human health risks associated with potential futurescenarios at Site SS-8 slightly exceed USEPAs target risk range for protection of human health. 2.7.4.1 Carcinogenic Risk. For cancer-causing compounds, risk is a probability that is expressed inscientific notation. For example an excess lifetime cancer risk of 1x10⁻⁶ means that an individual has anadditional 1 in 1,000,000 chance of developing cancer as a result of site-related exposure over an estimated70 year lifetime. USEPA has established a target risk range for DOD and Superfund cleanups of between 1x10⁻⁴(1 in 10,000) and 1x10⁻⁶. The formula used for calculating cancer risks is shown below: Risk = CDI x SF where: Risk = a unitless probability of an individual developing cancer CDI = chronic daily intake averaged over 70 years (mg/kg/day) SF = slope factor, expressed as (mg/kg/day)-1
Potential current total site risk for an on-site worker (e.g., a mower exposed to soils results in a totalsite excess lifetme cancer risk of 6.1 x 10⁻⁶. The excess lifetime cancer risks for an hypothetical futurecontruction worker were 1.4x10⁻⁵ and 1.8x10⁻⁵ for surface and subsurface soils respectively. The excess lifetime cancer risk for a hypothetical future adult resident exposed to groundwater at the sitewas not calculated because none of the COPCs in groundwater are considered carcinogenic via the ingestionexposure route. The excess lifetime cancer risk for an adult resident exposed to soils at the site is 4.5x10⁻⁵. The excess lifetime cancer risk for an hypothetical future child resident is 1.2x10⁻⁴, slightly abovethe upper end for the risk range deemed protective of human health by the USEPA. 2.7.4.2 Hazards Due to Non-carcinogenic Chemicals. For compounds which cause toxic effects other thancancer, USEPA compared the exposure point conceneration of a contaminant found at the site with a referencedose representing the maximum amount of a chemical a person could be exposed to without experiencing harmfuleffects. The ratio of the average daily intake to the reference dose is called a hazard quotient (HQ). Theformula for calculation the HQ is shown below: Noncancer HQ = CDI/RfD where: GDI = chronic daily intake RfD = reference dose CDI and RfD are expressed in the same units (mg/kg/day) and represent the same exposure period (i.e.,generally chronic, but also subchronic or short-term). The hazard index (HI) can be generated by adding the HQs for all contaminants of concern that affect the sametarget organ (such as the liver) within a medium or across all media to which a given population may

reasonably be exposed. In general, USEPA considers an HI of 1.0 to be the maximum acceptable hazard.
The hazard index for a current base worker is 0.002. The hazard indices for a future construction workerexposed to surface and subsurface soils are above the USEPA risk benchmark, 3 and 4 respectively.
The non-cancer hazard index (HI) for hypothetical future adult resident exposure to groundwater (3.7) isabove the USEPA risk benchmark of 1. Hypothetical future hazards for residents exposed to soils (both anadult and a young child [aged 0 to 6 years 3) are at or below the USEPA risk benchmarks (0.03 and 0.2 for theadult and child respectively). 2.7.4.3 Total Risk. The total site risk for hypothetical future resident exposure is obtained by summingall of the residential exposures considered in the risk assessment groundwater ingestion by an adultresident, soil exposure by child (6 year period) and adult (24 year period) residents. The combined riskacross these on-site exposure media (groundwater and soils) for a hypothetical future resident results in atotal site excess lifetime cancer risk of 1.6x10⁻⁴ and an HI of 3.9. The total hypothetical future site riskfor the construction worker is equivalent to the risk estimates calculated for the future construction workerexposed to surface and subsurface soils for ingestion and inhalation exposure routes. The cancer riskestimates are 3.2x10⁻⁵ and the HI is 7.0 for surface soils and subsurface soils, combined. 2.7.4.4 Risk from Lead Exposure. Based on the Integrated Exposure Uptake/Biokinetic (TEUBK) model for lead,hypothetical future sensitive receptors (children age 0 to 6 years) exposed to soils at Site SS-8 would nothave blood lead levels that exceed 10 micrograms per deciliter (:g/dL) (the blood concentration of concernidentified by the CDC1) assurring exposure to site concentrations of lead in soil and groundwater. 2.7.5 Chemicals of Concern and Remedial Goal Options Chemicals of concern (COCs) contribute significantly to a use scenario for a receptor that (a) exceeds a 10-4total carcinogenic risk; (b) exceeds an HI of 1; or (c) exceeds a state or federal chemical specific ARAR. Chemicals need not be included if their individual carcinogenic risk contribution is less than 1x10⁻⁶ ortheir non-carcinogenic HQ is less than 0.1. The COCs in groundwater at Site SS-8 are chromium and manganese. The COCs in soil are manganese and, to a much lesser extent, PAHs. Remedial Goal Options (RGOs) are risk-based cleanup levels. They are developed by combining the intakelevels to each chemical by a receptor from all appropriate routes of 1 CDC (1991) Preventing Lead Poisoning in Young Children. A statement by the Centers for Disease Control. October 1991. exposure (i.e., inhalation, ingestion and dermal) and pathways within a scenario andrearranging the site-specific CDI equations used in the risk characterization to solve for the concentrationterm. RGOs are devdoped for each medium, each land use, and each receptor type.

TABLE 2-19RISK-BASED REMEDIAL GOAL OPTIONSHYPOTHETICAL FUTURE ADULT RESIDENT ATSITE SS-8, MOTOR POOL OIL LEAK AREAGROUNDWATER (mg/L) SITE SPECIFIC REMEDIAL SITE SPECIFIC REMEDIAL GOAL OPTIONS GOAL OPTIONS EPA Florida HAZARD INDEX CARCINOGENIC RISK Maximum Drinking COMPOUNDS Contaminant Water 0.1 1.0 10.0 1E-06 1E-05 1E-04 Level Standard Chromium 2E-2 2E-1 2E+0 2E-1 2E+0 2E+1 1E-01 0.1 (a) Manganese 2E-2 2E-1 2E+0 NAP NAP NAP NS .050 (b) NAP - Not Applicable. The constiuent is not a carcinogen via oral exposure.NS - No Standard.(a) - Florida Primary Drinking Water Standard (mg/L).(b) - Florida Secondary Drinking Water Standard (mg/L).(c) - Final Action Level - The final lead action level is exceede if the level of lead/copper is more than 10 percent.
TABLE 2-20RISK-BASED SITE SPECIFIC REMEDIAL GOAL OPTIONSAND FDEP SOIL TARGET LEVELSHYPOTHETICAL CURRENT BASE WORKER (MOWING SCENARIO) ATSITE SS-8, MOTOR POOL OIL LEAK AREASOIL (mg/kg) SITE SPECIFIC REMEDIAL FDEP SITE SPECIFIC REMEDIAL FDEP GOAL OPTIONS Soil Target Levels GOAL OPITONS Soil Target Levels HAZARD INDEX Based on a Hazard CARCINOGENIC RISK Based on an Excess COMPOUNDS Index of 1 Cancer Risk of 0.1 1.0 10.0 1E-0C6 1E-05 1E-04 1E-06 Manganese 6E+4 6E+5 6E+6 5E+3 NA NA NA ND NA - Not ApplicableND - Not Determined

TABLE 2-21RISK-BASED SITE SPECIFIC REMEDIAL GOAL OPTIONS AND FDEP SOIL TARGET LEVELSHYPOTHETICAL FUTURE ADULT RESIDENT ATSITE SS-8, MOTOR POOL OIL LEAK AREASOIL (mg/kg) SITE SPECIFIC REMEDIAL FDEP SITE SPECIFIC REMEDIAL FDEP GOAL OPTIONS Soil Target Level GOAL OPTIONS Soil Target Levels HAZARD INDEX Based on a Hazard CARCINOGENIC RISK Based on an Excess COMPOUNDS Index of 1 Cancer Risk of 0.1 1.0 10.0 1E-06 1E-05 1E-04 1E-06 Manganese 5E+3 5E+4 5E+5 2E+3 NA NA NA ND NA - Not ApplicableND - Not Determined
TABLE 2-22RISK-BASED SITE SPECIFIC REMEDIAL GOAL OPTIONS AND FDEP SOIL TARGET LEVELSHYPOTHETICAL FUTURE CHILD RESIDENT ATSITE SS-8, MOTOR POOL OIL LEAK AREASOIL (mg/kg) SITE SPECIFIC REMEDIAL FDEP SITE SPECIFIC REMEDIAL FDEP GOAL OPTIONS Soil Target Levels GOAL OPTIONS Soil Target Levels HAZARD INDEX Based on a Hazard CARCINOGENIC RISK Based on an Excess COMPOUNDS Index of 1 Cancer Risk of 0.1 1.0 10.0 1E-06 1E.05 1E-04 1E-06 Semi-Voiatiles Benzo(a)anthracene(1) 7E+1 7E+2 7E+3 ND 4E-2 4E-1 1E+1 1E+0 Benzo(a)pyrene 7E+1 7E+2 7E+3 ND 1E-1 1E+0 1E+1 1E-1 Benzo(b)fluoranthene(1) 7E+1 7E+2 7E+3 ND 4E-2 4E-2 4E+0 1E+0 Benzo(g,h,i)perylene 2E+2 2E+3 2E+4 2E+3 NA NA NA ND Benzo(k)fluoranthene(1) 7E+1 7E+2 7E+3 ND 4E-2 4E-1 4E+0 1E+0 Chrysene(1)7E+I 7E+2 7E+3 7E+3 ND 6E-3 6E-2 6E-1 1E+1 Dibenzo(a,h)anthracene(1) 7E+1 7E+2 7E+3 ND 1E+1 1E+0 1E+1 1E-1 Fluoranthene 3E+2 3E+3 3E+4 3E+3 NA NA NA ND Indeno(1,2,3-c,d)pyrene(1) 7E+1 7E+2 7E+3 ND 4E-1 4E-1 4E+0 1E+0 Pyrene 2E+2 2E+3 2E+4 2E+3 NA NA NA ND Manganese 7E+2 7E+3 7E+4 4E+2 NA NA NA ND (1) - Toxicity Equivalent Factors (TEFs) have been applied to constituent concentrations based on each compound relative potency to the potency of benzo(a)pyrene (oral and inhalationexposure only) for the carcinogenic risk only.NA - Not Applicable

TABLE 2-23RISK-BASED SITE SPECIFIC REMEDIAL GOAL OPTIONSAND FDEP SOIL TARGET LEVELSHYPOTHETICAL FUTURE CONSTRUCTION WORKER ATSITE SS-8, MOTOR POOL OIL LEAK AREASURFACE SOIL (mg/kg) SITE SPECIFIC REMEDIAL FDEP SITE SPECIFIC REMEDIAL FDEP GOAL OPTIONS Soil Target Levels GOAL OPTIONS Soil Target Levels HAZARD INDEX Based on a Hazard CARCINOGENIC RISK Based on an Excess COMPOUNDS Index of 1 Cancer Risk of 0.1 1.0 10.0 1E-06 1E-05 1E-04 1E-06 Manganese 1E+0 1E+1 1E+2 5E+3 NA NA NA ND NA - Not ApplicableND - Not Determined
TABLE 2-24RISK-BASED SITE SPECIFIC REMEDIAL GOAL OPTIONSAND FDEP SOIL TARGET LEVELSHYPOTHETICAL FUTURE CONSTRUCTON WORKER ATSITE SS-8, MOTOR POOL OIL LEAK AREASUBSURFACE SOIL (mg/kg) SITE SPECIFIC REMEDIAL FDEP SITE SPECIFIC REMEDIAL FDEP GOAL OPTIONS Soil Target Level GOAL OPTIONS Soil Target Levels HAZARD INDEX Based on a Hazard CARCINOGENIC RISK Based on an Excess COMPOUNDS Index of 1 Cancer Risk of 0.1 1.0 10.0 1E-06 1E-05 1E-04 1E-06 Manganese 1E+0 1E+1 1E+2 5E+3 NA NA NA ND NA - Not ApplicableND - Not DeterminedNP - Not Provided

The RGO are presented here in tabular form and include cleanup levels for the 104, and 10-5, and 10-6 risklevels for each COC medium and scenario and the HQs of 0.1, 1, and 10 levels, as well as anychemical-specific ARARs. A sumary of the risk based RGOs are presented in Tables 2-19 through 2-24. 2.7.6 Ecological Risk Assessment Because of the developed character of this site, it does not provide suitable habitat for wildlife; thus,plants and animals are not likely to contact chemicals present at Site SS-8. Site canals are to be morefully addressed in the OU-9 site-wide canal assessment. 2.8 - UNCERTAINTIES IN THE RISK ASSESSMENT The factors that contribute uncertainty to the estimates of exposure concentrations, daily intakes, andtoxicity information also contribute uncertainty to the estimates of risk. These factors include: ! Chemicals not included in the risk assessment; ! Exposure pathways not considered; ! Derivation of exposure point concentrations; ! Intake uncertainty; and ! Toxicological dose response and toxicity values. There are uncertainties associated with summing cancer risks or hazard indices for different chemicals. Thecumulative dose ignores possible synergism of antagonism among chemicals and differences in mechanisms ofaction and metabolism. In addition, the assumption was made that all chromium present was in the more toxic hexavalent form. Generally, the trivalent form is predominant.
Lead exposure was evaluated with a model that predicts blood levels based on levels measured in environmentalmedia. Another uncertainty is the faithfulness of this model in reproducing the actual blood levels. Although any pharmacokinetic model is subject to uncertainties, the predicted blood lead level in children(indicating that lead is not a COC) are believed to be a reasonable estimate. 2.9 DESCRIPTION OF THE ALTERNATIVE An FS was conducted to develop and evaluate remedial alternatives for OU-4 at Homestead ARB. The followingdiscussion presents a brief description of the alternatives considered in the FS for the Motor Pool Oil LeakArea. The alternatives are numbered to correspond to the numbers in the FS report, which presents eachalternative in more detail. 2.9.1 Alternative Number 1 - No Action With Groundwater Monitoring 2.9.1.1 Description. The no action alternative provides a baseline case for comparison with otheralternatives. This alternative includes semi-annual sampling of the site's monitoring wells for two years. The samples would be analyzed for BNAs and metals. The groundwater monitoring program would be used tomonitor the validity of the sampling and analysis events of years 1991 and 1993. Per CERCLA, site reviewswould be conducted as part of this alternative as COCs exceeding USEPA target risk ranges would remainon-site. There are no chemical-, location-, or action-specific ARARs for soil at Site SS-8. The State of Florida hasdeveloped health-based cleanup goals which are TBCs for the site. The COCs present at Site SS-8 under themost likely scenario (construction worker) do not exceed the State of Florida goals.

The No Action alternative does not provide control measures to prevent access to the contamination. Undercurrent land use conditions, this alternative does not pose an unacceptable cancer and non cancer risk. However, if the future risk scenario of an on-site construction worker or the unlikely scenario of a futurechild resident were to occur, risks would exceed USEPA risk ranges and the no action alternative would not beprotective of human health. If the asphalt pavement at Site SS-8 were removed, exposure to fugitive dustwould be the largest contributor to the total site health risks. Assuming that the asphalt cap ramains inplace and that construction toes not occur at the site, the No Action Alternative is protective of humanhealth. The estimated cost in present worth for this alternative is $65,000 2.9.2 Alternative Number 2 - Institutional Controls and Groundwater Monitoring This alternative includes access restrictions that would limit entry to the site by unauthorized basepersonnel. This alternative includes fencing the site and posting signs indicating access to the site islimited to authorized personnel. In addition, a periodic monitoring of the asphalt cap would be undertakenand made available to regulatory agencies. Deed restrictions would be established to limit the use of theproperty to non-residential dwelling purposes. Deed restrictions would also be established to preventschool, playgrounds, hospitals, and residential areas from being built at the site. Restrictions would alsobe established (by deed and/or construction bid documents) to limit any construction activity to only thoseactivities where workers are appropriately protected (e.g., personal protective equipment) from exposure toany COCs above health-base levels. Restrictions would be established (by deed and/or construction biddocuments) to ensure that any construction activities would utilized erosion and dust control as well as slitcontrol measures to protect the drainage canal system adjacent to Site SS-8.
This alternative includes semi annual sampling of the site's monitoring wells for two years to monitor thevalidity of previous sampling events. The samples would be analyzed for the BNAs and metals. Thegroundwater monitoring program would be used to monitor the validity of the sampling and analysis of year1991 and 1993. Applicable performance standards and guidance for monitoring of the groundwater at Site SS-8include Federal and State groundwater MCLs. No groundwater access restrictions are contemplated because thetwo sampling events of 1991 and 1993 indicated that groundwater has not been adversely impacted with respectto Federal and State groundwater standards and/or guidance. Site reviews every five years would be conductedas part of this alternative, as per CERCLA guidance. Presently, current land use conditions do not pose anyrisks to human health. Under the potential scenario of a construction worker at the site, Alternative 2protects human health through environmental control measures described above. The control measures alsowould prohibit the use of residential development, and thereby, protects human health.
Because of the developed character of this site (paved surface) there would be no adverse impacts to theenvironment under Alternative 2. In the event of construction or redevelopment, the use of environmental andpersonal control measures will protect human health. Construction controls will ensure the adjacent drainagecanal is protected.
The estimated cost fo implementation of this alternative is $ 85,000 in present worth.
2.9.3 Alternative Number 3 - Soil Excavation and Disposal with Groundwater
With this alternative, the contaminated soild would be excavated to water table (2-3 ft bls) and disposed. The areal extent of the contiminated soil is assumed to be the total areal extent of the soil under theasphalt pavement. Assuming the soil would be excavated to the water table, the total volume of soil to beexcavated and disposed is approximately 2,700 cubic yards. Field screening supported by laboratory analysiswill be conducted to verify that "clean" soil is encountered after soil is excavated. Where warranted,excavation activities would implement erosion control and silt control measures to protect the drainage/canalsystem adjacent to the site. Before the disposal facility will accept the waste, toxicity characteristics leaching procedure (TCLP)analysis must be performed. It is expected and assumed for this analysis that the waste will pass TCLP anddisposal will occur in Class III landfill. In the unlikely scenario that the waste is indicated by TCLP to

be hazardous, then disposal of the waste would occur in a RCRA, Subtitie C, TSD facility. Under this alternative, post-removal groundwater sampling will also be performed to evaluate groundwaterconditions. This alternative protects human health by removing all COCs from the Site SS-8. Thisalternative meets the cleanup goals for the site, for both the current and future land use conditions. Ifwarranted, erosion control and silt control measures will be implemented during the excavation of Site SS-8. Alternative 3 is therefore protective of the environment as well as human health. This alternative also reduces potential mobility and volume of constituents at the site through theircomplete removal. Alternative 3 is expected to take one to two years to implement and complete at a cost of $1,238,000including post removal sampling.

TABLE 2-25 IDENTIFICATION OF ALTERNATIVESSITE SS-8 Remedial technologies are assembled into alternatives in this section and table, and enable the review of the Focused Feasibility Study (FFS). A limited number of alternatives aredeveloped and all are carried into the detailed analysis. Three remedial alternatives were developed for Site SS-8 as follows: Alternative No Access Deed Groundwater Soil Action Restrictions Restrictions Monitoring Excavation 1 No Action X X 2 Institutional Controls & Groundwater Monitoring X X X 3 Soil Excavation/Disposal X X Source:Homestead Air Force Base, FloridaFocused Feasibility StudyOperable Unit 4, Motor PoolOil Leak (Site SS-8)

TABLE 2-26 COMPARATIVE COST ANALYSIS OF REMEDIAL ALTERNATIVESSITE SS-8 Alternative # Title Capital Expense Annual O&M Expense Total Present Cost/Alternative Notes: 1 No Action $17,000 $48,000 $65,000 See #1 2 Institutional Control & $31,000 $54,000 $85,000 See #2 Groundwater Monitoring 3 Excavation & $1,052,000 $186,000 $1,238,000 See #3 Soil Disposal Notes: 1. No Action Capital Expenses incorporate administrative and legal costs associated with curtailing re-use of property other then by current owner, and establish record of controlled ownership by the US Air Force to ensure no disruption of soil sedimentations. O&M annual expenses are the Operating and Maintenan costs associated with the sampling of groundwater for 2 years. 2. Institutional Control & Groundwater Monitoring capital expenses involve the installation of site perimeter fencing and signage to ensure no access to the property title shall remain under controlled ownership by the US Air Force. O&M annual expenses are the Operating and Maintenance costs associated with sampling events for 2 years. 3. Excavation & Soil Disposal capital costs are the removal of costs for the removal of costs for an approximate quantity of 2,700 cubic yards of contaminated soils to an offsite area. O&M costs are associated with confirmatory samples taken during the year. 4. Detailed cost estimates of the above alternatives are currently on file at Homestead Air Reserve Base, Florida and may be duplicated from the RACER II estimating system onto diskettes for public review. Source: Homestead Air Force Base, Florida Focused Feasibility Study Operab1e Unit 4, Motor Pool Oil Leak (Site SS-8)

TABLE 2-27 COMPARATIVE ANALYSIS OF REMEDIAL ALTERNATIVES, SITE SS-8 REMEDIAL ACTION Evaluation Criteria No Action Institutional Controls & Groundwater Monitoring Excavation & Disposal Overall Protection of Human Health & Environment X O O Compliance w/ARAS O O O Long Term Effectiveness and Performance X O O Reduction of Toxicity, Mobility, or Volume X X O Short Term Effectiveness * * O Implementability Easy Easy Moderate Estimated Present Worth 65,000 85,000 1,238,000 O Meets CriteriaX Does Not Meet Criteria* No Remedial Activity/Therfore No Effects From ImplementationSource:Homestead Air Force Base, FloridaFocused Feasibility StudyOperable Unit 4, Motor PoolOil Leak (Siti SS-8)

2.10 SUMMARY OF COMPARATIVE ANALYSIS OF ALTERNATIVES An evaluation and comparison of the alternatives are presented in Tables 2-25, 2-26, and 2-27. Thecomparison is based on the nine key criteria required under the National Contingency Plan and CERCLA Section121 for use in evaluation of remedial alternatives by USEPA. The nine criteria are as follows: ! Overall protection of human health and the environment. ! Compliance with Applicable or Relevant and Appropriate Requirements. ! Long-term effectiveness and permanence. ! Reduction of toxicity, mobility, or volume. ! Short-term effectiveness. ! Implementability. ! Cost. ! State acceptance. ! Community acceptance. 2.10.1 Overall Protection of Human Health and Environment Alternatives 2 and 3 meet Remedial Action Objectives for the site and provide protection of human health andthe environment. Alternative 3 provides the best protection through excavation of the site. WhileAlternative 2 does not satisfy the statutory preference for treatment, this alternative effectively protectshuman health and the environment through the utilization of institutional controls that would limit exposureto site contaminants. Alternative 1 would have no treatment or monitoring mechanism and, therefore, wouldnot be protective of human health and the environment. 2.10.2 Compliance with Federal/State Standards There are no ARARs that apply for Site SS-8. State of Florida soil cleanup goals would be met for allalternatives. No state or federal MCL is exceeded for any of the COCs for OU-4, Site SS-8. 2.10.3 Long-term Effectiveness and Permanence Alternative 3 provides the best long-term effectiveness and permanence for Site SS-8. Although Alternative 2allows for hazardous substances to remain on site, it utilizes institutional controls, which are adequate,reliable and effective to manage untreated hazardous substances in a safe manner. In addition, institutionalcontrols would need to be evaluated during the five-year review. Alternative 1 does not change theconditions of the Site; therefore, any contaminants remaining at the site would not be expected to decreaseover time. 2.10.4 Treatment to Reduce Toxicity, Mobility or Volume None of the alternatives would provide treatment of the COCs at the Site. Alternative 3 would reduce themobility of the contaminants through excavation of the contaminants from the Site and disposal in anengineered landfill. Alternative 1 and 2 would not provide any additional reduction in toxicity, mobility orvolume of the contaminants. Under Alternatives 1 and 2 site contaminants are nearly immobile due to theasphalt covering the site. 2.10.5 Short-term Effectiveness

Alternative 3 is expected to be completed within one to two years. The excavation of soil may impose risksby disturbing the remaining contamination, however, it would not be expected to pose unacceptable short-termenvironmental or health hazards, which could not be controlled. Under Alternatives 1 and 2, there is noconstruction activities against which short term effectiveness may be evaluated. Alternative 2 would deem tobe protective as soon as the institutional controls are in place and in effect. Most likely, theinstitutional controls should be in place within 12 months from the selection of the remedy. 2.10.6 Implementability Alternative 1 and 2 would be easy to implement. The ease to implement Alternative 3 would be moderate. 2.10.7 Cost The "no action" alternative is the least expensive option, but it is not protective under potential futurescenarios of an on-site construction worker or a child resident. Alternative 2 is also minimal in expenseand is protective. Alternative 3 would attain the fullest protection but at high cost relative toAlternatives 1 and 2.
2.11 SELECTED REMEDY Based upon consideration of the requirements of CERCLA, the detailed evaluation of the alternatives andpublic comments, the U.S. Air Force and concurrence with the USEPA and the State of Florida has determinedthat Institutional Controls and Groundwater Monitoring is the most appropriate course of action at Site SS-8. The primary media of concern at Site SS-8 is soil/bedrock. The site is currently covered by asphaltproviding an in situ barrier to surficial contact. The implementation of institutional controls will includedeed restrictions and covenants on future use and activities at the site to minimize exposure by constructionworkers. Requirements for use of appropriate personal protective equipment with implementation of a sitehealth and safety plan during any construction activities will protect workers at the site. Deedrestrictions would also establish erosion and silt control measures for use as warranted to protect the areadrainage canal system. These deed restrictions would also prevent residential use and construction of schools, playgrounds orhospitals at Site SS-8. A fence would be installed surrounding Site SS-8 to minimized unauthorized or inadvertent access to the site. The estimated cost of fence installation is $31,000. This is the only capital expenditure to be incurred. This site is also to remain under Air Force jurisdiction within the Cantonment Area Annual, O&M costs include the groundwater monitoring which is scheduled semi-annually for 2 years. Thisannual cost is estimated at $54,000. In accordance with CERCLA requirements for sites where contaminants remain in place above USEPA TargetLevels, five year reviews of the site will be performed. 2.12 STATUTORY DETERMINATIONS The selected remedy is protective of human health and the environment as required by Section 121 of CERCLA. Existing or potential risks from exposure to soils are reduced and controlled through institutional controls. There are no chemical-, location-, or anction-specific ARARs that apply for soil at Site SS-8. State ofFlorida soil cleanup goals would be met for the one chemical of concern (manganese) under the constructionworker scenario. The selected remedy is cost effective because it has been determined to provide overall effectivenessproportioned to its costs, the present net worth is estimated at $85,000.

Neither Permanent Solutions nor alternative treatments were employed at this site due to the minimal risksassociated with the COCs present and the unlikely scenario of residential development as well as associatedcosts for removal of site contaminants. The statutory preference for treatment as a Principal Element is notmet. However, Site contaminants are currently nearly immobile due to the presence of an asphalt covering. 2.13 DOCUMENTATION OF SIGNIFICANT CHANGES The PP was released for public comment in September 1994. The PP identified Alternative 2, InstitutionalControls and Groundwater Monitoring, as the preferred alternative for remedial action at Site SS-8, OU-4.
Homestead Air Reserve Base, FloridaOperable Unit 4Site SS-8, Motor Pool Oil Leak Area Responsiveness Summary for TheRecord of Decision

RESPONSIVENESS SUMMARYFOR THERECORD OF DECISION The responsiveness summary serves three purposes. First, it provides regulators with information about thecommunity preferences regarding both the remedial alternatives and general concerns about OU-4, HomesteadARB. Second, the responsiveness summary documents how public comments have been considered and integratedinto the decision making process. Third, it provides USEPA with the opportunity to respond to each commentsubmitted by the public on the record. The Remedial Investigation/Baseline Risk Assessment report and the Proposed Plan for Homestead ARB Site SS-8were released to the public in June and September of 1994, respectively. These documents were made availableto the public in both the administrative record and an information repository maintained at the Miami-DadeCommunity College Library. A public comment period was held from September 8,1994 to October 22, 1994 as part of the community relationsplan for OU-4. Additionally, a public meeting was held on Thursday, September 29, 1994 at 7:00 pm at SouthDade High School. A public notice was published in the Miami Herald on September 9, 1994. At this meeting,the USAF, in coordination with USEPA Region IV, FDEP, and DERM were prepared to discuss the investigation,results of the Baseline Risk Assessment, and the Preferred Alternative described in the Proposed Plan. No comments were received during the public comment period and no comments were made at the public meetingregarding the implementation of Institutional Controls and Groundwater Monitoring.


